C-Reactive Protein as Predictive Biomarker for Response to Chemoradiotherapy in Patients with Locally Advanced Rectal Cancer: A Retrospective Study

 ,
,  , , ,
, , ,
Abstract
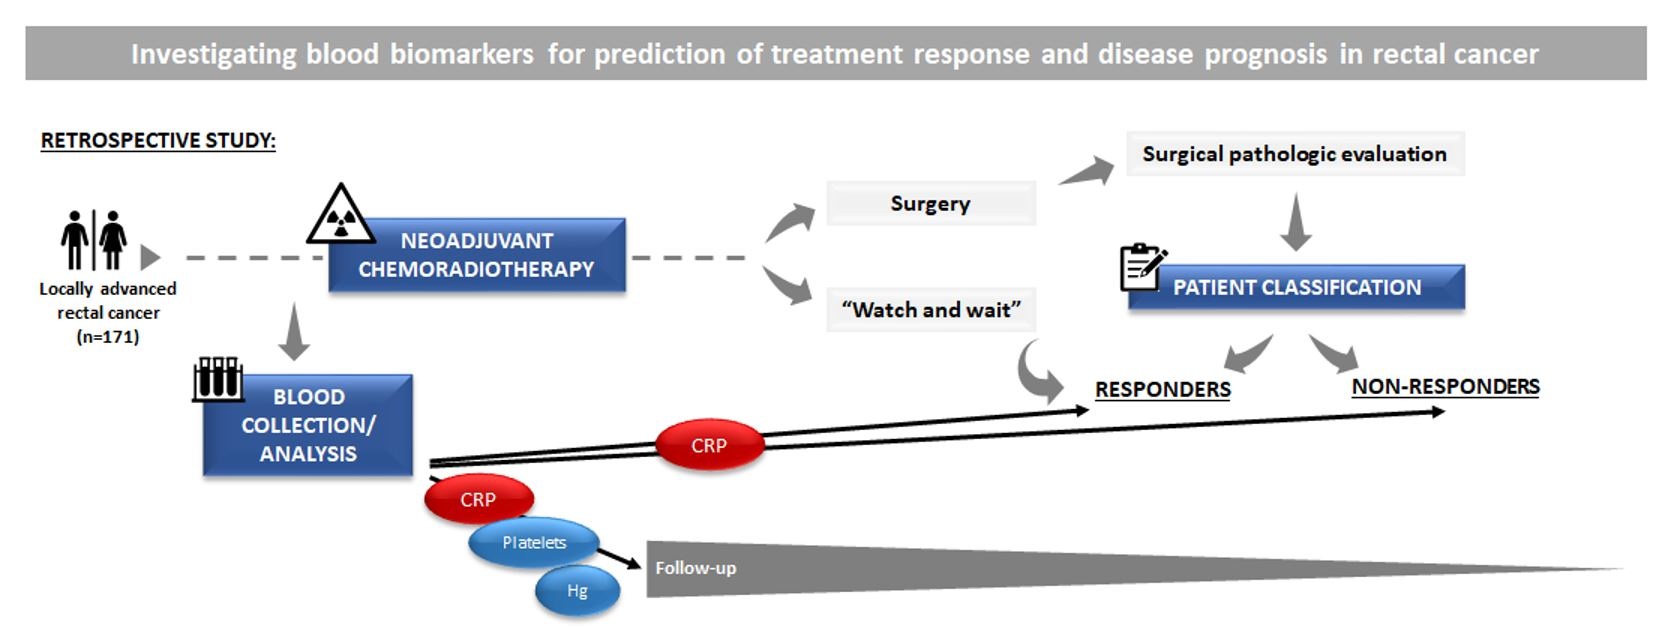
:Simple Summary
Abstract

1. Introduction
2. Materials and Methods
2.1. Patients
2.2. Chemoradiotherapy
2.3. Treatment Response
2.4. Clinical End Points
2.5. Statistical Analysis
3. Results
3.1. Clinicopathologic Characteristics
3.2. Relationships between Pretreatment Clinicopathologic Factors and Response to Treatment
3.3. Relationships between Pretreatment Clinicopathologic Factors and Prognosis
4. Discussion
5. Conclusions
Supplementary Materials
Author Contributions
Funding
Institutional Review Board Statement
Informed Consent Statement
Data Availability Statement
Acknowledgments
Conflicts of Interest
References
- Rawla, P.; Sunkara, T.; Barsouk, A. Epidemiology of colorectal cancer: Incidence, mortality, survival, and risk factors. Prz. Gastroenterol. 2019, 14, 89–103. [Google Scholar] [CrossRef]
- Halperin, E.; Wazer, D.; Perez, C.; Brady, L. Perez and Brady’s Principles and Practice of Radiation Oncology, 7th ed.; Kluwer, W., Ed.; Library of Congress Cataloging-in-Publication Data: Philadelphia, PA, USA, 2019; pp. 4613–4679. [Google Scholar]
- Feeney, G.; Sehgal, R.; Sheehan, M.; Hogan, A.; Regan, M.; Joyce, M.; Kerin, M. Neoadjuvant radiotherapy for rectal cancer management. World. J. Gastroenterol. 2019, 25, 4850–4869. [Google Scholar] [CrossRef]
- Rectal Cancer (Version 2.2021). Available online: https://www.nccn.org/professionals/physician_gls/pdf/rectal.pdf (accessed on 29 December 2021).
- Glynne-Jones, R.; Wyrwicz, L.; Tiret, E.; Brown, G.; Rödel, C.; Cervantes, A.; Arnold, D.; Committee, E.G. Rectal cancer: ESMO Clinical Practice Guidelines for diagnosis, treatment and follow-up. Ann. Oncol. 2017, 28, iv22–iv40. [Google Scholar] [CrossRef] [PubMed]
- Kim, N.K.; Hur, H. New Perspectives on Predictive Biomarkers of Tumor Response and Their Clinical Application in Preoperative Chemoradiation Therapy for Rectal Cancer. Yonsei Med. J. 2015, 56, 1461–1477. [Google Scholar] [CrossRef] [PubMed] [Green Version]
- de Jong, E.A.; ten Berge, J.C.; Dwarkasing, R.S.; Rijkers, A.P.; van Eijck, C.H. The accuracy of MRI, endorectal ultrasonography, and computed tomography in predicting the response of locally advanced rectal cancer after preoperative therapy: A metaanalysis. Surgery 2016, 159, 688–699. [Google Scholar] [CrossRef]
- Memon, S.; Lynch, A.C.; Bressel, M.; Wise, A.G.; Heriot, A.G. Systematic review and meta-analysis of the accuracy of MRI and endorectal ultrasound in the restaging and response assessment of rectal cancer following neoadjuvant therapy. Colorectal Dis. 2015, 17, 748–761. [Google Scholar] [CrossRef]
- van der Paardt, M.P.; Zagers, M.B.; Beets-Tan, R.G.; Stoker, J.; Bipat, S. Patients who undergo preoperative chemoradiotherapy for locally advanced rectal cancer restaged by using diagnostic MR imaging: A systematic review and meta-analysis. Radiology 2013, 269, 101–112. [Google Scholar] [CrossRef] [PubMed]
- Zhao, R.S.; Wang, H.; Zhou, Z.Y.; Zhou, Q.; Mulholland, M.W. Restaging of locally advanced rectal cancer with magnetic resonance imaging and endoluminal ultrasound after preoperative chemoradiotherapy: A systemic review and meta-analysis. Dis. Colon Rectum 2014, 57, 388–395. [Google Scholar] [CrossRef]
- Ryan, R.; Gibbons, D.; Hyland, J.M.; Treanor, D.; White, A.; Mulcahy, H.E.; O’Donoghue, D.P.; Moriarty, M.; Fennelly, D.; Sheahan, K. Pathological response following long-course neoadjuvant chemoradiotherapy for locally advanced rectal cancer. Histopathology 2005, 47, 141–146. [Google Scholar] [CrossRef] [PubMed]
- Dossa, F.; Chesney, T.R.; Acuna, S.A.; Baxter, N.N. A watch-and-wait approach for locally advanced rectal cancer after a clinical complete response following neoadjuvant chemoradiation: A systematic review and meta-analysis. Lancet Gastroenterol. Hepatol. 2017, 2, 501–513. [Google Scholar] [CrossRef]
- Habr-Gama, A.; Sabbaga, J.; Gama-Rodrigues, J.; São Julião, G.P.; Proscurshim, I.; Bailão Aguilar, P.; Nadalin, W.; Perez, R.O. Watch and wait approach following extended neoadjuvant chemoradiation for distal rectal cancer: Are we getting closer to anal cancer management? Dis. Colon Rectum 2013, 56, 1109–1117. [Google Scholar] [CrossRef] [PubMed]
- Sanghera, P.; Wong, D.W.; McConkey, C.C.; Geh, J.I.; Hartley, A. Chemoradiotherapy for rectal cancer: An updated analysis of factors affecting pathological response. Clin. Oncol. R. Coll. Radiol. 2008, 20, 176–183. [Google Scholar] [CrossRef] [PubMed]
- Dayde, D.; Tanaka, I.; Jain, R.; Tai, M.C.; Taguchi, A. Predictive and Prognostic Molecular Biomarkers for Response to Neoadjuvant Chemoradiation in Rectal Cancer. Int. J. Mol. Sci. 2017, 18, 573. [Google Scholar] [CrossRef]
- Wang, J.; Long, Y.; Liu, K.; Pei, Q.; Zhu, H. Comparing neoadjuvant long-course chemoradiotherapy with short-course radiotherapy in rectal cancer. BMC Gastroenterol. 2021, 21, 277. [Google Scholar] [CrossRef]
- Aghili, M.; Khalili, N.; Babaei, M.; Farhan, F.; Haddad, P.; Salarvand, S.; Keshvari, A.; Fazeli, M.S.; Mohammadi, N.; Ghalehtaki, R. Short-course versus long-course neoadjuvant chemoradiotherapy in patients with rectal cancer: Preliminary results of a randomized controlled trial. Radiat. Oncol. J. 2020, 38, 119–128. [Google Scholar] [CrossRef]
- Tan, Y.; Fu, D.; Li, D.; Kong, X.; Jiang, K.; Chen, L.; Yuan, Y.; Ding, K. Predictors and Risk Factors of Pathologic Complete Response Following Neoadjuvant Chemoradiotherapy for Rectal Cancer: A Population-Based Analysis. Front. Oncol. 2019, 9, 497. [Google Scholar] [CrossRef] [PubMed]
- Walker, A.S.; Zwintscher, N.P.; Johnson, E.K.; Maykel, J.A.; Stojadinovic, A.; Nissan, A.; Avital, I.; Brücher, B.L.; Steele, S.R. Future directions for monitoring treatment response in colorectal cancer. J. Cancer 2014, 5, 44–57. [Google Scholar] [CrossRef] [PubMed] [Green Version]
- Duffy, M.J.; Lamerz, R.; Haglund, C.; Nicolini, A.; Kalousová, M.; Holubec, L.; Sturgeon, C. Tumor markers in colorectal cancer, gastric cancer and gastrointestinal stromal cancers: European group on tumor markers 2014 guidelines update. Int. J. Cancer 2014, 134, 2513–2522. [Google Scholar] [CrossRef]
- Locker, G.Y.; Hamilton, S.; Harris, J.; Jessup, J.M.; Kemeny, N.; Macdonald, J.S.; Somerfield, M.R.; Hayes, D.F.; Bast, R.C.; ASCO. ASCO 2006 update of recommendations for the use of tumor markers in gastrointestinal cancer. J. Clin. Oncol. 2006, 24, 5313–5327. [Google Scholar] [CrossRef] [PubMed]
- Colorectal Cancer: Diagnosis and Management. Nice Clinical Guideline 151. 2020. Available online: https://www.nice.org.uk/guidance/ng151 (accessed on 19 December 2021).
- Gago, T.; Caldeira, P.; Cunha, A.C.; Campelo, P.; Guerreiro, H. Can we optimize CEA as a response marker in rectal cancer? Rev. Esp. Enferm. Dig. 2021, 113, 423–428. [Google Scholar] [CrossRef]
- Björkman, K.; Jalkanen, S.; Salmi, M.; Mustonen, H.; Kaprio, T.; Kekki, H.; Pettersson, K.; Böckelman, C.; Haglund, C. A prognostic model for colorectal cancer based on CEA and a 48-multiplex serum biomarker panel. Sci. Rep. 2021, 11, 4287. [Google Scholar] [CrossRef] [PubMed]
- Lakemeyer, L.; Sander, S.; Wittau, M.; Henne-Bruns, D.; Kornmann, M.; Lemke, J. Diagnostic and Prognostic Value of CEA and CA19-9 in Colorectal Cancer. Diseases 2021, 9, 21. [Google Scholar] [CrossRef]
- Nicholson, B.D.; Shinkins, B.; Pathiraja, I.; Roberts, N.W.; James, T.J.; Mallett, S.; Perera, R.; Primrose, J.N.; Mant, D. Blood CEA levels for detecting recurrent colorectal cancer. Cochrane Database Syst. Rev. 2015, 2015, CD011134. [Google Scholar] [CrossRef] [PubMed] [Green Version]
- Zheng, Z.; Wang, X.; Lu, X.; Huang, Y.; Chi, P. Prognostic significance of carcinoembryonic antigen combined with carbohydrate antigen 19-9 following neoadjuvant chemoradiotherapy in patients with locally advanced rectal cancer. Colorectal. Dis. 2021, 23, 2320–2330. [Google Scholar] [CrossRef] [PubMed]
- McGrane, J.M.; Humes, D.J.; Acheson, A.G.; Minear, F.; Wheeler, J.M.D.; Walter, C.J. Significance of Anemia in Outcomes After Neoadjuvant Chemoradiotherapy for Locally Advanced Rectal Cancer. Clin. Colorectal. Cancer 2017, 16, 381–385. [Google Scholar] [CrossRef] [PubMed]
- Kawai, K.; Kitayama, J.; Tsuno, N.H.; Sunami, E.; Watanabe, T. Thrombocytosis before pre-operative chemoradiotherapy predicts poor response and shorter local recurrence-free survival in rectal cancer. Int. J. Colorectal. Dis. 2013, 28, 527–535. [Google Scholar] [CrossRef] [PubMed]
- Colotta, F.; Allavena, P.; Sica, A.; Garlanda, C.; Mantovani, A. Cancer-related inflammation, the seventh hallmark of cancer: Links to genetic instability. Carcinogenesis 2009, 30, 1073–1081. [Google Scholar] [CrossRef] [PubMed] [Green Version]
- Braun, L.H.; Baumann, D.; Zwirner, K.; Eipper, E.; Hauth, F.; Peter, A.; Zips, D.; Gani, C. Neutrophil-to-lymphocyte ratio in rectal cancer-novel biomarker of tumor immunogenicity during radiotherapy or confounding variable? Int. J. Mol. Sci. 2019, 20, 2448. [Google Scholar] [CrossRef] [PubMed] [Green Version]
- Vallard, A.; Garcia, M.A.; Diao, P.; Espenel, S.; de Laroche, G.; Guy, J.B.; Mrad, M.B.; Rancoule, C.; Kaczmarek, D.; Muron, T.; et al. Outcomes prediction in pre-operative radiotherapy locally advanced rectal cancer: Leucocyte assessment as immune biomarker. Oncotarget 2018, 9, 22368–22382. [Google Scholar] [CrossRef] [PubMed] [Green Version]
- Wang, Y.; Chen, L.; Zhang, B.; Song, W.; Zhou, G.; Xie, L.; Yu, D. Pretreatment inflammatory-nutritional biomarkers predict responses to neoadjuvant chemoradiotherapy and survival in locally advanced rectal cancer. Front. Oncol. 2021, 11, 639909. [Google Scholar] [CrossRef]
- D’Angelo, E.; Fassan, M.; Maretto, I.; Pucciarelli, S.; Zanon, C.; Digito, M.; Rugge, M.; Nitti, D.; Agostini, M. Serum miR-125b is a non-invasive predictive biomarker of the pre-operative chemoradiotherapy responsiveness in patients with rectal adenocarcinoma. Oncotarget 2016, 7, 28647–28657. [Google Scholar] [CrossRef] [PubMed]
- Yu, J.; Li, N.; Wang, X.; Ren, H.; Wang, W.; Wang, S.; Song, Y.; Liu, Y.; Li, Y.; Zhou, X.; et al. Circulating serum microRNA-345 correlates with unfavorable pathological response to preoperative chemoradiotherapy in locally advanced rectal cancer. Oncotarget 2016, 7, 64233–64243. [Google Scholar] [CrossRef] [PubMed] [Green Version]
- Debucquoy, A.; Goethals, L.; Geboes, K.; Roels, S.; Mc Bride, W.H.; Haustermans, K. Molecular responses of rectal cancer to preoperative chemoradiation. Radiother. Oncol. 2006, 80, 172–177. [Google Scholar] [CrossRef] [PubMed]
- Valentini, V.; Gambacorta, M.A.; Barbaro, B.; Chiloiro, G.; Coco, C.; Das, P.; Fanfani, F.; Joye, I.; Kachnic, L.; Maingon, P.; et al. International consensus guidelines on Clinical Target Volume delineation in rectal cancer. Radiother. Oncol. 2016, 120, 195–201. [Google Scholar] [CrossRef] [PubMed] [Green Version]
- Myerson, R.J.; Garofalo, M.C.; El Naqa, I.; Abrams, R.A.; Apte, A.; Bosch, W.R.; Das, P.; Gunderson, L.L.; Hong, T.S.; Kim, J.J.; et al. Elective clinical target volumes for conformal therapy in anorectal cancer: A radiation therapy oncology group consensus panel contouring atlas. Int. J. Radiat. Oncol. Biol. Phys. 2009, 74, 824–830. [Google Scholar] [CrossRef] [Green Version]
- R Core Team. A Language and Environment for Statistical Computing, version 4.0.5.; R Foundation for Statistical Computing: Vienna, Austria, 2021; Available online: https://www.R-project.org/ (accessed on 19 December 2021).
- DeLong, E.R.; DeLong, D.M.; Clarke-Pearson, D.L. Comparing the areas under two or more correlated receiver operating characteristic curves: A nonparametric approach. Biometrics 1988, 44, 837–845. [Google Scholar] [CrossRef] [PubMed]
- Youden, W.J. Index for rating diagnostic tests. Cancer 1950, 3, 32–35. [Google Scholar] [CrossRef]
- Riley, R.D.; Ensor, J.; Snell, K.I.E.; Harrell, F.E.; Martin, G.P.; Reitsma, J.B.; Moons, K.G.M.; Collins, G.; van Smeden, M. Calculating the sample size required for developing a clinical prediction model. BMJ 2020, 368, m441. [Google Scholar] [CrossRef] [Green Version]
- Hudda, M.T.; Fewtrell, M.S.; Haroun, D.; Lum, S.; Williams, J.E.; Wells, J.C.K.; Riley, R.D.; Owen, C.G.; Cook, D.G.; Rudnicka, A.R.; et al. Development and validation of a prediction model for fat mass in children and adolescents: Meta-analysis using individual participant data. BMJ 2019, 366, l4293. [Google Scholar] [CrossRef] [Green Version]
- Arboretti Giancristofaro, R.; Salmaso, L. Model performance analysis and model validation in logistic regression. Statistica 2007, 63, 375–396. [Google Scholar]
- Washington, M.K.; Berlin, J.; Branton, P.; Burgart, L.J.; Carter, D.K.; Fitzgibbons, P.L.; Halling, K.; Frankel, W.; Jessup, J.; Kakar, S.; et al. Protocol for the examination of specimens from patients with primary carcinoma of the colon and rectum. Arch. Pathol. Lab. Med. 2009, 133, 1539–1551. [Google Scholar] [CrossRef]
- Edge, S.B.; Compton, C.C. AJCC Cancer Staging Manual, 7th ed.; Springer: Berlin/Heidelberg, Germany, 2010. [Google Scholar]
- Rödel, C.; Martus, P.; Papadoupolos, T.; Füzesi, L.; Klimpfinger, M.; Fietkau, R.; Liersch, T.; Hohenberger, W.; Raab, R.; Sauer, R.; et al. Prognostic significance of tumor regression after preoperative chemoradiotherapy for rectal cancer. J. Clin. Oncol. 2005, 23, 8688–8696. [Google Scholar] [CrossRef] [PubMed]
- Smith, J.J.; Chow, O.S.; Gollub, M.J.; Nash, G.M.; Temple, L.K.; Weiser, M.R.; Guillem, J.G.; Paty, P.B.; Avila, K.; Garcia-Aguilar, J.; et al. Organ Preservation in Rectal Adenocarcinoma: A phase II randomized controlled trial evaluating 3-year disease-free survival in patients with locally advanced rectal cancer treated with chemoradiation plus induction or consolidation chemotherapy, and total mesorectal excision or nonoperative management. BMC Cancer 2015, 15, 767. [Google Scholar] [CrossRef] [Green Version]
- Amin, M.B.; Edge, S.; Greene, F.; Byrd, D.R.; Brookland, R.K.; Washington, M.K.; Gershenwald, J.E.; Compton, C.C.; Hess, K.R.; Sullivan, D.C.; et al. AJCC Cancer Staging Manual, 8th ed.; Springer: New York, NY, USA, 2017. [Google Scholar]
- Achyut, B.R.; Bader, D.A.; Robles, A.I.; Wangsa, D.; Harris, C.C.; Ried, T.; Yang, L. Inflammation-mediated genetic and epigenetic alterations drive cancer development in the neighboring epithelium upon stromal abrogation of TGF-β signaling. PLoS Genet. 2013, 9, e1003251. [Google Scholar] [CrossRef] [PubMed] [Green Version]
- Grivennikov, S.I.; Greten, F.R.; Karin, M. Immunity, inflammation, and cancer. Cell 2010, 140, 883–899. [Google Scholar] [CrossRef] [PubMed] [Green Version]
- Buijsen, J.; van Stiphout, R.G.; Menheere, P.P.; Lammering, G.; Lambin, P. Blood biomarkers are helpful in the prediction of response to chemoradiation in rectal cancer: A prospective, hypothesis driven study on patients with locally advanced rectal cancer. Radiother. Oncol. 2014, 111, 237–242. [Google Scholar] [CrossRef] [PubMed]
- Dreyer, S.B.; Powell, A.G.; McSorley, S.T.; Waterston, A.; Going, J.J.; Edwards, J.; McMillan, D.C.; Horgan, P.G. The Pretreatment Systemic Inflammatory Response is an Important Determinant of Poor Pathologic Response for Patients Undergoing Neoadjuvant Therapy for Rectal Cancer. Ann. Surg. Oncol. 2017, 24, 1295–1303. [Google Scholar] [CrossRef] [Green Version]
- Shrotriya, S.; Walsh, D.; Bennani-Baiti, N.; Thomas, S.; Lorton, C. C-Reactive Protein Is an Important Biomarker for Prognosis Tumor Recurrence and Treatment Response in Adult Solid Tumors: A Systematic Review. PLoS ONE 2015, 10, e0143080. [Google Scholar] [CrossRef]
- Partl, R.; Lukasiak, K.; Thurner, E.M.; Renner, W.; Stranzl-Lawatsch, H.; Langsenlehner, T. The Elevated Pre-Treatment C-Reactive Protein Predicts Poor Prognosis in Patients with Locally Advanced Rectal Cancer Treated with Neo-Adjuvant Radiochemotherapy. Diagnostics 2020, 10, 780. [Google Scholar] [CrossRef]
- Toiyama, Y.; Inoue, Y.; Saigusa, S.; Kawamura, M.; Kawamoto, A.; Okugawa, Y.; Hiro, J.; Tanaka, K.; Mohri, Y.; Kusunoki, M. C-reactive protein as predictor of recurrence in patients with rectal cancer undergoing chemoradiotherapy followed by surgery. Anticancer. Res. 2013, 33, 5065–5074. [Google Scholar]
- Okugawa, Y.; Toiyama, Y.; Fujikawa, H.; Ide, S.; Yamamoto, A.; Omura, Y.; Yin, C.; Kusunoki, K.; Kusunoki, Y.; Yasuda, H.; et al. Prognostic Potential of Lymphocyte-C-Reactive Protein Ratio in Patients with Rectal Cancer Receiving Preoperative Chemoradiotherapy. J. Gastrointest. Surg 2021, 25, 492–502. [Google Scholar] [CrossRef]
- Nishi, M.; Shimada, M.; Tokunaga, T.; Higashijima, J.; Yoshikawa, K.; Kashihara, H.; Takasu, C.; Ishikawa, D.; Wada, Y.; Eto, S.; et al. Lymphocyte to C-reactive protein ratio predicts long-term outcomes for patients with lower rectal cancer. World J. Surg. Oncol. 2021, 19, 201. [Google Scholar] [CrossRef]
- Toiyama, Y.; Inoue, Y.; Kawamura, M.; Kawamoto, A.; Okugawa, Y.; Hiro, J.; Saigusa, S.; Tanaka, K.; Mohri, Y.; Kusunoki, M. Elevated platelet count as predictor of recurrence in rectal cancer patients undergoing preoperative chemoradiotherapy followed by surgery. Int. Surg. 2015, 100, 199–207. [Google Scholar] [CrossRef] [Green Version]
- Sylman, J.L.; Boyce, H.B.; Mitrugno, A.; Tormoen, G.W.; Thomas, I.C.; Wagner, T.H.; Lee, J.S.; Leppert, J.T.; McCarty, O.J.T.; Mallick, P. A Temporal Examination of Platelet Counts as a Predictor of Prognosis in Lung, Prostate, and Colon Cancer Patients. Sci. Rep. 2018, 8, 6564. [Google Scholar] [CrossRef] [PubMed] [Green Version]
- van Halteren, H.K.; Houterman, S.; Verheij, C.D.; Lemmens, V.E.; Coebergh, J.W. Anaemia prior to operation is related with poorer long-term survival in patients with operable rectal cancer. Eur. J. Surg. Oncol. 2004, 30, 628–632. [Google Scholar] [CrossRef] [PubMed]
- Rades, D.; Kuhn, H.; Schultze, J.; Homann, N.; Brandenburg, B.; Schulte, R.; Krull, A.; Schild, S.E.; Dunst, J. Prognostic factors affecting locally recurrent rectal cancer and clinical significance of hemoglobin. Int. J. Radiat. Oncol. Biol. Phys. 2008, 70, 1087–1093. [Google Scholar] [CrossRef] [PubMed]
- Khan, A.A.; Klonizakis, M.; Shabaan, A.; Glynne-Jones, R. Association between pretreatment haemoglobin levels and morphometric characteristics of the tumour, response to neoadjuvant treatment and long-term outcomes in patients with locally advanced rectal cancers. Colorectal. Dis. 2013, 15, 1232–1237. [Google Scholar] [CrossRef] [Green Version]
- García-Flórez, L.J.; Gómez-Álvarez, G.; Frunza, A.M.; Barneo-Serra, L.; Martínez-Alonso, C.; Fresno-Forcelledo, M.F. Predictive markers of response to neoadjuvant therapy in rectal cancer. J. Surg. Res. 2015, 194, 120–126. [Google Scholar] [CrossRef]


| Factors | n (%) | Factors | n (%) |
|---|---|---|---|
| Age (years) | Clinical nodal stage (cN) | ||
| Positive | 136 (79.5) | ||
| Mean (min-max) | 61.77 (31–84) | Negative | 35 (20.5) |
| Gender | TNM stage | ||
| 1 | 1 (0.6) | ||
| Male | 108 (63.2) | 2 | 32 (18.7) |
| Female | 63 (36.8) | 3 | 138 (80.7) |
| ECOG | Neoadjuvant Radiotherapy | ||
| 0 | 138 (80.7) | 3DCRT | 147 (86.0) |
| 1 | 32 (18.7) | VMAT | 24 (14.0) |
| 2 | 1 (0.6) | Median Dose (Gy) (min-max) | 50 (45–55) |
| Tumor localization | Neoadjuvant chemotherapy regimen | ||
| Superior | 30 (17.5) | Capecitabine | 157 (91.8) |
| Medium | 71 (41.5) | 5-FU | 4 (2.3) |
| Inferior | 70 (40.9) | Other | 10 (5.9) |
| Clinical tumor stage (cT) | Clinical nodal stage (cN) | ||
| 2 | 12 (7.0) | ||
| 3 | 121 (70.3) | Positive | 136 (79.5) |
| 4 | 38 (22.1) | Negative | 35 (20.5) |
| Patient Groups | n (%) | |
|---|---|---|
| Responders | Complete clinical response (Watch&Wait: ycT0N0M0) | 13 (7.6) |
| Complete pathologic response (ypT0N0M0)–Ryan 0 | 33 (19.3) | |
| Moderate response–Ryan 1 | 56 (32.7) | |
| Total | 102 (59.6) | |
| Nonresponders | Ryan 2 | 43 (25.1) |
| Ryan 3 | 21 (12.3) | |
| Unresectable | 5 (2.9) | |
| Total | 69 (40.3) | |
| Factors | Univariate Analysis OR (95% IC) | p | Multivariate Analysis OR (95% IC) | p |
|---|---|---|---|---|
| cT | ||||
| 2–3 | 1 (-) | |||
| 4 | 0.457 (0.218–0.946) | 0.0358 | ||
| ECOG | ||||
| 0 | 1 (-) | |||
| 1–2 | 1.051 (0.487–2.328) | 0.9007 | ||
| Hg (g/dL) * | ||||
| ≤12.2 | 1 (-) | |||
| >12.2 | 2.808 (1.412–5.692) | 0.0036 | ||
| CRP (mg/L) * | ||||
| ≤3.5 | 1 (-) | |||
| >3.5 | 0.057 (0.009–0.223) | <0.0001 | 0.05 (0.007–0.212) | <0.0001 |
| Platelets (×109/L) * | ||||
| ≤253.5 | 1 (-) | |||
| >253.5 | 0.354 (0.183–0.677) | 0.0018 | ||
| NLR * | ||||
| ≤2.3 | 1 (-) | |||
| >2.3 | 0.725 (0.39–1.339) | 0.306 | 2.181 (0.661–8.234) | 0.2181 |
| CEA (ng/mL) * | ||||
| ≤2.7 | 1 (-) | |||
| >2.7 | 0.457 (0.231–0.88) | 0.0213 | 0.358 (0.081–1.387) | 0.148 |
| CA 19.9 (U/mL) * | ||||
| ≤3.5 | 1 (-) | |||
| >3.5 | 0.58 (0.295–1.113) | 0.1062 |
| Discrimination: C Statistic | ||||||
|---|---|---|---|---|---|---|
| FIT = 100% | FIT = 75%—1000 iterations | |||||
| FULL | MEDIANE | IQR/2 * | C Var ** | Min | Max | |
| C training | 0.81 | 0.81 | 0.02 | 2.30 | 0.74 | 0.91 |
| C testing | 0.80 | 0.06 | 7.43 | 0.37 | 1.00 | |
| Factors | OS | DFS | ||||||||||
|---|---|---|---|---|---|---|---|---|---|---|---|---|
| Univariate Analysis HR (95% IC) | Univariate Analysis 1/HR (95% IC) | p | Multivariate Analysis HR (95% IC) | Multivariate Analysis 1/HR (95% IC) | p | Univariate Analysis HR (95% IC) | Univariate Analysis 1/HR (95% IC) | p | Multivariate Analysis HR (95% IC) | Multivariate Analysis 1/HR (95% IC) | p | |
| cT | 0.0021 | -- | -- | 0.0031 | -- | -- | ||||||
| 2–3 | 1 (-) | 1 (-) | ||||||||||
| 4 | 2.901 (1.47–5.728) | 0.344 (0.17–0.68) | 2.443 (1.352–4.414) | 0.409 (0.22–0.74) | ||||||||
| ECOG | 0.3032 | -- | -- | 0.4619 | -- | -- | ||||||
| 0 | 1 (-) | 1 (-) | ||||||||||
| 1–2 | 1.558 (0.67–3.623) | 0.642 (0.28–1.49) | 1.316 (0.633–2.734) | 0.759 (0.37–1.58) | ||||||||
| Hg (g/dL) * | <0.001 | 0.0595 | <0.001 | 0.0293 | ||||||||
| ≤12.2 | 1 (-) | 1 (-) | 1 (-) | 1 (-) | ||||||||
| >12.2 | 0.234 (0.118–0.464) | 4.274 (2.16–8.47) | 0.39 (0.146–1.038) | 2.564 (0.96–6.85) | 0.203 (0.113–0.366) | 4.926 (2.73–8.85) | 0.37 (0.151–0.905) | 2.70 (1.10–6.62) | ||||
| CRP (mg/L) * | 0.0633 | 0.0241 | 0.0259 | 0.0086 | ||||||||
| ≤3.5 | 1 (-) | 1 (-) | 1 (-) | 1 (-) | ||||||||
| >3.5 | 4.021 (0.926–17.459) | 0.249 (0.06–1.08) | 6.096 (1.267–29.323) | 0.164 (0.03–0.79) | 3.945 (1.179–13.203) | 0.253 (0.07–0.85) | 5.481 (1.542–19.485) | 0.182 (0.05–0.65) | ||||
| Platelets (×109/L) * | 0.0026 | 0.0035 | 0.0001 | 0.0112 | ||||||||
| ≤253.5 | 1 (-) | 1 (-) | 1 (-) | 1 (-) | ||||||||
| >253.5 | 2.793 (1.433–5.444) | 0.358 (0.18–0.69) | 4.654 (1.659–13.053) | 0.215 (0.07–0.60) | 3.029 (1.722–5.327) | 0.330 (0.18–0.58) | 3.068 (1.29–7.296) | 0.326 (0.14–0.77) | ||||
| NLR * | 0.0012 | -- | -- | 0.0011 | -- | -- | ||||||
| ≤2.3 | 1 (-) | 1 (-) | ||||||||||
| >2.3 | 3.695 (1.674–8.158) | 0.271 (0.12–0.59) | 2.821 (1.514–5.255) | 0.354 (0.19–0.66) | ||||||||
| CEA (ng/mL) * | 0.1266 | 0.0918 | 0.018 | -- | -- | |||||||
| ≤2.7 | 1 (-) | 1 (-) | 1 (-) | |||||||||
| >2.7 | 1.808 (0.846–3.865) | 0.553 (0.25–1.18) | 5.818 (0.751–45.055) | 0.172 (0.02–1.33) | 2.255 (1.15–4.421) | 0.443 (0.22–0.87) | ||||||
| CA 19.9 (U/mL) * | 0.6607 | -- | -- | 0.695 | -- | -- | ||||||
| ≤3.5 | 1 (-) | 1 (-) | ||||||||||
| >3.5 | 0.859 (0.436–1.693) | 1.164 (0.59–2.29) | 0.891 (0.501–1.585) | 1.122 (0.63–1.99) | ||||||||
Publisher’s Note: MDPI stays neutral with regard to jurisdictional claims in published maps and institutional affiliations. |
© 2022 by the authors. Licensee MDPI, Basel, Switzerland. This article is an open access article distributed under the terms and conditions of the Creative Commons Attribution (CC BY) license (https://creativecommons.org/licenses/by/4.0/).
Share and Cite
Aires, F.; Rodrigues, D.; Lamas, M.P.; Herdeiro, M.T.; Figueiras, A.; Oliveira, M.J.; Marques, M.; Pinto, A.T. C-Reactive Protein as Predictive Biomarker for Response to Chemoradiotherapy in Patients with Locally Advanced Rectal Cancer: A Retrospective Study. Cancers 2022, 14, 491. https://doi.org/10.3390/cancers14030491
Aires F, Rodrigues D, Lamas MP, Herdeiro MT, Figueiras A, Oliveira MJ, Marques M, Pinto AT. C-Reactive Protein as Predictive Biomarker for Response to Chemoradiotherapy in Patients with Locally Advanced Rectal Cancer: A Retrospective Study. Cancers. 2022; 14(3):491. https://doi.org/10.3390/cancers14030491
Chicago/Turabian StyleAires, Fátima, Darlene Rodrigues, María Piñeiro Lamas, Maria Teresa Herdeiro, Adolfo Figueiras, Maria José Oliveira, Margarida Marques, and Ana Teresa Pinto. 2022. "C-Reactive Protein as Predictive Biomarker for Response to Chemoradiotherapy in Patients with Locally Advanced Rectal Cancer: A Retrospective Study" Cancers 14, no. 3: 491. https://doi.org/10.3390/cancers14030491