
Neoadjuvant Treatment with HER2-Targeted Therapies in HER2-Positive Breast Cancer: A Systematic Review and Network Meta-Analysis

Abstract
:Simple Summary
Abstract
1. Introduction
2. Materials and Methods
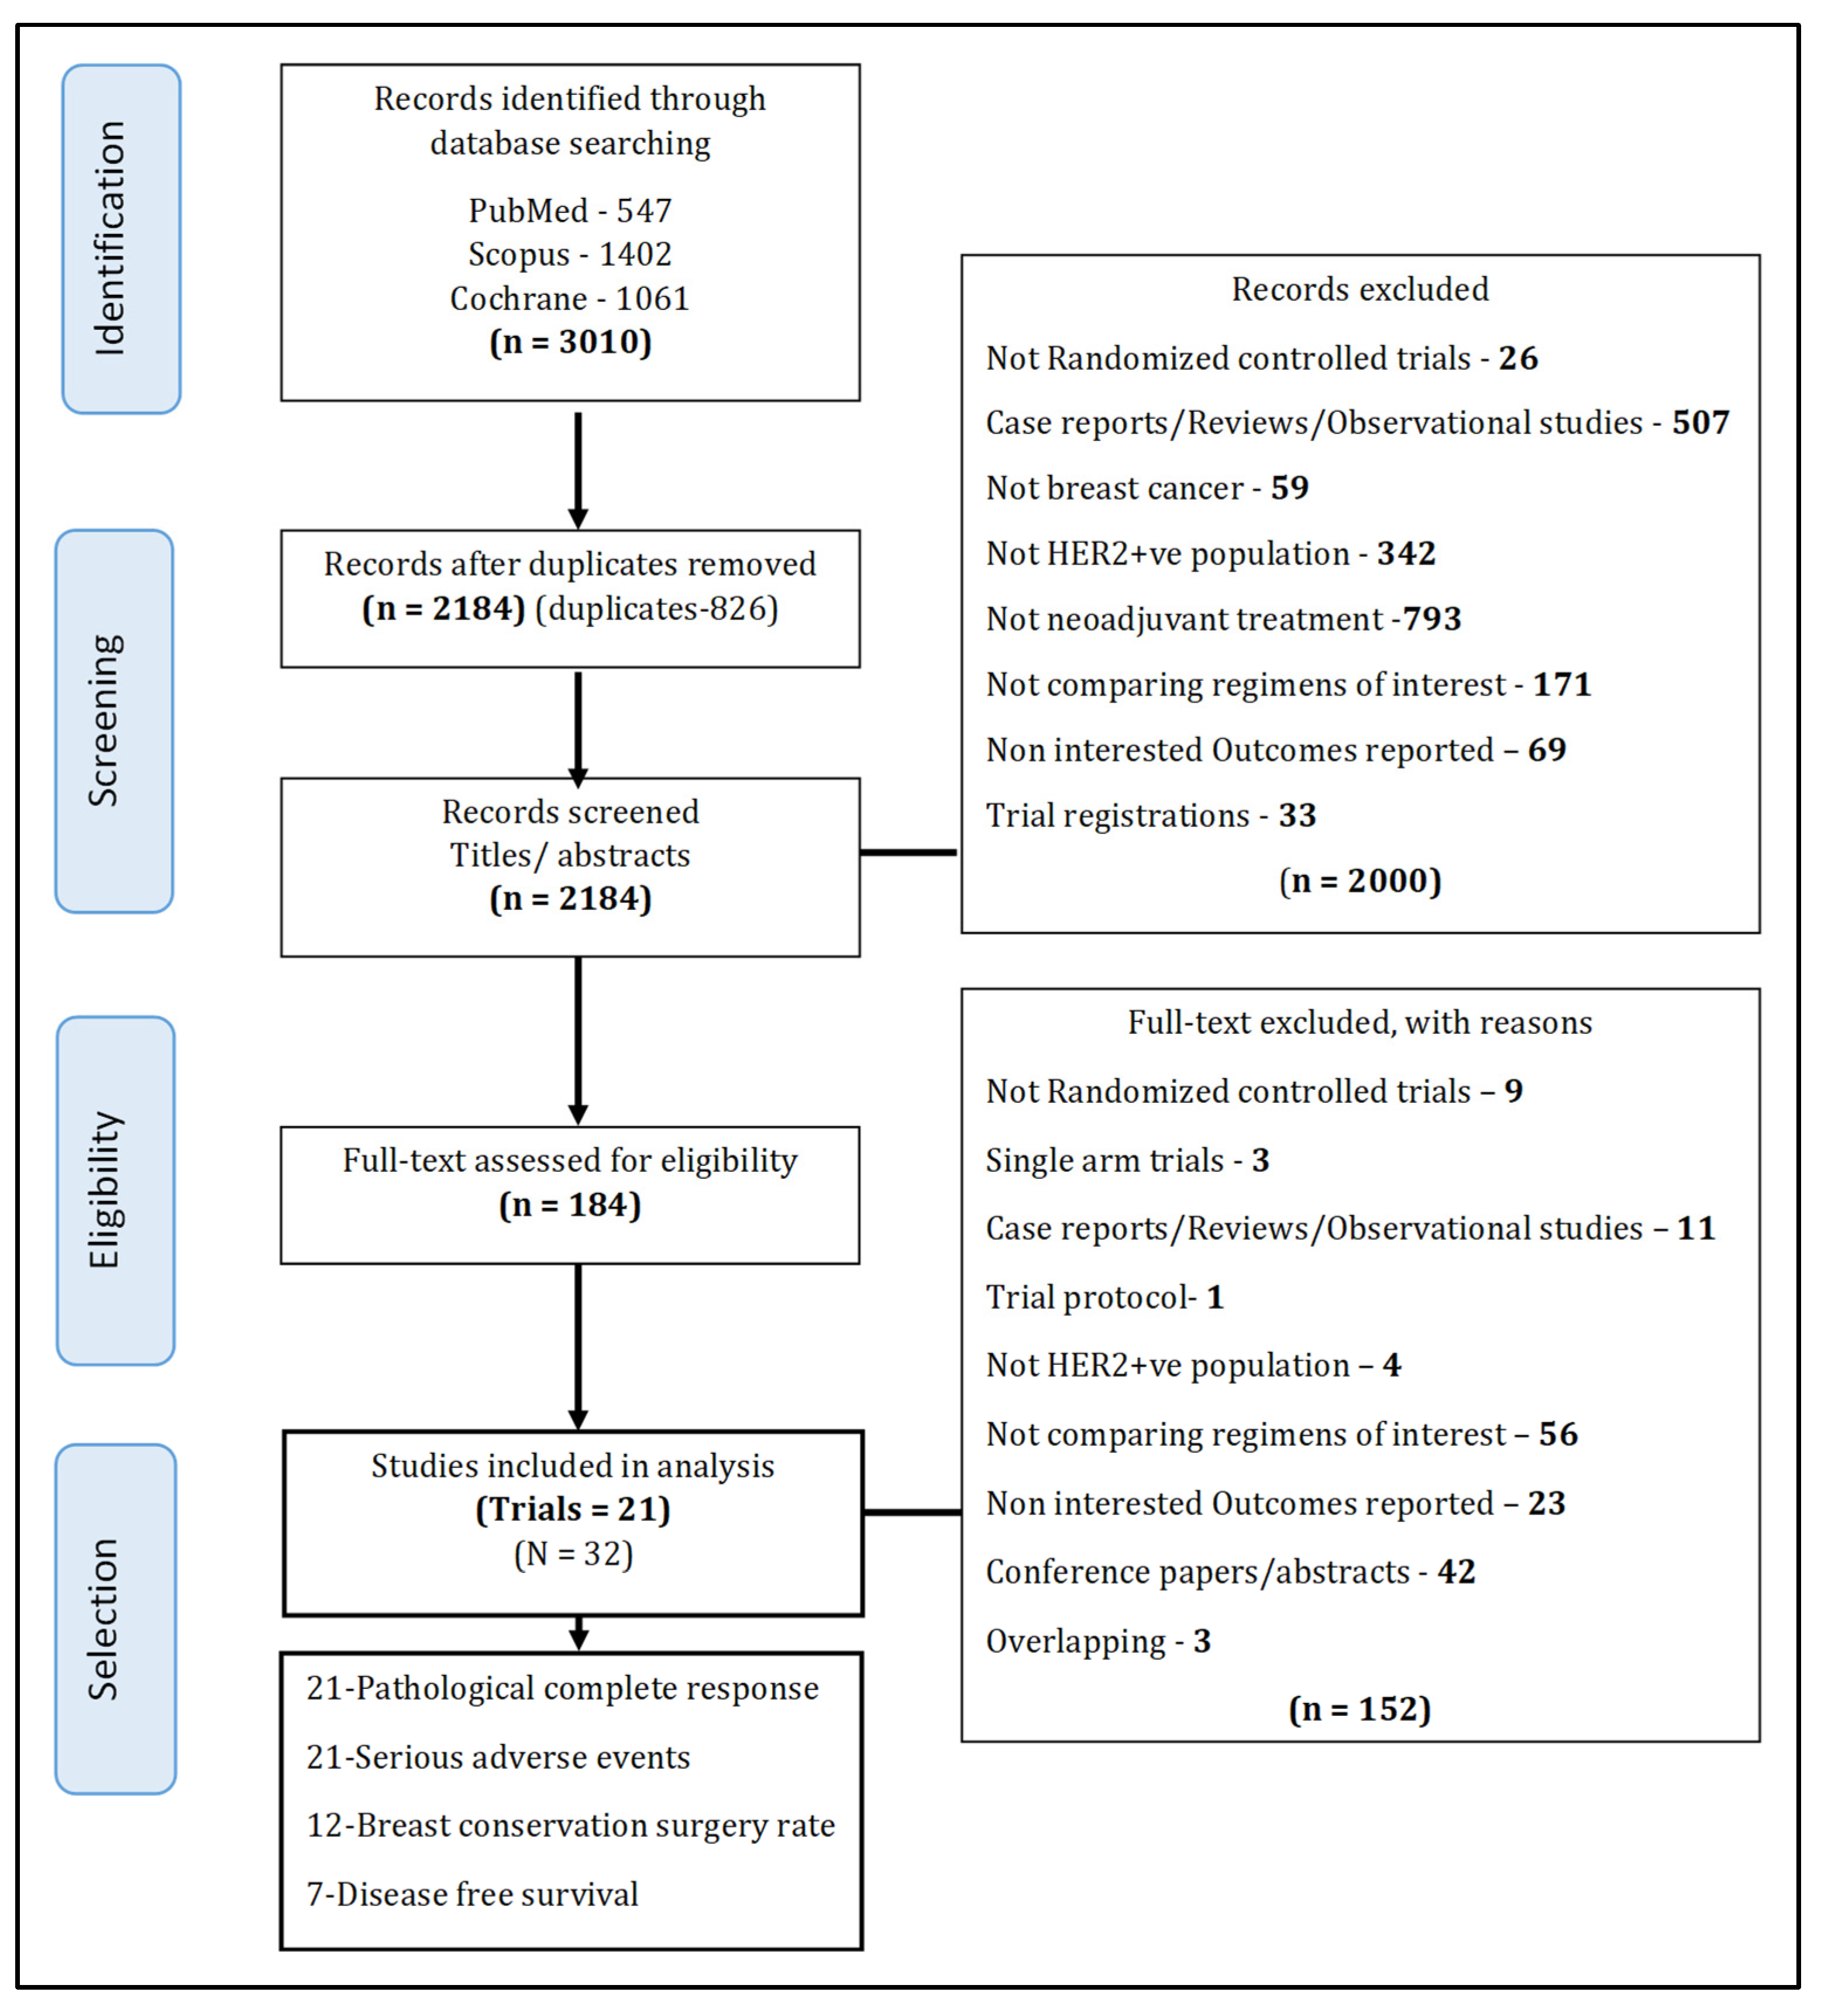
2.1. Literature Search and Selection of Studies
2.1.1. Selection of Studies
2.1.2. Interventions of Interest
- Single HER2-targeted agents with chemotherapy (i.e., TC, PC, LC);
- Dual HER2-targeted agents with chemotherapy (i.e., PTC, LTC, T-DM1PC, T-DM1LC, PTC_T-DM1P). T-DM1PC was a response guided regimen where T-DM1P was provided in cycles 1 through 4, followed by 4 cycles of chemotherapy in non-responders or a continuation of 2 cycles of T-DM1P in responders. PTC_T-DM1P was a regimen where PTC was provided in cycles 1 through 4, followed by T-DM1P in cycles 5 through 8;
- Dual HER2-targeted agents without chemotherapy (i.e., PT, T-DM1P);
- Single HER2-targeted agents without chemotherapy (i.e., T-DM1);
2.1.3. Outcomes of Interest
2.2. Data Extraction
2.3. Risk of Bias Assessment
2.4. Statistical Analysis
3. Results
3.1. Risk of Bias Assessment
3.2. Pathological Complete Response
3.2.1. Pairwise Meta-Analysis
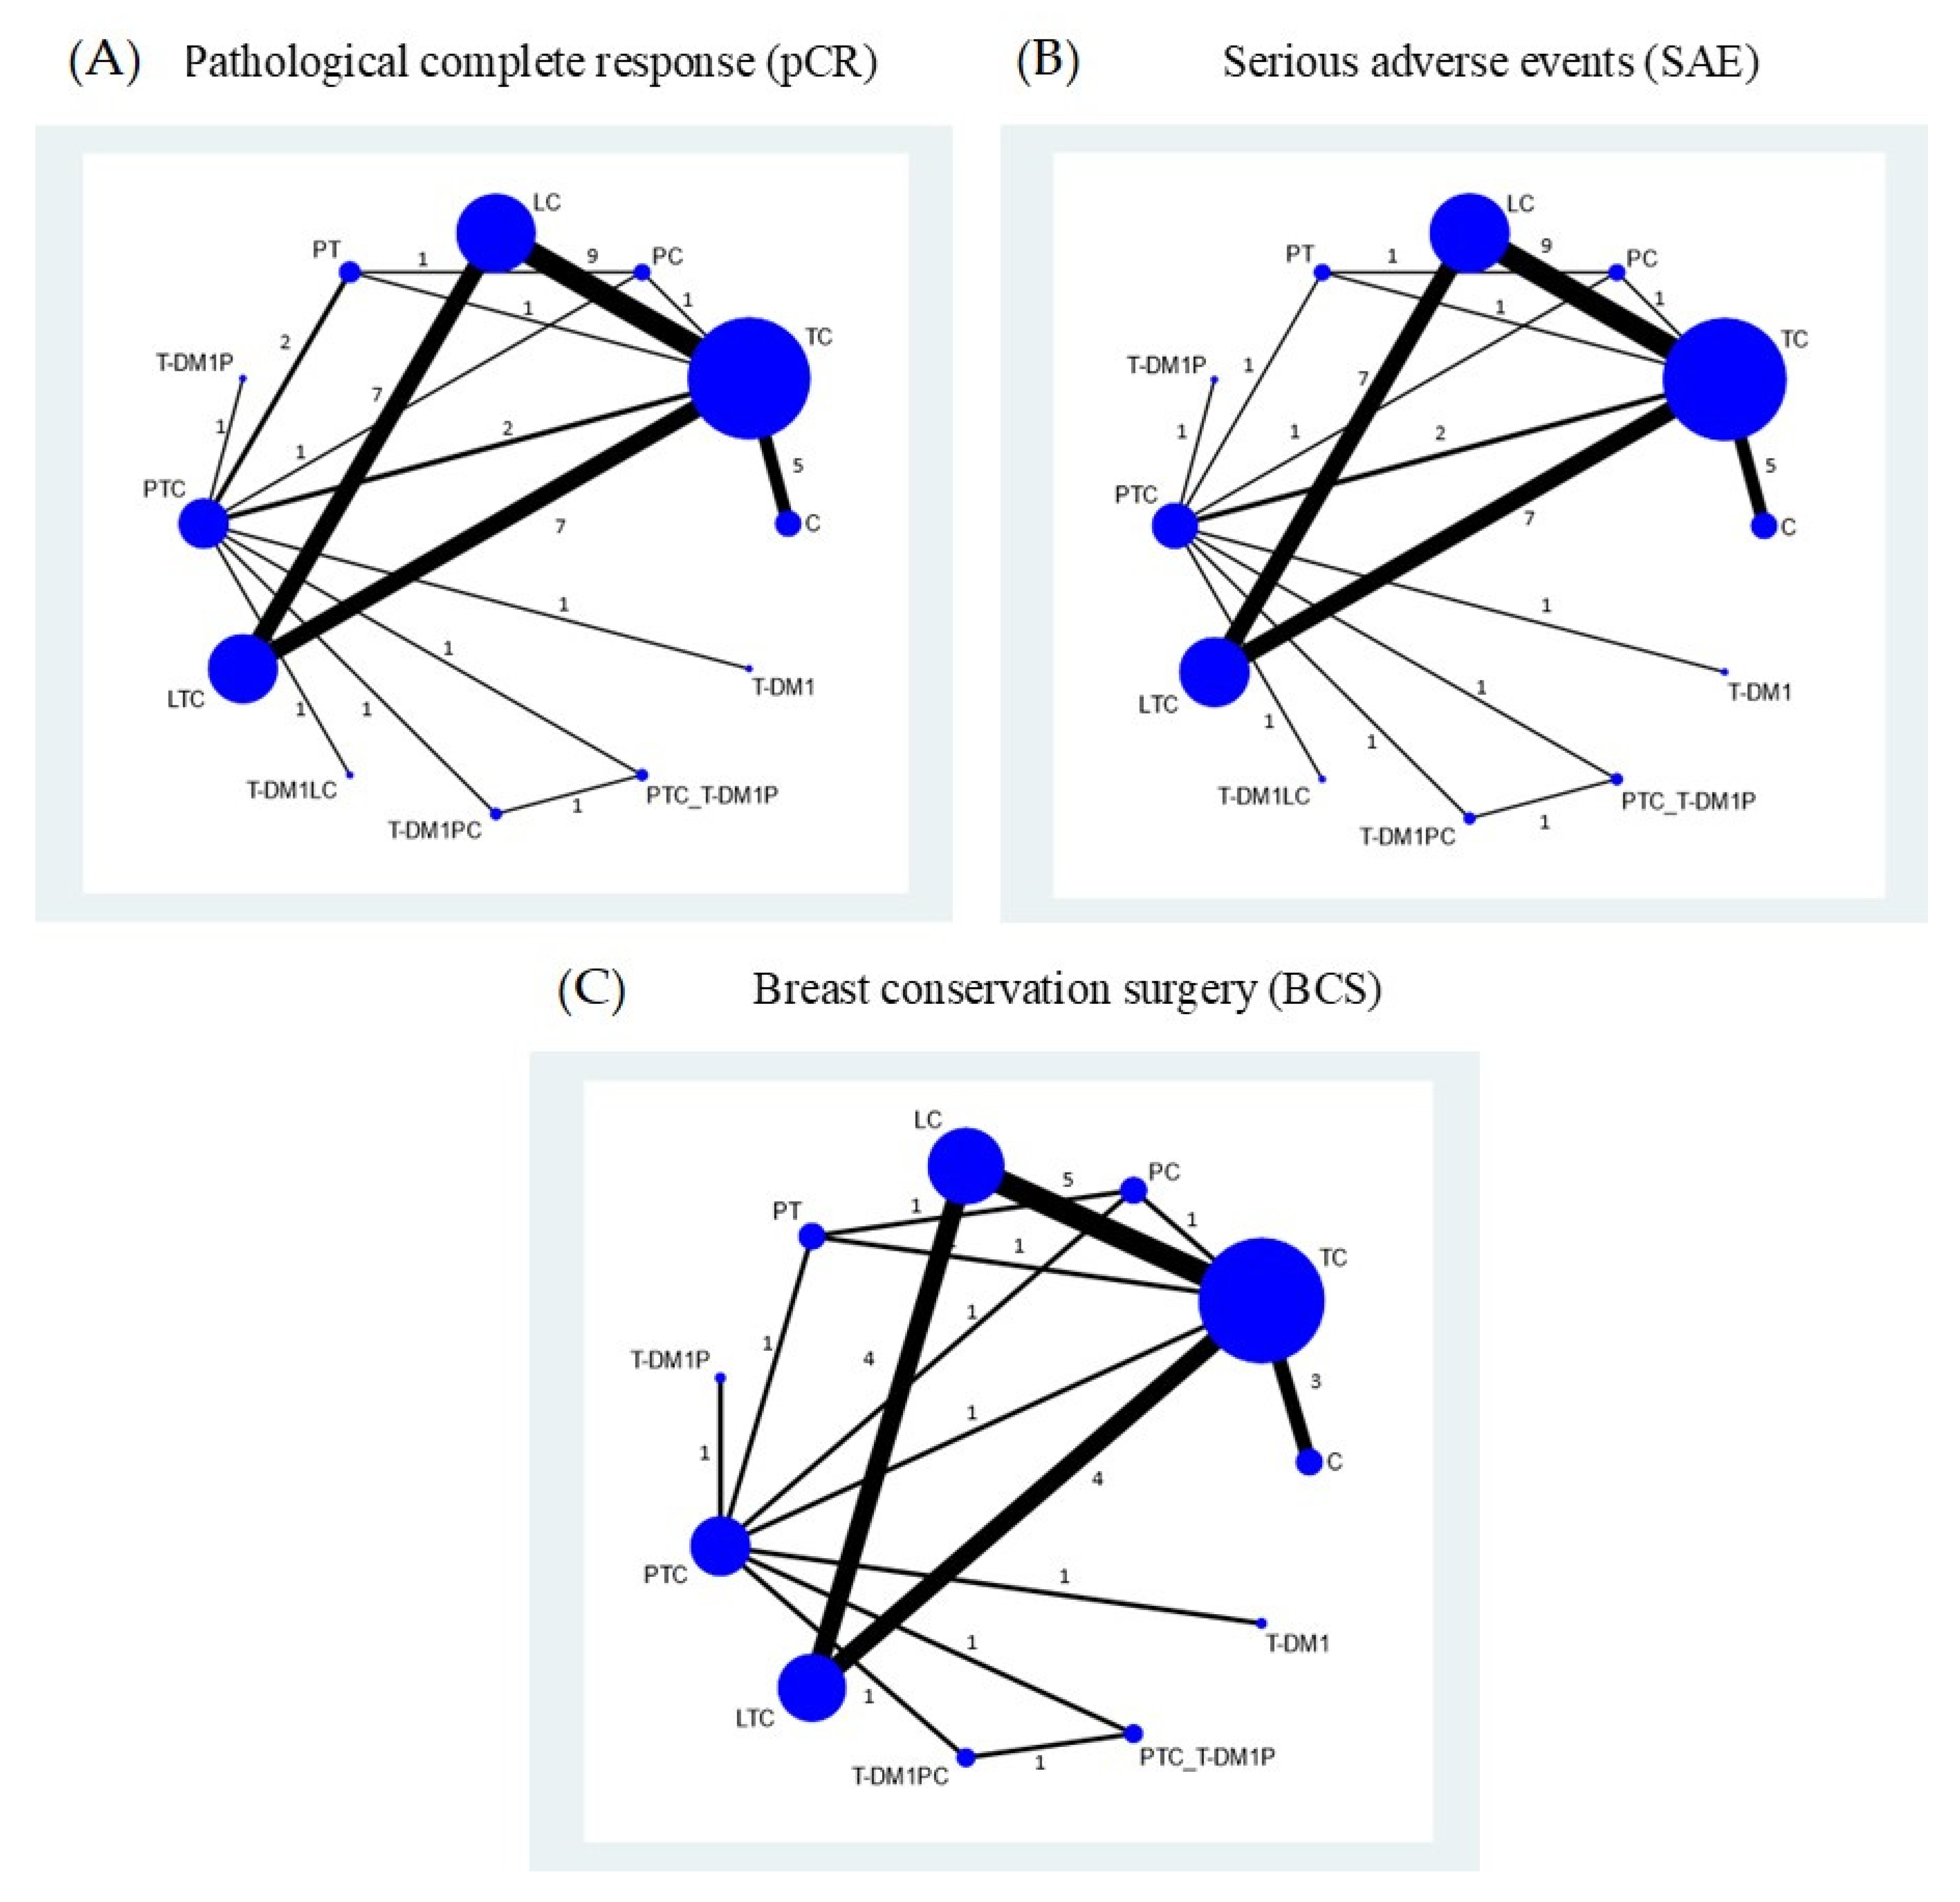
3.2.2. Network Meta-Analysis
3.3. Serious Adverse Events
3.3.1. Pairwise Meta-Analysis
3.3.2. Network Meta-Analysis
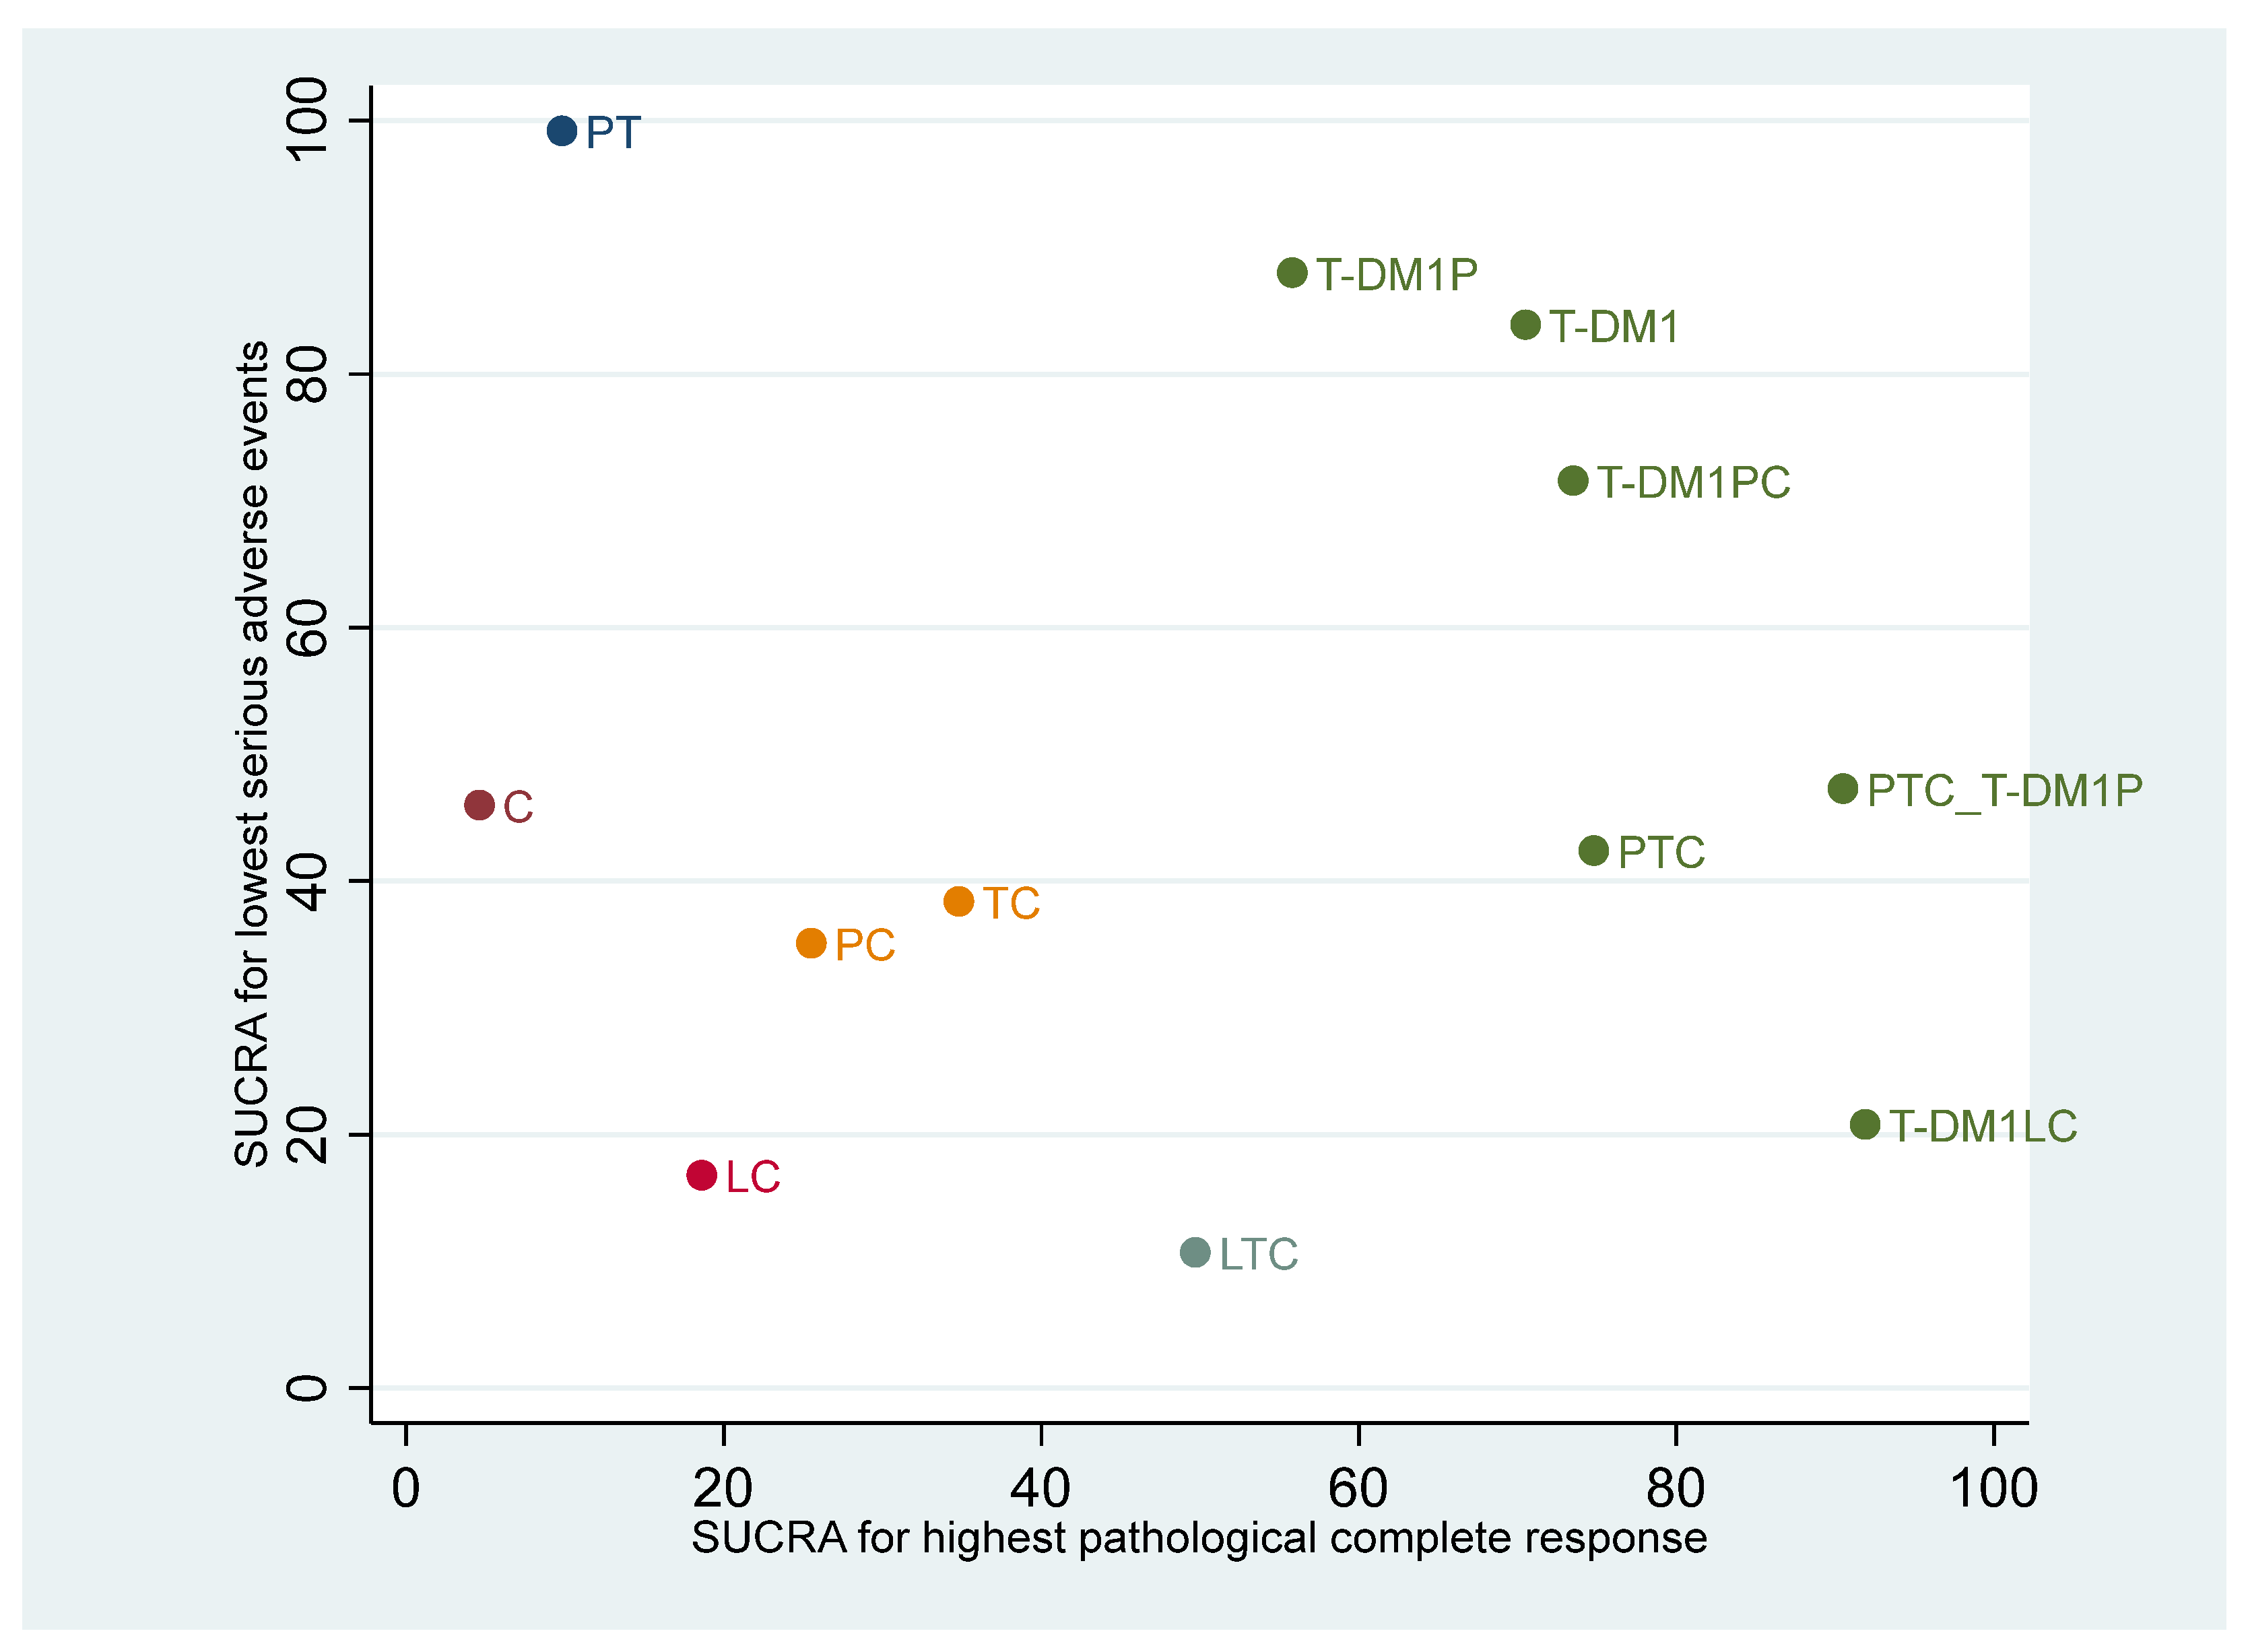
3.4. Ranking of Regimens According to Efficacy and Safety
3.5. Breast Conservation Surgery
3.5.1. Pairwise Meta-Analysis
3.5.2. Network Meta-Analysis
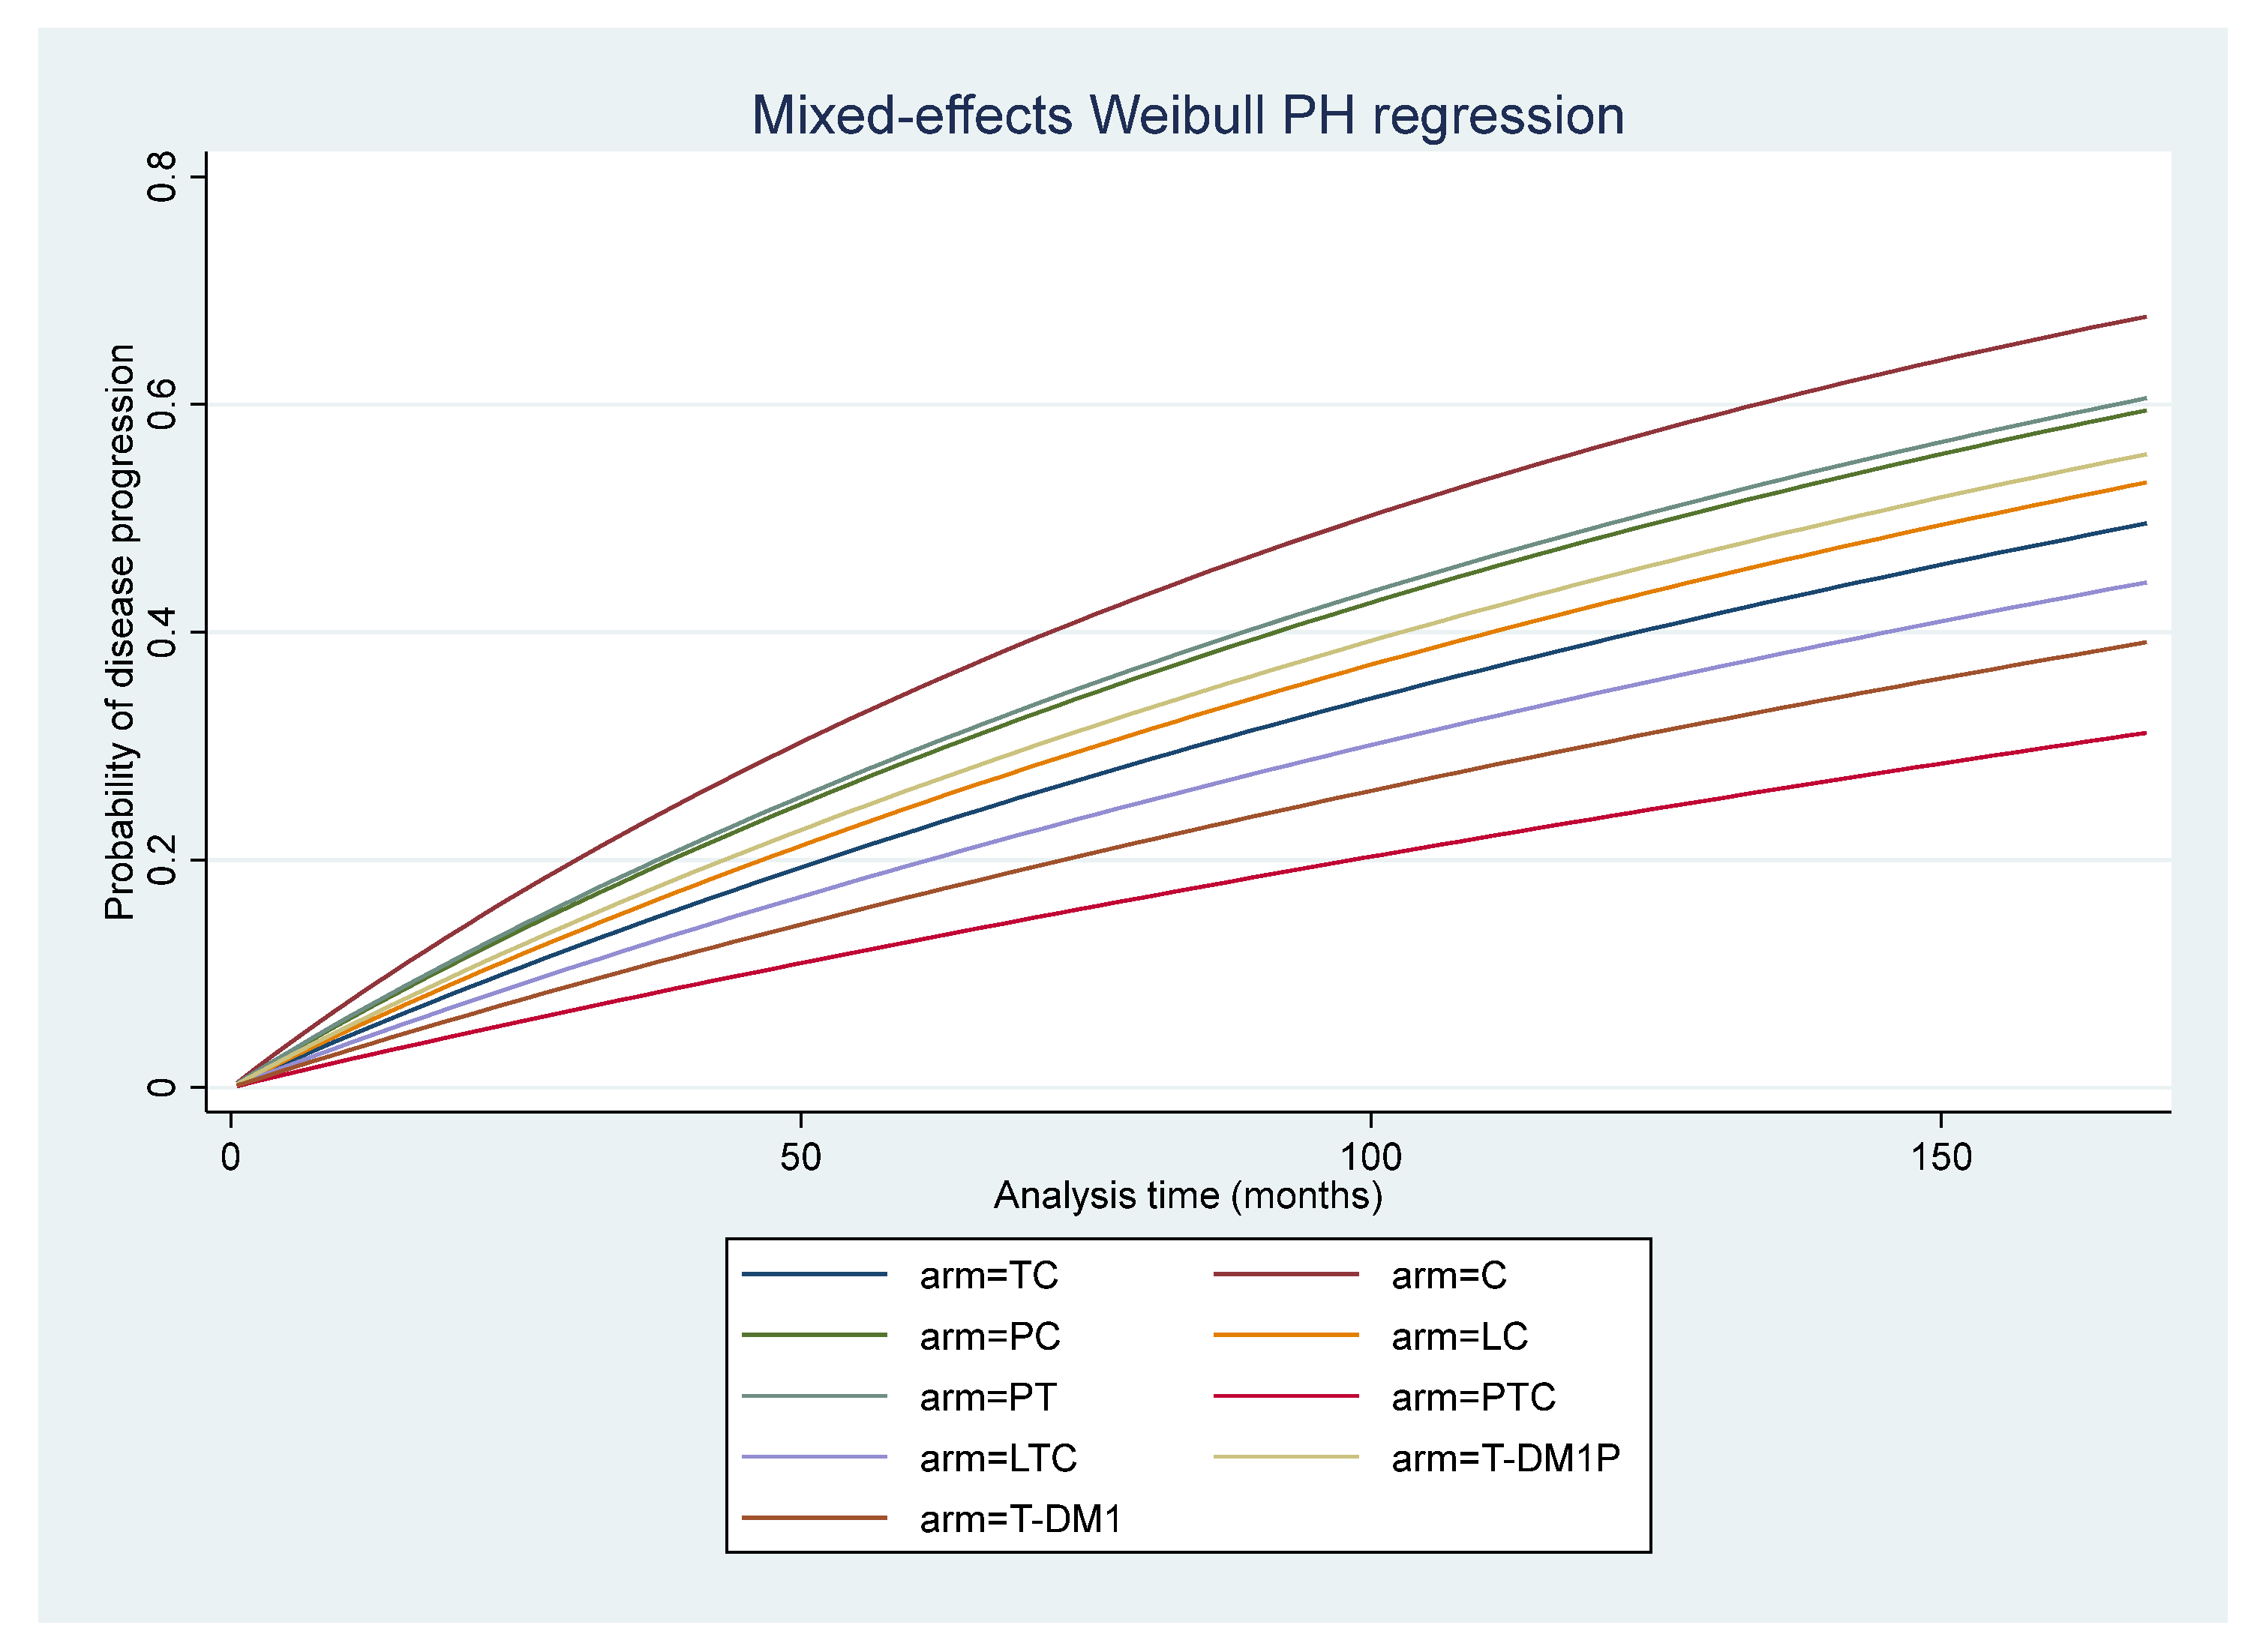
3.6. Disease-Free Survival
4. Discussion
Strengths and Limitations
5. Conclusions
Supplementary Materials
Author Contributions
Funding
Conflicts of Interest
Appendix A
Search Terms and Search Strategies

| Domain | No. | Search Terms |
|---|---|---|
| P 1 | #1 | “breast cancer” [All Fields] |
| #2 | “breast neoplasms” [All Fields] OR “breast neoplasms” [MeSH Terms] | |
| #3 | #1 OR #2 | |
| P 2 | #4 | “human epidermal growth factor receptor 2” [All Fields] |
| #5 | “HER2” [All Fields] | |
| #6 | “ERBB2 protein, human” [All Fields] | |
| #7 | “erbb-2 genes” [All Fields] | |
| #8 | #4 OR #5 OR #6 OR #7 | |
| P | #9 | P1 AND P2 #3 AND #8 |
| I 1 | #10 | “neoadjuvant” [All Fields] |
| #11 | “preoperative” [All Fields] | |
| #12 | #10 OR #11 | |
| I 2 | #13 | “anti HER2” [All Fields] OR “anti human epidermal growth factor receptor 2” [All Fields] |
| #14 | “targeted therapy” [All Fields] | |
| #15 | “trastuzumab” [All Fields] OR “Herceptin” [All Fields] | |
| #16 | “pertuzumab” [All Fields] | |
| #17 | “lapatinib” [All Fields] OR “Tykerb” [All Fields] | |
| #18 | #13 OR #14 OR #15 OR #16 OR #17 | |
| I | #19 | I 1 OR I 2 #12 OR #18 |
| O 1 | #20 | “complete response” |
| O 2 | #21 | “disease-free survival” [All Fields] |
| #22 | “progression-free survival” [All Fields] | |
| #23 | “event free survival” [All Fields] | |
| #24 | “overall survival” [All Fields] | |
| #25 | “survival” [All Fields] | |
| #26 | #21 OR #22 OR #23 OR #24 OR #25 | |
| #27 | “mortality” [All Fields] | |
| O 2 | #28 | #26 OR #27 |
| O 3 | #29 | “adverse event” [All Fields] OR “adverse events” [All Fields] |
| O | #30 | O1 OR O2 OR O3 #20 OR #28 OR #29 |
| S | #31 | “randomized controlled trial” [All Fields] |
| Combinations | ||
| P, I, O | #9 AND #19 AND #30 | |
| P, I, O, S | #9 AND #19 AND #30 AND #31 | |
| Domain | No. | Search Terms: TITLE-ABS-KEY |
|---|---|---|
| P 1 | #1 | “breast cancer” |
| #2 | “breast neoplasms” | |
| P 1 | #3 | #1 OR #2 |
| P 2 | #4 | “human epidermal growth factor receptor 2” |
| #5 | “HER2” | |
| #6 | “ERBB2” | |
| P 2 | #7 | #4 OR #5 OR #6 |
| P | #8 | P1 AND P2 #3 AND #7 |
| I 1 | #9 | “neoadjuvant” |
| #10 | “pre operative” | |
| #11 | #9 OR #10 | |
| I 2 | #12 | “anti HER2” OR “anti human epidermal growth factor receptor 2” |
| #13 | “targeted therapy” | |
| #14 | “trastuzumab” OR “Herceptin” | |
| #15 | “pertuzumab” OR “perjeta” | |
| #16 | “lapatinib” OR “Tykerb” OR “Tyverb” | |
| #17 | #12 OR #13 OR #14 OR #15 OR #16 | |
| I | #18 | I 1 OR I 2 #11 OR #17 |
| O 1 | #19 | “complete response” |
| O 2 | #20 | “survival” |
| O 3 | #21 | “adverse event” |
| O | #22 | O1 OR O2 OR O3 #19 OR #20 OR #21 |
| S | #23 | “randomized controlled trial” |
| Combinations | ||
| P, I, O | #8 AND #18 AND #22 | |
| P, I, O, S | #8 AND #18 AND #22 AND #23 | |
| Domain | No. | Search Terms | Limits |
|---|---|---|---|
| P 1 | #1 | “breast cancer” OR “breast neoplasm” | In Trials |
| P 2 | #2 | “human epidermal growth factor receptor 2” OR “HER 2” | |
| #3 | “erbB2” | ||
| #4 | #2 OR #3 | ||
| P | #5 | P1 AND P2 #1 AND #4 | In Trials |
| I 1 | #6 | “neoadjuvant” | In Trials |
| #7 | “preoperative” | ||
| #8 | #6 OR #7 | ||
| I 2 | #9 | “anti HER2” | |
| #10 | “anti human epidermal growth factor receptor 2” | ||
| #11 | “targeted therapy” | ||
| #12 | “trastuzumab” OR “Herceptin” | ||
| #13 | “pertuzumab” OR “perjeta” | ||
| #14 | “lapatinib” OR “Tykerb” | ||
| #15 | #9 OR #10 OR #11 OR #12 OR #13 OR #14 | ||
| I | #16 | I 1 OR I 2 #8 OR #15 | In Trials |
| O 1 | #17 | “complete response” | In Trials |
| O 2 | #18 | “survival” | |
| O 3 | #19 | “adverse event” | |
| O | #20 | O1 OR O2 OR O3 #17 OR #18 OR #19 | In Trials |
| Combination | |||
| P, I, O | - | #5 AND #16 AND #20 | In Trials |
References
- Sung, H.; Ferlay, J.; Siegel, R.L.; Laversanne, M.; Soerjomataram, I.; Jemal, A.; Bray, F. Global Cancer Statistics 2020: GLOBOCAN Estimates of Incidence and Mortality Worldwide for 36 Cancers in 185 Countries. CA Cancer J. Clin. 2021, 71, 209–249. [Google Scholar] [CrossRef]
- Pernaut, C.; Lopez, F.; Ciruelos, E. Standard Neoadjuvant Treatment in Early/Locally Advanced Breast Cancer. Breast Care 2018, 13, 244–249. [Google Scholar] [CrossRef] [PubMed]
- Jiang, N.; Lin, J.-J.; Wang, J.; Zhang, B.-N.; Li, A.; Chen, Z.-Y.; Guo, S.; Li, B.-B.; Duan, Y.-Z.; Yan, R.-Y.; et al. Novel treatment strategies for patients with HER2-positive breast cancer who do not benefit from current targeted therapy drugs. Exp. Ther. Med. 2018, 16, 2183–2192. [Google Scholar] [CrossRef]
- Sevcikova, K.; Vertakova-Krakovska, B.; Spanik, S. Neoadjuvant Treatment in Patients with HER2-Positive Breast Cancer. ISRN Oncol. 2013, 2013, 362467. [Google Scholar] [CrossRef] [Green Version]
- Gianni, L.; Pienkowski, T.; Im, Y.H.; Tseng, L.M.; Liu, M.C.; Lluch, A.; Staroslawska, E.; de la Haba-Rodriguez, J.; Im, S.A.; Pedrini, J.L.; et al. 5-year analysis of neoadjuvant pertuzumab and trastuzumab in patients with locally advanced, inflammatory, or early-stage HER2-positive breast cancer (NeoSphere): A multicentre, open-label, phase 2 randomised trial. Lancet Oncol. 2016, 17, 791–800. [Google Scholar] [CrossRef]
- Cardoso, F.K.S.; Ohno, S.; Penault-Llorca, F.; Poortmans, P.; Rubio, I.T.; Zackrisson, S.; Senkus, E.; The ESMO Guidelines Committee. Early breast cancer: ESMO Clinical Practice Guidelines for diagnosis, treatment and follow-up. Ann. Oncol. 2019, 30, 1674. [Google Scholar] [CrossRef] [Green Version]
- National Comprehensive Cancer Network. NCCN Guidelines Invasive Breast Cancer (Version 5.2020). 2020. Available online: https://www.nccn.org/professionals/physician_gls/pdf/breast.pdf (accessed on 6 May 2021).
- Nakashoji, A.; Hayashida, T.; Yokoe, T.; Maeda, H.; Toyota, T.; Kikuchi, M.; Watanuki, R.; Nagayama, A.; Seki, T.; Takahashi, M.; et al. The updated network meta-analysis of neoadjuvant therapy for HER2-positive breast cancer. Cancer Treat. Rev. 2018, 62, 9–17. [Google Scholar] [CrossRef]
- Wu, D.; Chen, T.; Jiang, H.; Duan, C.; Zhang, X.; Lin, Y.; Chen, S.; Wu, F. Comparative Efficacy and Tolerability of Neoadjuvant Immunotherapy Regimens for Patients with HER2-Positive Breast Cancer: A Network Meta-Analysis. J. Oncol. 2019, 2019, 3406972. [Google Scholar] [CrossRef]
- Patel, T.A.; Ensor, J.E.; Creamer, S.L.; Boone, T.; Rodriguez, A.A.; Niravath, P.A.; Darcourt, J.G.; Meisel, J.L.; Li, X.; Zhao, J.; et al. A randomized, controlled phase II trial of neoadjuvant ado-trastuzumab emtansine, lapatinib, and nab-paclitaxel versus trastuzumab, pertuzumab, and paclitaxel in HER2-positive breast cancer (TEAL study). Breast Cancer Res. 2019, 21, 100. [Google Scholar] [CrossRef] [Green Version]
- Masuda, N.; Ohtani, S.; Takano, T.; Inoue, K.; Suzuki, E.; Nakamura, R.; Bando, H.; Ito, Y.; Ishida, K.; Yamanaka, T.; et al. A randomized, 3-arm, neoadjuvant, phase 2 study comparing docetaxel + carboplatin + trastuzumab + pertuzumab (TCbHP), TCbHP followed by trastuzumab emtansine and pertuzumab (T-DM1+P), and T-DM1+P in HER2-positive primary breast cancer. Breast Cancer Res. Treat. 2020, 180, 135–146. [Google Scholar] [CrossRef] [Green Version]
- Untch, M.; von Minckwitz, G.; Gerber, B.; Schem, C.; Rezai, M.; Fasching, P.A.; Tesch, H.; Eggemann, H.; Hanusch, C.; Huober, J.; et al. Survival Analysis After Neoadjuvant Chemotherapy With Trastuzumab or Lapatinib in Patients With Human Epidermal Growth Factor Receptor 2-Positive Breast Cancer in the GeparQuinto (G5) Study (GBG 44). J. Clin. Oncol. 2018, 36, 1308–1316. [Google Scholar] [CrossRef]
- De Azambuja, E.; Holmes, A.P.; Piccart-Gebhart, M.; Holmes, E.; Di Cosimo, S.; Swaby, R.F.; Untch, M.; Jackisch, C.; Lang, I.; Smith, I.; et al. Lapatinib with trastuzumab for HER2-positive early breast cancer (NeoALTTO): Survival outcomes of a randomised, open-label, multicentre, phase 3 trial and their association with pathological complete response. Lancet Oncol. 2014, 15, 1137–1146. [Google Scholar] [CrossRef] [Green Version]
- Pathological Complete Response in Neoadjuvant Treatment of High-Risk Early-Stage Breast Cancer: Use as an Endpoint to Support Accelerated Approval. Guidance for Industry: U.S. Department of Health and Human Services Food and Drug Administration Oncology Center of Excellence Center for Drug Evaluation and Research (CDER) Center for Biologics Evaluation and Research (CBER). 2020. Available online: https://www.fda.gov/regulatory-information/search-fda-guidance-documents/pathological-complete-response-neoadjuvant-treatment-high-risk-early-stage-breast-cancer-use (accessed on 20 November 2020).
- Common Terminology Criteria for Adverse Events (CTCAE) v5.0 U.S. Department of Health and Human Services: National cancer institute Division of Cancer Treatment and Diagnosis. 2017. Available online: https://ctep.cancer.gov/protocolDevelopment/electronic_applications/ctc.htm#ctc_50 (accessed on 15 May 2020).
- Rohatgi, A. WebPlotDigitizer; Version 4.2; Pacifica: California, CA, USA, 2019. [Google Scholar]
- Cochrane. Handbook for Systematic Reviews of Interventions Version 6.0 (Updated July 2019). Cochrane. 2019. Available online: www.training.cochrane.org/handbookPacifica (accessed on 18 June 2020).
- Sterne, J.A.-O.; Savović, J.; Page, M.J.; Elbers, R.G.; Blencowe, N.S.; Boutron, I.; Cates, C.J.; Cheng, H.Y.; Corbett, M.S.; Eldridge, S.M.; et al. RoB 2: A revised tool for assessing risk of bias in randomised trials. BMJ 2019, 366, 4898. [Google Scholar] [CrossRef] [Green Version]
- Egger, M.; Smith, G.D.; Schneider, M.; Minder, C. Bias in meta-analysis detected by a simple, graphical test. BMJ 1997, 315, 629. [Google Scholar] [CrossRef] [PubMed] [Green Version]
- Peters, J.L.; Sutton, A.J.; Jones, D.R.; Abrams, K.R.; Rushton, L. Contour-enhanced meta-analysis funnel plots help distinguish publication bias from other causes of asymmetry. J. Clin. Epidemiol. 2008, 61, 991–996. [Google Scholar] [CrossRef]
- Chaimani, A.; Higgins, J.P.T.; Mavridis, D.; Spyridonos, P.; Salanti, G. Graphical tools for network meta-analysis in STATA. PLoS ONE 2013, 8, e76654. [Google Scholar] [CrossRef] [PubMed]
- White, I.R. Network Meta-analysis. Stata J. 2015, 15, 951–985. [Google Scholar] [CrossRef] [Green Version]
- Wei, Y.; Royston, P. Reconstructing time-to-event data from published Kaplan-Meier curves. Stata J. 2017, 17, 786–802. [Google Scholar] [CrossRef] [Green Version]
- Crowther, M.J. Multilevel mixed-effects parametric survival analysis: Estimation, simulation, and application. Stata J. 2019, 19, 931–949. [Google Scholar] [CrossRef] [Green Version]
- De Jong, V.M.T.; Moons, K.G.M.; Riley, R.D.; Tudur Smith, C.; Marson, A.G.; Eijkemans, M.J.C.; Debray, T.P.A. Individual participant data meta-analysis of intervention studies with time-to-event outcomes: A review of the methodology and an applied example. Res. Synth. Methods 2020, 11, 148–168. [Google Scholar] [CrossRef]
- Austin, P.C. A Tutorial on Multilevel Survival Analysis: Methods, Models and Applications. Int. Stat. Rev. 2017, 85, 185–203. [Google Scholar] [CrossRef] [PubMed]
- StataCorp. STATA Multilevel Mixed-Effects Reference Manual Release 16; Stata Press Publication: College Station, TX, USA, 2019. [Google Scholar]
- Higgins, J.P.; Jackson, D.; Barrett, J.K.; Lu, G.; Ades, A.E.; White, I.R. Consistency and inconsistency in network meta-analysis: Concepts and models for multi-arm studies. Res. Synth. Methods 2012, 3, 98–110. [Google Scholar] [CrossRef] [PubMed] [Green Version]
- Buzdar, A.U.; Ibrahim, N.K.; Francis, D.; Booser, D.J.; Thomas, E.S.; Theriault, R.L.; Pusztai, L.; Green, M.C.; Arun, B.K.; Giordano, S.H.; et al. Significantly higher pathologic complete remission rate after neoadjuvant therapy with trastuzumab, paclitaxel, and epirubicin chemotherapy: Results of a randomized trial in human epidermal growth factor receptor 2-positive operable breast cancer. J. Clin. Oncol. 2005, 23, 3676–3685. [Google Scholar] [CrossRef] [PubMed]
- Buzdar, A.U.; Valero, V.; Ibrahim, N.K.; Francis, D.; Broglio, K.R.; Theriault, R.L.; Pusztai, L.; Green, M.C.; Singletary, S.E.; Hunt, K.K.; et al. Neoadjuvant therapy with paclitaxel followed by 5-fluorouracil, epirubicin, and cyclophosphamide chemotherapy and concurrent trastuzumab in human epidermal growth factor receptor 2-positive operable breast cancer: An update of the initial randomized study population and data of additional patients treated with the same regimen. Clin. Cancer Res. 2007, 13, 228–233. [Google Scholar] [PubMed] [Green Version]
- Guarneri, V.; Frassoldati, A.; Bottini, A.; Cagossi, K.; Bisagni, G.; Sarti, S.; Ravaioli, A.; Cavanna, L.; Giardina, G.; Musolino, A.; et al. Preoperative chemotherapy plus trastuzumab, lapatinib, or both in human epidermal growth factor receptor 2-positive operable breast cancer: Results of the randomized phase II CHER-LOB study. J. Clin. Oncol. 2012, 30, 1989–1995. [Google Scholar] [CrossRef] [PubMed]
- Pierga, J.Y.; Delaloge, S.; Espié, M.; Brain, E.; Sigal-Zafrani, B.; Mathieu, M.C.; Bertheau, P.; Guinebretiére, J.M.; Spielmann, M.; Savignoni, A.; et al. A multicenter randomized phase II study of sequential epirubicin/cyclophosphamide followed by docetaxel with or without celecoxib or trastuzumab according to HER2 status, as primary chemotherapy for localized invasive breast cancer patients. Breast Cancer Res. Treat. 2010, 122, 429–437. [Google Scholar] [CrossRef]
- Giacchetti, S.; Hamy, A.S.; Delaloge, S.; Brain, E.; Berger, F.; Sigal-Zafrani, B.; Mathieu, M.C.; Bertheau, P.; Guinebretière, J.M.; Saghatchian, M.; et al. Long-term outcome of the REMAGUS 02 trial, a multicenter randomised phase II trial in locally advanced breast cancer patients treated with neoadjuvant chemotherapy with or without celecoxib or trastuzumab according to HER2 status. Eur. J. Cancer 2017, 75, 323–332. [Google Scholar] [CrossRef] [PubMed]
- Chang, H.R.; Glaspy, J.; Allison, M.A.; Kass, F.C.; Elashoff, R.; Chung, D.U.; Gornbein, J. Differential response of triple-negative breast cancer to a docetaxel and carboplatin-based neoadjuvant treatment. Cancer 2010, 116, 4227–4237. [Google Scholar] [CrossRef]
- Gianni, L.; Eiermann, W.; Semiglazov, V.; Manikhas, A.; Lluch, A.; Tjulandin, S.; Zambetti, M.; Vazquez, F.; Byakhow, M.; Lichinitser, M.; et al. Neoadjuvant chemotherapy with trastuzumab followed by adjuvant trastuzumab versus neoadjuvant chemotherapy alone, in patients with HER2-positive locally advanced breast cancer (the NOAH trial): A randomised controlled superiority trial with a parallel HER2-negative cohort. Lancet 2010, 375, 377–384. [Google Scholar]
- Semiglazov, V.; Eiermann, W.; Zambetti, M.; Manikhas, A.; Bozhok, A.; Lluch, A.; Tjulandin, S.; Sabadell, M.D.; Caballero, A.; Valagussa, P.; et al. Surgery following neoadjuvant therapy in patients with HER2-positive locally advanced or inflammatory breast cancer participating in the NeOAdjuvant Herceptin (NOAH) study. Eur. J. Surg. Oncol. 2011, 37, 856–863. [Google Scholar] [CrossRef]
- Gianni, L.; Eiermann, W.; Semiglazov, V.; Lluch, A.; Tjulandin, S.; Zambetti, M.; Moliterni, A.; Vazquez, F.; Byakhov, M.J.; Lichinitser, M.; et al. Neoadjuvant and adjuvant trastuzumab in patients with HER2-positive locally advanced breast cancer (NOAH): Follow-up of a randomised controlled superiority trial with a parallel HER2-negative cohort. Lancet Oncol. 2014, 15, 640–647. [Google Scholar] [CrossRef]
- Gianni, L.; Pienkowski, T.; Im, Y.H.; Roman, L.; Tseng, L.M.; Liu, M.C.; Lluch, A.; Staroslawska, E.; de la Haba-Rodriguez, J.; Im, S.A.; et al. Efficacy and safety of neoadjuvant pertuzumab and trastuzumab in women with locally advanced, inflammatory, or early HER2-positive breast cancer (NeoSphere): A randomised multicentre, open-label, phase 2 trial. Lancet Oncol. 2012, 13, 25–32. [Google Scholar] [CrossRef]
- Untch, M.; Loibl, S.; Bischoff, J.; Eidtmann, H.; Kaufmann, M.; Blohmer, J.U.; Hilfrich, J.; Strumberg, D.; Fasching, P.A.; Kreienberg, R.; et al. Lapatinib versus trastuzumab in combination with neoadjuvant anthracycline-taxane-based chemotherapy (GeparQuinto, GBG 44): A randomised phase 3 trial. Lancet Oncol. 2012, 13, 135–144. [Google Scholar] [CrossRef]
- Baselga, J.; Bradbury, I.; Eidtmann, H.; Di Cosimo, S.; De Azambuja, E.; Aura, C.; Gómez, H.; Dinh, P.; Fauria, K.; Van Dooren, V.; et al. Lapatinib with trastuzumab for HER2-positive early breast cancer (NeoALTTO): A randomised, open-label, multicentre, phase 3 trial. Lancet 2012, 379, 633–640. [Google Scholar] [CrossRef] [Green Version]
- Criscitiello, C.; Azim, H.A.; Agbor-tarh, D.; de Azambuja, E.; Piccart, M.; Baselga, J.; Eidtmann, H.; Di Cosimo, S.; Bradbury, I.; Rubio, I.T. Factors associated with surgical management following neoadjuvant therapy in patients with primary HER2-positive breast cancer: Results from the NeoALTTO phase III trial. Ann. Oncol. 2013, 24, 1980–1985. [Google Scholar] [CrossRef]
- Huober, J.; Holmes, E.; Baselga, J.; de Azambuja, E.; Untch, M.; Fumagalli, D.; Sarp, S.; Lang, I.; Smith, I.; Boyle, F.; et al. Survival outcomes of the NeoALTTO study (BIG 1–06): Updated results of a randomised multicenter phase III neoadjuvant clinical trial in patients with HER2-positive primary breast cancer. Eur. J. Cancer 2019, 118, 169–177. [Google Scholar] [CrossRef] [PubMed]
- Robidoux, A.; Tang, G.; Rastogi, P.; Geyer, C.E.; Azar, C.A.; Atkins, J.N.; Fehrenbacher, L.; Bear, H.D.; Baez-Diaz, L.; Sarwar, S.; et al. Lapatinib as a component of neoadjuvant therapy for HER2-positive operable breast cancer (NSABP protocol B-41): An open-label, randomised phase 3 trial. Lancet Oncol. 2013, 14, 1183–1192. [Google Scholar] [CrossRef]
- Holmes, F.A.; Espina, V.; Liotta, L.A.; Nagarwala, Y.M.; Danso, M.; McIntyre, K.J.; Osborne, C.R.C.; Anderson, T.; Krekow, L.; Blum, J.L.; et al. Pathologic complete response after preoperative anti-HER2 therapy correlates with alterations in PTEN, FOXO, phosphorylated Stat5, and autophagy protein signaling. BMC Res. Notes 2013, 6, 507. [Google Scholar] [CrossRef] [Green Version]
- Steger, G.G.; Greil, R.; Lang, A.; Rudas, M.; Fitzal, F.; Mlineritsch, B.; Hartmann, B.L.; Bartsch, R.; Melbinger, E.; Hubalek, M.; et al. Epirubicin and docetaxel with or without capecitabine as neoadjuvant treatment for early breast cancer: Final results of a randomized phase III study (ABCSG-24). Ann. Oncol. 2014, 25, 366–371. [Google Scholar] [CrossRef] [PubMed]
- Alba, E.; Albanell, J.; de la Haba, J.; Barnadas, A.; Calvo, L.; Sánchez-Rovira, P.; Ramos, M.; Rojo, F.; Burgués, O.; Carrasco, E.; et al. Trastuzumab or lapatinib with standard chemotherapy for HER2-positive breast cancer: Results from the GEICAM/2006-14 trial. Br. J. Cancer 2014, 110, 1139–1147. [Google Scholar] [CrossRef] [Green Version]
- Bonnefoi, H.; Jacot, W.; Saghatchian, M.; Moldovan, C.; Venat-Bouvet, L.; Zaman, K.; Matos, E.; Petit, T.; Bodmer, A.; Quenel-Tueux, N.; et al. Neoadjuvant treatment with docetaxel plus lapatinib, trastuzumab, or both followed by an anthracycline-based chemotherapy in HER2-positive breast cancer: Results of the randomised phase II EORTC 10054 study. Ann. Oncol. 2015, 26, 325–332. [Google Scholar] [CrossRef] [PubMed]
- Carey, L.A.; Berry, D.A.; Cirrincione, C.T.; Barry, W.T.; Pitcher, B.N.; Harris, L.N.; Ollila, D.W.; Krop, I.E.; Henry, N.L.; Weckstein, D.J.; et al. Molecular heterogeneity and response to neoadjuvant human epidermal growth factor receptor 2 targeting in CALGB 40601, a randomized phase III trial of paclitaxel plus trastuzumab with or without lapatinib. J. Clin. Oncol. 2016, 34, 542–549. [Google Scholar] [CrossRef] [PubMed] [Green Version]
- Nitz, U.A.; Gluz, O.; Christgen, M.; Grischke, E.M.; Augustin, D.; Kuemmel, S.; Braun, M.; Potenberg, J.; Kohls, A.; Krauss, K.; et al. De-escalation strategies in HER2-positive early breast cancer (EBC): Final analysis of the WSG-ADAPT HER2+/HR- phase II trial: Efficacy, safety, and predictive markers for 12 weeks of neoadjuvant dual blockade with trastuzumab and pertuzumab ± weekly paclitaxel. Ann. Oncol. 2017, 28, 2768–2772. [Google Scholar] [PubMed]
- Hurvitz, S.A.; Martin, M.; Symmans, W.F.; Jung, K.H.; Huang, C.S.; Thompson, A.M.; Harbeck, N.; Valero, V.; Stroyakovskiy, D.; Wildiers, H.; et al. Neoadjuvant trastuzumab, pertuzumab, and chemotherapy versus trastuzumab emtansine plus pertuzumab in patients with HER2-positive breast cancer (KRISTINE): A randomised, open-label, multicentre, phase 3 trial. Lancet Oncol. 2018, 19, 115–126. [Google Scholar] [CrossRef]
- Shao, Z.; Pang, D.; Yang, H.; Li, W.; Wang, S.; Cui, S.; Liao, N.; Wang, Y.; Wang, C.; Chang, Y.C.; et al. Efficacy, Safety, and Tolerability of Pertuzumab, Trastuzumab, and Docetaxel for Patients with Early or Locally Advanced ERBB2-Positive Breast Cancer in Asia: The PEONY Phase 3 Randomized Clinical Trial. JAMA Oncol. 2019, 6, e193692. [Google Scholar] [CrossRef]
- Hurvitz, S.A.; Martin, M.; Jung, K.H.; Huang, C.S.; Harbeck, N.; Valero, V.; Stroyakovskiy, D.; Wildiers, H.; Campone, M.; Boileau, J.F.; et al. Neoadjuvant trastuzumab emtansine and pertuzumab in human epidermal growth factor receptor 2–positive breast cancer: Three-year outcomes from the phase III KristinE study. J. Clin. Oncol. 2019, 37, 2206–2216. [Google Scholar] [CrossRef]
- Hurvitz, S.A.; Caswell-Jin, J.L.; McNamara, K.L.; Zoeller, J.J.; Bean, G.R.; Dichmann, R.; Perez, A.; Patel, R.; Zehngebot, L.; Allen, H.; et al. Pathologic and molecular responses to neoadjuvant trastuzumab and/or lapatinib from a phase II randomized trial in HER2-positive breast cancer (TRIO-US B07). Nat. Commun. 2020, 11, 5824. [Google Scholar] [CrossRef] [PubMed]
- Hatschek, T.; Foukakis, T.; Bjöhle, J.; Lekberg, T.; Fredholm, H.; Elinder, E.; Bosch, A.; Pekar, G.; Lindman, H.; Schiza, A.; et al. Neoadjuvant Trastuzumab, Pertuzumab, and Docetaxel vs. Trastuzumab Emtansine in Patients with ERBB2-Positive Breast Cancer: A Phase 2 Randomized Clinical Trial. JAMA Oncol. 2021, 7, 1360–1367. [Google Scholar] [CrossRef]
- Fernandez-Martinez, A.; Krop, I.E.; Hillman, D.W.; Polley, M.Y.; Parker, J.S.; Huebner, L.; Hoadley, K.A.; Shepherd, J.; Tolaney, S.; Henry, N.L.; et al. Survival, Pathologic Response, and Genomics in CALGB 40601 (Alliance), a Neoadjuvant Phase III Trial of Paclitaxel-Trastuzumab With or Without Lapatinib in HER2-Positive Breast Cancer. J. Clin. Oncol. 2020, 38, 4184–4193. [Google Scholar] [CrossRef] [PubMed]
- Guarneri, V.; Dieci, M.V.; Griguolo, G.; Miglietta, F.; Girardi, F.; Bisagni, G.; Generali, D.G.; Cagossi, K.; Sarti, S.; Frassoldati, A.; et al. Trastuzumab-lapatinib as neoadjuvant therapy for HER2-positive early breast cancer: Survival analyses of the CHER-Lob trial. Eur. J. Cancer 2021, 153, 133–141. [Google Scholar] [CrossRef]
- Murphy, C.G.; Morris, P.G. Recent advances in novel targeted therapies for HER2-positive breast cancer. Anticancer Drugs 2012, 23, 765–776. [Google Scholar] [CrossRef] [PubMed]
- Oostra, D.R.; Macrae, E.R. Role of trastuzumab emtansine in the treatment of HER2-positive breast cancer. Breast Cancer 2014, 6, 103–113. [Google Scholar] [CrossRef] [PubMed] [Green Version]
- Holmes, F.A.; Nagarwala, Y.M.; Espina, V.A.; Liotta, L.A.; Danso, M.A.; Gallagher, R.I.; McIntyre, K.; Osborne, C.R.C.; Mahoney, J.M.; Florance, A.M.; et al. Correlation of molecular effects and pathologic complete response to preoperative lapatinib and trastuzumab, separately and combined prior to neoadjuvant breast cancer chemotherapy. J. Clin. Oncol. 2011, 29 (Suppl. S15), 506. [Google Scholar] [CrossRef]
- The Lancet. Trastuzumab emtansine and cost-based decision making. Lancet 2017, 389, 2. [Google Scholar] [CrossRef]
- De Mattos-Arruda, L.; Shen, R.; Reis-Filho, J.S.; Cortés, J. Translating neoadjuvant therapy into survival benefits: One size does not fit all. Nat. Rev. Clin. Oncol. 2016, 13, 566–579. [Google Scholar] [CrossRef] [PubMed] [Green Version]
- Spring, L.M.; Fell, G.; Arfe, A.; Sharma, C.; Greenup, R.A.; Reynolds, K.L.; Smith, B.L.; Alexander, B.M.; Moy, B.; Isakoff, S.J.; et al. Pathological complete response after neoadjuvant chemotherapy and impact on breast cancer recurrence and survival: A comprehensive meta-analysis. Clin. Cancer Res. 2020, 26, 2838–2848. [Google Scholar] [CrossRef]
- Yee, D.; DeMichele, A.M.; Yau, C.; Isaacs, C.; Symmans, W.F.; Albain, K.S.; Chen, Y.Y.; Krings, G.; Wei, S.; Harada, S.; et al. Association of Event-Free and Distant Recurrence–Free Survival With Individual-Level Pathologic Complete Response in Neoadjuvant Treatment of Stages 2 and 3 Breast Cancer: Three-Year Follow-up Analysis for the I-SPY2 Adaptively Randomized Clinical Trial. JAMA Oncol. 2020, 6, 1355–1362. [Google Scholar] [PubMed]
- Saad, E.D.; Squifflet, P.; Burzykowski, T.; Quinaux, E.; Delaloge, S.; Mavroudis, D.; Perez, E.; Piccart-Gebhart, M.; Schneider, B.P.; Slamon, D.; et al. Disease-free survival as a surrogate for overall survival in patients with HER2-positive, early breast cancer in trials of adjuvant trastuzumab for up to 1 year: A systematic review and meta-analysis. Lancet Oncol. 2019, 20, 361–370. [Google Scholar] [CrossRef]


| Study | Country | Total Participants | Regimen | No. Per Arm | Age (Yrs) Median (Range) | Stage of Breast Cancer | Median Size of Tumor (mm) | T Stage | % Nodal Positive | % Hormone Receptor Negative | %Pre-menopausal | % Withdrawal | % Discontinuation of Treatment | Funding Source | |||||
|---|---|---|---|---|---|---|---|---|---|---|---|---|---|---|---|---|---|---|---|
| I | II | III | T1 | T2 | T3 | T4 | |||||||||||||
| Buzdar et al., 2005, Buzdar et al., 2007 [29,30] | USA | 42 | C | 19 | 48 (25–75) | - | - | - | - | 2 | 13 | 4 | 0 | 63 | 42 | - | NR | NR | Genentech, Pfizer, and Bristol Myers Squibb |
| TC | 23 | 52 (29–71) | - | - | - | - | 2 | 15 | 5 | 1 | 57 | 43 | - | NR | NR | ||||
| CHERLOB (2012, 2021) [31,56] | Italy | 121 | TC | 36 | 50 (34–65) | - | 30 | 6 | 30 | - | - | - | - | - | 42 | 47 | 0 (0%) | 0 (0%) | GSK |
| LC | 39 | 49 (34–68) | 32 | 23 | 30 | - | - | - | - | - | 38 | 39 | 1 (2.56%) | 12 (30.77%) | |||||
| LTC | 46 | 49 (26–65) | 13 | 9 | 35 | - | - | - | - | - | 39 | 42 | 1 (2.17%) | 8 (17.39%) | |||||
| REMAGUS 02 (2010, 2017) [32,33] | France | 120 | C | 58 | - | - | - | - | - | - | 27 | 31 (T3/T4) | 67 | 36 | - | 0 (0%) | 0 (0%) | French Programme Hospitalier de Recherche Clinique, Pfizer Inc. France, Roche Pharmaceutical, and Sanofi-Aventis. | |
| TC | 62 | - | - | - | - | - | - | 32 | 30 (T3/T4) | 60 | 45 | - | 0 (0%) | 5 (8.06%) | |||||
| Chang et al., 2010 [34] | USA | 30 | TC | 15 | - | - | - | - | - | - | - | - | - | - | - | - | NR | NR | RO1, Aventis, Genentech |
| C | 15 | - | - | - | - | - | - | - | - | - | - | - | NR | NR | |||||
| NOAH (2010, 2011, 2014) [35,36,37] | International | 235 | TC | 117 | - | - | - | - | - | - | - | - | 49 | 85 | - | - | 0 (0%) | 4 (3.42%) | F Hoff mann-La Roche |
| C | 118 | - | - | - | - | - | - | - | - | 51 | 84 | - | - | 0 (0%) | 9 (7.63%) | ||||
| NeoSphere (2012, 2016) [5,38] | International | 417 | TC | 107 | 50 (32–74) | - | - | - | 50 | - | - | - | - | 70 | 53 | - | 4 (3.74%) | 0 (0%) | F Hoff mann-La Roche |
| PTC | 107 | 50 (28–77) | - | - | - | 55 | - | - | - | - | 70 | 53 | - | 5 (4.67%) | 1 (0.93%) | ||||
| PT | 107 | 49 (22–80) | - | - | - | 50 | - | - | - | - | 70 | 52 | - | 14 (13.08%) | 0 (0%) | ||||
| PC | 96 | 49 (27–70) | - | - | - | 50 | - | - | - | - | 71 | 52 | - | 6 (6.25%) | 2 (2.08%) | ||||
| GeparQuinto, GBG 44 (2012, 2018) [12,39] | Germany | 615 | TC | 307 | 50 (25–74) | 5 | 159 | 141 | - | 51 | 180 | 17 | - | 68 | 45 | - | 0 (0%) | 32 (10.42%) | GSK, Roche, and Sanofi -Aventis |
| LC | 308 | 50 (21–73) | 3 | 141 | 152 | - | 45 | 184 | 18 | - | 68 | 44 | - | 0 (0%) | 51 (16.56%) | ||||
| NeoALTTO (2012, 2013, 2019) [40,41,42] | International | 455 | LC | 154 | 50 (42–56) | - | - | - | - | - | - | - | - | 49 | - | 5 (3.25%) | 47 (30.52%) | GSK | |
| TC | 149 | 49 (44–57) | - | - | - | - | - | - | - | - | 51 | - | 2 (1.34%) | 10 (6.71%) | |||||
| LTC | 152 | 50 (43–59) | - | - | - | - | - | - | - | - | 51 | - | 4 (2.63%) | 55 (36.18%) | |||||
| NSABP protocol B-41 (2013) [43] | USA | 529 | TC | 181 | - | - | - | - | - | - | 102 | 79 (T3/T4) | 51 | 31 | - | 2 (1.10%) | 40 (23%) | GSK | |
| LC | 174 | - | - | - | - | - | - | 81 | 93 (T3/T4) | 52 | 40 | - | 3 (1.72%) | 55 (35%) | |||||
| LTC | 174 | - | - | - | - | - | - | 88 | 86 (T3/T4) | 49 | 37 | - | 2 (1.15%) | 61 (37%) | |||||
| LPT109096 (2013) [44] | USA | 100 | TC | 33 | 51.1 (21–67) | - | - | - | - | - | 22 | 8 | 3 | 45 | - | 42 | 0 (0%) | 7 (21.21%) | GSK |
| LC | 34 | 52 (25–67) | - | - | - | - | - | 12 | 11 | 8 | 68 | - | 44 | 0 (0%) | 5 (14.71%) | ||||
| LTC | 33 | 49.2 (28–66) | - | - | - | - | - | 22 | 6 | 5 | 61 | - | 52 | 5 (15.15%) | 10 (30.30%) | ||||
| ABCSG-24 (2014) [45] | Austria | 93 | C | 49 | 48 (29–68) | - | - | - | - | 9 | 24 | 15 | 1 | 51 | 39 | 57 | NR | NR | Amgen Austria, Roche Austria, SanofiAventis Austria, and EBEWE Austria |
| TC | 44 | 50 (26–70) | - | - | - | - | 8 | 25 | 1 | 3 | 55 | 41 | 57 | NR | NR | ||||
| GEICAM/ 2006-14 (2014) [46] | Spain | 102 | TC | 50 | 48.5 (32–74) | - | - | - | 33 | 6 | 31 | 4 | 9 | 74 | 21 | 58 | 0 (0%) | 2 (4.0%) | GSK |
| LC | 52 | 48 (30–79) | - | - | - | 35 | 8 | 29 | 8 | 7 | 63 | 22 | 54 | 0 (0%) | 10 (19.23%) | ||||
| EORTC 10054 (2015) [47] | France, Europe | 128 | LC | 23 | 49.9 (27.3–68.5) | - | - | - | - | 1 | 11 | 8 | 3 | 70 | 36 | - | 1 (4.35%) | 4.5% | US National Cancer Institute, Fonds Cancer (FOCA) Belgium; Cancer Research UK and French Ligue Nationale Contre le Cancer, GSK |
| TC | 53 | 47 (25.3–68.9) | - | - | - | - | 0 | 24 | 19 | 10 | 66 | 48 | - | 1 (1.89%) | 9.4% | ||||
| LTC | 52 | (27.3–70.8) | - | - | - | - | 0 | 28 | 13 | 9 | 63 | 52 | - | 4 (7.69%) | 26% | ||||
| CALGB 40601 (2016, 2020) [48,55] | USA | 299 | LTC | 117 | 48 (24–70) | - | 80 | 37 | 40 | - | - | - | - | - | 40 | 62 | 1 (0.85%) | 26 (22.22%) | National Cancer Institute (NCI), GSK, and the University of North Carolina |
| TC | 118 | 50 (30–75) | - | 80 | 38 | 40 | - | - | - | - | - | 41 | 53 | 1 (0.85%) | 10 (8.47%) | ||||
| LC | 64 | 50 (25–74) | - | 47 | 17 | 40 | - | - | - | - | - | 44 | 56 | 2 (3.13%) | 23 (35.94%) | ||||
| WSG-ADAPT (2017) [49] | Germany | 134 | PT | 92 | 54 | - | - | - | - | 38 | 47 | 6 | 1 | 46 | 100 | - | 0 (0%) | 8 (8.70%) | Hoffmann la Roche |
| PTC | 42 | 51.5 | - | - | - | - | 17 | 22 | 3 | 0 | 38 | 100 | - | 0 (0%) | 4 (9.52%) | ||||
| KRISTINE (2018, 2019) [50,52] | International | 444 | T-DM1P | 223 | 50 (42–57) | - | - | - | - | - | - | - | - | - | 38 | - | 0 (0%) | 16 (7.17%) | Hoffmann-La Roche and Genentech |
| PTC | 221 | 49 (41–57) | - | - | - | - | - | - | - | - | - | 38 | - | 0 (0%) | 8 (3.62%) | ||||
| Teal study (2019) [10] | USA | 30 | T-DM1LC | 14 | 53.1 (29–70) | 8 | 6 | - | - | - | - | - | - | - | - | NR | NR | Celgene and Novartis | |
| PTC | 16 | 57.2 (40–75) | 7 | 9 | - | - | - | - | - | - | - | - | NR | NR | |||||
| PEONY (2019) [51] | China | 329 | PTC | 219 | 49 (24–72) | - | - | - | - | - | 155 | 45 | 19 | 27 | 48 | 60 | 1 (0.46%) | 4 (1.83%) | Hoffmann-La Roche |
| TC | 110 | 49 (27–70) | - | - | - | - | - | 71 | 29 | 10 | 19 | 49 | 59 | 0 (0%) | 2 (1.82%) | ||||
| Masuda et al., 2020 [11] | Japan | 204 | PTC | 51 | 53 (28–70) | 27.0 | 11 | 37 | 3 | 33 | 41 | 55 | 0 (0%) | 2 (3.92%) | Japan Breast Cancer Research Group (JBCRG). Chugai Pharmaceutical Co., Ltd. | ||||
| PTC_ T-DM1P | 52 | 53 (29–69) | - | - | - | 25.5 | 13 | 35 | 4 | - | 40 | 44 | 56 | 0 | 3 (5.77%) | ||||
| T-DM1PC | 101 | 52 (25–70) | - | - | - | 27 | 20 | 72 | 9 | - | 37 | 42 | 53 | 0 (0%) | 5 (4.95%) | ||||
| TRIO-US B07 (2020) [53] | USA | 128 | TC | 34 | 48 | 2 | 20 | 12 | 55.4 | - | - | - | - | - | 41 | - | 0 (0%) | 0 (0%) | Sanofi aventis and GSK |
| LC | 36 | 51 | 1 | 28 | 7 | 51.6 | - | - | - | - | - | 50 | - | 0 (0%) | 10 (27.78%) | ||||
| LTC | 58 | 47 | 3 | 38 | 17 | 41.5 | - | - | - | - | - | 41 | - | 0 (0%) | 15 (25.86%) | ||||
| Hatschek et al. (2021) [54] | Sweden | 198 | PTC | 99 | 51 | - | - | - | - | 14 | 63 | 17 | - | 61.6 | 33 | 50.5 | 0 (0%) | 17 (17.17%) | Region Stockholm, Karolinska Institutet, Swedish Research Council, Swedish Cancer Society, Roche Sweden |
| T-DM1 | 99 | 53 | - | - | - | - | 20 | 61 | 17 | - | 50.5 | 40 | 46.8 | 1 (1.01%) | 9 (9.09%) | ||||
| Risk Ratio (95% Confidence Intervals) | |||||||||||
|---|---|---|---|---|---|---|---|---|---|---|---|
| C | 1.81 (1.32, 2.48) | 1.51 (0.79, 2.87) | 1.34 (0.94, 1.91) | 1.11 (0.65, 1.92) | 2.57 (1.48, 4.45) | 3.22 (2.04, 5.09) | 2.24 (1.58, 3.18) | 4.42 (2.25, 8.67) | 3.25 (1.80, 5.88) | 4.03 (2.22, 7.30) | 3.08 (1.68, 5.62) |
| 1.08 (0.79,1.48) | TC | 0.83 (0.47, 1.46) | 0.74 (0.63, 0.87) | 0.61 (0.39, 0.96) | 1.42 (0.90, 2.22) | 1.78 (1.28, 2.48) | 1.23 (1.06, 1.44) | 2.44 (1.34, 4.43) | 1.79 (1.09, 2.97) | 2.22 (1.34, 3.68) | 1.70 (1.02, 2.84) |
| 1.13 (0.64, 2.00) | 1.04 (0.64, 1.68) | PC | 0.89 (0.49, 1.59) | 0.74 (0.41, 1.33) | 1.70 (0.93, 3.12) | 2.14 (1.27, 3.61) | 1.48 (0.83, 2.66) | 2.93 (1.42, 6.03) | 2.16 (1.13, 4.12) | 2.67 (1.40, 5.11) | 2.04 (1.06, 3.93) |
| 1.42 (0.94, 2.14) | 1.31 (1.01, 1.70) | 1.26 (0.73, 2.17) | LC | 0.83 (0.52, 1.33) | 1.92 (1.19, 3.10) | 2.41 (1.66, 3.48) | 1.67 (1.40, 1.99) | 3.30 (1.78, 6.13) | 2.43 (1.43, 4.12) | 3.01 (1.77, 5.12) | 2.30 (1.34, 3.94) |
| 0.08 (0.03, 0.23) | 0.07 (0.02, 0.21) | 0.07 (0.02, 0.20) | 0.05 (0.02, 0.16) | PT | 2.31 (1.47, 3.61) | 2.89 (2.08, 4.01) | 2.01 (1.26, 3.21) | 3.96 (2.18, 7.19) | 2.92 (1.77, 4.82) | 3.62 (2.19, 5.98) | 2.76 (1.65, 4.61) |
| 0.21 (0.10, 0.44) | 0.19 (0.10, 0.38) | 0.19 (0.09, 0.40) | 0.15 (0.07, 0.31) | 2.71 (0.81, 9.06) | TDM1P | 1.25 (0.92, 1.70) | 0.87 (0.54, 1.40) | 1.72 (0.96, 3.08) | 1.27 (0.78, 2.06) | 1.57 (0.96, 2.55) | 1.20 (0.73, 1.97) |
| 1.04 (0.64, 1.68) | 0.96 (0.66, 1.38) | 0.92 (0.56, 1.50) | 0.73 (0.46, 1.15) | 13.31 (4.60, 38.52) | 4.91 (2.77, 8.68) | PTC | 0.69 (0.48, 1.00) | 1.37 (0.83, 2.25) | 1.01 (0.69, 1.47) | 1.25 (0.86, 1.83) | 0.96 (0.64, 1.42) |
| 1.52 (0.99, 2.35) | 1.40 (1.04, 1.89) | 1.35 (0.77, 2.37) | 1.07 (0.85, 1.35) | 19.55 (6.52, 58.63) | 7.21 (3.44, 15.10) | 1.47 (0.92, 2.35) | LTC | 1.97 (1.06, 3.66) | 1.45 (0.86, 2.46) | 1.80 (1.06, 3.05) | 1.38 (0.80, 2.35) |
| 2.37 (0.22, 25.64) | 2.18 (0.21, 23.19) | 2.10 (0.19, 22.78) | 1.67 (0.15, 17.99) | 30.41 (2.34, 395.23) | 11.21 (1.01, 123.92) | 2.29 (0.22, 23.58) | 1.56 (0.14, 16.83) | T-DM1LC | 0.74 (0.39, 1.38) | 0.91 (0.49, 1.71) | 0.70 (0.37, 1.31) |
| 0.52 (0.26, 1.06) | 0.48 (0.26, 0.91) | 0.46 (0.23, 0.94) | 0.37 (0.19, 0.73) | 6.72 (2.06, 21.89) | 2.48 (1.15, 5.34) | 0.50 (0.30, 0.85) | 0.34 (0.17, 0.69) | 0.22 (0.02, 2.41) | T-DM1PC | 1.24 (0.88, 1.74) | 0.95 (0.55, 1.63) |
| 0.94 (0.48, 1.87) | 0.87 (0.47, 1.60) | 0.84 (0.42, 1.67) | 0.67 (0.34, 1.29) | 12.14 (3.77, 39.07) | 4.48 (2.12, 9.47) | 0.91 (0.56, 1.48) | 0.62 (0.32, 1.22) | 0.40 (0.04, 4.33) | 1.81 (1.07, 3.05) | PTC_T-DM1P | 0.76 (0.44, 1.32) |
| 0.27 (0.11, 0.66) | 0.25 (0.10, 0.58) | 0.24 (0.09, 0.59) | 0.19 (0.08, 0.46) | 3.41 (0.91, 12.74) | 1.26 (0.48, 3.30) | 0.26 (0.12, 0.56) | 0.17 (0.07, 0.43) | 0.11 (0.01, 1.31) | 0.51 (0.20, 1.29) | 0.28 (0.11, 0.70) | T-DM1 |
| Treatment Regimen | Predicted Median DFS (Months) | Hazard Ratio | 95% Confidence Interval | p-Value |
|---|---|---|---|---|
| TC | 173.23 | 1 | - | - |
| C | 100.92 | 1.70 | 1.15–2.51 | 0.008 |
| PC | 128.67 | 1.34 | 0.78–2.29 | 0.291 |
| LC | 155.27 | 1.11 | 0.87–1.43 | 0.403 |
| PT | 124.69 | 1.38 | 0.82–2.33 | 0.228 |
| PTC | 327.84 | 0.54 | 0.32–0.91 | 0.02 |
| LTC | 203.96 | 0.85 | 0.60–1.22 | 0.378 |
| T-DM1P | 144.18 | 1.20 | 0.61–2.33 | 0.598 |
| T-DM1 | 243.35 | 0.72 | 0.30–1.72 | 0.457 |
Publisher’s Note: MDPI stays neutral with regard to jurisdictional claims in published maps and institutional affiliations. |
© 2022 by the authors. Licensee MDPI, Basel, Switzerland. This article is an open access article distributed under the terms and conditions of the Creative Commons Attribution (CC BY) license (https://creativecommons.org/licenses/by/4.0/).
Share and Cite
Gunasekara, A.D.M.; Anothaisintawee, T.; Youngkong, S.; Ha, N.T.; McKay, G.J.; Attia, J.; Thakkinstian, A. Neoadjuvant Treatment with HER2-Targeted Therapies in HER2-Positive Breast Cancer: A Systematic Review and Network Meta-Analysis. Cancers 2022, 14, 523. https://doi.org/10.3390/cancers14030523
Gunasekara ADM, Anothaisintawee T, Youngkong S, Ha NT, McKay GJ, Attia J, Thakkinstian A. Neoadjuvant Treatment with HER2-Targeted Therapies in HER2-Positive Breast Cancer: A Systematic Review and Network Meta-Analysis. Cancers. 2022; 14(3):523. https://doi.org/10.3390/cancers14030523
Chicago/Turabian StyleGunasekara, Agampodi Danushi M., Thunyarat Anothaisintawee, Sitaporn Youngkong, Nguyen T. Ha, Gareth J. McKay, John Attia, and Ammarin Thakkinstian. 2022. "Neoadjuvant Treatment with HER2-Targeted Therapies in HER2-Positive Breast Cancer: A Systematic Review and Network Meta-Analysis" Cancers 14, no. 3: 523. https://doi.org/10.3390/cancers14030523