Article

Circulating Proteins Associated with Response and Resistance to Neoadjuvant Chemotherapy in HER2-Positive Breast Cancer

by
María del Pilar Chantada-Vázquez
1,2,
Mercedes Conde-Amboage
3,4,
Lucía Graña-López
5,6,
Sergio Vázquez-Estévez
7,
Susana B. Bravo
2,* and
Cristina Núñez
1,*
1
Research Unit, Lucus Augusti University Hospital (HULA), Servizo Galego de Saúde (SERGAS), 27002 Lugo, Spain
2
Proteomic Unit, Health Research Institute of Santiago de Compostela (IDIS), University Clinical Hospital of Santiago de Compostela (CHUS), 15706 Santiago de Compostela, Spain
3
Models of Optimization Decision, Statistics and Applications Research Group (MODESTYA), Department of Statistics, Mathematical Analysis and Optimization, Universidade de Santiago de Compostela, 15782 Santiago de Compostela, Spain
4
CITMAga, 15782 Santiago de Compostela, Spain
5
Breast Pathology Group, Lucus Augusti University Hospital (HULA)-IDIS, Servizo Galego de Saúde (SERGAS), 27002 Lugo, Spain
6
Radiology Department, Lucus Augusti University Hospital (HULA), Servizo Galego de Saúde (SERGAS), 27002 Lugo, Spain
7
Oncology Division, Lucus Augusti University Hospital (HULA), Servizo Galego de Saúde (SERGAS), 27002 Lugo, Spain
*
Authors to whom correspondence should be addressed.
Cancers 2022, 14(4), 1087; https://doi.org/10.3390/cancers14041087
Submission received: 24 December 2021 / Revised: 24 January 2022 / Accepted: 16 February 2022 / Published: 21 February 2022
(This article belongs to the Special Issue Circulating Biomarkers in Cancer)

Abstract

:

Simple Summary

The goal of this study was to find circulating proteins that can be easily sampled and incorporated into a clinical setting to improve predictive treatment response in HER2-positive breast cancer patients receiving neoadjuvant chemotherapy. We looked for potential biomarkers in serum, which we identified using two proteomics techniques: qualitative LC-MS/MS and a quantitative assay that assessed protein expression between responders and non-responders HER2-positive breast cancer patients to neoadjuvant chemotherapy.

Abstract

Despite the increasing use of neoadjuvant chemotherapy (NAC) in HER2-positive breast cancer (BC) patients, the clinical problem of predicting individual treatment response remains unanswered. Furthermore, the use of ineffective chemotherapeutic regimens should be avoided. Serum biomarker levels are being studied more and more for their ability to predict therapy response and aid in the development of personalized treatment regimens. This study aims to identify effective protein networks and biomarkers to predict response to NAC in HER2-positive BC patients through an exhaustive large-scale LC-MS/MS-based qualitative and quantitative proteomic profiling of serum samples from responders and non-responders. Serum samples from HER2-positive BC patients were collected before NAC and were processed by three methods (with and without nanoparticles). The qualitative analysis revealed differences in the proteomic profiles between responders and non-responders, mainly in proteins implicated in the complement and coagulation cascades and apolipoproteins. Qualitative analysis confirmed that three proteins (AFM, SERPINA1, APOD) were correlated with NAC resistance. In this study, we show that serum biomarker profiles can predict treatment response and outcome in the neoadjuvant setting. If these findings are further developed, they will be of significant clinical utility in the design of treatment regimens for individual BC patients.

Graphical Abstract

1. Introduction

For an increasing number of breast cancer (BC) patients, neoadjuvant chemotherapy (NAC), or the administration of chemotherapy and other agents before surgery, is the first line of treatment [1]. Among BC subtypes, those with human epidermal growth factor receptor 2 (HER2) positivity have been shown to have a tumor biology and a greater likelihood of pathologic complete response (pCR) when treated with NAC. Particularly, in HER2-positive breast tumors, neoadjuvant trastuzumab used in combination with standard chemotherapy can induce a 30% pCR rate [2,3,4].
With modern regimens incorporating dual anti-HER2 therapy with trastuzumab and pertuzumab, such as those used in the NeoSphere [5] and Tryphaena [6] trials, pCR rates range from 46% to 66%. This pCR rate was confirmed in the GeparSepto [7], KRISTINE [8], Symphony [9], and BERENICE [10] studies.
pCR is a surrogate marker for evaluating response to HER2-targeted NAC and a prognostic marker for survival in many studies, but pCR is not achieved in all patients. In the neoadjuvant setting, there are currently no clinically established pre-treatment predictors of response. Given the physical [11] and financial [12] costs of treatment, predictive indicators of HER2-targeted NAC response would be extremely useful in identifying patients who will benefit the most from neoadjuvant therapy and guiding the selection of the most effective techniques from the start [13].
A growing body of research implies that chemotherapy success is linked to the tumor’s molecular profile [14], as well as the host response to therapy [15]. In pre-therapeutic biopsies of tumor and adjacent host tissue, profiling methods have enabled genome- or proteome-wide searches for predictive and prognostic biomarkers [16,17,18,19].
For example, bulk gene expression profiling of pre-treatment tissue samples has identified tumor characteristics (HER2-enriched intrinsic subtype, HER2 expression levels, ESR1 expression levels [20,21,22,23,24], and microenvironmental characteristics (increased immune infiltration [22,24,25,26,27]) that are linked to the response to HER2-targeted therapy in the neoadjuvant setting.
As examples of tissue proteomic profiling studies, K.L. McNamara et al. [28] used a multiplex spatial proteomic biomarker to demonstrate substantial stratification of sensitive cancers early during neoadjuvant HER2-targeted therapy, with implications for tailoring subsequent therapy. M.H. Haugen et al. [29] determined by reverse-phase protein arrays (RPPA) a nine-protein signature score in tumor samples able to predict the response to neoadjuvant treatment with bevacizumab in combination with chemotherapy in HER2-negative BC. Y.-C. Chen et al. [30] found that the carboxyl-terminal modulator protein (CTMP) was a predictive biomarker for trastuzumab resistance in HER2-positive BC patients.
All these studies concentrated on tissue. However, tissue is not the ideal source of material for early diagnostic indicators because invasive sampling processes can injure or kill the organism being studied [31]. Recently, there has been a surge in interest in the identification and description of cancer diagnosis using noninvasive surrogate markers. Biomarkers in liquid biopsy have the following advantages: (a) they can detect a missing invasion; (b) they can be performed in ambulatory settings; (c) they can be checked repeatedly; and (d) they can be used for disease diagnosis and progression monitoring [32].
In this way, the variance of noncoding RNAs in serum was linked to clinical characteristics and progression, as well as the survival time of HER2-positive BC patients receiving trastuzumab-based therapy, according to several studies [33,34,35,36]. It was also discovered that HER2-positive BC patients with a serum HER2 ECD of more than 15 ng/mL [37,38], a greater carbonic anhydrase (CAIX) [38], or metalloproteinases [39] had shorter progression-free survival (PFS). In addition, increased fibrinogen levels in plasma were linked to a poor response to trastuzumab treatment in HER2-positive BC [40].
The diagnosis [41], monitoring [42], progression [43], and time prediction [44] of various malignancies have all been detailed using global quantitative proteomics analysis of blood samples to uncover possible biomarkers of the disease. However, to the authors’ knowledge, only one large-scale liquid chromatography-tandem mass spectrometry (LC–MS/MS)-based quantitative proteomic study was recently developed to find biomarkers of trastuzumab-based therapy resistance from the serum of HER2-positive BC cases [45].
Nanomaterials have been incorporated into the science of proteomics to create nanoproteomics, a new and fast-expanding research topic [46]. It is well understood that dispersing a nanomaterial in physiological fluid results in the formation of a protein shell known as a “protein corona” (PC). Disease-related biomarkers account for fewer than 1% of serum proteins. As a result of the PC formation, nanoparticles could act as sorbent materials of low-abundance proteins in serum samples before the biomarker identification via mass spectrometry (MS) analysis [47,48,49,50,51,52]. Characterization of the PC surrounding NPs has distinct advantages over sole proteomic approaches and increases the likelihood of identifying novel molecular biomarkers [53]. Thus, otherwise undetectable changes in the serum protein concentration of HER2-positive BC patients before NAC could be detected by analyzing the PC composition.
Particularly, the unique features of gold (AuNPs) [54] and platinum nanoparticles (PtNPs) [55] make them suitable sorbent nanomaterials with important biomedical applications. In the present study, the interaction of AuNPs (10.02 ± 0.91 nm) and PtNPs (2.40 ± 0.30 nm) with the sera of HER2-positive BC patients obtained before NAC allowed the pre-concentration of the low-abundance proteins through the PC formation. Then, an exhaustive large-scale LC-MS/MS-based qualitative and quantitative proteomic analysis of the PCs and the crude sera samples (without NPs) was carried out to explore potential circulating protein biomarkers useful to predict the therapeutic response of HER2-positive BC patients treated with NAC (see Figure 1). The results of this study could represent a useful tool to support clinical decision-making in HER2-positive BC patients.

2. Materials and Methods

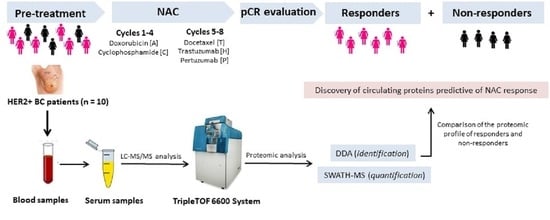
2.1. Patient Study Group

Ten patients with pathologically proven HER2 overexpressing BC diagnosed at HULA, who had undergone breast MRI for monitoring the response to NAC from June 2017 to December 2018 were enrolled in the present study. The clinical characteristics of the patient study group are presented in Table 1. See inclusion and exclusion criteria in the Supplemental Material (Annex 1).
Patients received a combination of NAC with AC regimen: doxorubicin ([A] 60 mg/m2 iv), cyclophosphamide ([C], 600 mg/m2 iv) on day one every three weeks for four cycles. Subsequently, they were administered the combination with THP scheme: docetaxel ([T] 75 mg/m2 iv), trastuzumab ([H], at the loading dose of 8 mg/kg iv and then 6 mg/kg iv), and pertuzumab ([P], at the loading dose of 840 mg/m2 iv, then 420 mg/m2 iv), on day one every three weeks for four cycles.
After NAC, all patients underwent surgery and surgical specimens were examined by a single pathologist, blinded to the study, who assessed the treatment response according to TNM [56]. Pathologic complete response (pCR) was defined as no residual invasive disease in both breast and axillary lymph nodes after NAC (ypT0/is, ypN0) at surgical resection.
After surgery, if invasive residual disease was detected, patients received adjuvant treatment with TDM-1 (3.6 mg/kg iv) on day 1 every 3 weeks for 14 cycles. If there was no presence of invasive residual disease, adjuvant treatment was with Trastuzumab at the doses previously described for 14 cycles.

2.2. Collection and Storage of Blood Serum

Blood samples from the ten HER2 overexpressing BC patients were obtained before NAC treatment. Eight milliliters of peripheral blood were collected in sterile VACUETTE® Serum Clot Activator Tubes. Blood was allowed to coagulate for up to 15 min at room temperature. Then, samples were centrifuged at 1800× g for 5 min at 4 °C, and serum samples were aliquoted and stored at −80 °C for the proteomic analysis. Before taking part in the study, all participants signed a written consent form.

2.3. Chemicals and Reagents

All reagents and solvents used were HPLC-grade or higher. Acrylamide/bis-acrylamide 30% solution (37.5:1), β-mercaptoethanol (molecular biology grade), chloroplatinic acid hexahydrate (≥37.50% Pt basis), Coomassie Brilliant Blue R250 (CBB), DL-dithiothreitol (DTT, 99%,), glycerol (86%–88%), iodoacetamide (IAA, 99%), sodium borohydride (99%), sodium citrate tribasic dihydrate (99%), sodium carbonate (99%), tris-base, trifluoroacetic acid (99%), trypsin from bovine pancreas, and the Sigma Marker wide range 6.5–200 KDa were purchased from Merck (Hohen-Brunn, Germany). Formaldehyde for molecular biology (36.5–38% in H2O) and sodium dodecyl sulfate (SDS) were purchased from Panreac (Barcelona, Spain). Bromophenol-blue was purchased from Riedel-de Haen (Seelze, Germany). Hydrogen tetrachloroaurate (III) hydrate (99.9%-Au) (49% Au) at 10% w/v was purchased from Strem Chemicals (Newburyport, MA, USA). Ammonium bicarbonate (AMBIC, 99.5%) and formic acid (95%) were purchased from Fluka (Steinheim, Germany).

2.4. Synthesis of Inorganic Nanoparticles

AuNPs (10.02 ± 0.91 nm) and PtNPs (2.40 ± 0.30 nm) were prepared following a citrate reduction method in an aqueous solution previously reported by our group [47]. See synthesis and characterization details in the Supplemental Material (Annex 2, Figures S1 and S2).

2.5. Instrumentation

For sodium dodecyl sulfate-polyacrylamide gel electrophoresis (SDS-PAGE) protein separation, a Power Pac Basic power supply from Bio-Rad (Hercules, CA, USA) was used. Protein quantification was accomplished by measuring absorbance at 280 nm with a Thermo Fisher Scientific QubitTM 4 Quantitation Starter Kit.

2.6. Depletion of Multiple High-Abundance Proteins in Serum Samples

A Miller-GP® Filter Unit (Millipore) with a size of 0.22 μm was used to filter human serum samples. Six aliquots of human serum (30 µL) from each patient were depleted with dithiothreitol (DTT), according to the protocol described by Warder et al. [57,58]. Fresh DTT 500 mM (3.3 µL) in milli-Q water was quickly mixed and vortexed with 30 µL of human serum. The samples were then incubated at room temperature for 60 min until a viscous white precipitate formed, followed by 20-min centrifugation at 18,840× g. Before the protein fractionation, the supernatants were transferred to a clean tube.

2.7. Isolation, Fractionation and Digestion of Low-Abundance Proteins

After the depletion of high-abundance proteins with DTT, n = 6 aliquots of serum from each patient were treated following three different approaches for the analysis of low-abundance proteins (candidate biomarkers).
Method 1:n = 2 aliquots were transferred directly to a 10% SDS-PAGE gel to initiate whole protein concentration/separation.
Method 2:n = 2 aliquots were alkylated with iodoacetic acid (IAA) at room temperature for 45 min and then protected from light. After protein reduction and alkylation, 75 μL of gold nanoparticles (AuNPs, 10.02 ± 0.91 nm) were added to each different aliquot, followed by the addition of 40 μL of citrate/citric acid buffer to a final pH of 5.8. The NPs–serum solutions were then incubated for 30 min at 37 °C with shaking in a thermostatic bath. Pellets were collected by centrifugation at 18,840× g for 30 min. Pellets containing proteins bound to nanoparticles were washed three times with a 25 L citrate/citric acid buffer before being centrifuged at 18,840× g for 30 min to remove unbound proteins.
Method 3: two aliquots (n = 2) were alkylated and incubated with platinum nanoparticles (PtNPs, 2.40 ± 0.30 nm), following the steps described in method 2 but increasing the centrifugation to 24,610× g.
Pellets from method 2 and method 3 were reconstituted and loaded on a 10% SDS-PAGE gel to initiate whole protein separation. The gel was stained, and the band was exscinded and submitted to an in-gel tryptic digestion method previously reported by our group [48,49,50,51,59].

2.8. Qualitative Proteomic Analysis by Mass Spectrometry (LC-MS/MS): Identification by Data-dependent Acquisition (DDA)

Following the conditions previously reported by our group [48,49,50,52], digested peptides of each sample were separated by reverse-phase chromatography (RPC), and protein identification was revealed using a nanoLC 400 system (Eksigent Tech., Dublin, CA, USA) coupled to a high-speed Triple TOF 6600 mass spectrometer (AB Sciex, Toronto, ON, Canada) with a microflow source. The analytical column used was a silica-based reversed phase column YMC-TRIART C18 150 × 0.30 mm, 3 mm particle size and 120 Å pore size (YMC Technologies, Teknokroma). The trap column was a YMC-TRIART C18 (YMC Technologies, Teknokroma) with a 3 mm particle size and 120 Å pore size, switched on-line with the analytical column. The loading pump delivered a solution of 0.1% formic acid in water at 10 μL/min. The micro-pump provided a flowrate of 5 μL/min and was operated under gradient elution conditions, using 0.1% formic acid in water as mobile phase A, and 0.1% formic acid in acetonitrile as mobile phase B. Peptides were separated using a 25 min gradient ranging from 2% to 90% mobile phase B (mobile phase A: 2% acetonitrile, 0.1% formic acid; mobile phase B: 100% acetonitrile, 0.1% formic acid). Injection volume was 4 μL.
Data acquisition was carried out in a TripleTOF 6600 System (SCIEX, Foster City, CA, USA) using a data dependent workflow. Source and interface conditions were as follows: ion spray voltage floating (ISVF) 5500 V, curtain gas (CUR) 25, collision energy (CE) 10, and ion source gas 1 (GS1) 25. The instrument was operated with Analyst TF 1.7.1 software (SCIEX, USA). Switching criteria was set to ions greater than mass to charge ratio (m/z) 350 and smaller than m/z 1400 with a charge state of 2–5, mass tolerance 250 ppm, and an abundance threshold of more than 200 counts (cps). Former target ions were excluded for 15 s. The instrument was automatically calibrated every 4 h using external calibrant tryptic peptides from PepcalMix (Sciex).
After the MS/MS acquisition, data files were processed using ProteinPilotTM 5.0.1 software (version 5.0.1; AB Sciex) which uses the algorithm ParagonTM for database search and ProgroupTM for data grouping. Data were searched using a human specific Uniprot database. A false discovery rate was performed using a non-lineal fitting method displaying only those results that reported a 1% Global false discovery rate or better [60,61].

2.9. Quantitative Proteomic Analysis by Sequential Window Acquisition of All Theoretical Mass Spectrometry (SWATH-MS)

Samples were analyzed following the methodology previously described by our group [48,50,52]. Briefly, two biological replicates of responders and non-responders samples were used to get extensive quantitative data by label-free SWATH-MS analysis. Peptides of all samples were analyzed with a micro-LC system Ekspert nLC425 (Eksigen, Dublin, CA, USA) coupled to a hybrid quadrupole-TOF mass spectrometer Triple TOF 6600 (Sciex, Redwood City, CA, USA). One of the first steps was the construction of the MS/MS spectral libraries. For that purpose, peptide solutions were analyzed by a shotgun data-dependent acquisition (DDA) approach by micro-LC-MS/MS. For spectral alignment and peak extraction the Peakview software (version 2.2; AB Sciex) was employed using the SWATH Acquisition MicroApp (version 2.0). Parameters used were: number of fragments = 7, number of peptides = 10, peptide confidence = 95%, XIC width = 30 ppm, XIC extraction window = 5 min. Exportation of the SWATH file to the MarkerView software (version 1.3.1; AB Sciex) allowed the quantitative analysis of ions, peptides, and proteins in the different samples. As output result, the summed intensity of ions for the peptide, summed intensity of the peptides for protein, and Area under Curve (AUC) of the ions were provided. Both test sets (responders and non-responders) were compared to generate fold change ratios. For protein quantitation, only peptides with a False Discovery Rate (FDR) below 1% were considered. To compare the data across samples, an unsupervised multivariate statistical analysis using Principal Component Analysis (PCA) was performed. The mean area sums of all the transitions derived for each protein in each sample will be used in a Student’s t-test to determine how well each variable distinguishes the two groups, which will be presented as a p-value. For each library, its set of differentially expressed proteins (p-value < 0.05) with a FCh > 1.1 or <0.8 was selected.

2.10. Protein Functional Interaction Network Analysis

The tool STRING v.10.0 database was used to analyze protein networks of functional interactions, incorporating direct (physical) and indirect protein–protein interactions (PPI) (http://string-db.org (accessed on 13 July 2021)) [62].

2.11. Statistical Analysis

All analyses were performed using SPSS Statistics 21.0 software (IBM, Armonk, NY, USA). As appropriate, a one- or two-tailed Student’s t-test or a Mann–Whitney U test was used. The statistical significance was defined as p < 0.05. Volcano plots and box plots were created with GraphPad Prism (GraphPad Software, San Diego, CA, USA) and a heat map was performed using http://www.heatmapper.ca/expression (accessed on 1 December 2021).

2.12. Development of the Classifiers

Different logistic regression models were adjusted to the data to determine the power of the different proteins to classify samples in the two categories that are considered. Associated with this model, receiver-operating characteristic (ROC) curves were generated and the area under the ROC curve (AUC), and the sensitivity and specificity at the “optimal” cutoff point for discrimination purposes between groups were obtained. All ROC analyses were performed using the R “pROC” package [63], where the optimal cutoff was selected so that the distance to the identity (diagonal) line was maximized, that is, max (sensitivities + specificities). AUCs 95% CIs were computed using Delong’s method [64] and the 95% CIs of the sensitivity and specificity values were computed with bootstrap resampling, see [65] for details. Moreover, to assess the robustness of the different proteins to classify, the “leave-one-out” cross-validation procedure was performed by applying to each measurement in the logistic regression model adjusted to the remaining sample of the dataset and afterwards performing the usual ROC analysis.

3. Results

3.1. Clinicopathological Features of Patients

In the present study, we collected serum from 10 primary HER2-positive BC cases receiving NAC at Hospital Universitario Lucus Augusti (HULA) with the experimental protocol approved by the Ethics Committee of this center. Blood samples were collected prior to patients receiving NAC and the patient characteristics were presented in Table 1. All patients’ HER2-positive status was determined using immunohistochemistry or fluorescence in situ hybridization coloration. Among all the patients, six patients acquiring a pCR were regarded as NAC response or “responders”, while four patients still had disease progression, defined as NAC resistance or “non-responders”, after neoadjuvant chemotherapy.

3.2. Proteomic Discovery Using the DDA Approach

Serum samples from responders (n = 6) and non-responders (n = 4) cases were then analyzed by mass spectrometry (LC-MS/MS) for protein identification to discover serum fingerprint proteins related to the NAC resistance/response in a parallel manner.
Previous studies have shown that there are thousands of large dynamic proteins in serum, ranging from extremely low-abundance proteins to high-abundance proteins, with the latter being able to mask the identification and determination of the low-abundance proteins following quantitative analysis [66].
First, we performed high-abundance proteins depletion with dithiothreitol (DTT) following the protocol previously published by our group [48,49,50,51]. From each patient, six aliquots of serum were taken and depleted with DTT and were treated with three different methods for the analysis of low-abundance proteins:
Method 1: Two aliquots were loaded directly onto a 10% SDS-PAGE gel to initiate whole protein concentration. Then, the gel was stained, the bands were excised and submitted to in-gel tryptic digestion (see experimental Section 2.7) before the proteomic analysis.
Method 2: Two aliquots were incubated with AuNPs (10.02 ± 0.91 nm).
Method 3: Two aliquots were incubated with PtNPs (2.40 ± 0.30 nm).
In method 2 and method 3, the protein concentration was promoted through the formation of the ex vivo protein corona around AuNPs and PtNPs. After that, proteins were separated from the NPs surface by gel electrophoresis following the procedure described in method 1.
As Table 2 shows, a total of 129, 61, and 56 proteins were identified by LC-MS/MS in all serum samples from responders (n = 6), and 138, 100, and 61 proteins were identified in all serum samples from non-responders (n = 4) with the sample treatment method 1, method 2, and method 3, respectively (see Table 2 and Tables S1–S3). After comparing the results obtained by the three methods, 43 and 54 proteins were commonly identified in responders and non-responders cases, respectively (see Table 2, Tables S4 and S5). From them, 40 proteins were commonly detected in responders and non-responders, three proteins were only identified in responders and 14 proteins in non-responders (see Table 3 and Figure 2).
To interpret global changes in the serum proteome linked to NAC response/resistance in HER2-positive BC patients, the 43 and 54 proteins commonly identified by the three methods in the serum of responders and non-responders before NAC, respectively, were analyzed using the STRING software (see Figure 2). The analysis revealed that 14 from 43 proteins identified in responders and 22 from 54 proteins identified in non-responders were associated with complement and coagulation cascades. From them, 14 proteins were commonly identified in the serum of both groups, and they could be subdivided into:
(a)
complements: complement C1q subcomponent subunit B (C1QB), complement C1q subcomponent subunit C (C1QC), complement C2 (C2), complement C3 (C3), complement C4-B (C4B), complement factor B (CFB);
(b)
serine protease related proteins: antithrombin-III (SERPINC1), alpha-2-antiplasmin (SERPINF2), plasma protease C1 inhibitor (SERPING1);
(c)
vitamin K-dependent proteins: vitamin K-dependent protein S (PROS1), and
(d)
glycoproteins: vitronectin (VTN),
(e)
other groups: alpha-2-macroglobulin (A2M), clusterin (CLU), and kininogen-1 (KNG1).
However, a cluster of eight proteins implicated in the complement and coagulation cascades was only observed in the profile of non-responders: C4b-binding protein alpha chain (C4BPA), complement C5 (C5), complement factor I (CFI), complement factor H (CFH), complement factor H-related protein 1 (CFHR1), alpha-1-antitrypsin (SERPINA1), prothrombin (F2), and plasminogen (PLG) (see Figure 2 and Table 3).
The second most abundant group of proteins identified in the serum samples of HER2-positive BC before NAC is formed by apolipoproteins (see Figure 2). From the seven different apolipoproteins identified in the sera of HER2-positive BC patients, five proteins were commonly identified in both responders and non-responders: apolipoprotein A-I (APOA1), apolipoprotein A-IV (APOA4), apolipoprotein B-100 (APOB), apolipoprotein E (APOE), and apolipoprotein M (APOM). While apolipoprotein C-III (APOC3) was only found in the serum of responders, apolipoprotein D (APOD) was identified in the sera of non-responders.
Aside from APOD and the eight proteins involved in complement and coagulation cascade pathways, five unique proteins were identified in the serum of non-responders: immunoglobulin lambda-like polypeptide 5 (IGLL5), CD5 antigen-like (CD5L), afamin (AFM), ficolin-3 (FCN3), and haptoglobin-related protein (HPR). In the case of responders, aside from APOC3, two unique proteins were also identified: gelsolin (GSN) and immunoglobulin kappa constant (IGKC).
Furthermore, the analysis by STRING also revealed that a total of eight proteins implicated in platelet degranulation (ALB, AHSG, APOH, FN1, HRG, ITIH3, ITIH4, TF) and seven proteins that participate in the regulation of immune system processes (PGLYRP2, CD5L, CPN2, GSN, HPX, AMBP, FCN3, RBP4) were commonly identified in the serum of both groups, responders and non-responders (see Figure 2).

3.3. Differential Protein Expression

Serum samples separated by sodium dodecyl sulfate-polyacrylamide gel electrophoresis (SDS-PAGE) and processed following method 1 described in Section 2.7 were then quantitatively analyzed by the emerging proteomic platform for label-free quantification SWATH-MS.
The comparison of the protein patterns allowed the identification of differentially expressed proteins between responders and non-responders. Results were filtered to present a p-value ≤ 0.05 and interestingly, n = 38 proteins were found to be differentially expressed, of which n = 26 were upregulated and n = 12 downregulated in responders (see Table 4).
The unsupervised hierarchical clustering analysis (heat map) demonstrated clear discrimination between the two groups of samples (responders and non-responders) (see Figure 3A). Furthermore, PCA, which is another unsupervised method, clearly revealed that the samples of the responders and non-responders’ patients were separated in the PC1 axis, which explains 97.0% of the variance between the samples (see Figure 3B). Volcano plots of the global quantification of proteins between responder and non-responder patients were generated by plotting the log 2-fold changes for the identified proteins against their corresponding adjusted p-value (see Figure 3C).
To interpret global changes in the serum proteome associated with response/resistance to NAC, the 38 proteins whose levels were significantly different between responder and non-responder patients following method 1 were analyzed using the STRING software. The analysis revealed that the acute-phase response pathway was mainly associated with 7 of 38 dysregulated serum proteins. Particularly, the cluster of acute-phase response proteins found to be downregulated in non-responders is formed by: CRP (C-reactive protein), SAA1 (Serum amyloid A-1 protein), HP (Haptoglobin), APCS (Serum amyloid P-component), SERPINA1 (Alpha-1-antitrypsin), LBP (Lipopolysaccharide-binding protein), ORM1 (Alpha-1-acid glycoprotein 1) (see Figure S3). Furthermore, aside from CRP, SERPINA1 and APCS, two proteins implicated in the complement activation were also found to be downregulated in the non-responders group: FCN2 and C4B.

3.4. Comparison of the Serum Proteomic Profile Common to the Three Methods Obtained by Shotgun (DDA Analysis) and SWATH-MS in HER2-Positive BC Patients before NAC

The 43 proteins identified in responders and 54 proteins identified in non-responders common to the three different methods of sample treatment were compared with the results obtained by SWATH-MS (see Figure 4). These results confirm that six proteins were presented in the sera of both groups, responders and non-responders: apolipoprotein B-100 (APOB), apolipoprotein E (APOE), carboxypeptidase N subunit 2 (CPN2), complement C4-B (C4B), haptoglobin (HP), and serum paraoxonase/arylesterase 1 (PON1). However, while PON1 and CPN2 were found to be upregulated in non-responders (or downregulated in responders), APOE, HP, C4B, and APOB were found to be downregulated in non-responders (or upregulated in responders).
This quantitative analysis confirms that three proteins were presented in the sera of non-responders: afamin (AFM), alpha-1-antitrypsin (SERPINA1), and apolipoprotein D (APOD).
Figure 5 shows the mean values of the area obtained for each sample in each group (responders and non-responders) for AFM, SERPINA1, and APOD proteins. These proteins presented the following individual AUC values: AFM with 0.96 (95% CI, 0.842–1), SERPINA1 with 0.62 (95% CI, 0.143–1), and APOD with 0.54 (95% CI, 0.092–0.990). From them, AFM allowed better accurate discrimination between responders and non-responders with a sensitivity of 83.3% and specificity of 100%. These validated proteins play an important biological function in BC and will provide a new target for the effective diagnosis and treatment of BC [67,68,69], and particularly to predict NAC requirements in patients with BC [70]. However, further studies are needed to determine whether this marker can be used as an adjunct test to predict NAC requirements in patients with BC.

3.5. In Silico Validation Analysis

To validate the results obtained in the present work, we will compare the quantitative proteomic data obtained by SWATH-MS in HER2-positive BC patients before NAC with the recent previously reported data by Ting Yang et al. [45]. These authors performed an isobaric Tandem Mass Tag (TMT) label-based quantitative proteomic analysis of six serum samples from primary HER2-positive breast cancer cases, including three trastuzumab-based therapy-resistant and three trastuzumab-based therapy responsive cases, to discover the serum fingerprint proteins that are related to the trastuzumab-based therapy response in a parallel manner. Statistically significant differences between the trastuzumab-based therapy-resistant and control trastuzumab-based therapy responsive serum samples (p < 0.05 and a fold change ≥ 1.5) showed that 13 secreted serum proteins were upregulated and 5 secreted serum proteins were downregulated. The MS-based proteomics data have been deposited to the ProteomeXchange Consortium and are available via ProteomeXchange with identifier PXD016655. These data are collected in the Supplemental Material (Table S6).
The 38 differentially expressed proteins (26 upregulated and 12 downregulated in responders) found by our group were compared with the 18 secreted serum proteins (13 upregulated and 5 downregulated in responders) identified by Ting Yang et al. [45] (see Figure 6). Two proteins were identified by both research groups APOB (apolipoprotein B-100) and LBP (lipopolysaccharide-binding protein). Importantly, these “in silico” comparisons confirm the upregulation of both proteins in the responders patients.

4. Discussion

There is an urgent need to identify HER2 positive BC patients who may respond to NAC and to select resistant patients for optional anti-HER2 regents. In the current work, we developed an exhaustive qualitative and quantitative proteomics analysis to investigate differences in the circulating proteins levels between responders and non-responders to NAC.
Among the two cohorts of HER2-positive patients receiving NAC, we discovered that proteins implicated in the complement and coagulation pathways constitute a signature that is significantly related to the NAC effect. Particularly, a cluster of 8 proteins implicated in the complement and coagulation cascades was only observed in the profile of non-responders: C4b-binding protein alpha chain (C4BPA), complement C5 (C5), complement factor I (CFI), complement factor H (CFH), complement factor H-related protein 1 (CFHR1), alpha-1-antitrypsin (SERPINA1), prothrombin (F2), and plasminogen (PLG).
Blood coagulation proteins play an important role in tumor growth, according to several studies [50,52,71]. These studies looked at the effects of blood clotting cascade activation on primary tumor growth [72], tumor metastasis, and cancer-associated thrombosis [73], as well as anticancer treatments that target blood-coagulation-associated proteins [74]. Particularly, SERPINA1, a serine protease inhibitor that belongs to the protease inhibitor family, is synthesized and released by tumor cells and is involved in a variety of physiological and pathologic processes including angiogenesis, tumor invasion, and metastasis. [75]. In the case of BC, various studies support blood coagulation proteins as an important patient factor that promotes metastatic potential [76]. For example, when compared to early BC patients, metastatic patients had significantly higher D-dimer values [77]. Furthermore, high plasma fibrinogen levels were linked to a poor response to trastuzumab treatment in HER2 positive BC patients [40] and circulating levels of factor VIII (FVIII) were found to be significantly related to axillary lymph node involvement, the number of metastatic nodes, and HER2 status [78]. These studies, which are consistent with the current work, suggest that measuring some coagulation-related biomarkers could provide additional data for assessing the prognosis of HER2-positive BC patients and could be novel molecular targets.
As mentioned above, the emerging functions of the pro- and anti-coagulant pathways in cell signaling and regulation of extracellular microenvironments give new perspectives on challenges and opportunities in treating cancer patients with anticoagulants [74]. In the pioneering studies by Leo Zacharski [79], anticoagulation by blocking the activity of Gla-domain-containing proteins with Vitamin K antagonists produced a remarkable survival benefit in patients with small-cell lung cancer. It will be of interest for future studies to better understand how cancer cells utilize the coagulant and anticoagulant pathways in the tumor microenvironment (TME) and metastatic niches for survival and the escape from cytotoxic cancer therapy.
Similar to the blood coagulation proteins, complement proteins, through their interactions with cells in the tumor microenvironment and metastasis-targeted organs, modulate tumor growth, anti-tumor immunity, angiogenesis, and thus overall malignancy progression and, possibly, cancer susceptibility to various therapies [80].
In this sense, previous proteomic investigations reported elevated amounts of several complement system components in the sera of colorectal cancer patients [81,82], bladder cancer [52], and in serum and plasma of patients with BC [50,83]. Particularly, a panel of five serum proteins, including complement factor C3a was able to predict the 5-year metastasis-free survival in BC patients [84]. Michlmayr et al. [85] highlighted the role of complement as an important host response factor that could be used to identify early BC patients that are non-responders to NAC. In terms of complement’s immunostimulatory vs. immunoregulatory functions and their potential applications in the development of novel therapies for cancer patients, the only complement inhibitors approved are those that act at the C5 level, such as Eculizumab [86]. It allows complement activation while preventing the formation of the C5a anaphylatoxin and the membrane attack complex. Furthermore, similar to the current study, it was demonstrated that a low level of complement activation is required for an effective response to treatment such as chemotherapy and radiotherapy [87,88].
Apolipoproteins in the blood transfer lipids to cancer cells, providing energy for cancer cell proliferation and invasion, and they also play important roles in cellular signal transduction. A growing body of evidence suggests that apolipoproteins are linked to numerous types of carcinogenesis, such as BC [69,89,90].
In the present work, we discovered that apolipoproteins profile also constitutes a signature that is significantly related to the NAC effect. Particularly, while APOC3 was only observed in the profile of responders, APOD was observed in the profile of non-responders (see Figure 2). Different studies also support the role of apolipoproteins as predictors of treatment response. For example, the apolipoprotein Ea4 allele predicted a better response to donepezil therapy in Alzheimer’s disease [91]. Other studies also correlated levels of some serum lipids, such as Apolipoprotein A-I, with neoadjuvant chemoradiotherapy (NACRT) response in advanced rectal cancer [92,93].
Apart from its well-known role in triglyceride metabolism and insulin resistance, new data reveals that APOC3 is connected to various cancers [94,95]. In a study developed by Jian Shi et al. [96], small cell lung cancer (SCLC) patients undergoing NAC before surgery showed significantly increased expression of APOC3, showing that APOC3 may be used to monitor the efficacy of chemotherapy. Molecular evidence suggests that the human APOC3 promoter is activated synergistically by hepatocyte nuclear factor 4, Mdm2, and Smad proteins [97,98]. Mdm2 antagonizes the indirect inhibition of p53 and SHP on APOC3, which is probably the underlying mechanism for the involvement of APOC3 in tumorigenesis and cancer progression, and therefore, its implication in NAC response shown in the present work.
As it was mentioned above, APOD was only observed in the profile of non-responders. Among the apolipoproteins, APOD was the first to be demonstrated to play a significant role in BC [99,100]. The interactions of APOD with multiple key pathways may be responsible for its effects in BC, including the estrogen receptor (ER), mitogen-activated protein kinase (MAPK), progesterone receptor (PR), cyclo-oxygenase-2 (COX-2), and 5-lipoxygenase (5-LO) pathways [101,102,103,104,105]. APOD is involved in these signaling pathways, and such pathways interact with each other. Particularly, APOD in plasma was found to function as a predictor during tamoxifen treatment in BC [100,106,107,108]. Molecular studies have shown an inhibitory effect of the estrogen-receptor (ER) on ApoD, with up-regulation following tamoxifen treatment, most likely due to ER activity blockage [109]. As a result, combined ER and ApoD positivity may indicate a malfunctioning hormone receptor pathway, resulting in ineffective tamoxifen treatment and an increased risk of relapse [105,109,110,111,112]. In the present work, further studies are necessary to know the molecular pathways affected by the interaction with APOD, responsible for the NAC effect in non-responders.
Aside from APOC3, GSN and IGKC were also found to be related to the NAC effect in responders. GSN, one of the most potent members of the actin-severing superfamily, regulates actin filament assembly and disassembly [113,114]. GSN is involved in many cellular properties that contribute to carcinogenesis phenotypes, including epithelial to mesenchymal transition (EMT), motility, apoptosis, proliferation, and differentiation [115]. Furthermore, GSN appears to play a variety of roles in tumor biology, with evidence pointing to its involvement in tumor suppression and malignant progression [116,117].
GSN expression is regulated differently in various tumors [118,119,120,121,122,123,124]. During the progression of carcinogenesis, biphasic expression of GSN was found in oral cancers [120,121]. GSN expression is reduced in many transformed and malignant cancer cells, including BC [122,123,124]. Evidence indicated that GSN gene loss is one of the most common disorders in invasive and metastatic BC [125,126]. According to research, the GSN protein was found to be deficient in 71% of human sporadic, invasive breast carcinomas and 56% of ductal carcinomas in situ [125,126]. GSN expression may also be associated with survival from malignant BC, and the frequency of GSN deficiency increases significantly with progression to invasive phenotypic cancer cells, according to clinical evidence [125]. Recent studies have found increased GSN expressions in chemoresistant head-and-neck (HNC) [127] and gynecological cancers [128]. These studies suggested that GSN might play important roles in cancer chemoresistance. However, an opposite effect was observed in the present work.
Concerning IGKC, a previous study found that this protein is mainly expressed in plasma cells as a prognostic marker in node-negative BC [129]. Across all molecular subtypes, higher IGKC expression was associated with longer metastasis-free survival (MFS) [129]. This effect was especially noticeable in patients with estrogen receptor (ER)-negative, highly proliferating BC. Furthermore, IGKC expression was shown to be a predictor of response to anthracycline-based NAC [129,130,131]. Further immunohistochemical studies could confirm that the presence of IGKC-producing tumor-infiltrating plasma cells was associated with a favorable prognosis in patients with node-negative BC patients who did not receive any systemic adjuvant treatment [130]. A significant interaction between the prognostic effect of IGKC in BC patients and tamoxifen was demonstrated for the first time in the adjuvant setting [132].
In summary, the stromal immunoglobulin kappa chain (IGKC) has been validated as an immunologic biomarker of prognosis and response to therapy in human BC and other cancers. This validation highlights the critical role of humoral immunity in cancer progression control and has important implications for determining cancer prognosis [133].
In the present work, aside from APOD and the eight proteins implicated in the complement and coagulation pathways, six different proteins were also found to be related to the NAC effect in non-responders: immunoglobulin lambda-like polypeptide 5 (IGLL5), CD5 antigen-like (CD5L), afamin (AFM), ficolin-3 (FCN3), haptoglobin-related protein (HPR). The role of these proteins in oncogenesis is not fully understood. Only one study supports the use of CD5L as a therapy to specifically target and destroy cancer cells via complement activation. [134]. Although AFM expression showed no significant prognostic value in BC [135], a significant association between AFM plasma concentrations and clinical outcomes (response to therapy and survival rates) was observed in ovarian cancer [136]. FCN3, a circulating pattern recognition molecule of the lectin pathway, plays a role in host immune responses to cancer [137].
In a recent study [138], the potential of FCN3 in the therapeutic intervention of human leiomyoma was demonstrated. Finally, HPR levels in the serum of some cancer patients were found to be elevated with tumor progression, but the relevance of this observation is not understood [139].
The qualitative analysis confirmed that three proteins (AFM, SERPINA1, APOD) were correlated with NAC resistance because they were identified and quantified in the sera of non-responders. The increase in APOD expression and the decrease in AFM and SERPINA1 expression is thus a signature that is significantly related to trastuzumab-based therapeutic resistance. Furthermore, the up-regulation of APOB and LBP in the responder group was supported by the serum proteomic analysis of trastuzumab-based therapy resistant patients before therapy, whose results were reported by T. Yang et al. [45]. This investigation highlights the potential use of serum protein signatures to predict the therapeutic efficacy of NAC in the clinic.

5. Conclusions

The results of this study suggest that the identification of some complement and coagulation related circulating proteins constitute a signature that is significantly related to the NAC effect in HER2+ BC patients. Particularly, a low level of complement and coagulation activation is needed to have an effective response to NAC. Circulating apolipoproteins also developed an important role in NAC response being APOC3 and APOD associated with the response and resistance to the treatment, respectively. The increase in APOD expression and the decrease in AFM and SERPINA1 expression correspondingly constitute a signature that is significantly related to the NAC resistance. The upregulation of APOB and LBP in the responder group was also confirmed by an in silico analysis. The results of this study could represent a useful tool to support clinical decision-making in HER2-positive BC patients, providing additional data for the evaluation of NAC response and as potential molecular targets. However, further studies are necessary to know the molecular pathways affected by the interaction with these circulating proteins responsible for the NAC effect in responders and non-responders.

Supplementary Materials

The following are available online at https://www.mdpi.com/article/10.3390/cancers14041087/s1, Annex 1: Criteria for HER2-targeted NAC in HER2-positive BC patients, Annex 2. Synthesis of inorganic nanoparticles [47], Figure S1: TEM image of AuNPs@citrate in aqueous phase and the characterization data, Figure S2: TEM image of PtNPs@citrate in aqueous phase and the characterization data, Figure S3. Cluster of acute-phase response proteins found in the protein–protein interaction network map of the genes encoded differentially regulated proteins for the responders’ patients found after the proteomic analysis of the serum samples (method 1), Table S1: Proteins identified in the crude serum samples (method 1) belonging to HER2-positive BC patients that were obtained before starting the neoadjuvant treatment. These patients showed a different response after the NAT treatment: responders (n = 6), non-responders (n = 4). The accession number, gene name and species (Human) were reported, Table S2: Proteins identified in the serum samples pretreated with AuNPs (method 2) belonging to HER2-positive BC patients that were obtained before starting the neoadjuvant treatment. These patients showed a different response after the NAT treatment: responders (n = 6), non-responders (n = 4). The accession number, gene name and species (Human) were reported, Table S3: Proteins identified in the serum samples pretreated with PtNPs (method 3) belonging to HER2-positive BC patients that were obtained before starting the neoadjuvant treatment. These patients showed a different response after the NAT treatment: responders (n = 6), non-responders (n = 4). The accession number, gene name and species (Human) were reported, Table S4. List of 43 common proteins identified in the serum of responders pretreated by the three different methods (with and without NPs). The accession number, gene name, and species (Human) were reported, Table S5. List of 54 common proteins identified in the serum of non-responders pretreated by the three different methods (with and without NPs). The accession number, gene name, and species (Human) were reported. Table S6. List of the upregulated and downregulated proteins (a fold change ≥ 1.5 and p < 0.05) found after the TMT labeling-based quantitative proteomic analysis of 6 serum samples from primary HER2-positive breast cancer cases, including 3 trastuzumab-based therapy-resistant and 3 trastuzumab-based therapy responsive cases developed by T. Yang et al. [45].

Author Contributions

Conceptualization, L.G.-L., S.V.-E., S.B.B. and C.N.; methodology, M.d.P.C.-V., M.C.-A., S.B.B. and C.N.; software, M.d.P.C.-V., M.C.-A., S.B.B. and C.N.; validation, M.d.P.C.-V., M.C.-A., S.B.B. and C.N.; formal analysis, M.d.P.C.-V., M.C.-A., S.B.B. and C.N.; investigation, L.G.-L., M.d.P.C.-V., M.C.-A., S.B.B. and C.N.; resources, S.V.-E., S.B.B. and C.N.; writing—original draft preparation, C.N.; writing—review and editing, C.N.; visualization, C.N.; supervision, C.N.; project administration, C.N.; funding acquisition, C.N. All authors have read and agreed to the published version of the manuscript.

Funding

This research was funded by Instituto de Salud Carlos III (ISCIII), European Regional Development Fund (FEDER), grant number CP16/00139 and Xunta de Galicia, Consellería de Educación, Universidade e Formación Profesional and Consellería de Economía, Emprego e Industria (GAIN), grant number IN607D 2021/02. M. Conde-Amboage acknowledge the financial support of Grant PID2020-116587GB-I00 funded by MCIN/AEI/10.13039/501100011033 and the European Union.

Institutional Review Board Statement

The study was conducted according to the guidelines of the Declaration of Helsinki and approved by the Clinical Research Ethics Committee (CEIC) of Galicia (Spain) (number 2017/021).

Informed Consent Statement

Informed consent was obtained from all subjects involved in the study.

Data Availability Statement

The data presented in this study are available in this article (and Supplementary Material).

Conflicts of Interest

The authors declare no conflict of interest.

References

  1. Thompson, A.M.; Moulder-Thompson, S.L. Neoadjuvant treatment of breast cancer. Ann. Oncol. 2012, 23 (Suppl. S10), x231–x236. [Google Scholar] [CrossRef] [PubMed]
  2. Buzdar, A.U.; Valero, V.; Theriault, R.; Frye, D.; Green, M.; Booser, D.; Guerra, L.; Sahin, A.; Ames, F.; Smith, T.; et al. Pathological complete response (pCR) to chemotherapy is related to hormone receptor status. Breast Cancer Res. Treat. 2003, 82 (Suppl. S1), 302A. [Google Scholar]
  3. Petrelli, F.; Borgonovo, K.; Cabiddu, M.; Ghilardi, M.; Barni, S. Neoadjuvant chemotherapy and concomitant trastuzumab in breast cancer: A pooled analysis of two randomized trials. AntiCancer Drugs 2011, 22, 128–135. [Google Scholar] [CrossRef] [PubMed]
  4. Piccart-Gebhart, M.; Holmes, A.P.; de Azambuja, E.; Di Cosimo, S.; Swaby, R.; Untch, M.; Jackisch, C.; Lang, I.; Smith, I.; Boyle, F.; et al. The association between event-free survival and pathological complete response to neoadjuvant lapatinib, trastuzumab or their combination in HER2-positive breast cancer. Survival follow-up analysis of the NeoALTTO study (BIG 1-06). Cancer Res. 2013, 73, S1-01. [Google Scholar]
  5. Gianni, L.; Pienkowski, T.; Im, Y.H.; Roman, L.; Tseng, L.-M.; Liu, M.-C.; Lluch, A.; Staroslawska, E.; Haba-Rodriguez, J.; Im, S.-A.; et al. Efficacy and safety of neoadjuvant pertuzumab and trastuzumab in women with locally advanced, inflammatory, or early HER2-positive breast cancer (NeoSphere): A randomised multicentre, open-label, phase 2 trial. Lancet Oncol. 2012, 13, 25–32. [Google Scholar] [CrossRef]
  6. Schneeweiss, A.; Chia, S.; Hickish, T.; Harvey, V.; Eniu, A.; Hegg, R.; Tausch, C.; Seo, J.H.; Tsai, Y.-F.; Ratnayake, J.; et al. Pertuzumab plus trastuzumab in combination with standard neoadjuvant anthracycline-containing and anthracycline-free chemotherapy regimens in patients with HER2-positive early breast cancer: A randomized phase II cardiac safety study (TRYPHAENA). Ann. Oncol. 2013, 24, 2278–2284. [Google Scholar] [CrossRef]
  7. Loibl, S.; Jackisch, C.; Schneeweiss, A.; Schmatloch, S.; Aktas, B.; Denkert, C.; Wiebringhaus, H.; Kümmel, S.; Warm, M.; Paepke, S.; et al. Dual HER2-blockade with pertuzumab and trastuzumab in HER2-positive early breast cancer: A subanalysis of data from the randomized phase III GeparSepto trial. Ann. Oncol. 2017, 28, 497–504. [Google Scholar] [CrossRef]
  8. Hurvitz, S.A.; Martin, M.; Symmans, W.F.; Jung, K.H.; Huang, C.-S.; Thompson, A.M.; Harbeck, N.; Valero, V.; Stroyakovskiy, D.; Wildiers, H.; et al. Pathologic complete response (pCR) rates after neoadjuvant trastuzumab emtansine (T-DM1 [K]) + pertuzumab (P) vs docetaxel + carboplatin + trastuzumab + P (TCHP) treatment in patients with HER2-positive (HER2+) early breast cancer (EBC) (KRISTINE). J. Clin. Oncol. 2016, 34 (Suppl. S15), 500A. [Google Scholar] [CrossRef]
  9. Beitsch, P.; Whitworth, P.; Baron, P.; Rotkis, M.C.; Mislowsky, A.M.; Richards, P.D.; Murray, M.K.; Pellicane, J.V.; Dul, C.L.; Nash, C.H.; et al. Pertuzumab/trastuzumab/CT versus trastuzumab/CT therapy for HER2+ breast cancer: Results from the prospective Neoadjuvant Breast Registry Symphony Trial (NBRST). Ann. Surg. Oncol. 2017, 24, 2539–2546. [Google Scholar] [CrossRef]
  10. Untch, M.; Loibl, S.; Bischoff, J.; Eidtmann, H.; Kaufmann, M.; Blohmer, J.-U.; Hilfrich, J.; Strumberg, D.; Fasching, P.A.; Kreienberg, R.; et al. Lapatinib versus trastuzumab in combination with neoadjuvant anthracycline-taxane-based chemotherapy (GeparQuinto, GBG 44): A randomised phase 3 trial. Lancet Oncol. 2012, 13, 135–144. [Google Scholar] [CrossRef]
  11. Reinisch, M.; von Minckwitz, G.; Harbeck, N.; Janni, W.; Kümmel, S.; Kaufmann, M.; Elling, D.; Nekljudova, V.; Loibl, S. Side Effects of Standard Adjuvant and Neoadjuvant Chemotherapy Regimens According to Age Groups in Primary Breast Cancer. Breast Care 2013, 8, 60–66. [Google Scholar] [CrossRef] [PubMed] [Green Version]
  12. Murthy, R.K.; Raghavendra, A.S.; Hess, K.R.; Fujii, T.; Lim, B.; Barcenas, C.H.; Zhang, H.; Chavez-Mac-Gregor, M.; Mittendorf, E.A.; Litton, J.K.; et al. Neoadjuvant Pertuzumab-containing Regimens Improve Pathologic Complete Response Rates in Stage II to III HER-2/neu-positive Breast Cancer: A Retrospective, Single Institution Experience. Clin. Breast Cancer 2018, 18, e1283–e1288. [Google Scholar] [CrossRef] [PubMed]
  13. Wolff, A.C.; Berry, D.; Carey, L.A.; Colleoni, M.; Dowsett, M.; Ellis, M.; Garber, J.E.; Mankoff, D.; Paik, S.; Pusztai, L.; et al. Research issues affecting preoperative systemic therapy for operable breast cancer. J. Clin. Oncol. 2008, 26, 806–813. [Google Scholar] [CrossRef] [PubMed]
  14. Potti, A.; Dressman, H.K.; Bild, A.; Riedel, R.F.; Chan, G.; Sayer, R.; Cragun, J.; Cottrill, H.; Kelley, M.J.; Petersen, R.; et al. Genomic signatures to guide the use of chemotherapeutics. Nat. Med. 2006, 12, 1294–1300. [Google Scholar] [CrossRef]
  15. Zitvogel, L.; Apetoh, L.; Ghiringhelli, F.; Kroemer, G. Immunological aspects of cancer chemotherapy. Nat. Rev. 2008, 8, 59–73. [Google Scholar] [CrossRef]
  16. Chang, J.C.; Wooten, E.C.; Tsimelzon, A.; Hilsenbeck, S.G.; Gutierrez, M.C.; Elledge, R.; Mohsin, S.; Osborne, C.K.; Chamness, G.C.; Allred, D.C.; et al. Gene expression profiling for the prediction of therapeutic response to docetaxel in patients with breast cancer. Lancet 2003, 362, 362–369. [Google Scholar] [CrossRef]
  17. Balko, J.M.; Cook, R.S.; Vaught, D.B.; Kuba, M.G.; Miller, T.W.; Bhola, N.E.; Sanders, M.E.; Granja-ingram, N.M.; Smith, J.J.; Ingrid, M. Profiling of residual breast cancers after neoadjuvant chemotherapy identifies DUSP4 deficiency as a mechanism of drug resistance. Nat. Med. 2012, 18, 1052–1059. [Google Scholar] [CrossRef] [Green Version]
  18. Sohn, J.; Do, K.A.; Liu, S.; Chen, H.; Mills, G.B.; Hortobagyi, G.N.; Meric-Bernstam, F.; Gonzalez-Angulo, A.M. Functional proteomics characterization of residual triple-negative breast cancer after standard neoadjuvant chemotherapy. Ann. Oncol. 2013, 24, 2522–2526. [Google Scholar] [CrossRef]
  19. Satpathy, S.; Jaehnig, E.J.; Krug, K.; Kim, B.; Saltzman, A.B.; Chan, D.W.; Holloway, K.R.; Anurag, M.; Huang, C.; Singh, P.; et al. Microscaled proteogenomic methods for precision oncology. Nat. Commun. 2020, 11, 532. [Google Scholar] [CrossRef] [Green Version]
  20. Llombart-Cussac, A.; Cortés, J.; Paré, L.; Galván, P.; Bermejo, B.; Martínez, N.; Vidal, M.; Pernas, S.; López, R.; Muñoz, M.; et al. HER2-enriched subtype as a predictor of pathological complete response following trastuzumab and lapatinib without chemotherapy in early-stage HER2-positive breast cancer (PAMELA): An open-label, single-group, multicentre, phase 2 trial. Lancet Oncol. 2017, 18, 545–554. [Google Scholar] [CrossRef]
  21. Lesurf, R.; Griffith, O.L.; Griffith, M.; Hundal, J.; Trani, L.; Watson, M.A.; Aft, R.; Ellis, M.J.; Ota, D.; Suman, V.J.; et al. Genomic characterization of HER2-positive breast cancer and response to neoadjuvant trastuzumab and chemotherapy-results from the ACOSOG Z1041 (Alliance) trial. Ann. Oncol. 2017, 28, 1070–1077. [Google Scholar] [CrossRef] [PubMed]
  22. Fumagalli, D.; Venet, D.; Ignatiadis, M.; Azim, H.A., Jr.; Maetens, M.; Rothé, F.; Salgado, R.; Bradbury, I.; Pusztai, L.; Harbeck, N.; et al. RNA Sequencing to Predict Response to Neoadjuvant Anti-HER2 Therapy: A Secondary Analysis of the NeoALTTO Randomized Clinical Trial. JAMA Oncol. 2017, 3, 227–234. [Google Scholar] [CrossRef] [PubMed]
  23. Prat, A.; Bianchini, G.; Thomas, M.; Belousov, A.; Cheang, M.C.U.; Koehler, A.; Gómez, P.; Semiglazov, V.; Eiermann, W.; Tjulandin, S.; et al. Research-based PAM50 subtype predictor identifies higher responses and improved survival outcomes in HER2-positive breast cancer in the NOAH study. Clin. Cancer Res. 2014, 20, 511–521. [Google Scholar] [CrossRef] [PubMed] [Green Version]
  24. Tanioka, M.; Fan, C.; Parker, J.S.; Hoadley, K.A.; Hu, Z.; Li, Y.; Hyslop, T.M.; Pitcher, B.N.; Soloway, M.G.; Spears, P.A.; et al. Integrated Analysis of RNA and DNA from the Phase III Trial CALGB 40601 Identifies Predictors of Response to Trastuzumab-Based Neoadjuvant Chemotherapy in HER2-Positive Breast Cancer. Clin. Cancer Res. 2018, 24, 5292–5304. [Google Scholar] [CrossRef] [Green Version]
  25. Loi, S.; Michiels, S.; Salgado, R.; Sirtaine, N.; Jose, V.; Fumagalli, D.; Kellokumpu-Lehtinen, P.-L.; Bono, P.; Kataja, V.; Desmedt, C.; et al. Tumor infiltrating lymphocytes are prognostic in triple negative breast cancer and predictive for trastuzumab benefit in early breast cancer: Results from the FinHER trial. Ann. Oncol. 2014, 25, 1544–1550. [Google Scholar] [CrossRef]
  26. Nuciforo, P.; Pascual, T.; Cortés, J.; Llombart-Cussac, A.; Fasani, R.; Pare, L.; Oliveira, M.; Galvan, P.; Martínez, N.; Bermejo, B.; et al. A predictive model of pathologic response based on tumor cellularity and tumorinfiltrating lymphocytes (CelTIL) in HER2-positive breast cancer treated with chemo-free dual HER2 blockade. Ann. Oncol. 2018, 29, 170–177. [Google Scholar] [CrossRef]
  27. Varadan, V.; Gilmore, H.; Miskimen, K.L.; Tuck, D.; Parsai, S.; Awadallah, A.; Krop, I.E.; Winer, E.P.; Bossuyt, V.; Somlo, G.; et al. Immune Signatures Following Single Dose Trastuzumab Predict Pathologic Response to Preoperative Trastuzumab and Chemotherapy in HER2-Positive Early Breast Cancer. Clin. Cancer Res. 2016, 22, 3249–3259. [Google Scholar] [CrossRef] [Green Version]
  28. McNamara, K.L.; Caswell-Jin, J.L.; Joshi, R.; Ma, Z.; Kotler, E.; Bean, G.R.; Kriner, M.; Zhou, Z.; Hoang, M.; Beechem, J.; et al. Spatial proteomic characterization of HER2-positive breast tumors through neoadjuvant therapy predicts response. Nat. Cancer 2021, 2, 400–413. [Google Scholar] [CrossRef]
  29. Haugen, M.H.; Lingjærde, O.C.; Hedenfalk, I.; Garred, Ø.; Borgen, E.; Loman, N.; Hatschek, T.; Børresen-Dale, A.; Naume, B.; Mills, G.B.; et al. Protein Signature Predicts Response to Neoadjuvant Treatment With Chemotherapy and Bevacizumab in HER2-Negative Breast Cancers. JCO Precis. Oncol. 2021, 5, 286–306. [Google Scholar] [CrossRef]
  30. Chen, Y.; Li, H.; Liang, J.; Ger, L.; Chang, H.; Hsiao, M.; Calkins, M.J.; Cheng, H.; Chuang, J.; Lu, P. CTMP, a predictive biomarker for trastuzumab resistance in HER2-enriched breast cancer patient. Oncotarget 2017, 8, 29699–29710. [Google Scholar] [CrossRef] [Green Version]
  31. Lurie, Y.; Webb, M.; Cytter-Kuint, R.; Shteingart, S.; Lederkremer, G.Z. Non-invasive diagnosis of liver fibrosis and cirrhosis. World J. Gastroenterol. 2015, 21, 11567–11583. [Google Scholar] [CrossRef] [PubMed]
  32. Yang, T.; Xu, P.; Gu, L.; Xu, Z.; Ge, W.; Li, Q.; Xu, F. Quantitative assessment of serum heat shock protein 27 for the diagnosis of epithelial ovarian cancer using targeted proteomics coupled with immunoaffinity enrichment. Clin. Chim. Acta 2019, 489, 96–102. [Google Scholar] [CrossRef]
  33. Yang, F.; Fu, Z.; Yang, M.; Sun, C.; Li, Y.; Chu, J.; Zhang, Y.; Li, W.; Huang, X.; Li, J.; et al. Expression pattern of microRNAs related with response to trastuzumab in breast cancer. J. Cell. Physiol. 2019, 234, 16102–16113. [Google Scholar] [CrossRef] [PubMed]
  34. Anfossi, S.; Giordano, A.; Gao, H.; Cohen, E.N.; Tin, S.; Wu, Q.; Garza, R.J.; Debeb, B.G.; Alvarez, R.H.; Valero, V.; et al. High serum miR-19a levels are associated with inflammatory breast cancer and are predictive of favorable clinical outcome in patients with metastatic HER2+ inflammatory breast cancer. PLoS ONE 2014, 9, e83113. [Google Scholar] [CrossRef] [PubMed]
  35. Li, H.; Liu, J.; Chen, J.; Wang, H.; Yang, L.; Chen, F.; Fan, S.; Wang, J.; Shao, B.; Yin, D.; et al. A serum microRNA signature predicts trastuzumab benefit in HER2-positive metastatic breast cancer patients. Nat. Commun. 2018, 9, 1614. [Google Scholar] [CrossRef] [PubMed]
  36. Sun, C.; Yang, F.; Zhang, Y.; Chu, J.; Wang, J.; Wang, Y.; Zhang, Y.; Li, J.; Li, Y.; Fan, R.; et al. tRNA-Derived Fragments as Novel Predictive Biomarkers for Trastuzumab-Resistant Breast Cancer. Cell. Physiol. Biochem. 2018, 49, 419–431. [Google Scholar] [CrossRef] [PubMed]
  37. Fornier, M.N.; Seidman, A.D.; Schwartz, M.K.; Ghani, F.; Thiel, R.; Norton, L.; Hudis, C. Serum HER2 extracellular domain in metastatic breast cancer patients treated with weekly trastuzumab and paclitaxel: Association with HER2 status by immunohistochemistry and fluorescence in situ hybridization and with response rate. Ann. Oncol. 2005, 16, 234–239. [Google Scholar] [CrossRef]
  38. Ho, D.; Huang, J.; Chapman, J.W.; Leitzel, K.; Ali, S.M.; Shepherd, L.; Parulekar, W.R.; Ellis, C.E.; Crescnzo, R.J.; Zhu, L.; et al. Impact of serum HER2, TIMP-1, and CAIX on outcome for HER2+ metastatic breast cancer patients: CCTG MA.31 (lapatinib vs. trastuzumab). Breast Cancer Res. Treat. 2017, 164, 571–580. [Google Scholar] [CrossRef]
  39. Nami, B.; Wang, Z. HER2 in breast Cancer stemness: A negative feedback loop towards trastuzumab resistance. Cancers 2017, 9, 40. [Google Scholar] [CrossRef] [Green Version]
  40. Liu, Y.; Lu, Q.; Liang, J.; Xia, Y.; Zhang, W.; Hu, B.; Shang, F.; Ji, Y.; Wang, J.; Wang, Q.; et al. High Plasma Fibrinogen is Correlated With Poor Response to Trastuzumab Treatment in HER2 Positive Breast Cancer. Medicine 2015, 94, e481. [Google Scholar] [CrossRef]
  41. Sun, Z.; Liu, X.; Wu, D.; Gao, H.; Jiang, J.; Yang, Y.; Wu, J.; Gao, Q.; Wang, J.; Jiang, Z.; et al. Circulating proteomic panels for diagnosis and risk stratification of acute-on-chronic liver failure in patients with viral hepatitis B. Theranostics 2019, 9, 1200–1214. [Google Scholar] [CrossRef] [PubMed]
  42. Bai, J.; Yang, Y.; Wang, J.; Zhang, L.; Wang, F.; He, A. Variability of serum novel serum peptide biomarkers correlates with the disease states of multiple mieloma. Clin. Proteom. 2019, 16, 17. [Google Scholar] [CrossRef] [PubMed] [Green Version]
  43. Tremlett, H.; Dai, D.L.; Hollander, Z.; Kapanen, A.; Aziz, T.; Wilson-McManus, J.E.; Tebbutt, S.J.; Borchers, C.H.; Oger, J.; Cohen Freue, G.V. Serum proteomics in multiple sclerosis disease progression. J. Proteom. 2015, 118, 2–11. [Google Scholar] [CrossRef] [PubMed]
  44. Mysona, D.; Pyrzak, A.; Purohit, S.; Zhi, W.; Sharma, A.; Tran, L.; Tran, P.; Bai, S.; Rungruang, B.; Ghamande, S.; et al. A combined score of clinical factors and serum proteins can predict time to recurrence in high grade serous ovarian cancer. Gynecol. Oncol. 2019, 152, 574–580. [Google Scholar] [CrossRef]
  45. Yang, T.; Fu, Z.; Zhang, Y.; Wang, M.; Mao, C.; Ge, W. Serum proteomics analysis of candidate predictive biomarker panel for the diagnosis of trastuzumab-based therapy resistant breast cancer. Biomed. Pharmacother. 2020, 129, 110465. [Google Scholar] [CrossRef]
  46. Jia, L.; Lu, Y.; Shao, J.; Liang, X.J.; Xu, Y. Nanoproteomics: A new sprout from emerging links between nanotechnology and proteomics. Trends Biotechnol. 2013, 31, 99–107. [Google Scholar] [CrossRef]
  47. Chantada-Vázquez, M.P.; Castro López, A.; Bravo, S.B.; Vázquez-Estévez, S.; Acea-Nebril, B.; Núñez, C. Proteomic analysis of the bio-corona formed on the surface of (Au, Ag, Pt)-nanoparticles in human serum. Colloids Surf. B Biointerfaces 2019, 177, 141–148. [Google Scholar] [CrossRef]
  48. Chantada-Vázquez, M.P.; Castro López, A.; García Vence, M.; Vázquez-Estévez, S.; Acea-Nebril, B.; Calatayud, D.G.; Jardiel, T.; Bravo, S.B.; Núñez, C. Proteomic investigation on bio-corona of Au, Ag and Fe nanoparticles for the discovery of triple negative breast cancer serum protein biomarkers. J. Proteom. 2020, 212, 103581. [Google Scholar] [CrossRef] [PubMed]
  49. Chantada-Vázquez, M.P.; García-Vence, M.; Vázquez-Estévez, S.; Bravo, S.B.; Núñez, C. Identification of a Profile of Neutrophil-Derived Granule Proteins in the Surface of Gold Nanoparticles after Their Interaction with Human Breast Cancer Sera. Nanomaterials 2020, 10, 1223. [Google Scholar] [CrossRef]
  50. Chantada-Vázquez, M.D.P.; López, A.C.; García-Vence, M.; Acea-Nebril, B.; Bravo, S.B.; Núñez, C. Protein corona gold nanoparticles fingerprinting reveals a profile of blood coagulation proteins in the serum of Her2-overexpressing breast cancer patients. Int. J. Mol. Sci. 2020, 21, 8449. [Google Scholar] [CrossRef]
  51. García-Vence, M.; Chantada-Vázquez, M.D.P.; Cameselle-Teijeiro, J.M.; Bravo, S.B.; Núñez, C. A Novel nanoproteomic approach for the identification of molecular targets associated with thyroid tumors. Nanomaterials 2020, 10, 2370. [Google Scholar] [CrossRef] [PubMed]
  52. Blanco-Gómez, B.; López-Cortés, R.; Casas-Nebra, F.J.; Vázquez-Estévez, S.; Pérez-Fentes, D.; Chantada-Vázquez, M.D.P.; Bravo, S.B.; Núñez, C. Detection of Circulating Serum Protein Biomarkers of Non-Muscle Invasive Bladder Cancer after Protein Corona-Silver Nanoparticles Analysis by SWATH-MS. Nanomaterials 2021, 11, 2384. [Google Scholar] [CrossRef] [PubMed]
  53. Lai, Z.W.; Yan, Y.; Caruso, F.; Nice, E.C. Emerging techniques in proteomics for probing nano-bio interactions. ACS Nano 2012, 6, 10438–10448. [Google Scholar] [CrossRef] [PubMed]
  54. Bai, X.; Wang, Y.; Song, Z.; Feng, Y.; Chen, Y.; Zhang, D.; Feng, L. The Basic Properties of Gold Nanoparticles and their Applications in Tumor Diagnosis and Treatment. Int. J. Mol. Sci. 2020, 21, 2480. [Google Scholar] [CrossRef] [Green Version]
  55. Jeyaraj, M.; Gurunathan, S.; Qasim, M.; Kang, M.-H.; Kim, J.-H. A Comprehensive Review on the Synthesis, Characterization, and Biomedical Application of Platinum Nanoparticles. Nanomaterials 2019, 9, 1719. [Google Scholar] [CrossRef] [Green Version]
  56. Edge, S.B.; Byrd, D.R.; Compton, C.C.; Fritz, A.G.; Greene, F.L.; Trotti, A. American Joint Committee on Cancer (AJCC) Cancer Staging Manual, 7th ed.; Springer: New York, NY, USA, 2009. [Google Scholar]
  57. Warder, S.E.; Tucker, L.A.; Strelitzer, T.J.; McKeegan, E.M.; Meuth, J.L.; Jung, P.M.; Saraf, A.; Singh, B.; Lai-Zhang, J.; Gagne, G.; et al. Reducing agent-mediated precipitation of high-abundance plasma proteins. Anal. Biochem. 2009, 387, 184–193. [Google Scholar] [CrossRef]
  58. Fernández, C.; Santos, H.M.; Ruíz-Romero, C.; Blanco, F.J.; Capelo-Martínez, J.L. A comparison of depletion versus equalization for reducing high-abundance proteins in human serum. Electrophoresis 2011, 32, 2966–2974. [Google Scholar] [CrossRef]
  59. Shevchenko, A.; Wilm, M.; Vorm, O.; Jensen, O.N.; Podtelejnikov, A.V.; Neubauer, G.; Mortensen, P.; Mann, M. A strategy for identifying gel-separated proteins in sequence databases by MS alone. Biochem. Soc. Trans. 1996, 24, 893–896. [Google Scholar] [CrossRef] [Green Version]
  60. Shilov, I.V.; Seymour, S.L.; Patel, A.A.; Loboda, A.; Tang, W.H.; Keating, S.P.; Hunter, C.L.; Nuwaysir, L.M.; Schaeffer, D.A. The paragon algorithm, a next generation search engine that uses sequence temperature values and feature probabilities to identify peptides from tandem mass spectra. Mol. Cell Proteom. 2007, 6, 1638–1655. [Google Scholar] [CrossRef] [Green Version]
  61. Tang, W.H.; Shilov, I.V.; Seymour, S.L. Nonlinear fitting method for determining local false discovery rates from decoy database searches. J. Proteome Res. 2008, 7, 3661–3667. [Google Scholar] [CrossRef]
  62. Szklarczyk, D.; Franceschini, A.; Wyder, S.; Forslund, K.; Heller, D.; Huerta-Cepas, J.; Simonovic, M.; Roth, A.; Santos, A.; Tsafou, K.P.; et al. STRING v10: Protein-protein interaction networks, integrated over the tree of life. Nucleic Acids Res. 2015, 43, D447–D452. [Google Scholar] [CrossRef] [PubMed]
  63. Robin, X.; Turck, N.; Hainard, A.; Tiberti, N.; Lisacek, F.; Sanchez, J.-C.; Müller, M. pROC: An open-source package for R and Sþ to analyze and compare ROC curves. BMC Bioinform. 2011, 12, 77. [Google Scholar] [CrossRef] [PubMed]
  64. DeLong, E.R.; DeLong, D.M.; Clarke-Pearson, D.L. Comparing the areas under two or more correlated receiver operating characteristic curves: A nonparametric approach. Biometrics 1988, 44, 837–845. [Google Scholar] [CrossRef] [PubMed]
  65. Fawcett, T. An introduction to ROC analysis. Pattern Recogn. Lett. 2006, 27, 861–874. [Google Scholar] [CrossRef]
  66. Tirumalai, R.S.; Chan, K.C.; Prieto, D.A.; Issaq, H.J.; Conrads, T.P.; Veenstra, T.D. Characterization of the low molecular weight human serum proteome. Mol. Cell. Proteom. 2003, 2, 1096–1103. [Google Scholar] [CrossRef] [Green Version]
  67. Cui, R.; Zhang, P.; Li, Y. Role of Carboxypeptidase N Invasion and Migration in Breast Cancer. Anti-Cancer Agents Med. Chem. 2016, 16, 1198–1202. [Google Scholar] [CrossRef]
  68. Xu, X.; Wan, J.; Yuan, L.; Ba, J.; Feng, P.; Long, W.; Huang, H.; Liu, P.; Cai, Y.; Liu, M.; et al. Serum levels of apolipoprotein E correlates with disease progression and poor prognosis in breast cancer. Tumor Biol. 2016, 37, 15959–15966. [Google Scholar] [CrossRef]
  69. Zhou, Y.; Luo, G. Apolipoproteins, as the carrier proteins for lipids, are involved in the development of breast cancer. Clin. Transl. Oncol. 2020, 22, 1952–1962. [Google Scholar] [CrossRef]
  70. Okuturlar, Y.; Gunaldi, M.; Kocoglu, H.; Hursitoglu, M.; Gedikbasi, A.; Acarer, D.; Harmankaya, O.; Kumbasar, A. Serum paraoxonase and arylesterase can be useful markers to predict neoadjuvant chemotherapy requirement in patients with breast cancer. J. Cancer Res. Ther. 2018, 14, S362–S367. [Google Scholar]
  71. Lima, L.G.; Monteiro, R.Q. Activation of blood coagulation in cancer: Implications for tumour progression. Biosci. Rep. 2013, 33, e00064. [Google Scholar] [CrossRef]
  72. Metelli, A.; Wu, B.X.; Riesenberg, B.; Guglietta, S.; Huck, J.D.; Mills, C.; Li, A.; Rachidi, S.; Krieg, C.; Rubinstein, M.P.; et al. Thrombin contributes to cancer immune evasion via proteolysis of platelet-bound GARP to activate LTGF-β. Sci. Transl. Med. 2020, 12, eaay4860. [Google Scholar] [CrossRef] [PubMed]
  73. Hisada, Y.; Mackman, N. Cancer-associated pathways and biomarkers of venous thrombosis. Blood 2017, 130, 1499–1506. [Google Scholar] [CrossRef] [PubMed]
  74. Ruf, W.; Rothmeier, A.S.; Graf, C. Targeting clotting proteins in cancer therapy—progress and challenges. Thromb. Res. 2016, 140, S1–S7. [Google Scholar] [CrossRef] [Green Version]
  75. Zelvyte, I.; Sjögren, H.O.; Janciauskiene, S. Effects of native and cleaved forms of alpha1-antitrypsin on ME 1477 tumor cell functional activity. Cancer Detect. Prev. 2002, 26, 256–265. [Google Scholar] [CrossRef]
  76. Lal, I.; Dittus, K.; Holmes, C.E. Platelets, coagulation and fibrinolysis in breast cancer progression. Breast Cancer Res. 2013, 15, 207. [Google Scholar] [CrossRef] [Green Version]
  77. Tas, F.; Kilic, L.; Duranyildiz, D. Coagulation tests show significant differences in patients with breast cancer. Tumor Biol. 2014, 35, 5985–5992. [Google Scholar] [CrossRef]
  78. Yigit, E.; Gönüllü, G.; Yücel, I.; Turgut, M.; Erdem, D.; Cakar, B. Relation between hemostatic parameters and prognostic/predictive factors in breast cancer. Eur. J. Intern. Med. 2008, 19, 602–607. [Google Scholar] [CrossRef]
  79. Zacharski, L.R.; Henderson, W.G.; Rickles, F.R.; Forman, W.B.; Cornell, C.J., Jr.; Forcier, A.J.; Edwards, R.L.; Headley, E.; Kim, S.-H.; O’Donnell, J.F.; et al. Effect of warfarin anticoagulation on survival in carcinoma of the lung, colon, head and neck, and prostate. Cancer 1984, 53, 2046–2052. [Google Scholar] [CrossRef]
  80. Kolev, M.; Maciej, M. Targeting complement-mediated immunoregulation for cancer immunotherapy. Semin. Immunol. 2018, 37, 85–97. [Google Scholar] [CrossRef]
  81. Habermann, J.K.; Roblick, U.J.; Luke, B.T.; Prieto, D.A.; Finlay, W.J.; Podust, V.N.; Roman, J.M.; Oevermann, E.; Schiedeck, T.; Homann, N.; et al. Increased serum levels of complement C3a anaphylatoxin indicate the presence of colorectal tumors. Gastroenterology 2006, 131, 1020–1029. [Google Scholar] [CrossRef] [Green Version]
  82. Ward, D.G.; Suggett, N.; Cheng, Y.; Wei, W.; Johnson, H.; Billingham, L.J.; Ismail, T.; Wakelam, M.J.; Johnson, P.J.; Martin, A. Identification of serum biomarkers for colon cancer by proteomic analysis. Br. J. Cancer 2006, 94, 1898–1905. [Google Scholar] [CrossRef] [PubMed] [Green Version]
  83. Nakshatri, H.; Qi, Q.; You, J.; Kerry, B.; Schneider, B.; Zon, R.; Buck, C.; Regnier, F.; Wang, M. Intrinsic subtype-associated changes in the plasma proteome in breast cancer. Proteom. Clin. Appl. 2009, 3, 1305–1313. [Google Scholar] [CrossRef] [PubMed]
  84. Gonçalves, A.; Esterni, B.; Bertucci, F.; Sauvan, R.; Chabannon, C.; Cubizolles, M.; Bardou, V.J.; Houvenaegel, G.; Jacquemier, J.; Granjeaud, S.; et al. Postoperative serum proteomic profiles may predict metastatic relapse in high-risk primary breast cancer patients receiving adjuvant chemotherapy. Oncogene 2006, 25, 981–998. [Google Scholar] [CrossRef]
  85. Michlmayr, A.; Bachleitner-Hofmann, T.; Baumann, S.; Marchetti-Deschmann, M.; Rech-Weichselbraun, I.; Burghuber, C.; Pluschnig, U.; Bartsch, R.; Graf, A.; Greil, R.; et al. Modulation of plasma complement by the initial dose of epirubicin/docetaxel therapy in breast cancer and its predictive value. Br. J. Cancer 2010, 103, 1201–1208. [Google Scholar] [CrossRef] [PubMed] [Green Version]
  86. Ricklin, D.; Mastellos, D.C.; Reis, E.S.; Lambris, J.D. The renaissance of complement therapeutics. Nat. Rev. Nephrol. 2018, 14, 26–47. [Google Scholar] [CrossRef] [Green Version]
  87. Surace, L.; Lysenko, V.; Fontana, A.O.; Cecconi, V.; Janssen, H.; Bicvic, A.; Okoniewski, M.; Pruschy, M.; Dummer, R.; Neefjes, J.; et al. Complement is a central mediator of radiotherapy-induced tumor-specific immunity and clinical response. Immunity 2015, 42, 767–777. [Google Scholar] [CrossRef] [Green Version]
  88. Lu, Y.; Zhao, Q.; Liao, J.-Y.; Song, E.; Xia, Q.; Pan, J.; Li, Y.; Li, J.; Zhou, B.; Ye, Y.; et al. Complement Signals Determine Opposite Effects of B Cells in Chemotherapy-Induced Immunity. Cell 2020, 180, 1081–1097. [Google Scholar] [CrossRef]
  89. Cibeira, G.H.; Giacomazzi, J.; Aguiar, E.; Schneider, S.; Ettrich, B.; De Souza, C.I.; Camey, S.; Caleffi, M.; Weber, B.; Ashton-Prolla, P.; et al. Apolipoprotein E genetic polymorphism, serum lipoprotein levels and breast cancer risk: A case-control study. Mol. Clin. Oncol. 2014, 2, 1009–1015. [Google Scholar] [CrossRef]
  90. Liu, J.-X.; Yuan, Q.; Min, Y.-L.; He, Y.; Xu, Q.-H.; Li, B.; Shi, W.-Q.; Lin, Q.; Li, Q.-H.; Zhu, P.-W.; et al. Apolipoprotein A1 and B as risk factors for development of intraocular metastasis in patients with breast cancer. Cancer Manag. Res. 2019, 11, 2881–2888. [Google Scholar] [CrossRef] [Green Version]
  91. Oddoze, C.; Michel, B.F. Apolipoprotein Ea4 allele predicts a better response to donepezil therapy in Alzheimer’s disease. Alzheimer’s Rep. 2000, 3, 213–216. [Google Scholar]
  92. Del Boccio, P.; Perrotti, F.; Rossi, C.; Cicalini, I.; Di Santo, S.; Zucchelli, M.; Sacchetta, P.; Genovesi, D.; Pieragostino, D. Serum lipidomic study reveals potential early biomarkers for predicting response to chemoradiation therapy in advanced rectal cancer: A pilot study. Adv. Radiat. Oncol. 2017, 2, 118–124. [Google Scholar] [CrossRef] [PubMed] [Green Version]
  93. Guo, S.; Chen, C.; Zeng, Z.; Wang, Q.; Jiang, W.; Gao, Y.; Chang, H. Serum Apolipoprotein A-I Predicts Response of Rectal Cancer to Neoadjuvant Chemoradiotherapy. Cancer Manag. Res. 2021, 13, 2623–2631. [Google Scholar] [CrossRef] [PubMed]
  94. Fan, Y.; Shi, L.; Liu, Q.; Dong, R.; Zhang, Q.; Yang, S.; Fan, Y.; Yang, H.; Wu, P.; Yu, J.; et al. Discovery and identification of potential biomarkers of papillary thyroid carcinoma. Mol. Cancer 2009, 8, 79. [Google Scholar] [CrossRef] [PubMed] [Green Version]
  95. Honda, K.; Okusaka, T.; Felix, K.; Nakamori, S.; Sata, N.; Nagai, H.; Ioka, T.; Tsuchida, A.; Shimahara, T.; Shimahara, M.; et al. Altered plasma apolipoprotein modifications in patients with pancreatic cancer: Protein characterization and multi-institutional validation. PLoS ONE 2012, 7, e46908. [Google Scholar] [CrossRef] [PubMed]
  96. Shi, J.; Yang, H.; Duan, X.; Li, L.; Sun, L.; Li, Q.; Zhang, J. Apolipoproteins as Differentiating and Predictive Markers for Assessing Clinical Outcomes in Patients with Small Cell Lung Cancer. Yonsei Med. J. 2016, 57, 549–556. [Google Scholar] [CrossRef]
  97. Kardassis, D.; Pardali, K.; Zannis, V.I. SMAD proteins transactivate the human ApoCIII promoter by interacting physically and functionally with hepatocyte nuclear factor 4. J. Biol. Chem. 2000, 275, 41405–41414. [Google Scholar] [CrossRef] [Green Version]
  98. Fraser, J.D.; Martinez, V.; Straney, R.; Briggs, M.R. DNA binding and transcription activation specificity of hepatocyte nuclear factor 4. Nucleic Acids Res. 1998, 26, 2702–2707. [Google Scholar] [CrossRef] [Green Version]
  99. Sanchez, L.M.; Diez-Itza, I.; Vizoso, F.; Lopez-Otin, C. Cholesterol and apolipoprotein D in gross cystic disease of the breast. Clin Chem. 1992, 38, 695–698. [Google Scholar] [CrossRef]
  100. Diez-Itza, I.; Vizoso, F.; Merino, A.M.; Sanchez, L.M.; Tolivia, J.; Fernandez, J.; Ruibal, A.; López-Otín, C. Expression and prognostic signifcance of apolipoprotein D in breast cancer. Am. J. Pathol. 1994, 144, 310–320. [Google Scholar]
  101. Sivaraman, V.S.; Wang, H.; Nuovo, G.J.; Malbon, C.C. Hyperexpression of mitogen-activated protein kinase in human breast cancer. J. Clin. Investig. 1997, 99, 1478–1483. [Google Scholar] [CrossRef]
  102. Sarjeant, J.M.; Lawrie, A.; Kinnear, C.; Yablonsky, S.; Leung, W.; Massaeli, H.; Prichett, W.; Veinot, J.P.; Rassart, E.; Rabinovitch, M. Apolipoprotein D inhibits platelet-derived growth factor-BB-induced vascular smooth muscle cell proliferated by preventing translocation of phosphorylated extracellular signal regulated kinase 1/2 to the nucleus. Arterioscler. Thromb. Vasc. Biol. 2003, 23, 2172–2177. [Google Scholar] [CrossRef]
  103. Romano, M.; Claria, J. Cyclooxygenase-2 and 5-lipoxygenase converging functions on cell proliferation and tumor angiogenesis: Implications for cancer therapy. FASEB J. 2003, 17, 1986–1995. [Google Scholar] [CrossRef] [Green Version]
  104. Matsuyama, M.; Yoshimura, R.; Mitsuhashi, M.; Tsuchida, K.; Takemoto, Y.; Kawahito, Y.; Sano, H.; Nakatani, T. 5-Lipoxygenase inhibitors attenuate growth of human renal cell carcinoma and induce apoptosis through arachidonic acid pathway. Oncol. Rep. 2005, 14, 73–79. [Google Scholar] [PubMed]
  105. Soiland, H.; Soreide, K.; Janssen, E.A.; Korner, H.; Baak, J.P.; Soreide, J.A. Emerging concepts of apolipoprotein D with possible implications for breast cancer. Cell. Oncol. 2007, 29, 195–209. [Google Scholar] [CrossRef] [PubMed]
  106. Lamelas, M.L.; Vazquez, J.; Enguita, M.I.; Rodriguez, J.C.; Gonzalez, L.O.; Merino, A.M.; Vizoso, F. Apolipoprotein D expression in metastasic lymph nodes of breast cancer. Int. J. Surg. Investig. 2000, 2, 285–293. [Google Scholar] [PubMed]
  107. Carreno, G.; Del Casar, J.M.; Corte, M.D.; Gonzalez, L.O.; Bongera, M.; Merino, A.M.; Juan, G.; Obregón, R.; Martínez, E.; Vizoso, F.J. Local recurrence after mastectomy for breast cancer: Analysis of clinicopathological, biological and prognostic characteristics. Breast Cancer Res. Treat. 2007, 102, 61–73. [Google Scholar] [CrossRef] [PubMed]
  108. Do Carmo, S.; Levros, L.C., Jr.; Rassart, E. Modulation of apolipoprotein D expression and translocation under specific stress conditions. Biochim. Biophys. Acta 2007, 1773, 954–969. [Google Scholar] [CrossRef] [PubMed] [Green Version]
  109. Harding, C.; Osundeko, O.; Tetlow, L.; Faragher, E.B.; Howell, A.; Bundred, N.J. Hormonally-regulated proteins in breast secretions are markers of target organ sensitivity. Br. J. Cancer. 2000, 82, 354–360. [Google Scholar] [CrossRef]
  110. Simard, J.; Dauvois, S.; Haagensen, D.E.; Levesque, C.; Merand, Y.; Labrie, F. Regulation of progesterone-binding breast cyst protein GCDFP-24 secretion by estrogens and androgens in human breast cancer cells: A new marker of steroid action in breast cancer. Endocrinology 1990, 126, 3223–3231. [Google Scholar] [CrossRef]
  111. Beelen, K.; Zwart, W.; Linn, S.C. Can predictive biomarkers in breast cancer guide adjuvant endocrine therapy? Nat. Rev. Clin. Oncol. 2012, 9, 529–541. [Google Scholar] [CrossRef]
  112. Soreide, J.A.; Lea, O.A.; Anda, O.; Skarstein, A.; Varhaug, J.E.; Kvinnsland, S. Progesterone-binding cyst protein (PBCP) in operable breast cancer: Correlations with prognostic factors and predictive value for effect of adjuvant tamoxifen treatment. Anticancer Res. 1991, 11, 601–605. [Google Scholar] [PubMed]
  113. Kiselar, J.G.; Janmey, P.A.; Almo, S.C.; Chance, M.R. Visualizing the Ca2+-dependent activation of gelsolin by using synchrotron footprinting. Proc. Natl. Acad. Sci. USA 2003, 100, 3942–3947. [Google Scholar] [CrossRef] [PubMed] [Green Version]
  114. Yin, H.L.; Stossel, T.P. Control of cytoplasmic actin gel–sol transformation by gelsolin, a calcium-dependent regulatory protein. Nature 1979, 281, 583–586. [Google Scholar] [CrossRef] [PubMed]
  115. Li, G.H.; Arora, P.D.; Chen, Y.; McCulloch, C.A.; Liu, P. Multifunctional roles of gelsolin in health and diseases. Med. Res. Rev. 2012, 32, 999–1025. [Google Scholar] [CrossRef] [PubMed]
  116. Baig, R.M.; Mahjabeen, I.; Sabir, M.; Masood, N.; Ali, K.; Malik, F.A.; Kayani, M.A. Mutational spectrum of gelsolin and its down regulation is associated with breast cancer. Dis. Markers 2013, 34, 71–80. [Google Scholar] [CrossRef]
  117. Visapää, H.; Bui, M.; Huang, Y.; Seligson, D.; Tsai, H.; Pantuck, A.; Figlin, R.; Rao, J.Y.; Belldegrun, A.; Horvath, S.; et al. Correlation of Ki-67 and gelsolin expression to clinical outcome in renal clear cell carcinoma. Urology 2003, 61, 845–850. [Google Scholar] [CrossRef]
  118. Litwin, M.; Nowak, D.; Mazur, A.J.; Baczyńska, D.; Mannherz, H.G.; Malicka-Błaszkiewicz, M. Gelsolin affects the migratory ability of human colon adenocarcinoma and melanoma cells. Life Sci. 2012, 90, 851–861. [Google Scholar] [CrossRef]
  119. Radwanska, A.; Litwin, M.; Nowak, D.; Baczynska, D.; Wegrowski, Y.; Maquart, F.X.; Malicka-Blaszkiewicz, M. Overexpression of lumican affects the migration of human colon cancer cells through up-regulation of gelsolin and filamentous actin reorganization. Exp. Cell Res. 2012, 318, 2312–2323. [Google Scholar] [CrossRef]
  120. Deng, R.; Hao, J.; Han, W.; Ni, Y.; Huang, X.; Hu, Q. Gelsolin regulates proliferation, apoptosis, migration and invasion in human oral carcinoma cells. Oncol. Lett. 2015, 9, 2129–2134. [Google Scholar] [CrossRef]
  121. Shieh, D.B.; Chen, I.W.; Wei, T.Y.; Shao, C.Y.; Chang, H.J.; Chung, C.H.; Wong, T.Y.; Jin, Y.T. Tissue expression of gelsolin in oral carcinogenesis progression and its clinicopathological implications. Oral Oncol. 2006, 42, 599–606. [Google Scholar] [CrossRef]
  122. Liu, J.; Liu, Y.G.; Huang, R.; Yao, C.; Li, S.; Yang, W.; Yang, N.; Huang, R. Concurrent downregulation of Egr-1 and gelsolin in the majority of human breast cancer cells. Cancer Genom. Proteom. 2007, 4, 377–385. [Google Scholar]
  123. Thor, A.D.; Edgerton, S.M.; Liu, S.; Moore, D.H., 2nd; Kwiatkowski, D.J. Gelsolin as a negative prognostic factor and effector of motility in erbB-2-positive epidermal growth factor receptor-positive breast cancers. Clin. Cancer Res. 2001, 7, 2415–2424. [Google Scholar] [PubMed]
  124. Winston, J.S.; Asch, H.L.; Zhang, P.J.; Edge, S.B.; Hyland, A.; Asch, B.B. Downregulation of gelsolin correlates with the progression to breast carcinoma. Breast Cancer Res. Treat. 2001, 65, 11–21. [Google Scholar] [CrossRef] [PubMed]
  125. Asch, H.L.; Winston, J.S.; Edge, S.B.; Stomper, P.C.; Asch, B.B. Down-regulation of gelsolin expression in human breast ductal carcinoma in situ with and without invasion. Breast Cancer Res. Treat. 1999, 55, 179–188. [Google Scholar] [CrossRef]
  126. Asch, H.L.; Head, K.; Dong, Y.; Natoli, F.; Winston, J.S.; Connolly, J.L.; Asch, B.B. Widespread loss of gelsolin in breast cancers of humans, mice, and rats. Cancer Res. 1996, 56, 4841–4845. [Google Scholar] [PubMed]
  127. Wang, P.W.; Abedini, M.R.; Yang, L.X.; Ding, A.A.; Figeys, D.; Chang, J.Y.; Tsang, B.K.; Shieh, D.-B. Gelsolin regulates cisplatin sensitivity in human head-and-neck cancer. Int. J. Cancer. 2014, 135, 2760–2769. [Google Scholar] [CrossRef] [PubMed] [Green Version]
  128. Abedini, M.R.; Wang, P.W.; Huang, Y.F.; Cao, M.; Chou, C.Y.; Shieh, D.B.; Tsang, B.K. Cell fate regulation by gelsolin in human gynecologic cancers. Proc. Natl. Acad. Sci. USA 2014, 111, 14442–14447. [Google Scholar] [CrossRef] [Green Version]
  129. Schmidt, M.; Hellwig, B.; Hammad, S.; Othman, A.; Lohr, M.; Chen, Z.; Boehm, D.; Gebhard, S.; Petry, I.; Lebrecht, A.; et al. A comprehensive analysis of human gene expression profiles identifies stromal immunoglobulin κ C as a compatible prognostic marker in human solid tumors. Clin. Cancer Res. 2012, 18, 2695–2703. [Google Scholar] [CrossRef] [Green Version]
  130. Chen, Z.; Gerhold-Ay, A.; Gebhard, S.; Boehm, D.; Solbach, C.; Lebrecht, A.; Battista, M.; Sicking, I.; Cotarelo, C.; Cadenas, C.; et al. Immunoglobulin kappa C predicts overall survival in node-negative breast cancer. PLoS ONE 2012, 7, e44741. [Google Scholar] [CrossRef] [Green Version]
  131. Schmidt, M.; Böhm, D.; von Törne, C.; Steiner, E.; Puhl, A.; Pilch, H.; Lehr, H.-A.; Hengstler, J.; Kölbl, H.; Gehrmann, M. The humoral immune system has a key prognostic impact in nodenegative breast cancer. Cancer Res. 2008, 68, 5405–5413. [Google Scholar] [CrossRef] [Green Version]
  132. Heimes, A.; Krämer, H.; Härtner, F.; Almstedt, K.; Krajnak, S.; Battista, M.J.; Brenner, W.; Hasenburg, A.; Schmidt, M. Prognostic Impact of Immunoglobulin Kappa C in Breast Cancer Patients Treated with Adjuvant Chemotherapy. Breast Care 2021, 16, 444–451. [Google Scholar] [CrossRef] [PubMed]
  133. Whiteside, T.L.; Ferrone, S. For Breast Cancer Prognosis, Immunoglobulin Kappa Chain Surfaces to the Top. Clin. Cancer Res. 2012, 18, 2417–2419. [Google Scholar] [CrossRef] [PubMed] [Green Version]
  134. Maehara, N.; Arai, S.; Mori, M.; Iwamura, Y.; Kurokawa, J.; Kai, T.; Kusunoki, S.; Taniguchi, K.; Ikeda, K.; Ohara, O.; et al. Circulating AIM prevents hepatocellular carcinoma through complement activation. Cell Rep. 2014, 9, 61–74. [Google Scholar] [CrossRef] [PubMed] [Green Version]
  135. Wang, W.-K.; Tsai, C.-H.; Liu, Y.-W.; Lai, C.-C.; Huang, C.-C.; Sheen-Chen, S.-M. Afamin expression in breast cancer. Asian J. Surg. 2020, 43, 750–754. [Google Scholar] [CrossRef]
  136. Melmer, A.; Fineder, L.; Lamina, C.; Kollerits, B.; Dieplinger, B.; Braicu, I.; Sehouli, J.; Cadron, I.; Vergote, I.; Mahner, S.; et al. Plasma concentrations of the vitamin E-binding protein afamin are associated with overall and progression-free survival and platinum sensitivity in serous ovarian cancer—A study by the OVCAD consortium. Gynecol. Oncol. 2013, 128, 38–43. [Google Scholar] [CrossRef]
  137. Li, Q.; Lin, Y.; Li, Q.; Lin, Y. Evaluation of Ficolin-3 as a Potential Prognostic Serum Biomarker in Chinese Patients with Esophageal Cancer. Genet. Test. Mol. Biomark. 2019, 23, 565–572. [Google Scholar] [CrossRef]
  138. Sahar, T.; Nigam, A.; Anjum, S.; Gupta, N.; Wajid, S. Secretome Profiling and Computational Biology of Human Leiomyoma Samples Unravel Molecular Signatures with Potential for Diagnostic and Therapeutic Interventions. Reprod. Sci. 2021, 28, 2672–2684. [Google Scholar] [CrossRef]
  139. Muranjan, M.; Nussenzweig, V.; Tomlinson, S. Characterization of the human serum trypanosome toxin, haptoglobin-related protein. J. Biol. Chem. 1998, 273, 3884–3887. [Google Scholar] [CrossRef] [Green Version]
Figure 1. A schematic diagram of experimental workflow.
Cancers 14 01087 g001
Figure 2. Venn diagram showing the number of proteins identified in the serum samples belonging to HER2-positive BC patients that were obtained before NAC. These patients showed a different response after the NAC treatment: responders (n = 6), non-responders (n = 4). Clusters found in the protein–protein interaction network map of the 43 and 54 genes encoded differentially proteins identified in serum samples from responders and non-responders before NAC, respectively. Based on the STRING database, a cluster of 14 proteins implicated in the complement and coagulation cascades were commonly identified in the serum of responders and non-responders (C1QB, C1QC, C2, C3, C4B, CFB, SERPINC1, SERPINF2, SERPING1, PROS1, VTN, A2M, CLU, KNG1), and a cluster of 8 proteins (C4BPA, C5, CFI, CFH, CFHR1, SERPINA1, F2, PLG) were specific to the non-responder’s group. Based on the STRING database, a cluster of 5 apolipoproteins were commonly identified in the serum of responders and non-responders (APOA1, APOA4, APOB, APOE, APOM), and APOC3 and APOD were specific of the responders and non-responders’ groups, respectively. A cluster of 8 proteins implicated in platelet degranulation (commonly identified in the serum of responders and non-responders (ALB, AHSG, APOH, FN1, HRG, ITIH3, ITIH4, TF) were also identified.
Cancers 14 01087 g002
Figure 3. Unsupervised analysis of differentially expressed proteins in serum from responders vs. non-responders to NAC by SWATH-MS. (A) Heat map showing hierarchical clustering between responders and non-responders to NAC using the top 38 differentially expressed proteins. Protein expression values were z-score normalized prior to clustering. (B) PCA analysis showing the separation of samples from responders (green) and non-responders (red) to NAC. (C) Volcano diagram resulting from the statistical analysis of the 306 proteins (library proteins) quantified among responder and non-responder groups. Proteins are separated according to the log2 of the FCh (x-axis) and the −log10 of the p-values based on a two-tailed t-test (y-axis).
Cancers 14 01087 g003
Figure 4. Comparison of the results obtained by the DDA analysis (qualitative) and the SWATH-MS analysis (quantitative).
Cancers 14 01087 g004
Figure 5. Box plots depicting the three-serum protein AFM, SERPINA1, and APOD levels in each of the study groups (responders and non-responders to NAC). Each data point represents the median value from a single sample. The line inside the box represents the median of all obtained values. The box’s upper and lower limits represent the first and third quartiles, respectively. Whiskers represent the lowest and highest values within 1.5 times the interquartile range. Outliers are any data points that are not included between the whiskers. * p < 0.05; *** p < 0.001.
Cancers 14 01087 g005
Figure 6. In silico validation after comparing the serum samples analysis from primary HER2-positive breast cancer cases to discover circulating proteins related to the NAC response with two quantitative proteomic methods: the isobaric TMT label-based and the SWATH-MS label-free (↓ denoted downregulation, ↑ denoted upregulation).
Cancers 14 01087 g006
Table 1. Clinical characteristics of the patient study group.
Pat. No.AgeTypeTumor SizeT-StageN-StageERPRHER-2GradingResponse Group
1 61Ductal3.42++A1NR
2 39Ductal2.62+++A1NR
3 55Ductal2.52+A2NR
4 58Ductal2.42A2NR
5 43Ductal2.42+A2R
6 36Ductal3.52++A2R
7 62Ductal3.22++A3R
8 64Ductal32++A2R
9 70Ductal2.42A3R
10 44Ductal5.53A2R
Abbreviations: ER = estrogen receptor; PR = progesterone receptor, HER-2 = human epidermal growth factor receptor; NR = non-responder; R = responder; A = amplified.
Table 2. Venn diagrams and table showing the number of proteins identified in the sera of HER2-positive BC patients (n = 6 responders, n = 4 non-responders) obtained before NAC by each treatment method and common to the three methods (method 1: analysis of the crude serum; method 2: AuNPs-PC analysis; method 3: PtNPs-PC analysis).
FractionNumber of Proteins Identified
TotalCommon
Classification Without NPs
(method 1)
With AuNPs
(method 2)
With PtNPs
(method 3)
Responders (n = 6)129615643
Non-responders (n = 4)1381006154
Cancers 14 01087 i001
Table 3. Proteins commonly identified by the three different treatment methods of serum samples obtained from HER2-positive BC patients before NAC (n = 6 responders, n = 4 non-responders) (method 1: analysis of the crude serum; method 2: AuNPs-PC analysis; method 3: PtNPs-PC analysis). The accession number, gene name, and species (Human) were reported.
Protein NameUniProt NameEntry NameGeneRespondersNon-Responders
Apolipoprotein C-IIIP02656APOC3_HUMANAPOC3X
GelsolinP06396GELS_HUMANGSNX
Immunoglobulin kappa constantP01834IGKC_HUMANIGKCX
Immunoglobulin lambda-like polypeptide 5B9A064IGLL5_HUMANIGLL5 X
CD5 antigen-likeO43866CD5L_HUMANCD5L X
AfaminP43652AFAM_HUMANAFM X
PlasminogenP00747PLMN_HUMANPLG X
Ficolin-3O75636FCN3_HUMANFCN3 X
Complement factor HP08603CFAH_HUMANCFH X
Complement factor H-related protein 1Q03591FHR1_HUMANCFHR1 X
Alpha-1-antitrypsinP01009A1AT_HUMANSERPINA1 X
C4b-binding protein alpha chainP04003C4BPA_HUMANC4BPA X
Complement factor IP05156CFAI_HUMANCFI X
Complement C5P01031CO5_HUMANC5 X
Apolipoprotein DP05090APOD_HUMANAPOD X
Haptoglobin-related proteinP00739HPTR_HUMANHPR X
ProthrombinP00734THRB_HUMANF2 X
Serum paraoxonase/arylesterase 1P27169PON1_HUMANPON1XX
Immunoglobulin heavy constant gamma 1P01857IGHG1_HUMANIGHG1XX
Inter-alpha-trypsin inhibitor heavy chain H3Q06033ITIH3_HUMANITIH3XX
Kininogen-1P01042KNG1_HUMANKNG1XX
Plasma protease C1 inhibitorP05155IC1_HUMANSERPING1XX
Inter-alpha-trypsin inhibitor heavy chain H2P19823ITIH2_HUMANITIH2XX
VitronectinP04004VTNC_HUMANVTNXX
Vitamin D-binding proteinP02774VTDB_HUMANGCXX
Inter-alpha-trypsin inhibitor heavy chain H1P19827ITIH1_HUMANITIH1XX
Complement C1q subcomponent subunit CP02747C1QC_HUMANC1QCXX
Antithrombin-IIIP01008ANT3_HUMANSERPINC1XX
FibronectinP02751FINC_HUMANFN1XX
Apolipoprotein A-IP02647APOA1_HUMANAPOA1XX
Complement C2P06681CO2_HUMANC2XX
HemopexinP02790HEMO_HUMANHPXXX
Apolipoprotein EP02649APOE_HUMANAPOEXX
Immunoglobulin heavy constant alpha 1P01876IGHA1_HUMANIGHA1XX
N-acetylmuramoyl-L-alanine amidaseQ96PD5PGRP2_HUMANPGLYRP2XX
HaptoglobinP00738HPT_HUMANHPTXX
Alpha-2-macroglobulinP01023A2MG_HUMANA2MXX
Vitamin K-dependent protein SP07225PROS_HUMANPROS1XX
Immunoglobulin heavy constant muP01871IGHM_HUMANIGHMXX
SerotransferrinP02787TRFE_HUMANTFXX
ClusterinP10909CLUS_HUMANCLUXX
Alpha-2-antiplasminP08697A2AP_HUMANSERPINF2XX
Carboxypeptidase N subunit 2P22792CPN2_HUMANCPN2XX
AlbuminP02768ALBU_HUMANALBXX
Complement factor BP00751CFAB_HUMANCFBXX
Inter-alpha-trypsin inhibitor heavy chain H4Q14624ITIH4_HUMANITIH4XX
Retinol-binding protein 4P02753RET4_HUMANRBP4XX
Complement C1q subcomponent subunit BP02746C1QB_HUMANC1QBXX
Complement C4-BP0C0L5CO4B_HUMANC4BXX
Apolipoprotein A-IVP06727APOA4_HUMANAPOA4XX
Alpha-2-HS-glycoproteinP02765FETUA_HUMANAHSGXX
Beta-2-glycoprotein 1P02749APOH_HUMANAPOHXX
Complement C3P01024CO3_HUMANC3XX
Apolipoprotein MO95445APOM_HUMANAPOMXX
Protein AMBPP02760AMBP_HUMANAMBPXX
Apolipoprotein B-100P04114APOB_HUMANAPOBXX
Histidine-rich glycoproteinP04196HRG_HUMANHRGXX
Table 4. Specific differentially expressed proteins detected in non-responder patients relative to the responders’ group after the analysis of serum samples (method 1) by SWATH-MS. The fold change ratio (FCh) was calculated as the ratio of the geometric mean of the samples, corresponding to the calculation of the normal arithmetic ratio of the logarithmic transformation and inverse transformation regions (↓ denoted downregulation, ↑ denoted upregulation).
Uniprot CodeGene NameProtein Namep-ValueFChResponse to NAC
P02741CRPC-reactive protein0.000001346.829624202↓Non-responders
P0DOX3N/AImmunoglobulin delta heavy chain0.0369598562.75912755↓Non-responders
P42858HTTHuntingtin0.0011659152.485533233↓Non-responders
A0A075B6I1IGLV4-60Immunoglobulin lambda variable 4-600.0004065972.458347205↓Non-responders
A0A0A0MT36IGKV6D-21Immunoglobulin kappa variable 6D-210.0035814972.197533513↓Non-responders
P0DJI8SAA1Serum amyloid A-1 protein0.006045571.859220088↓Non-responders
Q15485FCN2Ficolin-20.0003323231.677931316↓Non-responders
P04211IGLV7-43Immunoglobulin lambda variable 7-430.0379485471.658779213↓Non-responders
Q08380LGALS3BPGalectin-3-binding protein0.0065997061.630292329↓Non-responders
P00738HPHaptoglobin0.0042281081.588362659↓Non-responders
A0A0B4J1V6IGHV3-73Immunoglobulin heavy variable 3-730.0409075061.586899833↓Non-responders
P0DOX2N/AImmunoglobulin alpha-2 heavy chain0.0230746071.573627149↓Non-responders
P0C0L5C4BComplement C4-B0.0152148661.524647235↓Non-responders
P01766IGHV3-13Immunoglobulin heavy variable 3-130.0212404411.437890543↓Non-responders
P10720PF4V1Platelet factor 4 variant0.0163614851.340407061↓Non-responders
P05546SERPIND1Heparin cofactor 20.0015525331.328820011↓Non-responders
P02743APCSSerum amyloid P-component0.0190656121.322698566↓Non-responders
P43652AFMAfamin0.0012679061.29052425↓Non-responders
P02775PPBPPlatelet basic protein0.0169935731.271442298↓Non-responders
P36955SERPINF1Pigment epithelium-derived factor0.0001366471.257360069↓Non-responders
P04114APOBApolipoprotein B-1000.0309023991.257016742↓Non-responders
P01009SERPINA1Alpha-1-antitrypsin0.0303987541.252498148↓Non-responders
P18428LBPLipopolysaccharide-binding protein0.0175446051.251259211↓Non-responders
P25311AZGP1Zinc-alpha-2-glycoprotein0.0006693431.225228845↓Non-responders
P02763ORM1Alpha-1-acid glycoprotein 10.0410983541.176485834↓Non-responders
P02649APOEApolipoprotein E0.0481655561.174660228↓Non-responders
P05090APODApolipoprotein D0.0427434680.873825169↑ Non-responders
P22792CPN2Carboxypeptidase N subunit 20.0299514140.826212759↑ Non-responders
A0A0B4J1X5IGHV3-74Immunoglobulin heavy variable 3-740.0438845680.824616939↑ Non-responders
P01599IGKV1-17Immunoglobulin kappa variable 1-170.0143601620.779005563↑ Non-responders
P27169PON1Serum paraoxonase/arylesterase 10.0013605550.744636131↑ Non-responders
P04433IGKV3-11Immunoglobulin kappa variable 3-110.0006348980.712186884↑ Non-responders
A0A087WSX0IGLV5-45Immunoglobulin lambda variable 5-450.0320894510.703275957↑ Non-responders
A0A075B6S5IGKV1-27Immunoglobulin kappa variable 1-270.000909620.698043088↑ Non-responders
Q5U7I5TTRTransthyretin0.036355070.684353438↑ Non-responders
P01594IGKV1-33Immunoglobulin kappa variable 1-330.0023379470.679286204↑ Non-responders
A0A0C4DH31IGHV1-18Immunoglobulin heavy variable 1-180.0064524330.573322357↑ Non-responders
Q9NPH3IL1RAPInterleukin-1 receptor accessory protein0.000005860.518752156↑ Non-responders
Publisher’s Note: MDPI stays neutral with regard to jurisdictional claims in published maps and institutional affiliations.

