
Comparison of Risk Factors for Cholangiocarcinoma and Hepatocellular Carcinoma: A Prospective Cohort Study in Korean Adults


Abstract
:Simple Summary
Abstract
1. Introduction
2. Patients and Methods
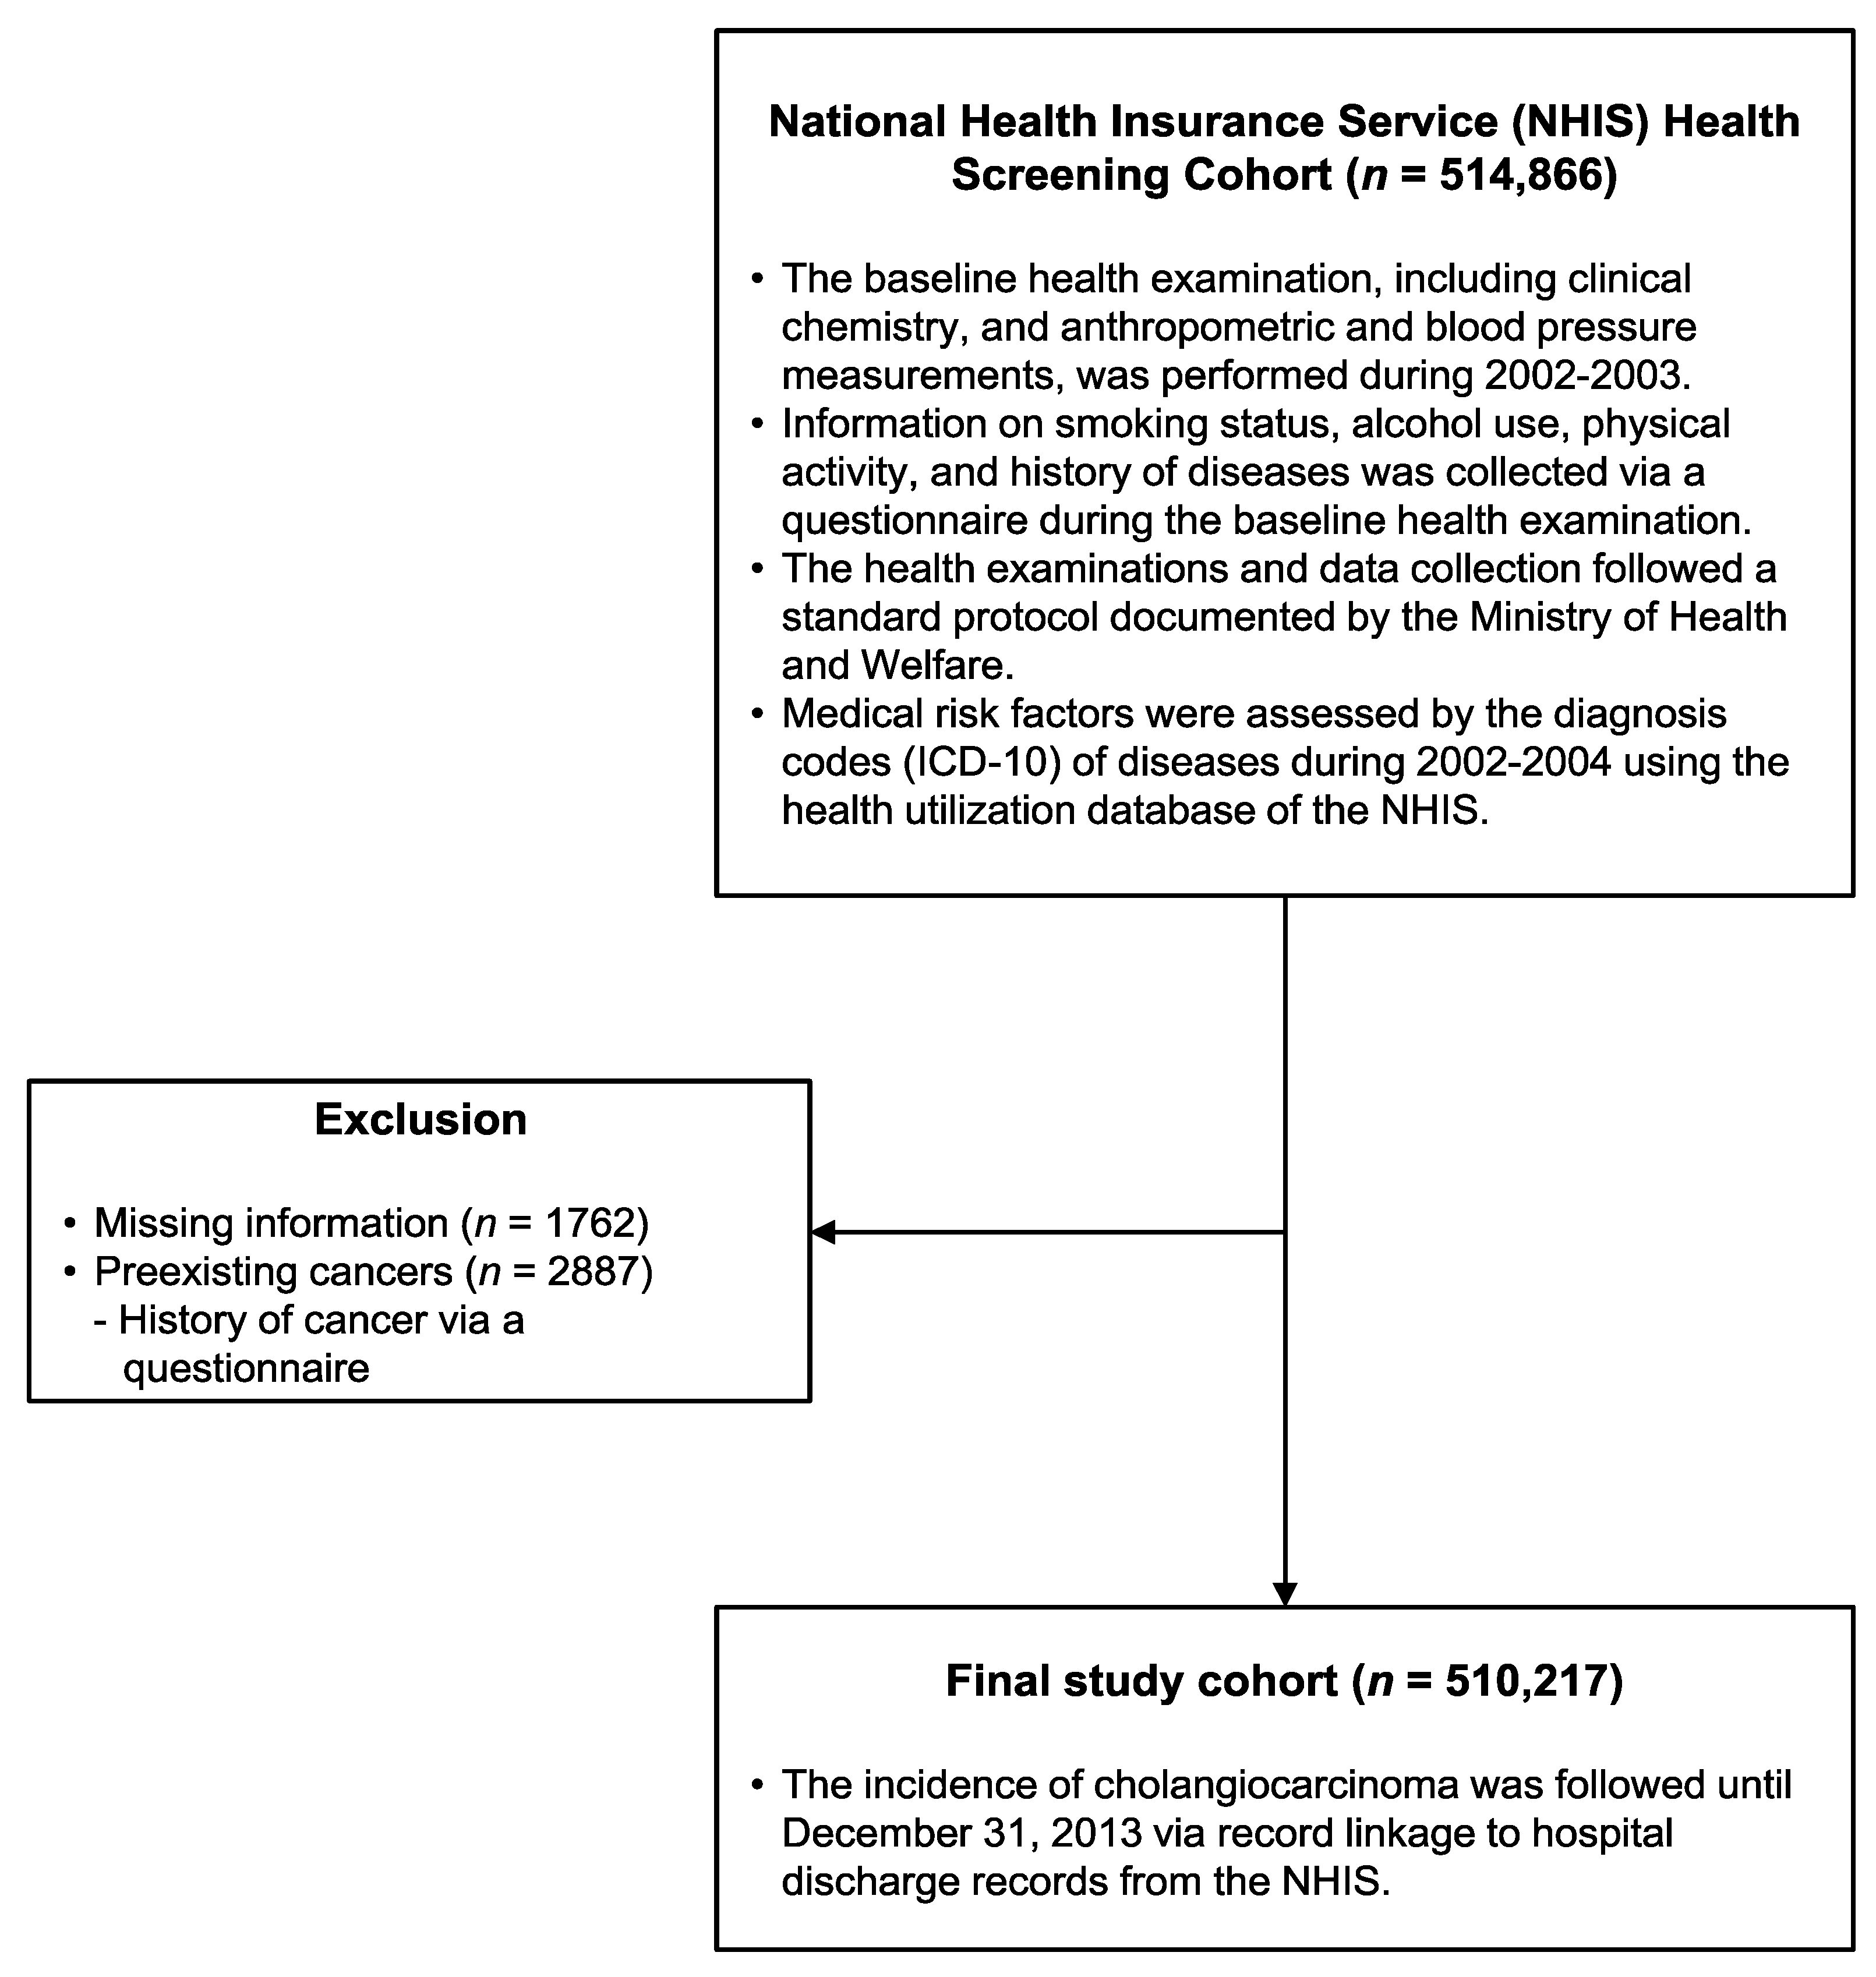
2.1. Study Population and Follow-Up
2.2. Data Collection
2.3. Medical Risk Factors at Baseline
2.4. Statistical Analysis
3. Results
3.1. Baseline Characteristics
3.2. Identification and Comparison of Risk Factors of CCA and HCC
3.3. Differences in Risk Factors between iCCA and eCCA
3.4. Analysis According to the Presence of a Liver Disorder
4. Discussion
5. Conclusions
Supplementary Materials
Author Contributions
Funding
Institutional Review Board Statement
Informed Consent Statement
Data Availability Statement
Conflicts of Interest
References
- Saha, S.K.; Zhu, A.X.; Fuchs, C.S.; Brooks, G.A. Forty-year trends in cholangiocarcinoma incidence in the U.S.: Intrahepatic disease on the rise. Oncologist 2016, 21, 594–599. [Google Scholar] [CrossRef] [PubMed] [Green Version]
- El-Serag, H.B.; Davila, J.A.; Petersen, N.J.; McGlynn, K.A. The continuing increase in the incidence of hepatocellular carcinoma in the united states: An update. Ann. Intern. Med. 2003, 139, 817–823. [Google Scholar] [CrossRef]
- Petrick, J.L.; Kelly, S.P.; Altekruse, S.F.; McGlynn, K.A.; Rosenberg, P.S. Future of hepatocellular carcinoma incidence in the united states forecast through 2030. J. Clin. Oncol. 2016, 34, 1787–1794. [Google Scholar] [CrossRef] [PubMed]
- Jung, K.W.; Won, Y.J.; Hong, S.; Kong, H.J.; Im, J.S.; Seo, H.G. Prediction of cancer incidence and mortality in Korea, 2021. Cancer Res. Treat. 2021, 53, 316–322. [Google Scholar] [CrossRef] [PubMed]
- Massarweh, N.N.; El-Serag, H.B. Epidemiology of hepatocellular carcinoma and intrahepatic cholangiocarcinoma. Cancer Control 2017, 24, 1073274817729245. [Google Scholar] [CrossRef]
- Palmer, W.C.; Patel, T. Are common factors involved in the pathogenesis of primary liver cancers? A meta-analysis of risk factors for intrahepatic cholangiocarcinoma. J. Hepatol. 2012, 57, 69–76. [Google Scholar] [CrossRef] [PubMed] [Green Version]
- Patel, T. New insights into the molecular pathogenesis of intrahepatic cholangiocarcinoma. J. Gastroenterol. 2014, 49, 165–172. [Google Scholar] [CrossRef] [PubMed] [Green Version]
- Shaib, Y.H.; El-Serag, H.B.; Davila, J.A.; Morgan, R.; McGlynn, K.A. Risk factors of intrahepatic cholangiocarcinoma in the united states: A case-control study. Gastroenterology 2005, 128, 620–626. [Google Scholar] [CrossRef]
- Tyson, G.L.; El-Serag, H.B. Risk factors for cholangiocarcinoma. Hepatology 2011, 54, 173–184. [Google Scholar] [CrossRef] [PubMed]
- Ishiguro, S.; Inoue, M.; Kurahashi, N.; Iwasaki, M.; Sasazuki, S.; Tsugane, S. Risk factors of biliary tract cancer in a large-scale population-based cohort study in Japan (jphc study); with special focus on cholelithiasis, body mass index, and their effect modification. Cancer Causes Control 2008, 19, 33–41. [Google Scholar] [CrossRef]
- Petrick, J.L.; Yang, B.; Altekruse, S.F.; Van Dyke, A.L.; Koshiol, J.; Graubard, B.I.; McGlynn, K.A. Risk factors for intrahepatic and extrahepatic cholangiocarcinoma in the united states: A population-based study in seer-medicare. PLoS ONE 2017, 12, e0186643. [Google Scholar] [CrossRef] [PubMed] [Green Version]
- Khan, S.A.; Tavolari, S.; Brandi, G. Cholangiocarcinoma: Epidemiology and risk factors. Liver Int. 2019, 39, 19–31. [Google Scholar] [CrossRef] [PubMed] [Green Version]
- Yi, S.W.; Choi, J.S.; Yi, J.J.; Lee, Y.H.; Han, K.J. Risk factors for hepatocellular carcinoma by age, sex, and liver disorder status: A prospective cohort study in korea. Cancer 2018, 124, 2748–2757. [Google Scholar] [CrossRef] [PubMed] [Green Version]
- Yi, S.W.; Ohrr, H.; Shin, S.A.; Yi, J.J. Sex-age-specific association of body mass index with all-cause mortality among 12.8 million korean adults: A prospective cohort study. Int. J. Epidemiol. 2015, 44, 1696–1705. [Google Scholar] [CrossRef] [PubMed] [Green Version]
- Seo, H.J.; Oh, I.H.; Yoon, S.J. A comparison of the cancer incidence rates between the national cancer registry and insurance claims data in korea. Asian Pac. J. Cancer Prev. 2012, 13, 6163–6168. [Google Scholar] [CrossRef] [PubMed] [Green Version]
- Oh, C.M.; Won, Y.J.; Jung, K.W.; Kong, H.J.; Cho, H.; Lee, J.K.; Lee, D.H.; Lee, K.H.; Community of Population-Based Regional Cancer Registers. Cancer statistics in Korea: Incidence, mortality, survival, and prevalence in 2013. Cancer Res. Treat. 2016, 48, 436–450. [Google Scholar] [CrossRef] [PubMed] [Green Version]
- Yi, S.W.; Kim, S.H.; Han, K.J.; Yi, J.J.; Ohrr, H. Higher cholesterol levels, not statin use, are associated with a lower risk of hepatocellular carcinoma. Br. J. Cancer 2020, 122, 630–633. [Google Scholar] [CrossRef]
- Welzel, T.M.; Graubard, B.I.; El-Serag, H.B.; Shaib, Y.H.; Hsing, A.W.; Davila, J.A.; McGlynn, K.A. Risk factors for intrahepatic and extrahepatic cholangiocarcinoma in the united states: A population-based case-control study. Clin. Gastroenterol. Hepatol. 2007, 5, 1221–1228. [Google Scholar] [CrossRef] [PubMed] [Green Version]
- Chang, J.S.; Tsai, C.R.; Chen, L.T. Medical risk factors associated with cholangiocarcinoma in taiwan: A population-based case-control study. PLoS ONE 2013, 8, e69981. [Google Scholar] [CrossRef]
- Huang, Y.J.; Wu, A.T.; Chiou, H.Y.; Chuang, M.T.; Meng, T.C.; Chien, L.N.; Yen, Y. Interactive role of diabetes mellitus and female sex in the risk of cholangiocarcinoma: A population-based nested case-control study. Oncotarget 2017, 8, 6642–6651. [Google Scholar] [CrossRef] [PubMed] [Green Version]
- Tsai, M.S.; Lee, P.H.; Lin, C.L.; Peng, C.L.; Kao, C.H. Type ii diabetes mellitus is associated with a reduced risk of cholangiocarcinoma in patients with biliary tract diseases. Int. J. Cancer. 2015, 136, 2409–2417. [Google Scholar] [CrossRef] [PubMed]
- Kuper, H.; Ye, W.; Broome, U.; Romelsjo, A.; Mucci, L.A.; Ekbom, A.; Adami, H.O.; Trichopoulos, D.; Nyren, O. The risk of liver and bile duct cancer in patients with chronic viral hepatitis, alcoholism, or cirrhosis. Hepatology 2001, 34, 714–718. [Google Scholar] [CrossRef] [PubMed]
- Sorensen, H.T.; Friis, S.; Olsen, J.H.; Thulstrup, A.M.; Mellemkjaer, L.; Linet, M.; Trichopoulos, D.; Vilstrup, H.; Olsen, J. Risk of liver and other types of cancer in patients with cirrhosis: A nationwide cohort study in denmark. Hepatology 1998, 28, 921–925. [Google Scholar] [CrossRef] [PubMed]
- Lee, S.S.; Byoun, Y.S.; Jeong, S.H.; Kim, Y.M.; Gil, H.; Min, B.Y.; Seong, M.H.; Jang, E.S.; Kim, J.W. Type and cause of liver disease in korea: Single-center experience, 2005–2010. Clin. Mol. Hepatol. 2012, 18, 309–315. [Google Scholar] [CrossRef] [PubMed]
- Michitaka, K.; Nishiguchi, S.; Aoyagi, Y.; Hiasa, Y.; Tokumoto, Y.; Onji, M.; Japan Etiology of Liver Cirrhosis Study, G. Etiology of liver cirrhosis in japan: A nationwide survey. J. Gastroenterol. 2010, 45, 86–94. [Google Scholar] [CrossRef] [PubMed]
- Nilsson, E.; Anderson, H.; Sargenti, K.; Lindgren, S.; Prytz, H. Clinical course and mortality by etiology of liver cirrhosis in sweden: A population based, long-term follow-up study of 1317 patients. Aliment. Pharmacol. Ther. 2019, 49, 1421–1430. [Google Scholar] [CrossRef] [PubMed]
- Schuppan, D.; Afdhal, N.H. Liver cirrhosis. Lancet 2008, 371, 838–851. [Google Scholar] [CrossRef]
- Lee, B.S.; Park, E.C.; Park, S.W.; Nam, C.M.; Roh, J. Hepatitis b virus infection, diabetes mellitus, and their synergism for cholangiocarcinoma development: A case-control study in korea. World J. Gastroenterol. 2015, 21, 502–510. [Google Scholar] [CrossRef] [PubMed]
- Lee, T.Y.; Lee, S.S.; Jung, S.W.; Jeon, S.H.; Yun, S.C.; Oh, H.C.; Kwon, S.; Lee, S.K.; Seo, D.W.; Kim, M.H.; et al. Hepatitis b virus infection and intrahepatic cholangiocarcinoma in korea: A case-control study. Am. J. Gastroenterol. 2008, 103, 1716–1720. [Google Scholar] [CrossRef]
- Zhou, Y.M.; Yin, Z.F.; Yang, J.M.; Li, B.; Shao, W.Y.; Xu, F.; Wang, Y.L.; Li, D.Q. Risk factors for intrahepatic cholangiocarcinoma: A case-control study in china. World J. Gastroenterol. 2008, 14, 632–635. [Google Scholar] [CrossRef]
- Wu, Z.F.; Yang, N.; Li, D.Y.; Zhang, H.B.; Yang, G.S. Characteristics of intrahepatic cholangiocarcinoma in patients with hepatitis b virus infection: Clinicopathologic study of resected tumours. J. Viral Hepat. 2013, 20, 306–310. [Google Scholar] [CrossRef] [PubMed]
- El-Serag, H.B. Hepatocellular carcinoma. N. Engl. J. Med. 2011, 365, 1118–1127. [Google Scholar] [CrossRef] [PubMed]
- Siegel, R.L.; Miller, K.D.; Jemal, A. Cancer statistics, 2018. CA Cancer J. Clin. 2018, 68, 7–30. [Google Scholar] [CrossRef] [PubMed]
- Stinton, L.M.; Shaffer, E.A. Epidemiology of gallbladder disease: Cholelithiasis and cancer. Gut Liver 2012, 6, 172–187. [Google Scholar] [CrossRef] [PubMed] [Green Version]
- Tsai, C.J.; Leitzmann, M.F.; Willett, W.C.; Giovannucci, E.L. Prospective study of abdominal adiposity and gallstone disease in us men. Am. J. Clin. Nutr. 2004, 80, 38–44. [Google Scholar] [CrossRef]
- Li, V.K.; Pulido, N.; Fajnwaks, P.; Szomstein, S.; Rosenthal, R.; Martinez-Duartez, P. Predictors of gallstone formation after bariatric surgery: A multivariate analysis of risk factors comparing gastric bypass, gastric banding, and sleeve gastrectomy. Surg. Endosc. 2009, 23, 1640–1644. [Google Scholar] [CrossRef] [PubMed]
- Maclure, K.M.; Hayes, K.C.; Colditz, G.A.; Stampfer, M.J.; Speizer, F.E.; Willett, W.C. Weight, diet, and the risk of symptomatic gallstones in middle-aged women. N. Engl. J. Med. 1989, 321, 563–569. [Google Scholar] [CrossRef]
- Ballotari, P.; Vicentini, M.; Manicardi, V.; Gallo, M.; Chiatamone Ranieri, S.; Greci, M.; Giorgi Rossi, P. Diabetes and risk of cancer incidence: Results from a population-based cohort study in northern italy. BMC Cancer 2017, 17, 703. [Google Scholar] [CrossRef] [PubMed]
- Inoue, M.; Iwasaki, M.; Otani, T.; Sasazuki, S.; Noda, M.; Tsugane, S. Diabetes mellitus and the risk of cancer: Results from a large-scale population-based cohort study in japan. Arch. Intern. Med. 2006, 166, 1871–1877. [Google Scholar] [CrossRef] [PubMed] [Green Version]
- Shikata, K.; Ninomiya, T.; Kiyohara, Y. Diabetes mellitus and cancer risk: Review of the epidemiological evidence. Cancer Sci. 2013, 104, 9–14. [Google Scholar] [CrossRef]
- Adami, H.O.; Chow, W.H.; Nyren, O.; Berne, C.; Linet, M.S.; Ekbom, A.; Wolk, A.; McLaughlin, J.K.; Fraumeni, J.F., Jr. Excess risk of primary liver cancer in patients with diabetes mellitus. J. Natl. Cancer Inst. 1996, 88, 1472–1477. [Google Scholar] [CrossRef] [Green Version]
- Lo, S.F.; Chang, S.N.; Muo, C.H.; Chen, S.Y.; Liao, F.Y.; Dee, S.W.; Chen, P.C.; Sung, F.C. Modest increase in risk of specific types of cancer types in type 2 diabetes mellitus patients. Int. J. Cancer 2013, 132, 182–188. [Google Scholar] [CrossRef]
- Picardi, A.; D’Avola, D.; Gentilucci, U.V.; Galati, G.; Fiori, E.; Spataro, S.; Afeltra, A. Diabetes in chronic liver disease: From old concepts to new evidence. Diabetes Metab. Res. Rev. 2006, 22, 274–283. [Google Scholar] [CrossRef] [PubMed]
- Nielsen, M.F.; Caumo, A.; Aagaard, N.K.; Chandramouli, V.; Schumann, W.C.; Landau, B.R.; Schmitz, O.; Vilstrup, H. Contribution of defects in glucose uptake to carbohydrate intolerance in liver cirrhosis: Assessment during physiological glucose and insulin concentrations. Am. J. Physiol. Gastrointest. Liver Physiol. 2005, 288, G1135–G1143. [Google Scholar] [CrossRef] [PubMed] [Green Version]
- Garcia-Compean, D.; Jaquez-Quintana, J.O.; Gonzalez-Gonzalez, J.A.; Maldonado-Garza, H. Liver cirrhosis and diabetes: Risk factors, pathophysiology, clinical implications and management. World J. Gastroenterol. 2009, 15, 280–288. [Google Scholar] [CrossRef]
- Choi, J.; Ghoz, H.M.; Peeraphatdit, T.; Baichoo, E.; Addissie, B.D.; Harmsen, W.S.; Therneau, T.M.; Olson, J.E.; Chaiteerakij, R.; Roberts, L.R. Aspirin use and the risk of cholangiocarcinoma. Hepatology 2016, 64, 785–796. [Google Scholar] [CrossRef] [PubMed] [Green Version]
- Komuta, M.; Spee, B.; Vander Borght, S.; De Vos, R.; Verslype, C.; Aerts, R.; Yano, H.; Suzuki, T.; Matsuda, M.; Fujii, H.; et al. Clinicopathological study on cholangiolocellular carcinoma suggesting hepatic progenitor cell origin. Hepatology 2008, 47, 1544–1556. [Google Scholar] [CrossRef] [PubMed] [Green Version]

| Variable/Group | Total Cohort | CCA Cases | iCCA Cases | eCCA Cases | HCC Cases | |||||||||
|---|---|---|---|---|---|---|---|---|---|---|---|---|---|---|
| n = 510,217 | n = 1388 | p | n = 821 | p | n = 567 | p | n = 2920 | p | ||||||
| Age, years | 53.0 | ±9.7 | 62.0 | ±9.1 | <0.001 | 61.3 | ±9.2 | <0.001 | 63.0 | ±8.9 | <0.001 | 56.2 | ±9.4 | <0.001 |
| Body mass index, kg/m2 | 24.0 | ±3.0 | 24.1 | ±3.0 | 0.444 | 24.0 | ±3.0 | 0.751 | 24.1 | ±3.1 | 0.415 | 23.9 | ±3.0 | 0.236 |
| Fasting glucose, mg/dL | 98.4 | ±34.8 | 104.8 | ±43.5 | <0.001 | 103.6 | ±42.2 | <0.001 | 106.4 | ±45.3 | <0.001 | 108.2 | ±49.3 | <0.001 |
| Total cholesterol, mg/dL | 200.5 | ±38.7 | 197.6 | ±38.6 | 0.006 | 195.4 | ±37.7 | <0.001 | 200.9 | ±38.7 | 0.811 | 177.9 | ±37.2 | <0.001 |
| ALT, IU/L | 26.1 | ±21.6 | 28.9 | ±25.2 | <0.001 | 29.1 | ±22.7 | <0.001 | 28.6 | ±28.5 | <0.001 | 56.5 | ±54.9 | <0.001 |
| AST, IU/L | 27.1 | ±18.4 | 31.4 | ±19.9 | <0.001 | 31.7 | ±20.2 | <0.001 | 30.9 | ±19.5 | <0.001 | 60.5 | ±50.4 | <0.001 |
| Sex, men | 277,067 | (54.3) | 945 | (68.1) | <0.001 | 565 | (68.8) | <0.001 | 363 | (64.0) | <0.001 | 2407 | (82.4) | <0.001 |
| Smoking status | <0.001 | <0.001 | 0.05 | <0.001 | ||||||||||
| Never smoker | 327,361 | (64.2) | 794 | (57.2) | 459 | (55.9) | 328 | (57.8) | 1424 | (48.8) | ||||
| Past smoker | 43,311 | (8.5) | 143 | (10.3) | 82 | (10.0) | 55 | (9.7) | 347 | (11.9) | ||||
| Current smoker, <1 pack/day | 92,113 | (18.1) | 318 | (22.9) | 191 | (23.3) | 119 | (21.0) | 863 | (29.6) | ||||
| ≥1 pack/day | 25,868 | (5.1) | 84 | (6.1) | 57 | (6.9) | 27 | (4.8) | 158 | (5.4) | ||||
| Missing data | 21,564 | (4.2) | 49 | (3.5) | 32 | (3.9) | 16 | (2.8) | 128 | (4.4) | ||||
| Alcohol use, g ethanol/day | <0.001 | <0.001 | <0.001 | <0.001 | ||||||||||
| None | 282,941 | (55.5) | 743 | (53.5) | 433 | (52.7) | 299 | (52.7) | 1387 | (47.5) | ||||
| <10 | 101,672 | (19.9) | 222 | (16.0) | 125 | (15.2) | 94 | (16.6) | 542 | (18.6) | ||||
| 10–39 | 89,512 | (17.5) | 277 | (20.0) | 172 | (21.0) | 99 | (17.5) | 632 | (21.6) | ||||
| ≥40 | 24,260 | (4.8) | 120 | (8.6) | 70 | (8.5) | 48 | (8.5) | 284 | (9.7) | ||||
| Missing data | 11,832 | (2.3) | 26 | (1.9) | 21 | (2.6) | 5 | (0.9) | 75 | (2.6) | ||||
| Physical activity | 0.001 | 0.003 | 0.118 | 0.701 | ||||||||||
| ≥1 times/week | 209,650 | (41.1) | 512 | (36.9) | 296 | (36.1) | 206 | (36.3) | 1210 | (41.4) | ||||
| Income status, decile | <0.001 | 0.002 | 0.001 | (0.0) | <0.001 | |||||||||
| <4 (low-income) | 117,458 | (23.0) | 378 | (27.2) | 223 | (27.2) | 151 | (26.6) | 738 | (25.3) | ||||
| 4–7 | 166,212 | (32.6) | 480 | (34.6) | 278 | (33.9) | 193 | (34.0) | 993 | (34.0) | ||||
| >7 (high-income) | 226,547 | (44.4) | 530 | (38.2) | 320 | (39.0) | 201 | (35.4) | 1189 | (40.7) | ||||
| Body mass index, kg/m2 | 0.435 | 0.822 | 0.372 | 0.794 | ||||||||||
| <18.5 | 11,722 | (2.3) | 35 | (2.5) | 18 | (2.2) | 16 | (2.8) | 73 | (2.5) | ||||
| 18.5–24.9 | 319,295 | (62.6) | 847 | (61.0) | 504 | (61.4) | 326 | (57.5) | 1840 | (63.0) | ||||
| 25–29.9 | 164,528 | (32.2) | 458 | (33.0) | 272 | (33.1) | 183 | (32.3) | 927 | (31.7) | ||||
| ≥30 | 14,672 | (2.9) | 48 | (3.5) | 27 | (3.3) | 20 | (3.5) | 80 | (2.7) | ||||
| Diabetes status | <0.001 | <0.001 | <0.001 | <0.001 | ||||||||||
| Normoglycemia | 342,697 | (67.2) | 796 | (57.3) | 493 | (60.0) | 292 | (51.5) | 1640 | (56.2) | ||||
| IFG | 114,658 | (22.5) | 341 | (24.6) | 192 | (23.4) | 145 | (25.6) | 693 | (23.7) | ||||
| Diabetes | 52,862 | (10.4) | 251 | (18.1) | 136 | (16.6) | 108 | (19.0) | 587 | (20.1) | ||||
| ALT, IU/L | <0.001 | <0.001 | <0.001 | <0.001 | ||||||||||
| <20 | 220,083 | (43.1) | 481 | (34.7) | 289 | (35.2) | 192 | (33.9) | 299 | (10.2) | ||||
| 20–39 | 224,450 | (44.0) | 691 | (49.8) | 394 | (48.0) | 297 | (52.4) | 1029 | (35.2) | ||||
| 40–59 | 43,744 | (8.6) | 139 | (10.0) | 88 | (10.7) | 51 | (9.0) | 711 | (24.3) | ||||
| 60–79 | 12,065 | (2.4) | 43 | (3.1) | 28 | (3.4) | 15 | (2.6) | 372 | (12.7) | ||||
| ≥80 | 9875 | (1.9) | 34 | (2.4) | 22 | (2.7) | 12 | (2.1) | 509 | (17.4) | ||||
| Comorbid liver disease | ||||||||||||||
| Viral hepatitis | 4655 | (0.9) | 25 | (1.8) | <0.001 | 18 | (2.2) | <0.001 | 7 | (1.2) | 0.361 | 401 | (13.7) | <0.001 |
| Hepatitis B virus infection | 2712 | (0.5) | 14 | (1.0) | 0.014 | 9 | (1.1) | 0.026 | 5 | (0.9) | 0.215 | 287 | (9.8) | <0.001 |
| Hepatitis C virus infection | 516 | (0.1) | 3 | (0.2) | 0.177 | 2 | (0.2) | 0.199 | 1 | (0.2) | 0.545 | 57 | (2.0) | <0.001 |
| Liver flukes | 361 | (0.1) | 1 | (0.1) | 0.986 | 1 | (0.1) | 0.582 | 0 | (0.0) | 0.534 | 1 | (0.0) | 0.457 |
| Nonviral liver disease | 14,334 | (2.8) | 60 | (4.3) | 0.001 | 39 | (4.8) | 0.001 | 19 | (3.4) | 0.339 | 548 | (18.8) | <0.001 |
| Liver cirrhosis | 1114 | (0.2) | 4 | (0.3) | 0.577 | 3 | (0.4) | 0.366 | 1 | (0.2) | 0.862 | 255 | (8.7) | <0.001 |
| Alcoholic liver disease | 2864 | (0.6) | 15 | (1.1) | 0.01 | 7 | (0.9) | 0.264 | 8 | (1.4) | 0.005 | 81 | (2.8) | <0.001 |
| NASH/NAFLD | 2010 | (0.4) | 7 | (0.5) | 0.511 | 6 | (0.7) | 0.123 | 1 | (0.2) | 0.433 | 16 | (0.5) | 0.183 |
| Biliary tract disease | ||||||||||||||
| Cholelithiasis | 878 | (0.2) | 18 | (1.3) | <0.001 | 9 | (1.1) | <0.001 | 8 | (1.4) | <0.001 | 13 | (0.4) | <0.001 |
| Choledocholithiasis | 212 | (0.0) | 11 | (0.8) | <0.001 | 5 | (0.6) | <0.001 | 5 | (0.9) | <0.001 | 2 | (0.1) | 0.474 |
| Variable/Group | CCA Incidence a | HCC Incidence b | p-Value for Heterogeneity | ||||||
|---|---|---|---|---|---|---|---|---|---|
| No. of Cases | p | HR | (95% CI) | No. of Cases | p | HR | (95% CI) | ||
| Age, years | |||||||||
| Per 10-year older | 1388 | <0.001 | 2.59 | (2.13–3.14) | 2920 | <0.001 | 1.62 | (1.42–1.85) | <0.001 |
| Sex, men (vs. women) | 945 | <0.001 | 1.91 | (1.66–2.19) | 2407 | <0.001 | 3.77 | (3.38–4.20) | <0.001 |
| Smoking status | |||||||||
| Never smoker | 794 | 1.00 | (Reference) | 1424 | 1.00 | (Reference) | |||
| Past smoker | 143 | 0.154 | 1.15 | (0.95–1.36) | 347 | 0.163 | 1.09 | (0.97–1.24) | 0.664 |
| Current smoker, <1 pack/day | 318 | <0.001 | 1.31 | (1.13–1.52) | 863 | <0.001 | 1.35 | (1.23–1.49) | 0.701 |
| ≥1 pack/day | 84 | 0.002 | 1.46 | (1.14–1.85) | 158 | 0.116 | 0.87 | (0.73–1.03) | 0.001 |
| Alcohol use, g ethanol/day | |||||||||
| None | 743 | 1.00 | (Reference) | 1387 | 1.00 | (Reference) | |||
| <10 | 222 | 0.257 | 0.91 | (0.78–1.07) | 542 | 0.002 | 0.84 | (0.76–0.94) | 0.430 |
| 10–39 | 277 | 0.032 | 1.19 | (1.01–1.39) | 632 | 0.402 | 0.96 | (0.86–1.06) | 0.025 |
| ≥40 | 120 | <0.001 | 1.54 | (1.25–1.89) | 284 | <0.001 | 1.40 | (1.22–1.60) | 0.460 |
| Per 140 g ethanol/week increase | 1388 | <0.001 | 1.12 | (1.06–1.17) | 2920 | <0.001 | 1.11 | (1.07–1.15) | 0.869 |
| Body mass index, kg/m2 | |||||||||
| <18.5 | 35 | 0.173 | 0.79 | (0.56–1.11) | 73 | 0.975 | 1.00 | (0.79–1.26) | 0.270 |
| 18.5–24.9 | 847 | 1.00 | (Reference) | 1840 | 1.00 | (Reference) | |||
| 25–29.9 | 458 | 0.157 | 1.09 | (0.97–1.22) | 927 | 0.578 | 0.98 | (0.90–1.06) | 0.139 |
| ≥30 | 48 | 0.025 | 1.40 | (1.04–1.88) | 80 | 0.380 | 1.11 | (0.88–1.38) | 0.212 |
| Per 5 kg/m2 increase | 1388 | 0.006 | 1.13 | (1.04–1.23) | 2920 | 0.864 | 0.99 | (0.93–1.06) | 0.020 |
| Diabetes status (serum glucose, mg/dL) | |||||||||
| Normoglycemia (<100) | 796 | 1.00 | (Reference) | 1640 | 1.00 | (Reference) | |||
| IFG (101–125) | 341 | 0.412 | 1.05 | (0.93–1.20) | 693 | 0.010 | 1.13 | (1.03–1.23) | 0.417 |
| Diabetes (≥126 or known diabetes) | 251 | <0.001 | 1.36 | (1.18–1.57) | 587 | <0.001 | 1.83 | (1.66–2.01) | 0.001 |
| Per 18 mg/dL increase | 1388 | 0.013 | 1.05 | (1.01–1.09) | 2920 | <0.001 | 1.12 | (1.10–1.15) | 0.002 |
| Alanine aminotransferase (ALT), IU/L | |||||||||
| <20 | 481 | <0.001 | 0.79 | (0.71–0.90) | 299 | <0.001 | 0.35 | (0.30–0.40) | <0.001 |
| 20–39 | 691 | 1.00 | (Reference) | 1029 | 1.00 | (Reference) | |||
| 40–59 | 139 | 0.164 | 1.14 | (0.95–1.37) | 711 | <0.001 | 3.47 | (3.15–3.83) | <0.001 |
| 60–79 | 43 | 0.056 | 1.35 | (0.99–1.84) | 372 | <0.001 | 6.09 | (5.39–6.88) | <0.001 |
| ≥80 | 34 | 0.135 | 1.30 | (0.92–1.84) | 509 | <0.001 | 8.63 | (7.70–9.66) | <0.001 |
| Total cholesterol, mg/dL | |||||||||
| Per 39 mg/dL increase | 1388 | 0.001 | 0.91 | (0.87–0.97) | 2920 | <0.001 | 0.55 | (0.53–0.57) | <0.001 |
| Comorbid liver disease | |||||||||
| Hepatitis B virus infection | 14 | <0.001 | 2.71 | (1.60–4.59) | 287 | <0.001 | 11.80 | (10.27–13.57) | <0.001 |
| Hepatitis C virus infection | 3 | 0.369 | 1.89 | (0.47–7.63) | 57 | <0.001 | 7.99 | (6.11–10.44) | 0.047 |
| Liver cirrhosis | 4 | 0.619 | 1.29 | (0.48–3.45) | 255 | <0.001 | 19.38 | (16.71–22.47) | <0.001 |
| Alcoholic liver disease | 15 | 0.151 | 1.45 | (0.87–2.43) | 81 | <0.001 | 1.79 | (1.42–2.24) | 0.474 |
| Biliary tract disease | |||||||||
| Cholelithiasis (gallstone disease) | 18 | 0.004 | 2.94 | (1.40–6.17) | 13 | 0.131 | 1.53 | (0.88–2.64) | 0.164 |
| Choledocholithiasis (bile duct stone) | 11 | <0.001 | 13.73 | (7.58–24.88) | 2 | 0.692 | 1.32 | (0.33–5.30) | 0.002 |
| Variable/Group | iCCA Incidence | eCCA Incidence | p-Value for Heterogeneity | ||||||
|---|---|---|---|---|---|---|---|---|---|
| No. of Cases | p | HR | (95% CI) | No. of Cases | p | HR | (95% CI) | ||
| Age, years | |||||||||
| Per 10-year older | 821 | <0.001 | 2.33 | (1.81–2.99) | 567 | <0.001 | 3.03 | (2.23–4.11) | 0.188 |
| Sex, men (vs. women) | 565 | <0.001 | 1.96 | (1.64–2.35) | 363 | <0.001 | 1.83 | (1.47–2.27) | 0.628 |
| Smoking status | |||||||||
| Never smoker | 459 | 1.00 | (Reference) | 328 | 1.00 | (Reference) | |||
| Past smoker | 82 | 0.361 | 1.12 | (0.87–1.44) | 55 | 0.257 | 1.18 | (0.88–1.59) | 0.791 |
| Current smoker, <1 pack/day | 191 | 0.004 | 1.33 | (1.10–1.61) | 119 | 0.035 | 1.28 | (1.02–1.62) | 0.823 |
| ≥1 pack/day | 57 | 0.001 | 1.64 | (1.21–2.20) | 27 | 0.419 | 1.19 | (0.78–1.80) | 0.219 |
| Alcohol use, g ethanol/day | |||||||||
| None | 433 | 1.00 | (Reference) | 299 | 1.00 | (Reference) | |||
| <10 | 125 | 0.145 | 0.86 | (0.69–1.06) | 94 | 0.988 | 1.00 | (0.78–1.27) | 0.345 |
| 10–39 | 172 | 0.065 | 1.21 | (0.99–1.48) | 99 | 0.268 | 1.15 | (0.90–1.48) | 0.767 |
| ≥40 | 70 | 0.006 | 1.46 | (1.11–1.92) | 48 | 0.002 | 1.65 | (1.19–2.28) | 0.576 |
| Per 140 g ethanol/week increase | 821 | 0.004 | 1.10 | (1.03–1.18) | 567 | 0.002 | 1.13 | (1.05–1.23) | 0.626 |
| Body mass index, kg/m2 | |||||||||
| <18.5 | 18 | 0.126 | 0.69 | (0.43–1.11) | 16 | 0.773 | 0.93 | (0.57–1.52) | 0.393 |
| 18.5–24.9 | 504 | 1.00 | (Reference) | 326 | 1.00 | (Reference) | |||
| 25–29.9 | 272 | 0.268 | 1.09 | (0.94–1.26) | 183 | 0.376 | 1.09 | (0.91–1.30) | 0.982 |
| ≥30 | 27 | 0.142 | 1.34 | (0.91–1.98) | 20 | 0.081 | 1.49 | (0.95–2.32) | 0.730 |
| Per 5 kg/m2 increase | 821 | 0.060 | 1.12 | (1.00–1.25) | 567 | 0.040 | 1.15 | (1.01–1.32) | 0.722 |
| Diabetes status (serum glucose, mg/dL) | |||||||||
| Normoglycemia (<100) | 493 | 1.00 | (Reference) | 292 | 1.00 | (Reference) | |||
| IFG (101–125) | 192 | 0.677 | 0.96 | (0.82–1.14) | 145 | 0.070 | 1.20 | (0.98–1.46) | 0.099 |
| Diabetes (≥126 or known diabetes) | 136 | 0.054 | 1.21 | (1.00–1.46) | 108 | <0.001 | 1.60 | (1.28–1.99) | 0.059 |
| Per 18 mg/dL increase | 821 | 0.170 | 1.04 | (0.99–1.09) | 567 | 0.026 | 1.06 | (1.01–1.12) | 0.476 |
| Alanine aminotransferase (ALT), IU/L | |||||||||
| <20 | 289 | 0.031 | 0.84 | (0.72–0.98) | 192 | 0.001 | 0.73 | (0.61–0.88) | 0.263 |
| 20–39 | 394 | 1.00 | (Reference) | 297 | 1.00 | (Reference) | |||
| 40–59 | 88 | 0.055 | 1.26 | (0.99–1.59) | 51 | 0.912 | 0.98 | (0.73–1.33) | 0.206 |
| 60–79 | 28 | 0.031 | 1.53 | (1.04–2.25) | 15 | 0.682 | 1.12 | (0.66–1.88) | 0.340 |
| ≥80 | 22 | 0.079 | 1.47 | (0.96–2.27) | 12 | 0.800 | 1.08 | (0.60–1.93) | 0.397 |
| Total cholesterol, mg/dL | |||||||||
| Per 39 mg/dL increase | 821 | <0.001 | 0.86 | (0.80–0.92) | 567 | 0.872 | 0.99 | (0.91–1.08) | 0.010 |
| Comorbid liver disease | |||||||||
| Hepatitis B virus infection | 9 | 0.002 | 2.90 | (1.50–5.60) | 5 | 0.049 | 2.42 | (1.00–5.85) | 0.747 |
| Hepatitis C virus infection | 2 | 0.668 | 1.54 | (0.21–11.02) | 1 | 0.673 | 1.53 | (0.21–10.89) | 0.996 |
| Liver cirrhosis | 3 | 0.416 | 1.61 | (0.51–5.04) | 1 | 0.828 | 0.80 | (0.11–5.75) | 0.551 |
| Alcoholic liver disease | 7 | 0.761 | 1.12 | (0.53–2.37) | 8 | 0.059 | 1.97 | (0.98–3.98) | 0.283 |
| Biliary tract disease | |||||||||
| Cholelithiasis (gallstone disease) | 9 | 0.036 | 2.87 | (1.07–7.66) | 8 | 0.055 | 3.04 | (0.98–9.48) | 0.938 |
| Choledocholithiasis (bile duct stone) | 5 | <0.001 | 10.90 | (4.52–26.28) | 5 | <0.001 | 17.54 | (7.84–39.26) | 0.434 |
| CCA Incidence | HCC Incidence | |||||||||||||||||
|---|---|---|---|---|---|---|---|---|---|---|---|---|---|---|---|---|---|---|
| Variable/Group | Normal Liver Group | Liver Disorder Group | Pinteraction§ | Normal Liver Group | Liver Disorder Group | Pinteraction§ | ||||||||||||
| No. of Cases | p | HR | 95% CI | No. of Cases | p | HR | 95% CI | No. of Cases | p | HR | 95% CI | No. of Cases | p | HR | 95% CI | |||
| Alcohol use, g ethanol/day | ||||||||||||||||||
| None | 144 | 1.00 | Reference | 599 | 1.00 | Reference | 357 | 1.00 | Reference | 1030 | 1.00 | Reference | ||||||
| <10 | 55 | 0.208 | 0.89 | 0.74–1.07 | 167 | 0.873 | 0.97 | 0.70–1.35 | 0.638 | 163 | 0.823 | 0.98 | 0.80–1.19 | 379 | <0.001 | 0.80 | 0.70–0.90 | 0.082 |
| 10–39 | 80 | 0.077 | 1.18 | 0.98–1.42 | 197 | 0.513 | 1.11 | 0.81–1.51 | 0.733 | 150 | 0.361 | 0.91 | 0.73–1.12 | 482 | 0.001 | 0.81 | 0.72–0.91 | 0.357 |
| ≥40 | 56 | 0.063 | 1.30 | 0.99–1.71 | 64 | 0.005 | 1.64 | 1.16–2.31 | 0.304 | 54 | 0.144 | 1.25 | 0.93–1.69 | 230 | 0.291 | 0.92 | 0.79–1.07 | 0.075 |
| 140 g ethanol/week | 343 | 0.027 | 1.08 | 1.01–1.16 | 1045 | 0.012 | 1.11 | 1.02–1.20 | 0.682 | 747 | 0.079 | 1.07 | 0.99–1.16 | 2173 | 0.875 | 1.00 | 0.96–1.04 | 0.101 |
| Alcohol use, frequency | ||||||||||||||||||
| None | 144 | 1.00 | Reference | 599 | 1.00 | Reference | 357 | 1.00 | Reference | 1030 | 1.00 | Reference | ||||||
| 2/month–2/week | 93 | 0.759 | 0.98 | 0.83–1.14 | 269 | 0.959 | 0.99 | 0.74–1.32 | 0.916 | 253 | 0.649 | 0.96 | 0.80–1.15 | 653 | <0.001 | 0.79 | 0.71–0.88 | 0.073 |
| 3–4 times/week | 99 | 0.757 | 1.04 | 0.81–1.34 | 168 | 0.368 | 1.19 | 0.82–1.73 | 0.565 | 122 | 0.583 | 0.92 | 0.70–1.23 | 450 | 0.053 | 0.86 | 0.74–1.00 | 0.655 |
| Almost daily | 7 | 0.003 | 1.42 | 1.12–1.80 | 9 | 0.018 | 1.50 | 1.07–2.11 | 0.789 | 15 | 0.101 | 1.27 | 0.95–1.69 | 40 | 0.247 | 0.91 | 0.78–1.07 | 0.046 |
Publisher’s Note: MDPI stays neutral with regard to jurisdictional claims in published maps and institutional affiliations. |
© 2022 by the authors. Licensee MDPI, Basel, Switzerland. This article is an open access article distributed under the terms and conditions of the Creative Commons Attribution (CC BY) license (https://creativecommons.org/licenses/by/4.0/).
Share and Cite
Cho, I.R.; Yi, S.-W.; Choi, J.S.; Yi, J.-J. Comparison of Risk Factors for Cholangiocarcinoma and Hepatocellular Carcinoma: A Prospective Cohort Study in Korean Adults. Cancers 2022, 14, 1709. https://doi.org/10.3390/cancers14071709
Cho IR, Yi S-W, Choi JS, Yi J-J. Comparison of Risk Factors for Cholangiocarcinoma and Hepatocellular Carcinoma: A Prospective Cohort Study in Korean Adults. Cancers. 2022; 14(7):1709. https://doi.org/10.3390/cancers14071709
Chicago/Turabian StyleCho, In Rae, Sang-Wook Yi, Ja Sung Choi, and Jee-Jeon Yi. 2022. "Comparison of Risk Factors for Cholangiocarcinoma and Hepatocellular Carcinoma: A Prospective Cohort Study in Korean Adults" Cancers 14, no. 7: 1709. https://doi.org/10.3390/cancers14071709
APA StyleCho, I. R., Yi, S.-W., Choi, J. S., & Yi, J.-J. (2022). Comparison of Risk Factors for Cholangiocarcinoma and Hepatocellular Carcinoma: A Prospective Cohort Study in Korean Adults. Cancers, 14(7), 1709. https://doi.org/10.3390/cancers14071709