
Deciphering Tumour Microenvironment of Liver Cancer through Deconvolution of Bulk RNA-Seq Data with Single-Cell Atlas

 ,
, 
Abstract
:Simple Summary
Abstract
1. Introduction
2. Materials and Methods
2.1. Data Obtainment
2.2. Pre-Processing of Microarray Data
2.3. Pre-Processing of RNA-Seq Data
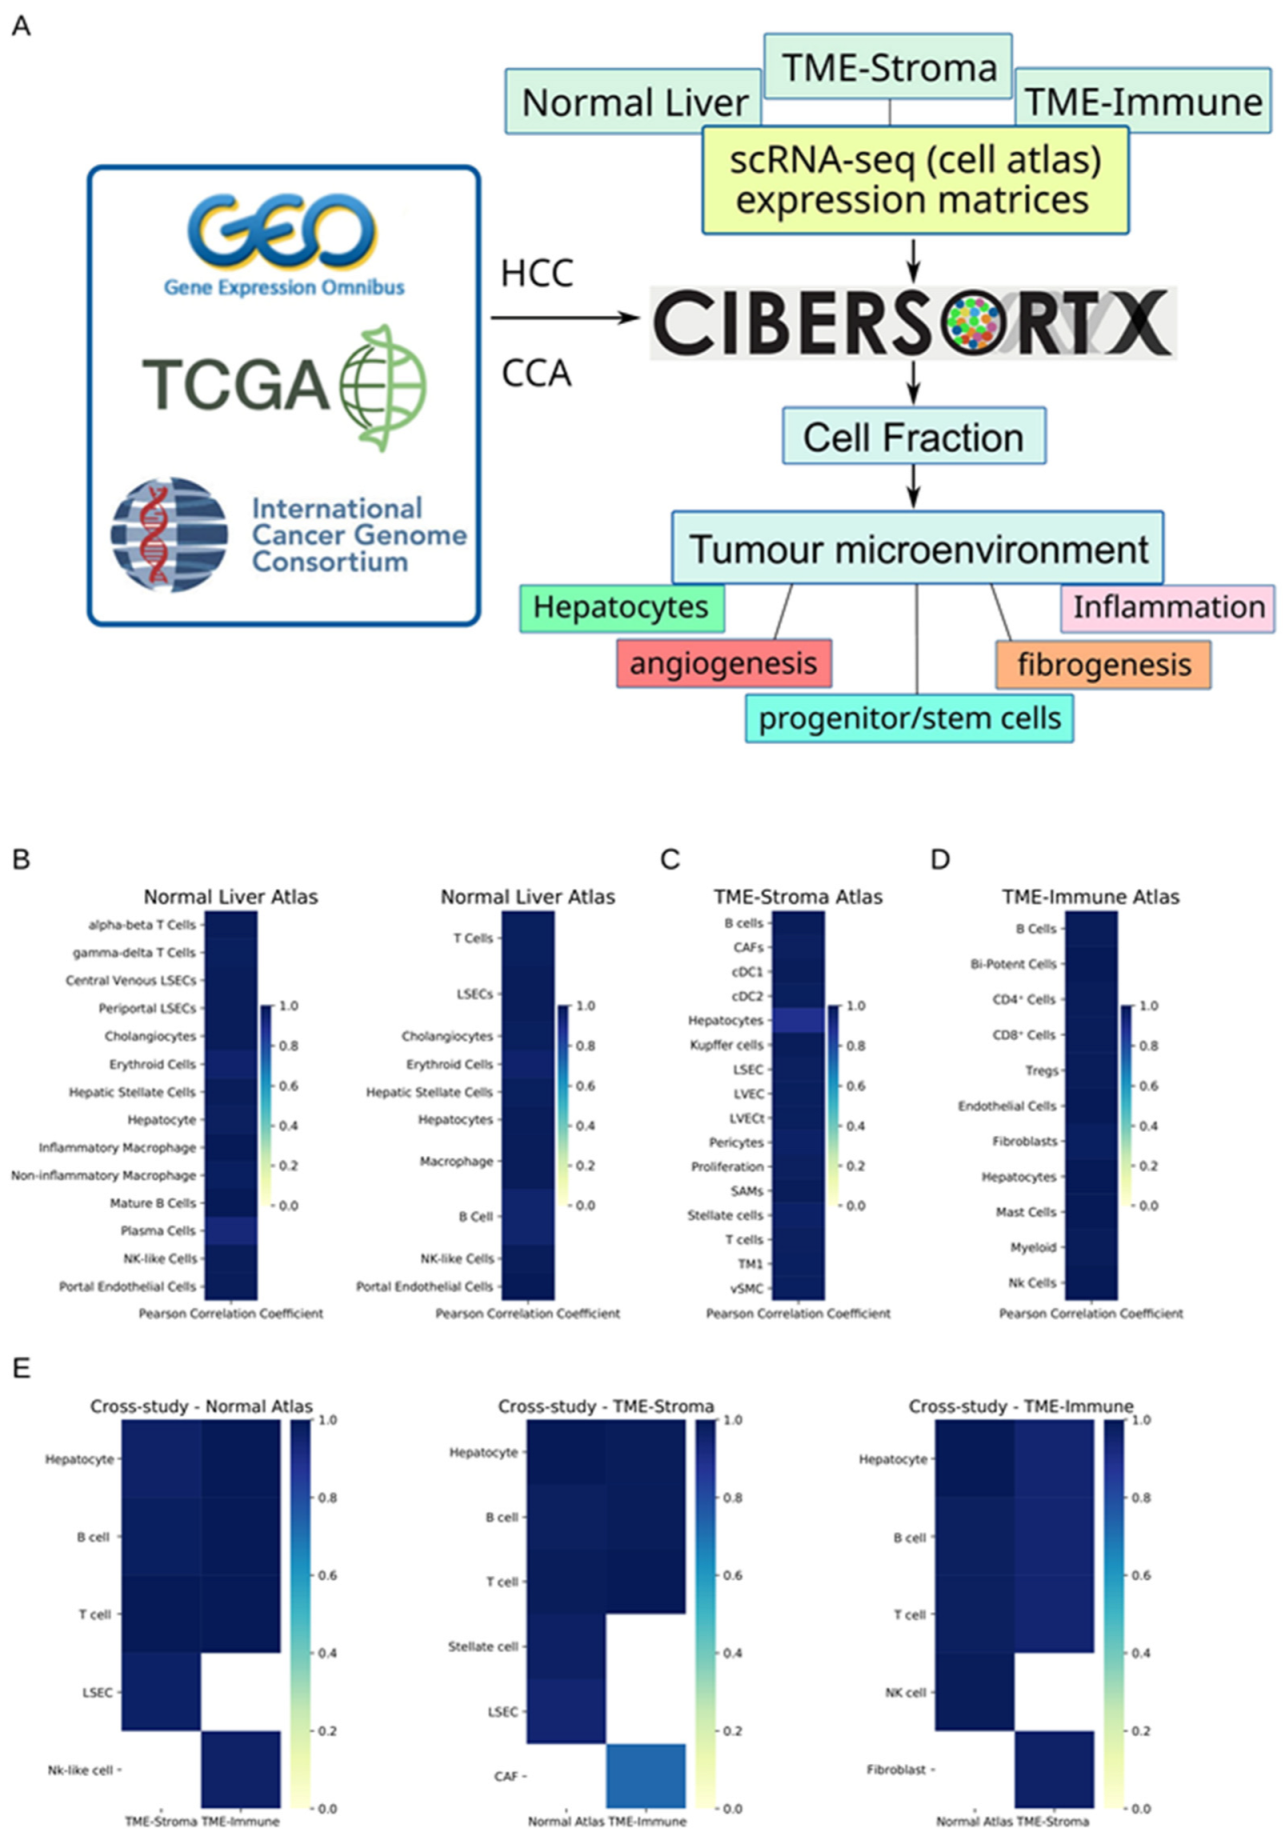
2.4. Deconvolution of Cell Types with Cibersortx and Three Atlases
2.5. Accuracy and Robustness of Cell Fraction Estimation
2.6. Survival analysis, Statistics, and Data Visualisation
3. Results
3.1. Cibersortx Estimation of Cell Fraction
3.2. Difference of Cell Fraction between Tumour and Non-Tumour Liver Tissue
3.2.1. Hepatocytes and Cholangiocytes
3.2.2. Fibrogenesis
3.2.3. Vasculature
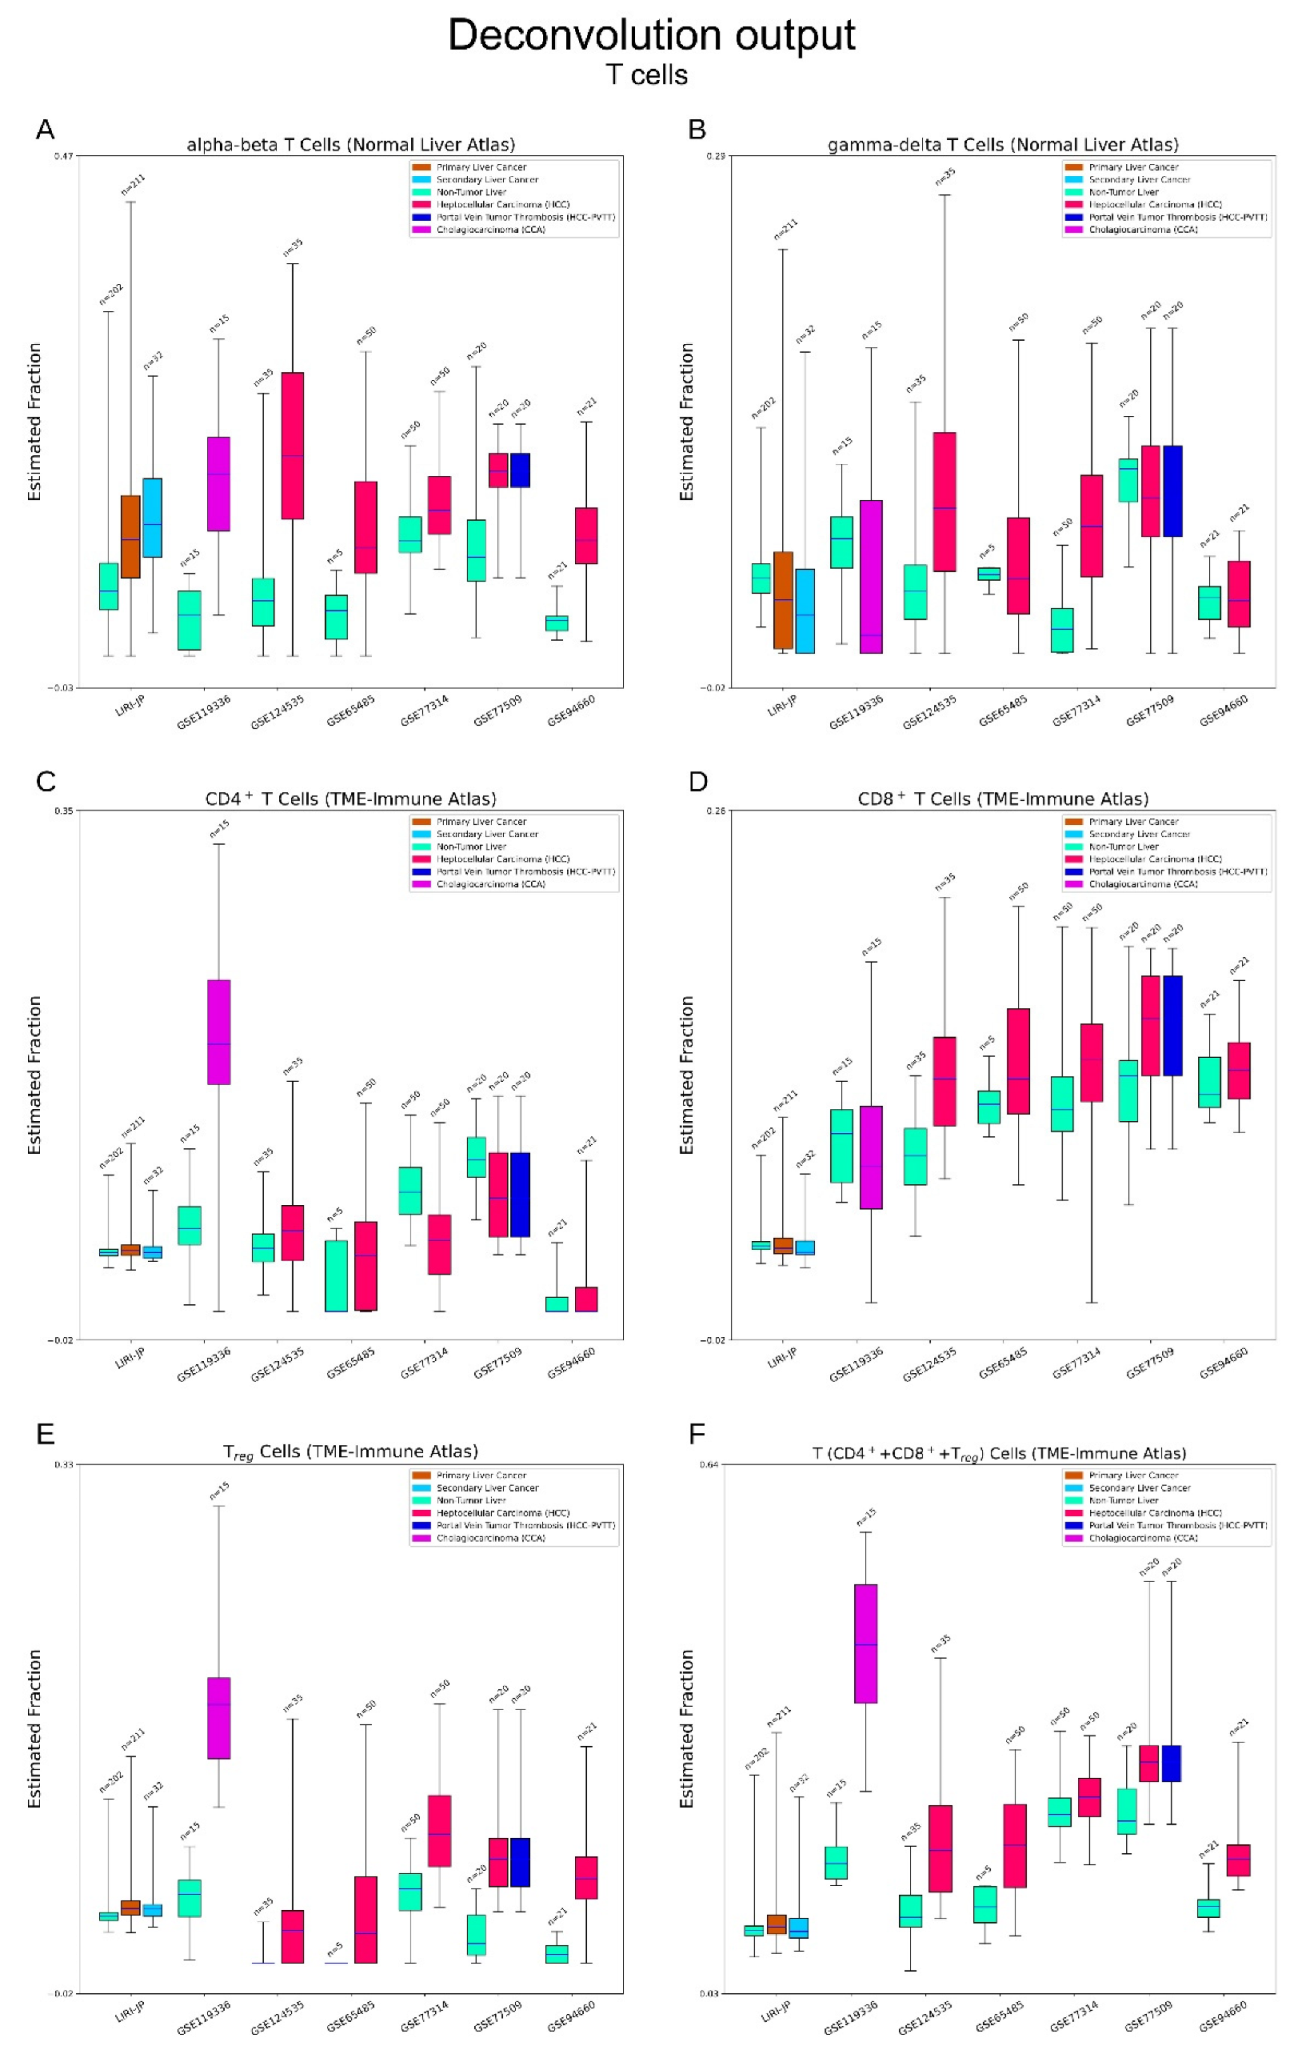
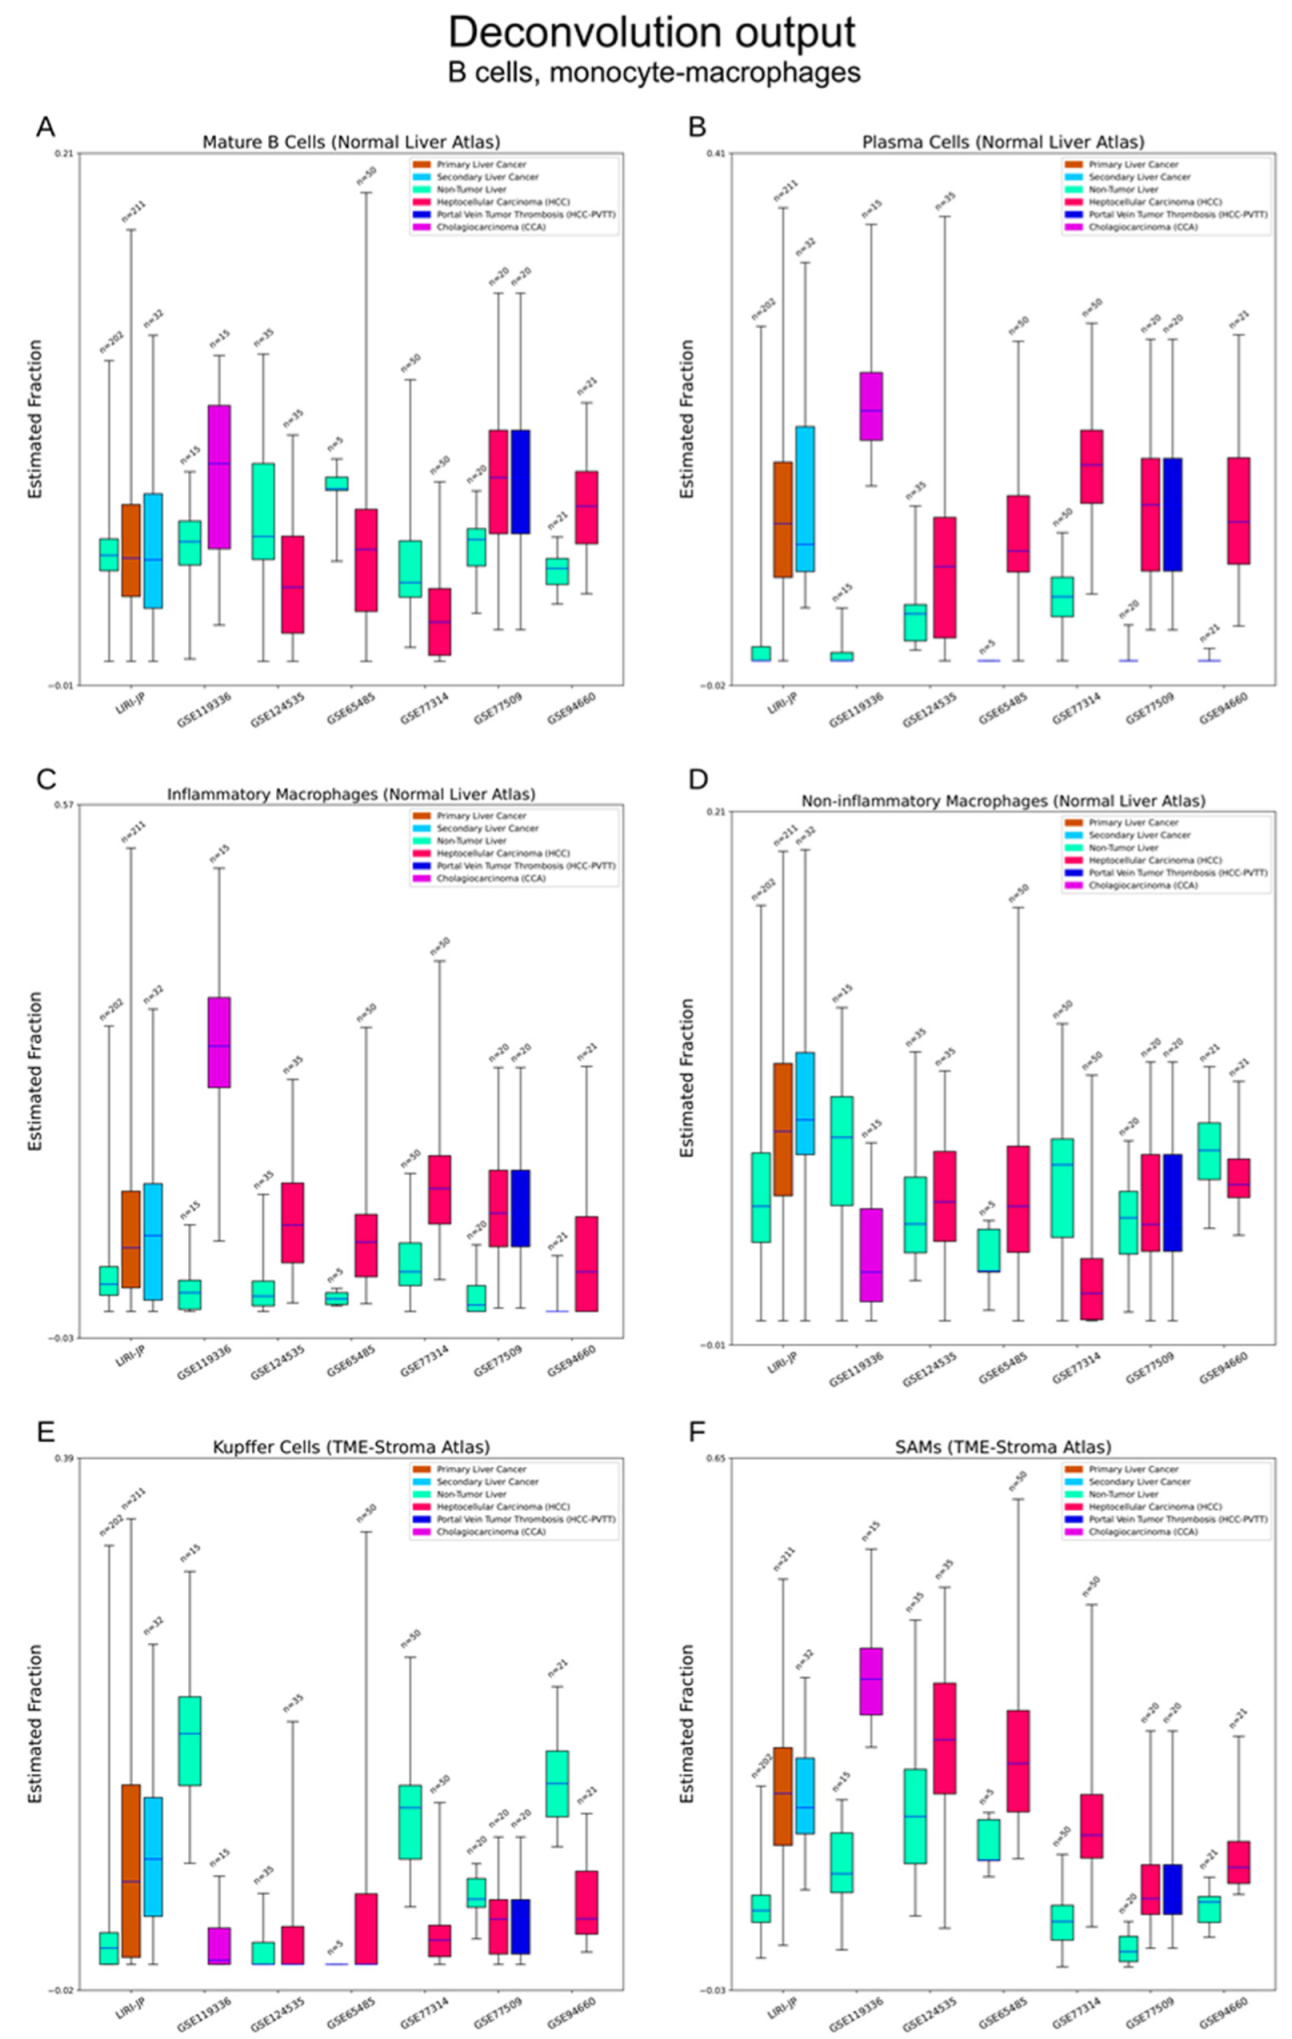
3.2.4. Immune Cells
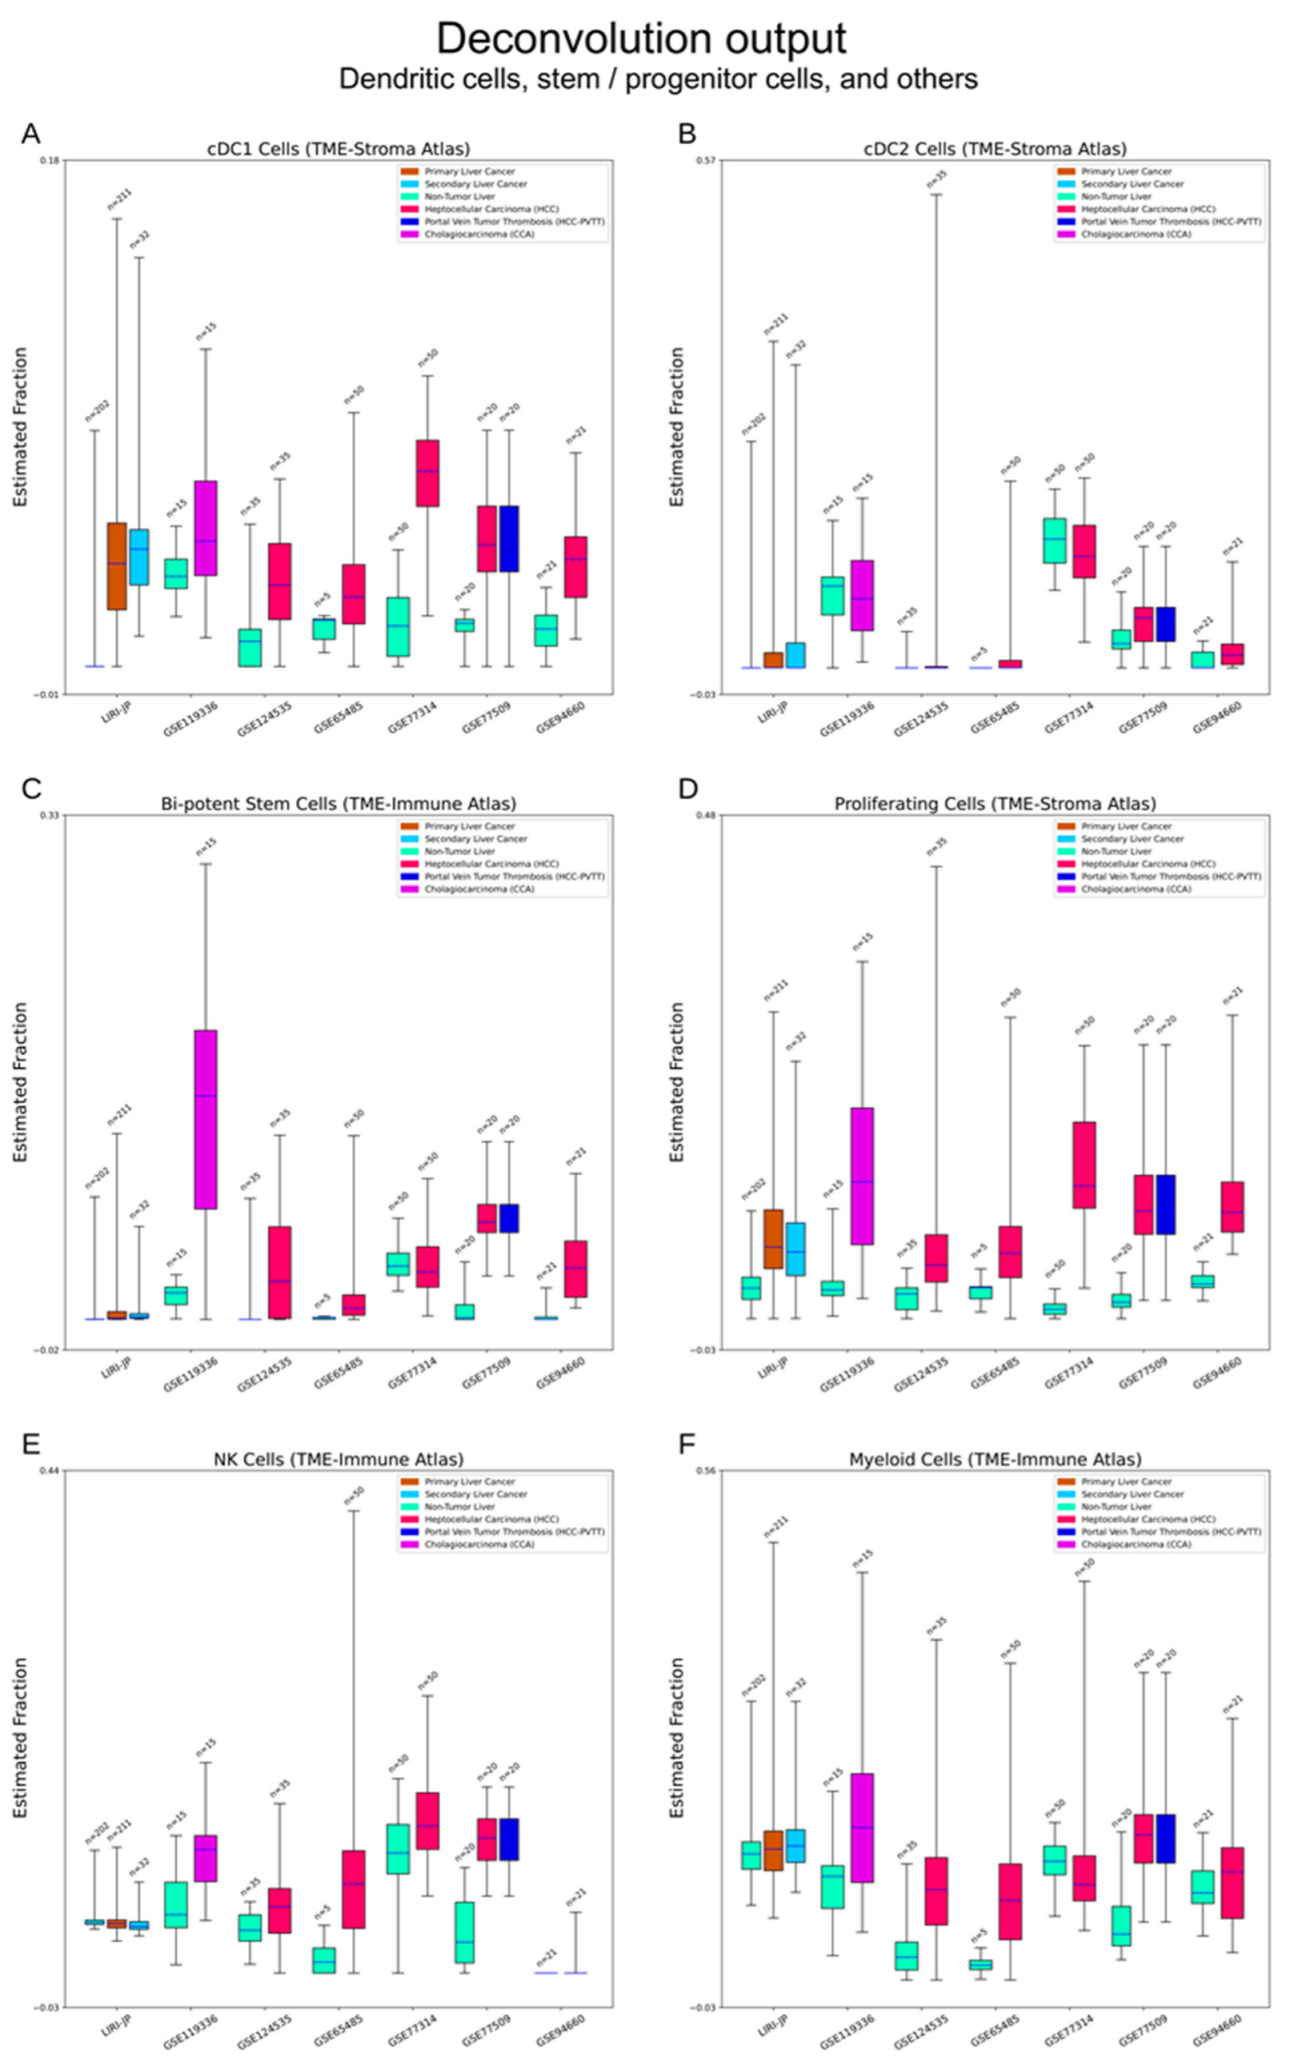
3.2.5. Bi-Potent Stem Cells and Proliferative Cells
3.2.6. Other Cell Types
3.3. Cell Fraction of HCC TME Correlates with Clinical Outcome
3.4. Cell Abundance Estimation by Support Vector Regression
4. Discussion
5. Conclusions
Supplementary Materials
Author Contributions
Funding
Institutional Review Board Statement
Informed Consent Statement
Data Availability Statement
Acknowledgments
Conflicts of Interest
References
- Sung, H.; Ferlay, J.; Siegel, R.L.; Laversanne, M.; Soerjomataram, I.; Jemal, A.; Bray, F. Global Cancer Statistics 2020: GLOBOCAN Estimates of Incidence and Mortality Worldwide for 36 Cancers in 185 Countries. CA Cancer J. Clin. 2021, 71, 209–249. [Google Scholar] [CrossRef] [PubMed]
- Siegel, R.L.; Miller, K.D.; Jemal, A. Cancer Statistics, 2020. CA Cancer J. Clin. 2020, 70, 7–30. [Google Scholar] [CrossRef] [PubMed]
- Jemal, A.; Ward, E.M.; Johnson, C.J.; Cronin, K.A.; Ma, J.; Ryerson, A.B.; Mariotto, A.; Lake, A.J.; Wilson, R.; Sherman, R.L.; et al. Annual Report to the Nation on the Status of Cancer, 1975–2014, Featuring Survival. J. Natl. Cancer Inst. 2017, 109, djx030. [Google Scholar] [CrossRef] [PubMed] [Green Version]
- Llovet, J.M.; Kelley, R.K.; Villanueva, A.; Singal, A.G.; Pikarsky, E.; Roayaie, S.; Lencioni, R.; Koike, K.; Zucman-Rossi, J.; Finn, R.S. Hepatocellular Carcinoma. Nat. Rev. Dis. Prim. 2021, 7, 6. [Google Scholar] [CrossRef] [PubMed]
- Brindley, P.J.; Bachini, M.; Ilyas, S.I.; Khan, S.A.; Loukas, A.; Sirica, A.E.; Teh, B.T.; Wongkham, S.; Gores, G.J. Cholangiocarcinoma. Nat. Rev. Dis. Prim. 2021, 7, 65. [Google Scholar] [CrossRef] [PubMed]
- Deng, G.L.; Zeng, S.; Shen, H. Chemotherapy and Target Therapy for Hepatocellular Carcinoma: New Advances and Challenges. World J. Hepatol. 2015, 7, 787–798. [Google Scholar] [CrossRef]
- Morse, M.A.; Sun, W.; Kim, R.; He, A.R.; Abada, P.B.; Mynderse, M.; Finn, R.S. The Role of Angiogenesis in Hepatocellular Carcinoma. Clin. Cancer Res. 2019, 25, 912–920. [Google Scholar] [CrossRef] [Green Version]
- Simone, V.; Brunetti, O.; Lupo, L.; Testini, M.; Maiorano, E.; Simone, M.; Longo, V.; Rolfo, C.; Peeters, M.; Scarpa, A.; et al. Targeting Angiogenesis in Biliary Tract Cancers: An Open Option. Int. J. Mol. Sci. 2017, 18, 418. [Google Scholar] [CrossRef] [Green Version]
- Kaps, L.; Schuppan, D. Targeting Cancer Associated Fibroblasts in Liver Fibrosis and Liver Cancer Using Nanocarriers. Cells 2020, 9, 2027. [Google Scholar] [CrossRef]
- Sangro, B.; Sarobe, P.; Hervás-Stubbs, S.; Melero, I. Advances in Immunotherapy for Hepatocellular Carcinoma. Nat. Rev. Gastroenterol. Hepatol. 2021, 18, 525–543. [Google Scholar] [CrossRef]
- Fiste, O.; Ntanasis-Stathopoulos, I.; Gavriatopoulou, M.; Liontos, M.; Koutsoukos, K.; Dimopoulos, M.A.; Zagouri, F. The Emerging Role of Immunotherapy in Intrahepatic Cholangiocarcinoma. Vaccines 2021, 9, 422. [Google Scholar] [CrossRef] [PubMed]
- Jin, M.Z.; Jin, W.L. The Updated Landscape of Tumor Microenvironment and Drug Repurposing. Signal Transduct. Target. Ther. 2020, 5, 166. [Google Scholar] [CrossRef] [PubMed]
- Binnewies, M.; Roberts, E.W.; Kersten, K.; Chan, V.; Fearon, D.F.; Merad, M.; Coussens, L.M.; Gabrilovich, D.I.; Ostrand-Rosenberg, S.; Hedrick, C.C.; et al. Understanding the Tumor Immune Microenvironment (TIME) for Effective Therapy. Nat. Med. 2018, 24, 541–550. [Google Scholar] [CrossRef] [PubMed]
- Zhang, Y.; Wang, D.; Peng, M.; Tang, L.; Ouyang, J.; Xiong, F.; Guo, C.; Tang, Y.; Zhou, Y.; Liao, Q.; et al. Single-cell RNA Sequencing in Cancer Research. J. Exp. Clin. Cancer Res. 2021, 40, 81. [Google Scholar] [CrossRef] [PubMed]
- Cooper, L.A.D.; Demicco, E.G.; Saltz, J.H.; Powell, R.T.; Rao, A.; Lazar, A.J. PanCancer Insights from The Cancer Genome Atlas: The Pathologist’s Perspective. J. Pathol. 2018, 244, 512–524. [Google Scholar] [CrossRef]
- Malta, T.M.; Sokolov, A.; Gentles, A.J.; Burzykowski, T.; Poisson, L.; Weinstein, J.N.; Kamińska, B.; Huelsken, J.; Omberg, L.; Gevaert, O.; et al. Machine Learning Identifies Stemness Features Associated with Oncogenic Dedifferentiation. Cell 2018, 173, 338–354.e15. [Google Scholar] [CrossRef] [Green Version]
- Chiu, Y.J.; Hsieh, Y.H.; Huang, Y.H. Improved Cell Composition Deconvolution Method of Bulk Gene Expression Profiles to Quantify Subsets of Immune Cells. BMC Med. Genomics 2019, 12, 169. [Google Scholar] [CrossRef]
- Tsoucas, D.; Dong, R.; Chen, H.; Zhu, Q.; Guo, G.; Yuan, G.C. Accurate Estimation of Cell-Type Composition from Gene Expression Data. Nat. Commun. 2019, 10, 2975. [Google Scholar] [CrossRef] [Green Version]
- Wang, X.; Park, J.; Susztak, K.; Zhang, N.R.; Li, M. Bulk Tissue Cell Type Deconvolution with Multi-Subject Single-Cell Expression Reference. Nat. Commun. 2019, 10, 380. [Google Scholar] [CrossRef] [Green Version]
- Newman, A.M.; Steen, C.B.; Liu, C.L.; Gentles, A.J.; Chaudhuri, A.A.; Scherer, F.; Khodadoust, M.S.; Esfahani, M.S.; Luca, B.A.; Steiner, D.; et al. Determining Cell Type Abundance and Expression from Bulk Tissues with Digital Cytometry. Nat. Biotechnol. 2019, 37, 773–782. [Google Scholar] [CrossRef]
- Qi, Z.; Liu, Y.; Mints, M.; Mullins, R.; Sample, R.; Law, T.; Barrett, T.; Mazul, A.L.; Jackson, R.S.; Kang, S.Y.; et al. Single-Cell Deconvolution of Head and Neck Squamous Cell Carcinoma. Cancers (Basel) 2021, 13, 1230. [Google Scholar] [CrossRef] [PubMed]
- Subramanian, A.; Tamayo, P.; Mootha, V.K.; Mukherjee, S.; Ebert, B.L.; Gillette, M.A.; Paulovich, A.; Pomeroy, S.L.; Golub, T.R.; Lander, E.S.; et al. Gene Set Enrichment Analysis: A Knowledge-Based Approach for Interpreting Genome-Wide Expression Profiles. Proc. Natl. Acad. Sci. USA 2005, 102, 15545–15550. [Google Scholar] [CrossRef] [PubMed] [Green Version]
- Piccolo, S.R.; Sun, Y.; Campbell, J.D.; Lenburg, M.E.; Bild, A.H.; Johnson, W.E. A Single-Sample Microarray Normalization Method to Facilitate Personalized-Medicine Workflows. Genomics 2012, 100, 337–344. [Google Scholar] [CrossRef] [PubMed] [Green Version]
- Piccolo, S.R.; Withers, M.R.; Francis, O.E.; Bild, A.H.; Johnson, W.E. Multiplatform Single-Sample Estimates of Transcriptional Activation. Proc. Natl. Acad. Sci. USA 2013, 110, 17778–17783. [Google Scholar] [CrossRef] [Green Version]
- Durinck, S.; Spellman, P.T.; Birney, E.; Huber, W. Mapping Identifiers for the Integration of Genomic Datasets with the R/ Bioconductor Package BiomaRt. Nat. Protoc. 2009, 4, 1184–1191. [Google Scholar] [CrossRef] [Green Version]
- Miller, J.A.; Cai, C.; Langfelder, P.; Geschwind, D.H.; Kurian, S.M.; Salomon, D.R.; Horvath, S. Strategies for Aggregating Gene Expression Data: The CollapseRows R Function. BMC Bioinform. 2011, 12, 322. [Google Scholar] [CrossRef] [Green Version]
- Wang, S.; Liu, X. The UCSCXenaTools R Package: A Toolkit for Accessing Genomics Data from UCSC Xena Platform, from Cancer Multi-Omics to Single-Cell RNA-Seq. J. Open Source Softw. 2019, 4, 1627. [Google Scholar] [CrossRef]
- MacParland, S.A.; Liu, J.C.; Ma, X.Z.; Innes, B.T.; Bartczak, A.M.; Gage, B.K.; Manuel, J.; Khuu, N.; Echeverri, J.; Linares, I.; et al. Single Cell RNA Sequencing of Human Liver Reveals Distinct Intrahepatic Macrophage Populations. Nat. Commun. 2018, 9, 4383. [Google Scholar] [CrossRef] [Green Version]
- Massalha, H.; Bahar Halpern, K.; Abu-Gazala, S.; Jana, T.; Massasa, E.E.; Moor, A.E.; Buchauer, L.; Rozenberg, M.; Pikarsky, E.; Amit, I.; et al. A Single Cell Atlas of the Human Liver Tumor Microenvironment. Mol. Syst. Biol. 2020, 16, e9682. [Google Scholar] [CrossRef]
- Sharma, A.; Seow, J.J.W.; Dutertre, C.A.; Pai, R.; Blériot, C.; Mishra, A.; Wong, R.M.M.; Singh, G.S.N.; Sudhagar, S.; Khalilnezhad, S.; et al. Onco-Fetal Reprogramming of Endothelial Cells Drives Immunosuppressive Macrophages in Hepatocellular Carcinoma. Cell 2020, 183, 377–394.e21. [Google Scholar] [CrossRef]
- Pölsterl, S. Scikit-Survival: A Library for Time-to-Event Analysis Built on Top of Scikit-Learn. J. Mach. Learn. Res. 2020, 21, 1–6. [Google Scholar]
- Davidson-Pilon, C. Lifelines: Survival Analysis in Python. J. Open Source Softw. 2019, 4, 1317. [Google Scholar] [CrossRef] [Green Version]
- Schubert, M.; Klinger, B.; Klünemann, M.; Sieber, A.; Uhlitz, F.; Sauer, S.; Garnett, M.J.; Blüthgen, N.; Saez-Rodriguez, J. Perturbation-Response Genes Reveal Signaling Footprints in Cancer Gene Expression. Nat. Commun. 2018, 9, 20. [Google Scholar] [CrossRef] [PubMed] [Green Version]
- June, S.L.; Semela, D.; Iredale, J.; Shah, V.H. Sinusoidal Remodeling and Angiogenesis: A New Function for the Liver-Specific Pericyte? Hepatology 2007, 45, 817–825. [Google Scholar] [CrossRef]
- Tacke, F.; Zimmermann, H.W. Macrophage Heterogeneity in Liver Injury and Fibrosis. J. Hepatol. 2014, 60, 1090–1096. [Google Scholar] [CrossRef] [Green Version]
- Lurje, I.; Hammerich, L.; Tacke, F. Dendritic Cell and T Cell Crosstalk in Liver Fibrogenesis and Hepatocarcinogenesis: Implications for Prevention and Therapy of Liver Cancer. Int. J. Mol. Sci. 2020, 21, 7378. [Google Scholar] [CrossRef]
- Ally, A.; Balasundaram, M.; Carlsen, R.; Chuah, E.; Clarke, A.; Dhalla, N.; Holt, R.A.; Jones, S.J.M.; Lee, D.; Ma, Y.; et al. Comprehensive and Integrative Genomic Characterization of Hepatocellular Carcinoma. Cell 2017, 169, 1327–1341.e23. [Google Scholar] [CrossRef] [Green Version]
- Roessler, S.; Jia, H.L.; Budhu, A.; Forgues, M.; Ye, Q.H.; Lee, J.S.; Thorgeirsson, S.S.; Sun, Z.; Tang, Z.Y.; Qin, L.X.; et al. A Unique Metastasis Gene Signature Enables Prediction of Tumor Relapse in Early-Stage Hepatocellular Carcinoma Patients. Cancer Res. 2010, 70, 10202–10212. [Google Scholar] [CrossRef] [Green Version]
- Roessler, S.; Long, E.L.; Budhu, A.; Chen, Y.; Zhao, X.; Ji, J.; Walker, R.; Jia, H.L.; Ye, Q.H.; Qin, L.X.; et al. Integrative Genomic Identification of Genes on 8p Associated with Hepatocellular Carcinoma Progression and Patient Survival. Gastroenterology 2012, 142, 957–966.e12. [Google Scholar] [CrossRef] [Green Version]
- Jin, H.; Liu, Z. A Benchmark for RNA-Seq Deconvolution Analysis under Dynamic Testing Environments. Genome Biol. 2021, 22, 102. [Google Scholar] [CrossRef]
- Avila Cobos, F.; Alquicira-Hernandez, J.; Powell, J.E.; Mestdagh, P.; De Preter, K. Benchmarking of Cell Type Deconvolution Pipelines for Transcriptomics Data. Nat. Commun. 2020, 11, 5650. [Google Scholar] [CrossRef] [PubMed]
- Blouin, A.; Bolender, R.P.; Weibel, E.R. Distribution of Organelles and Membranes between Hepatocytes and Nonhepatocytes in the Rat Liver Parenchyma. A Stereological Study. J. Cell Biol. 1977, 72, 441–455. [Google Scholar] [CrossRef] [PubMed]
- Sampat, K.R.; O’Neil, B. Antiangiogenic Therapies for Advanced Hepatocellular Carcinoma. Oncologist 2013, 18, 430–438. [Google Scholar] [CrossRef] [Green Version]
- Yang, M.; Zhang, C. The Role of Liver Sinusoidal Endothelial Cells in Cancer Liver Metastasis. Am. J. Cancer Res. 2021, 11, 1845–1860. [Google Scholar] [PubMed]
- Tsuchida, T.; Friedman, S.L. Mechanisms of Hepatic Stellate Cell Activation. Nat. Rev. Gastroenterol. Hepatol. 2017, 14, 397–411. [Google Scholar] [CrossRef]
- Affo, S.; Yu, L.X.; Schwabe, R.F. The Role of Cancer-Associated Fibroblasts and Fibrosisin Liver Cancer. Annu. Rev. Pathol. Mech. Dis. 2017, 12, 153–186. [Google Scholar] [CrossRef] [Green Version]
- Sahai, E.; Astsaturov, I.; Cukierman, E.; DeNardo, D.G.; Egeblad, M.; Evans, R.M.; Fearon, D.; Greten, F.R.; Hingorani, S.R.; Hunter, T.; et al. A Framework for Advancing Our Understanding of Cancer-Associated Fibroblasts. Nat. Rev. Cancer 2020, 20, 174–186. [Google Scholar] [CrossRef] [Green Version]
- Kubo, N.; Araki, K.; Kuwano, H.; Shirabe, K. Cancer-Associated Fibroblasts in Hepatocellular Carcinoma. World J. Gastroenterol. 2016, 22, 6841–6850. [Google Scholar] [CrossRef]
- Pittet, M.J.; Michielin, O.; Migliorini, D. Clinical Relevance of Tumour-Associated Macrophages. Nat. Rev. Clin. Oncol. 2022, 19, 402–421. [Google Scholar] [CrossRef]
- Noy, R.; Pollard, J.W. Tumor-Associated Macrophages: From Mechanisms to Therapy. Immunity 2014, 41, 49–61. [Google Scholar] [CrossRef] [Green Version]
- Tanaka, A.; Sakaguchi, S. Regulatory T Cells in Cancer Immunotherapy. Cell Res. 2017, 27, 109–118. [Google Scholar] [CrossRef] [PubMed]
- Takeuchi, Y.; Nishikawa, H. International Immunology; Oxford University Press: Oxford, UK, 2016; pp. 401–409. [Google Scholar]
- Laumont, C.M.; Banville, A.C.; Gilardi, M.; Hollern, D.P.; Nelson, B.H. Tumour-Infiltrating B Cells: Immunological Mechanisms, Clinical Impact and Therapeutic Opportunities. Nat. Rev. Cancer 2022, 22, 414–430. [Google Scholar] [CrossRef] [PubMed]
- Plitas, G.; Rudensky, A.Y. Regulatory T Cells in Cancer. Annu. Rev. Cancer Biol. 2020, 4, 459–477. [Google Scholar] [CrossRef] [Green Version]
- Lee, T.K.W.; Guan, X.Y.; Ma, S. Cancer Stem Cells in Hepatocellular Carcinoma—from Origin to Clinical Implications. Nat. Rev. Gastroenterol. Hepatol. 2022, 19, 26–44. [Google Scholar] [CrossRef] [PubMed]
- Yamashita, T.; Ji, J.; Budhu, A.; Forgues, M.; Yang, W.; Wang, H.Y.; Jia, H.; Ye, Q.; Qin, L.X.; Wauthier, E.; et al. EpCAM-Positive Hepatocellular Carcinoma Cells Are Tumor-Initiating Cells With Stem/Progenitor Cell Features. Gastroenterology 2009, 136, 1012–1024.e4. [Google Scholar] [CrossRef] [Green Version]
- Yoon, S.M.; Gerasimidou, D.; Kuwahara, R.; Hytiroglou, P.; Yoo, J.E.; Park, Y.N.; Theise, N.D. Epithelial Cell Adhesion Molecule (EpCAM) Marks Hepatocytes Newly Derived from Stem/Progenitor Cells in Humans. Hepatology 2011, 53, 964–973. [Google Scholar] [CrossRef]
- Yamashita, T.; Budhu, A.; Forgues, M.; Xin, W.W. Activation of Hepatic Stem Cell Marker EpCAM by Wnt-β-Catenin Signaling in Hepatocellular Carcinoma. Cancer Res. 2007, 67, 10831–10839. [Google Scholar] [CrossRef] [PubMed] [Green Version]
- Yamashita, T.; Forgues, M.; Wang, W.; Jin, W.K.; Ye, Q.; Jia, H.; Budhu, A.; Zanetti, K.A.; Chen, Y.; Qin, L.X.; et al. EpCAM and α-Fetoprotein Expression Defines Novel Prognostic Subtypes of Hepatocellular Carcinoma. Cancer Res. 2008, 68, 1451–1461. [Google Scholar] [CrossRef] [Green Version]
- Talukdar, S.; Emdad, L.; Das, S.K.; Fisher, P.B. EGFR: An Essential Receptor Tyrosine Kinase-Regulator of Cancer Stem Cells. Adv. Cancer Res. 2020, 147, 161–188. [Google Scholar] [CrossRef]
- Robinson, M.D.; Oshlack, A. A Scaling Normalization Method for Differential Expression Analysis of RNA-Seq Data. Genome Biol. 2010, 11, R25. [Google Scholar] [CrossRef] [Green Version]
- Stuart, T.; Butler, A.; Hoffman, P.; Hafemeister, C.; Papalexi, E.; Mauck, W.M.; Hao, Y.; Stoeckius, M.; Smibert, P.; Satija, R. Comprehensive Integration of Single-Cell Data. Cell 2019, 177, 1888–1902.e21. [Google Scholar] [CrossRef]


Disclaimer/Publisher’s Note: The statements, opinions and data contained in all publications are solely those of the individual author(s) and contributor(s) and not of MDPI and/or the editor(s). MDPI and/or the editor(s) disclaim responsibility for any injury to people or property resulting from any ideas, methods, instructions or products referred to in the content. |
© 2022 by the authors. Licensee MDPI, Basel, Switzerland. This article is an open access article distributed under the terms and conditions of the Creative Commons Attribution (CC BY) license (https://creativecommons.org/licenses/by/4.0/).
Share and Cite
Zhang, S.; Bacon, W.; Peppelenbosch, M.P.; van Kemenade, F.; Stubbs, A.P. Deciphering Tumour Microenvironment of Liver Cancer through Deconvolution of Bulk RNA-Seq Data with Single-Cell Atlas. Cancers 2023, 15, 153. https://doi.org/10.3390/cancers15010153
Zhang S, Bacon W, Peppelenbosch MP, van Kemenade F, Stubbs AP. Deciphering Tumour Microenvironment of Liver Cancer through Deconvolution of Bulk RNA-Seq Data with Single-Cell Atlas. Cancers. 2023; 15(1):153. https://doi.org/10.3390/cancers15010153
Chicago/Turabian StyleZhang, Shaoshi, Wendi Bacon, Maikel P. Peppelenbosch, Folkert van Kemenade, and Andrew Peter Stubbs. 2023. "Deciphering Tumour Microenvironment of Liver Cancer through Deconvolution of Bulk RNA-Seq Data with Single-Cell Atlas" Cancers 15, no. 1: 153. https://doi.org/10.3390/cancers15010153