
Incidence and Mortality of Malignant Brain Tumors after 20 Years of Mobile Use

 , ,
, ,  , , and
Abstract
:Simple Summary
Abstract
1. Introduction
2. Materials and Methods
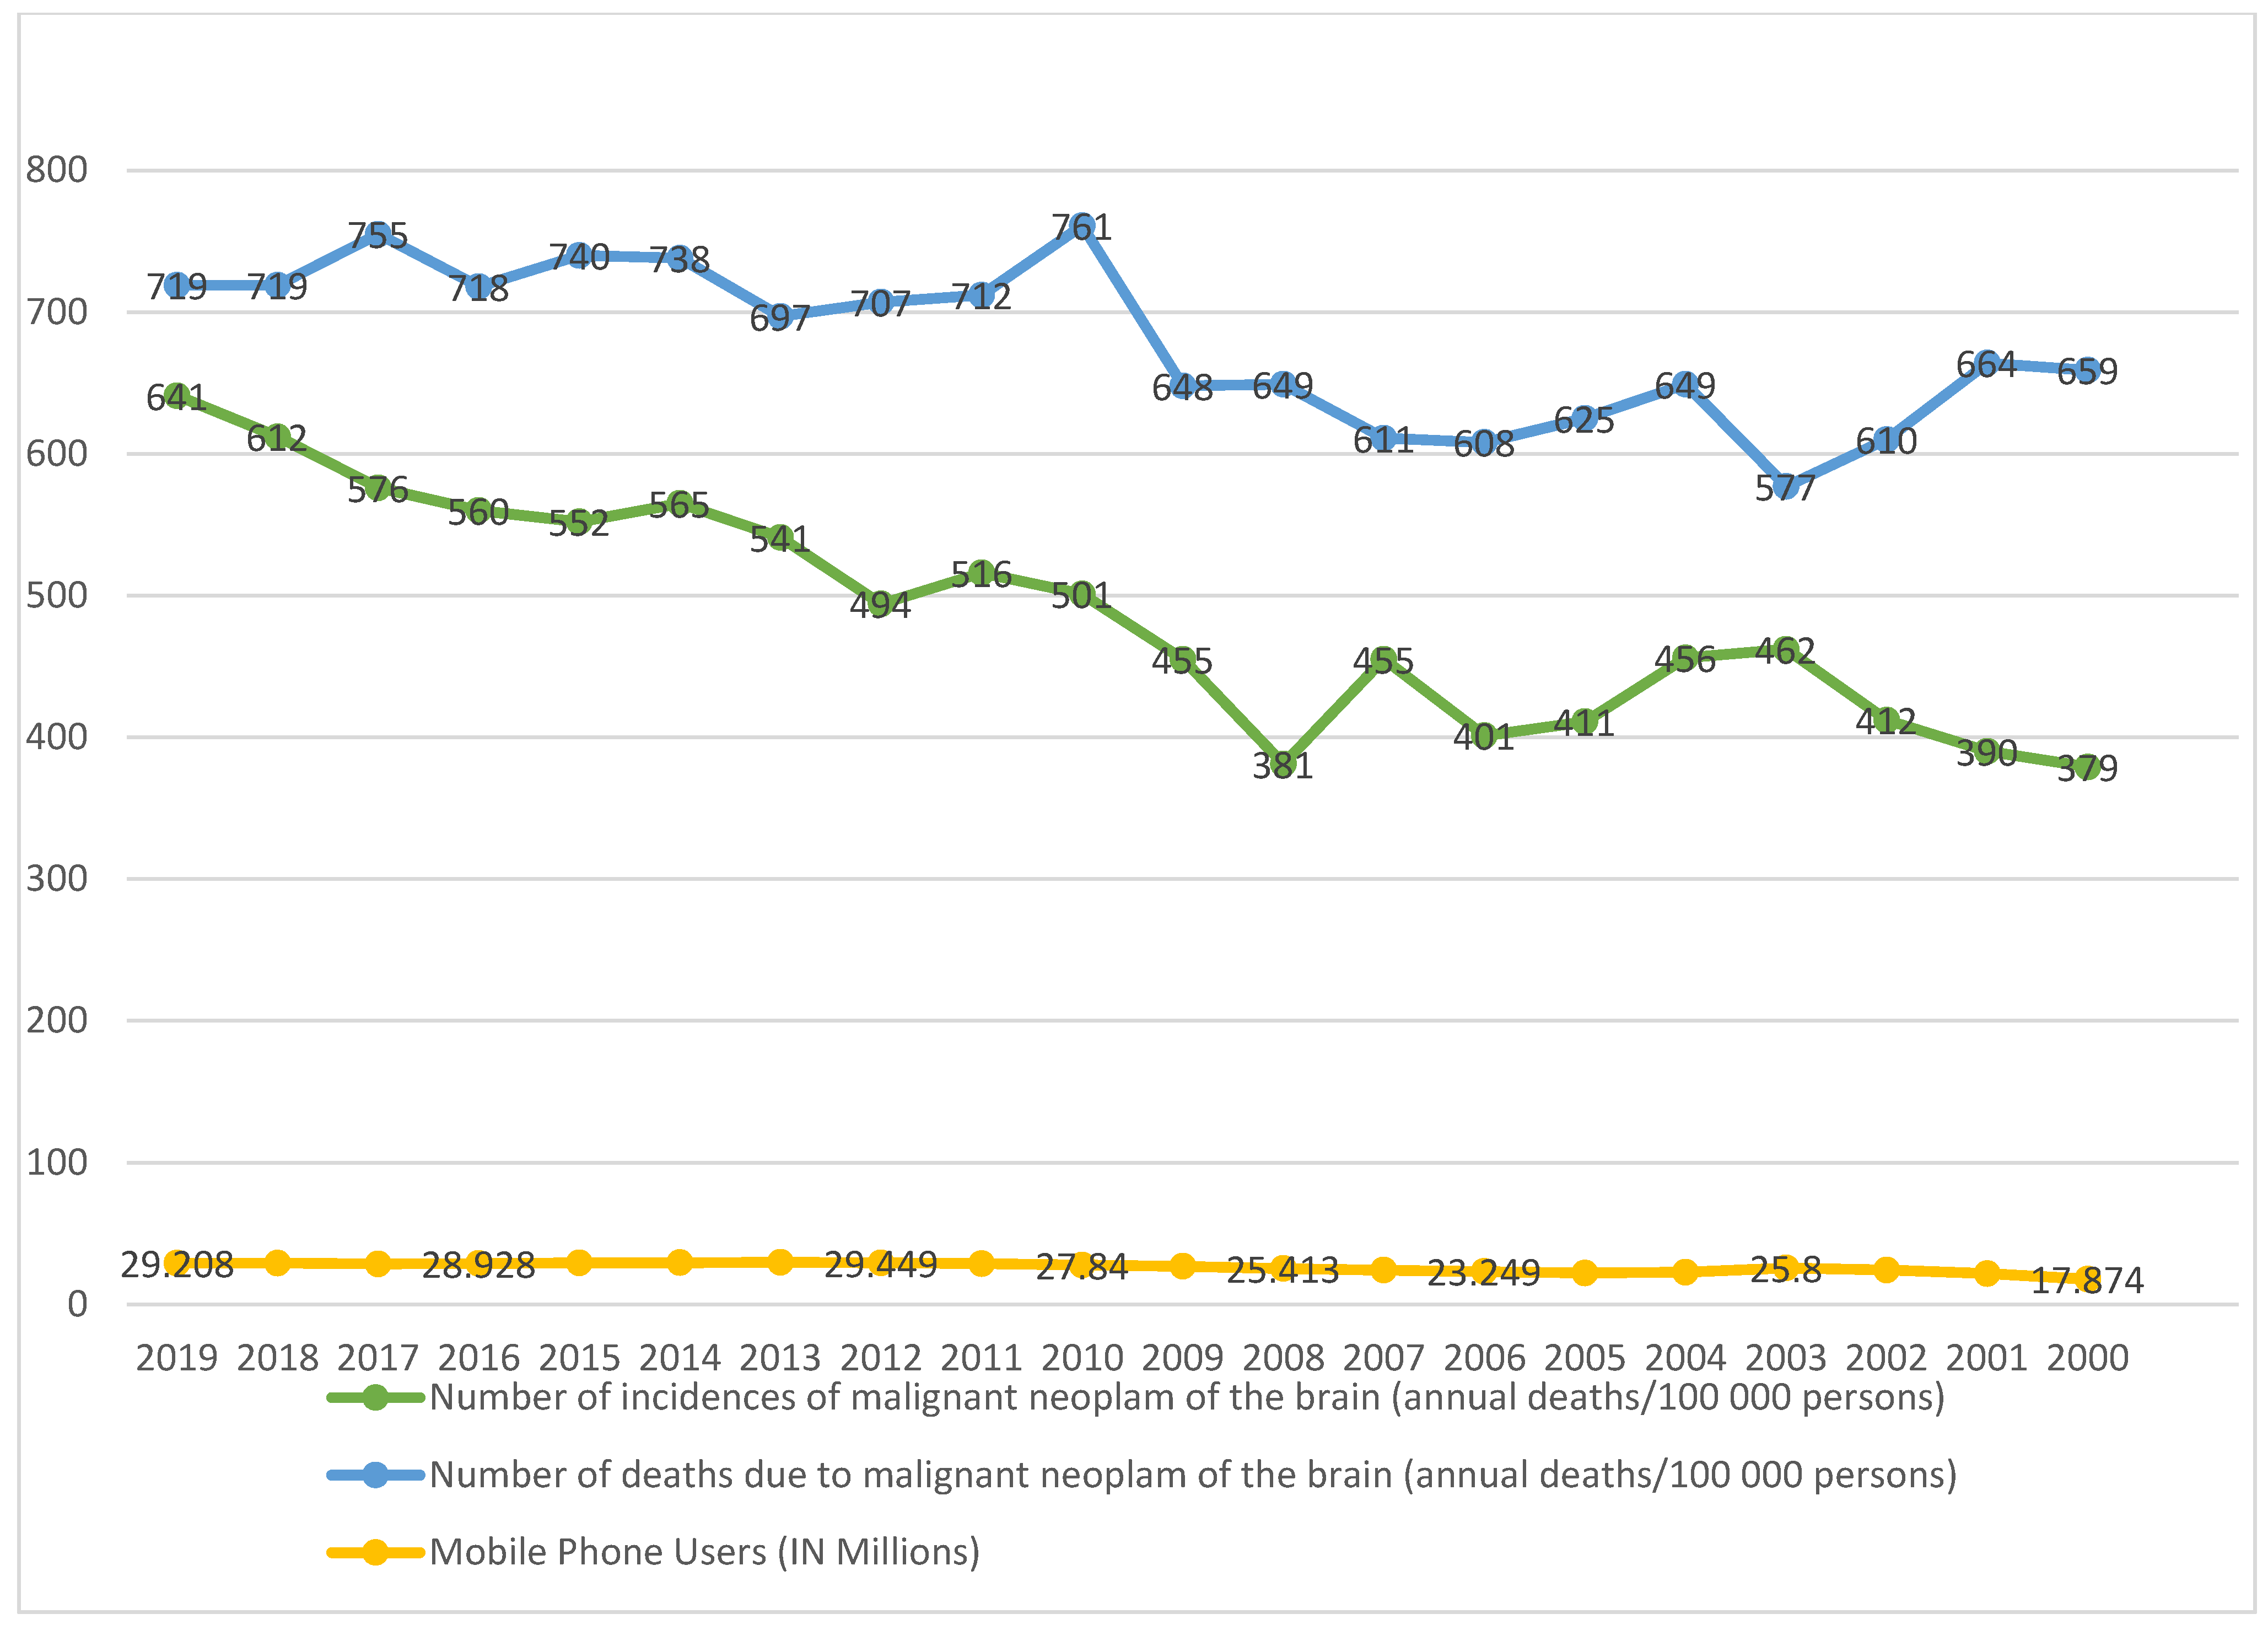
3. Results
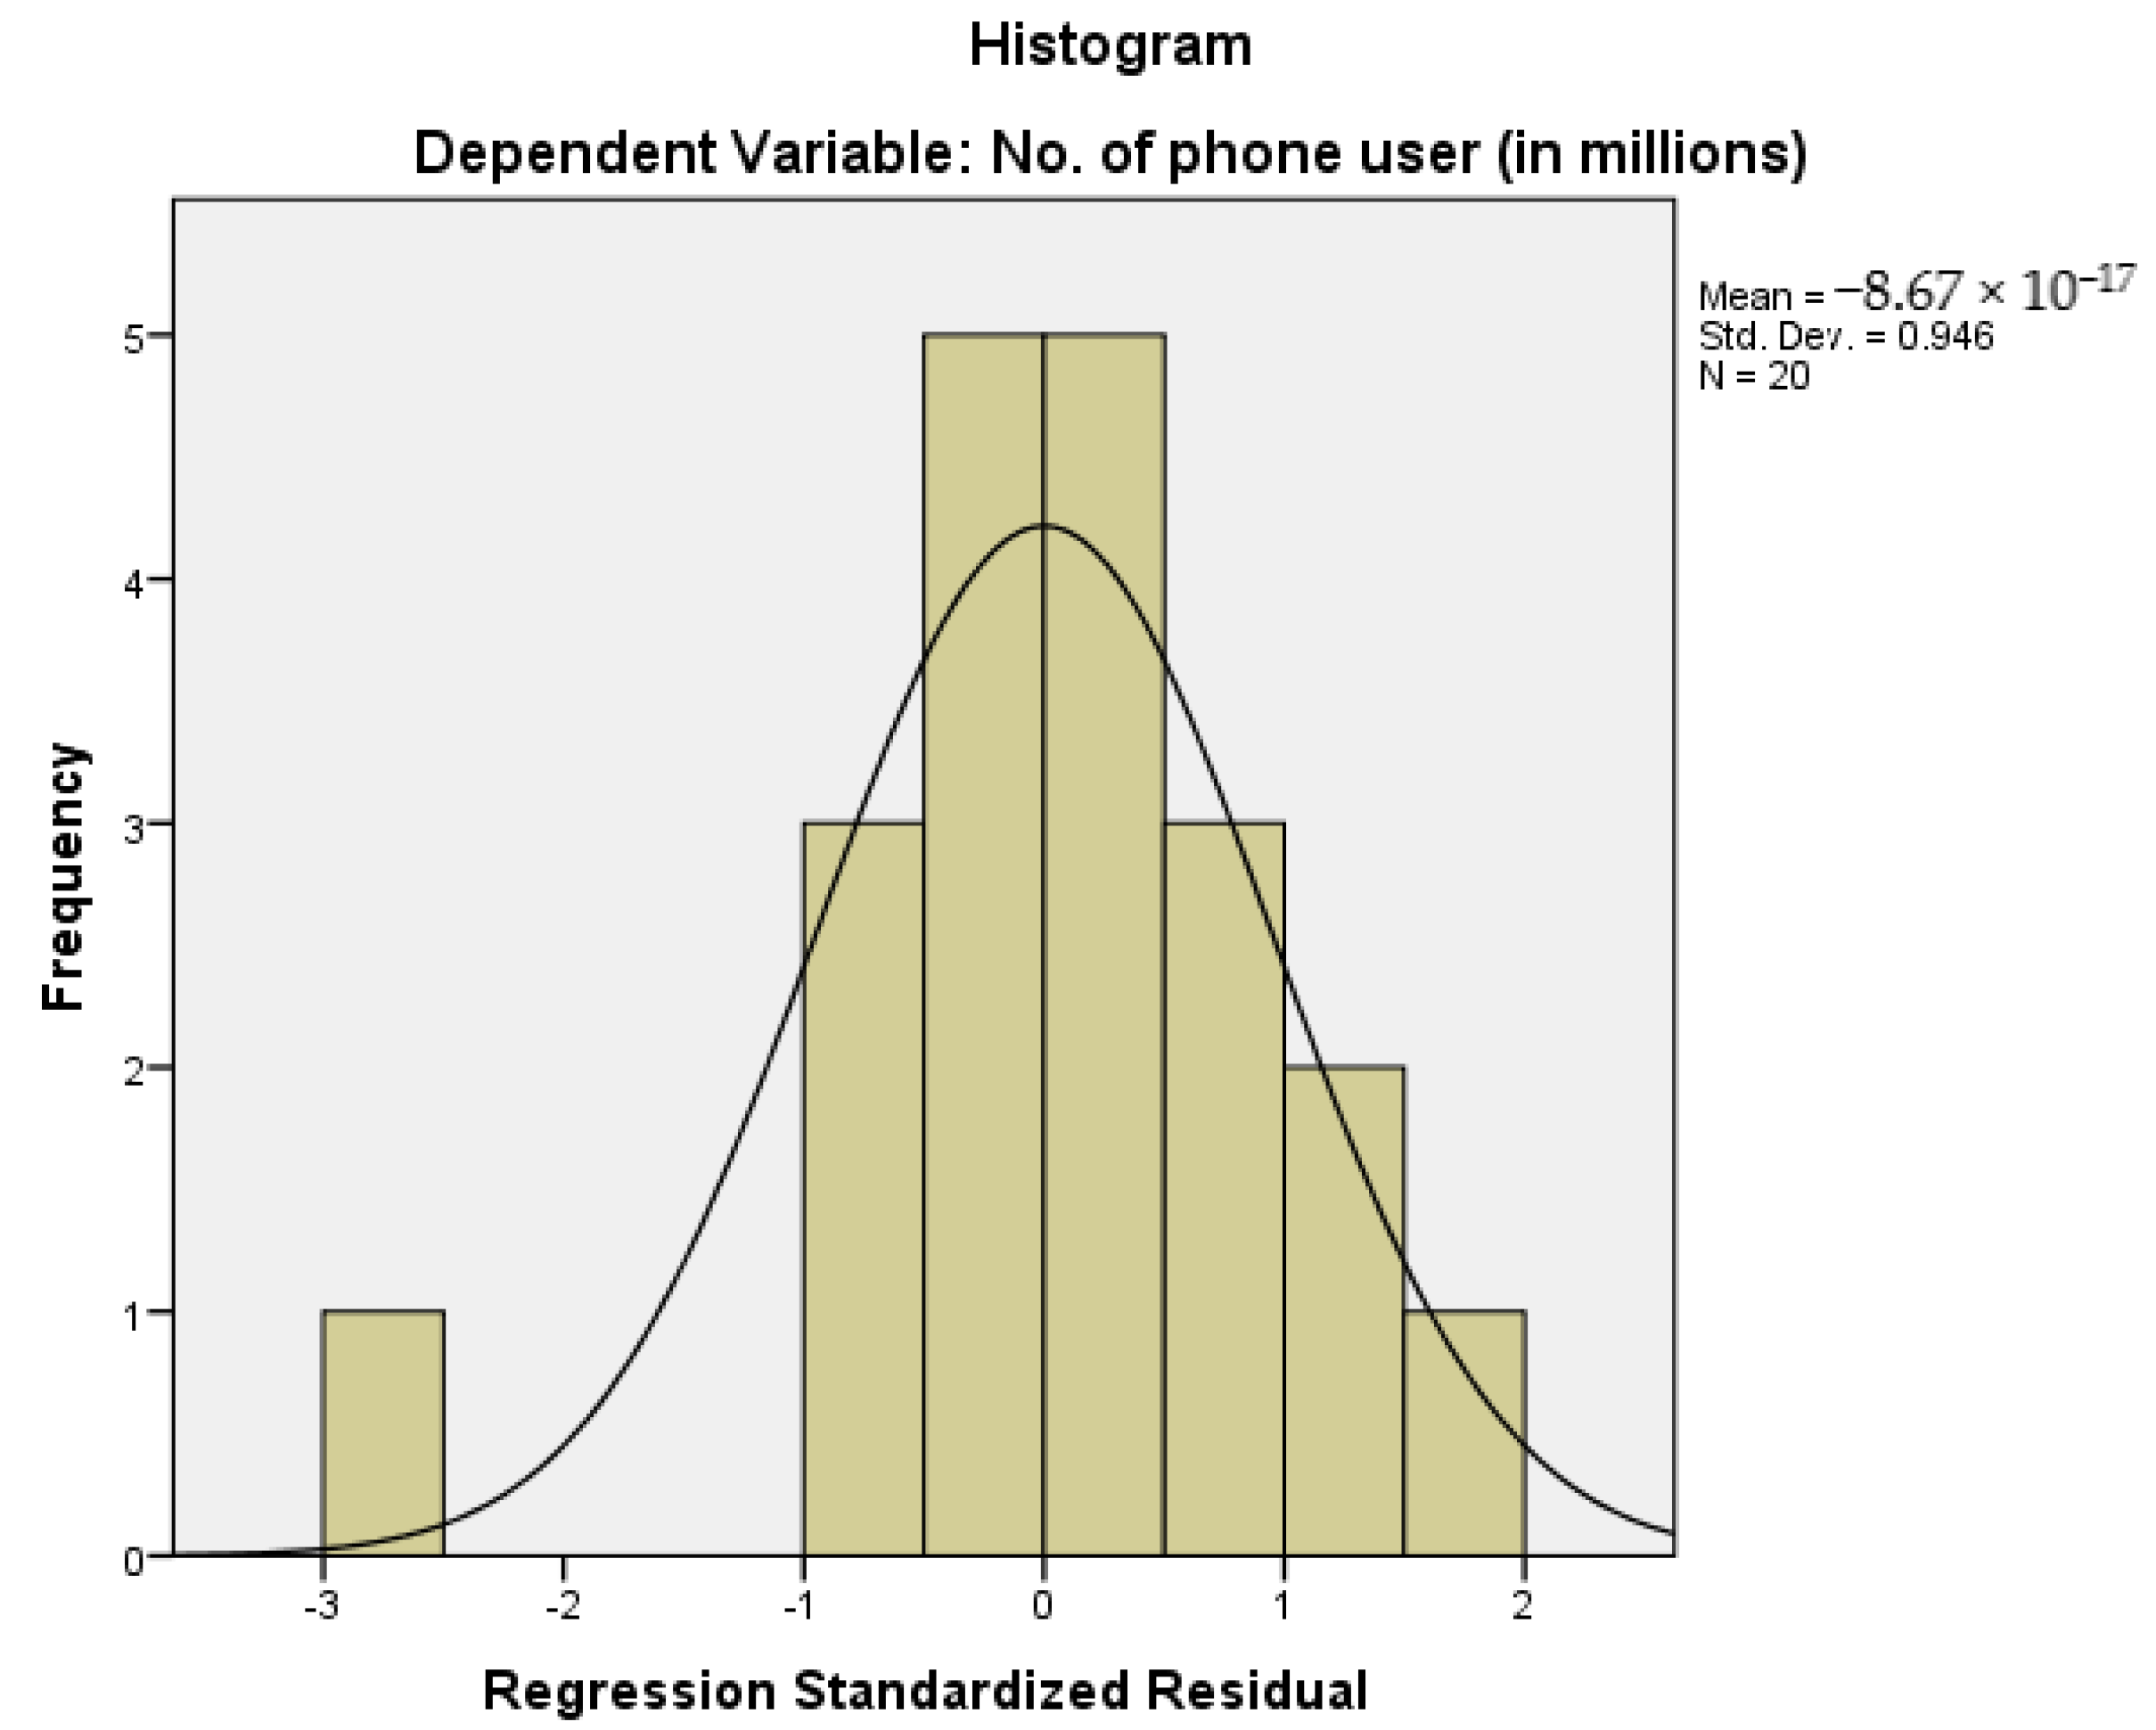
3.1. Regression Analysis
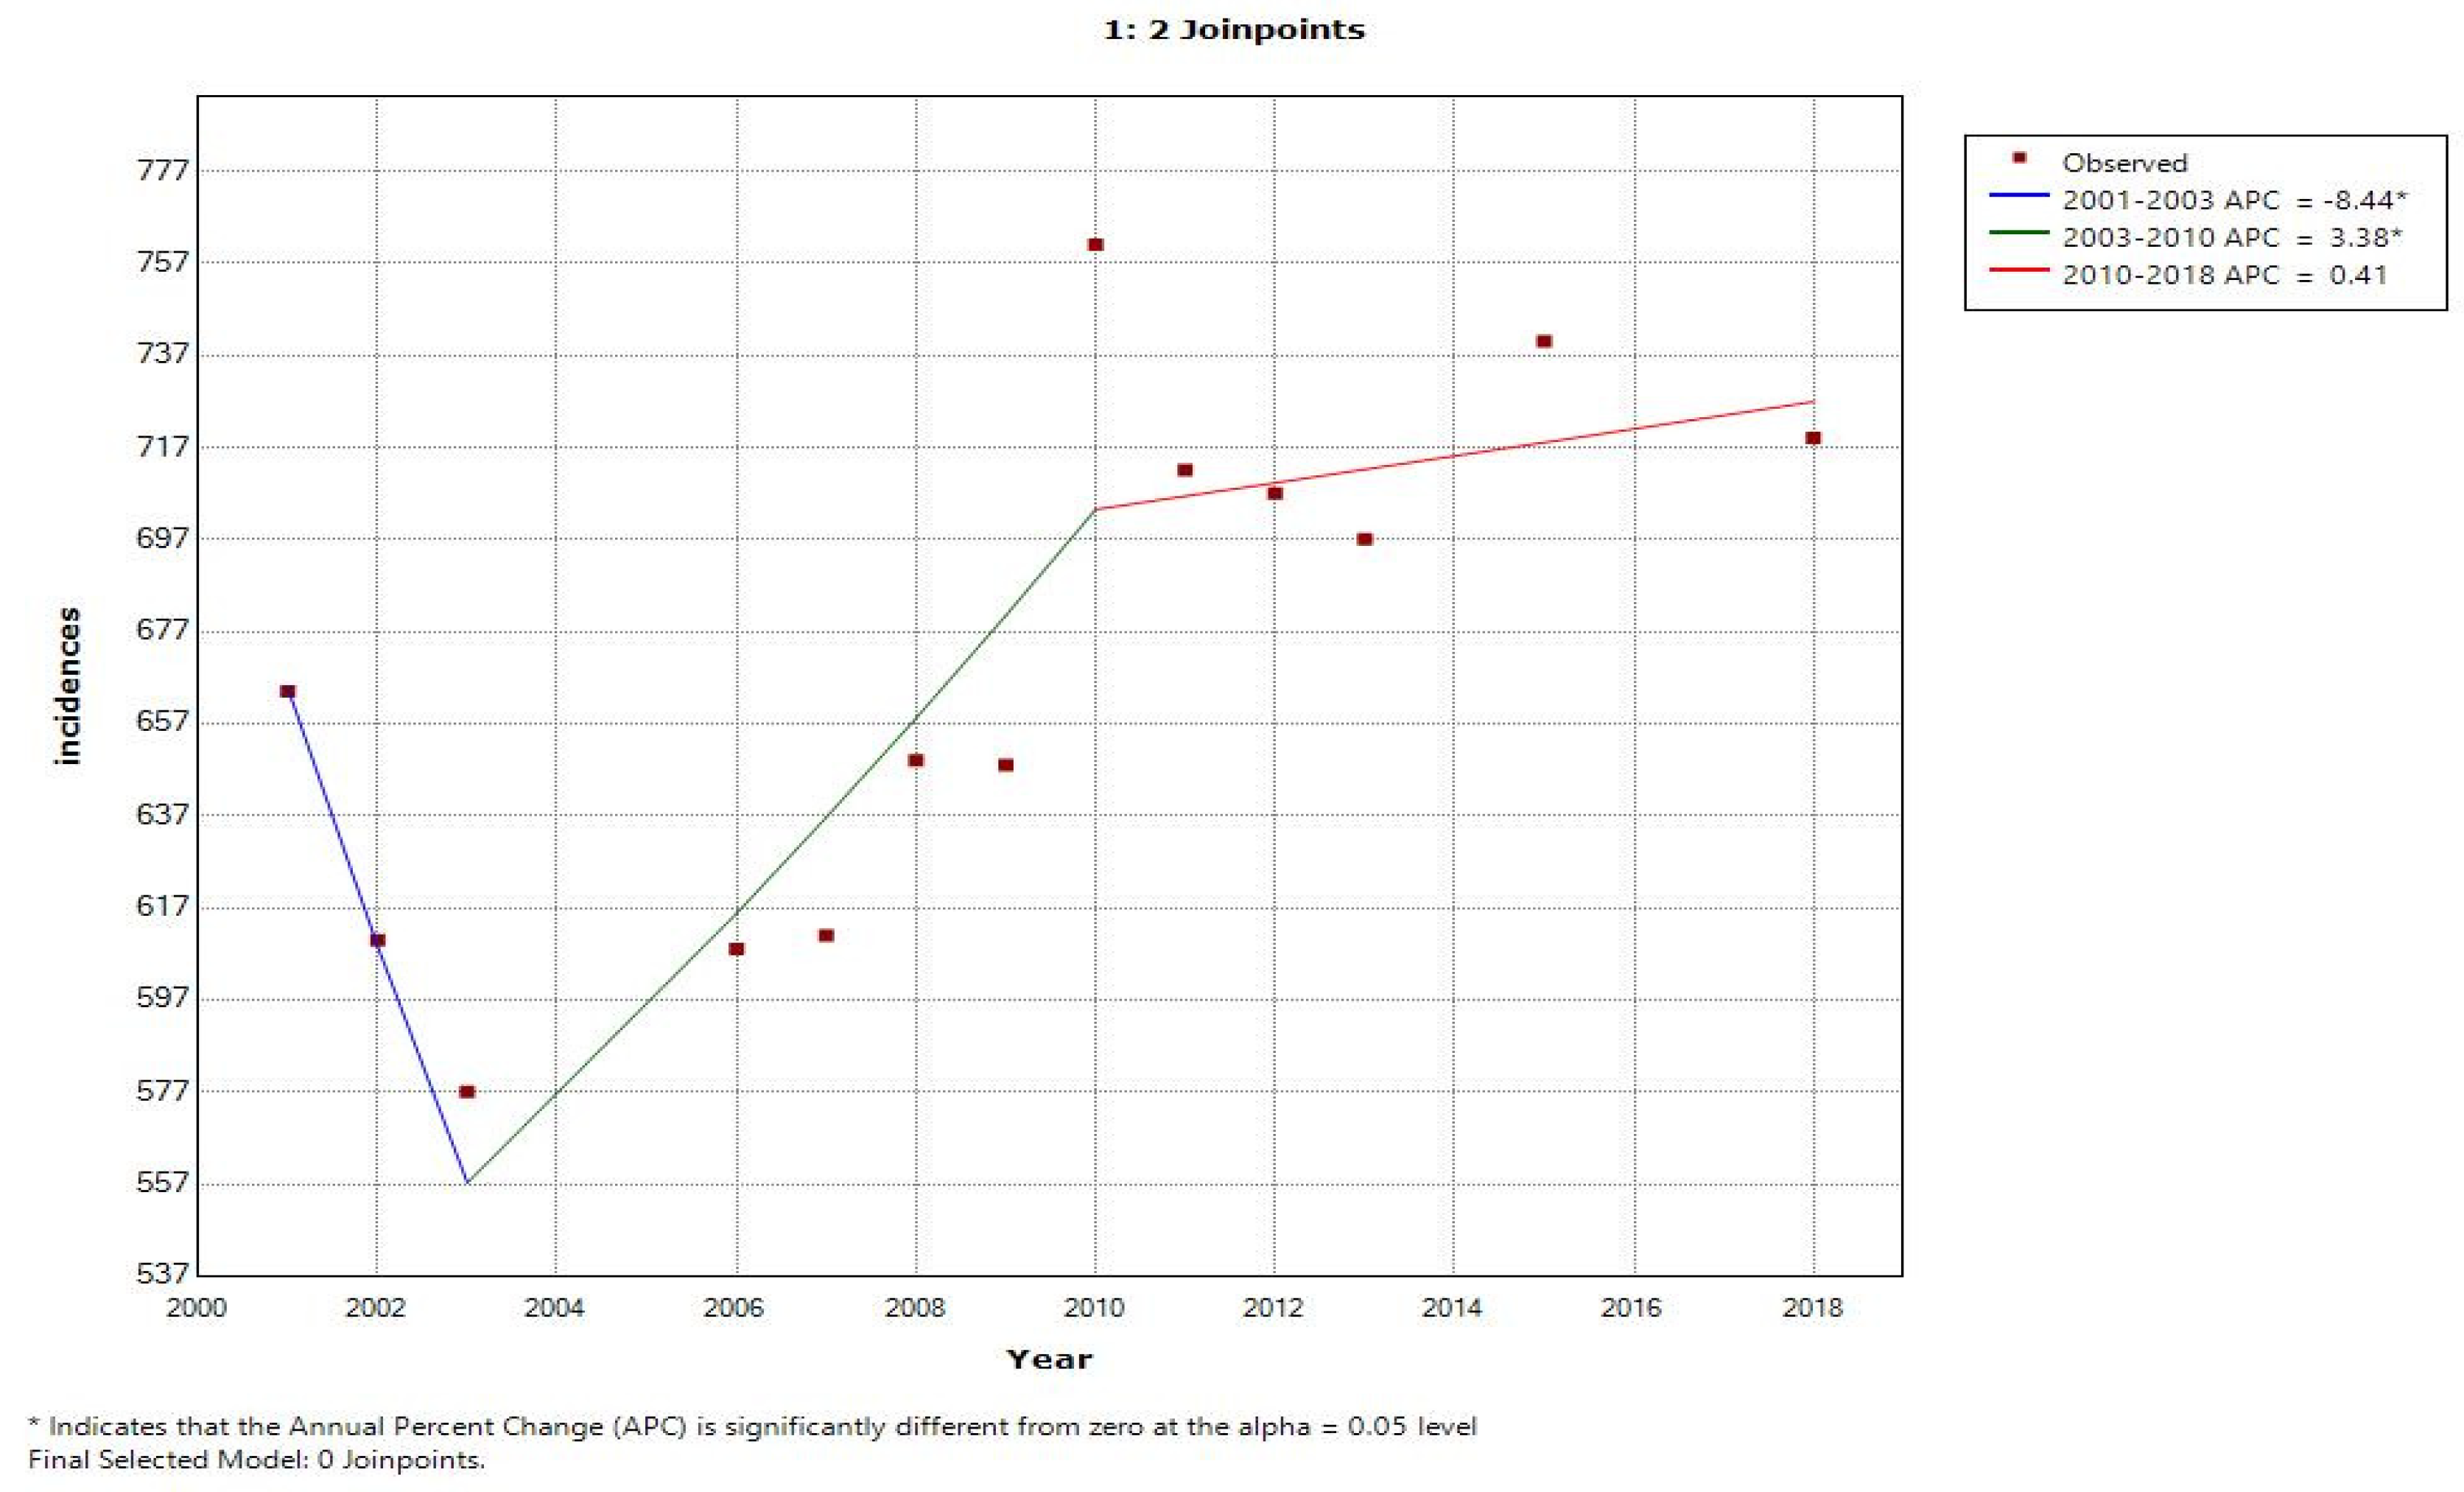
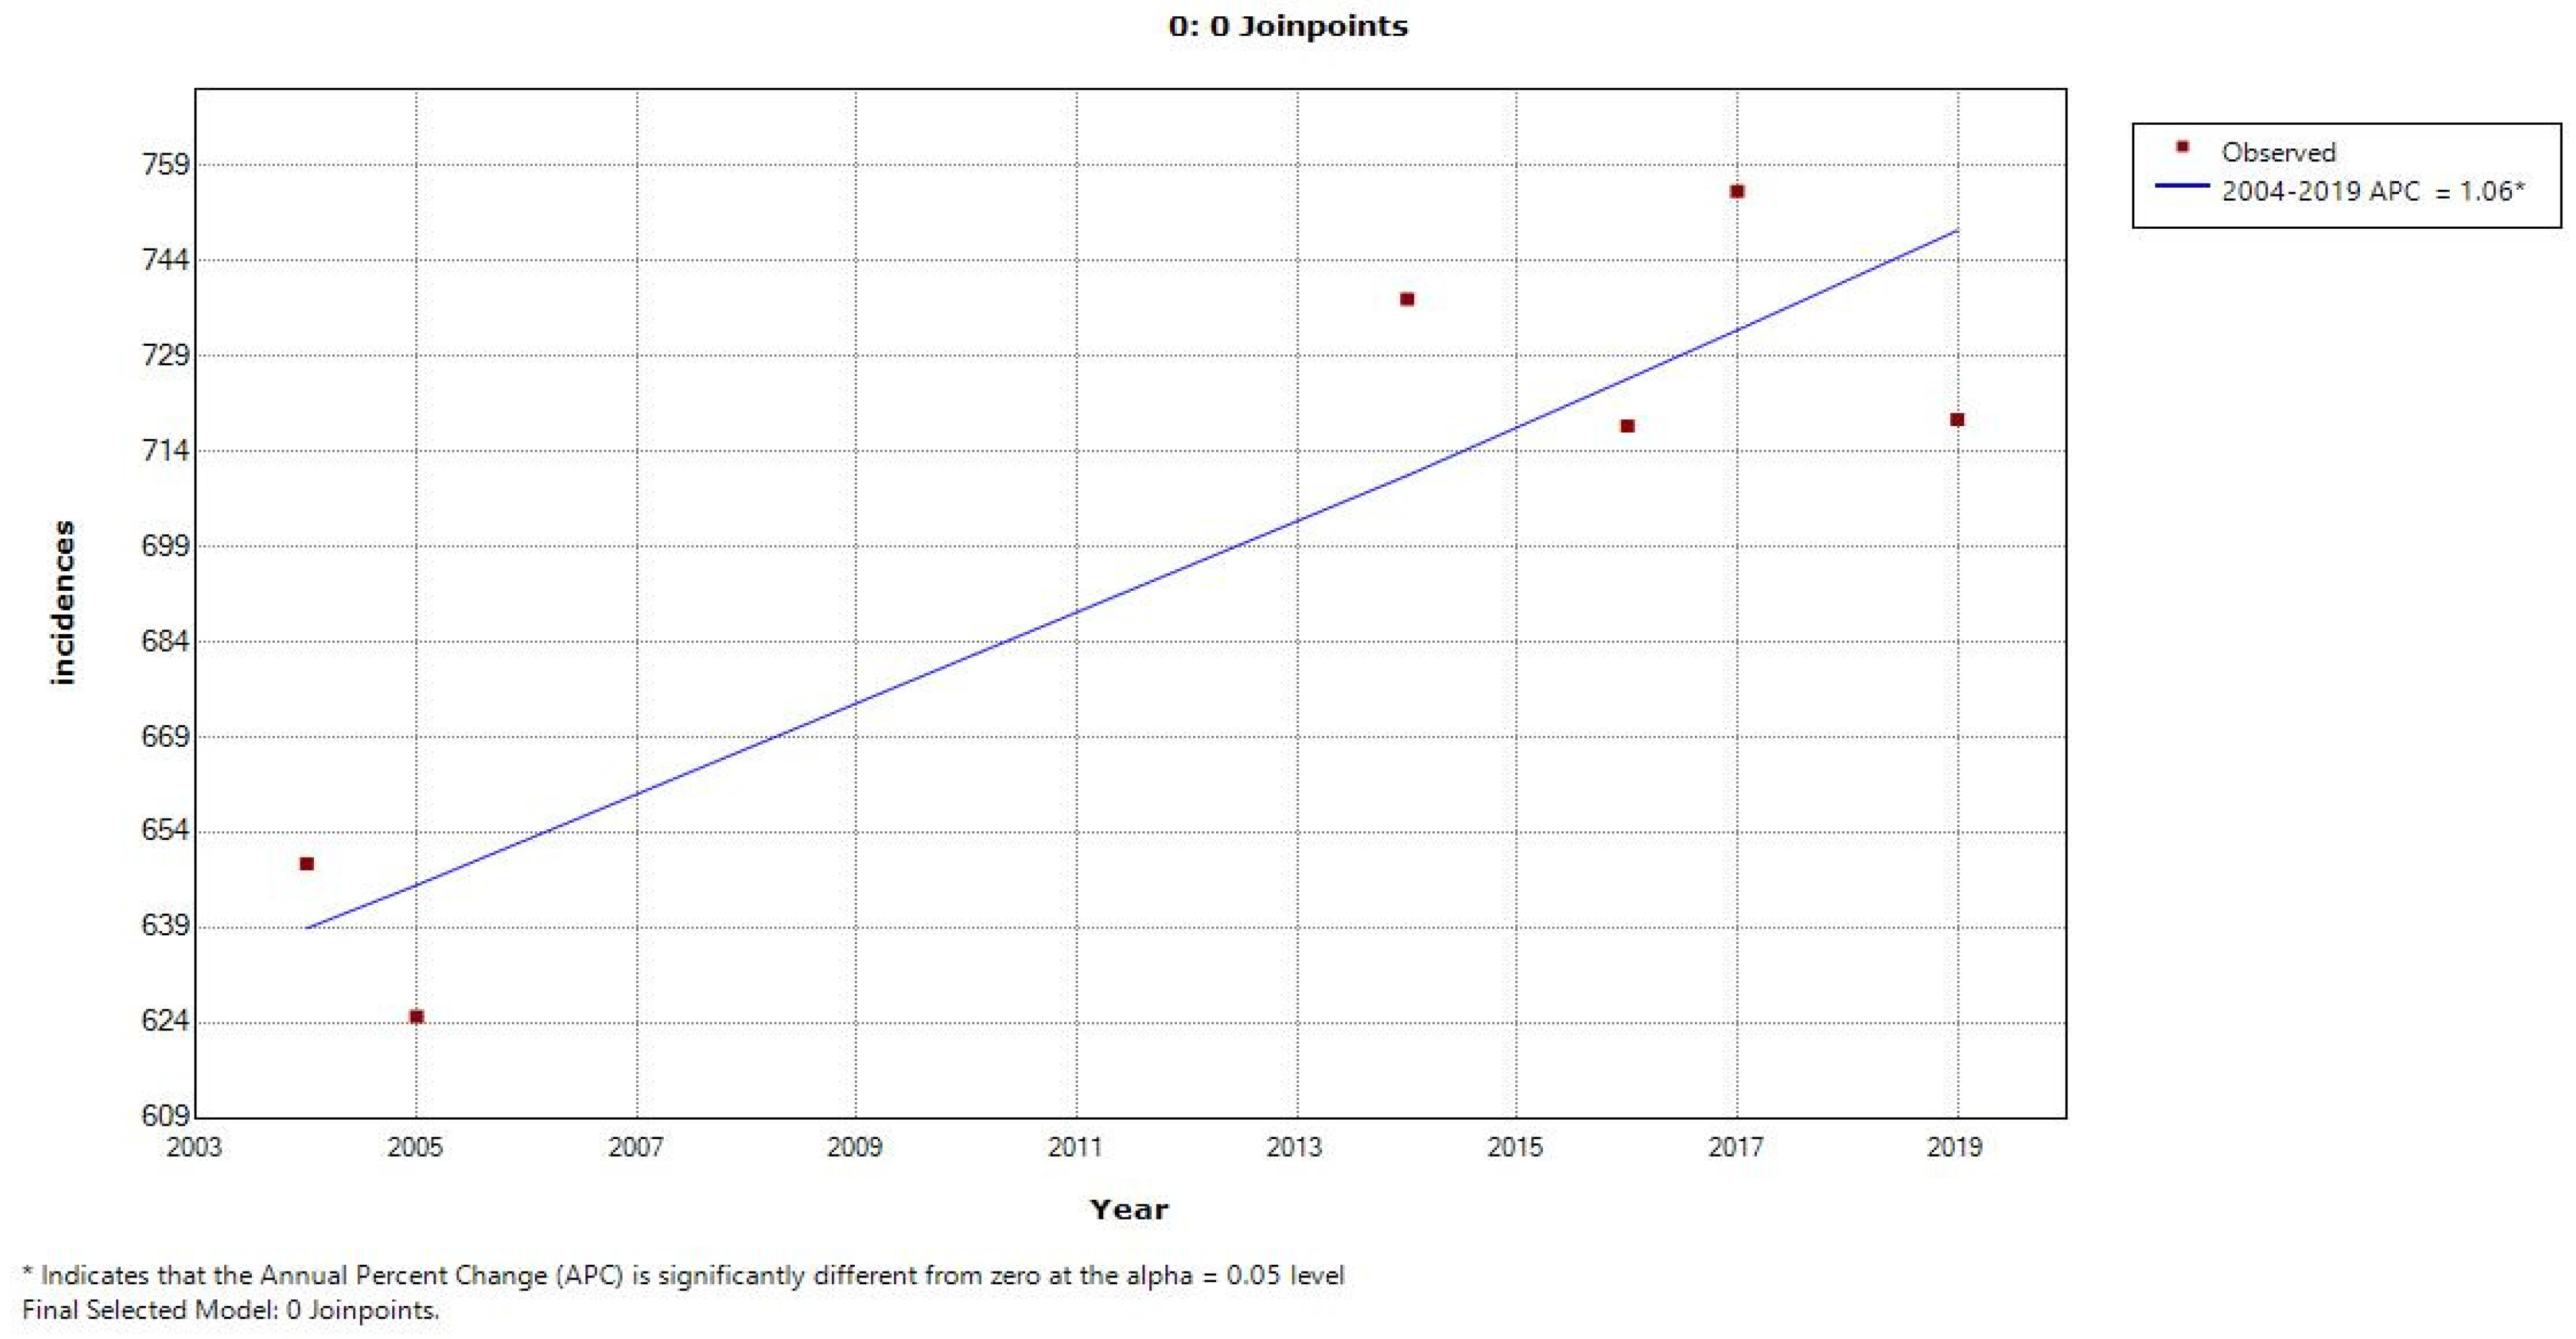
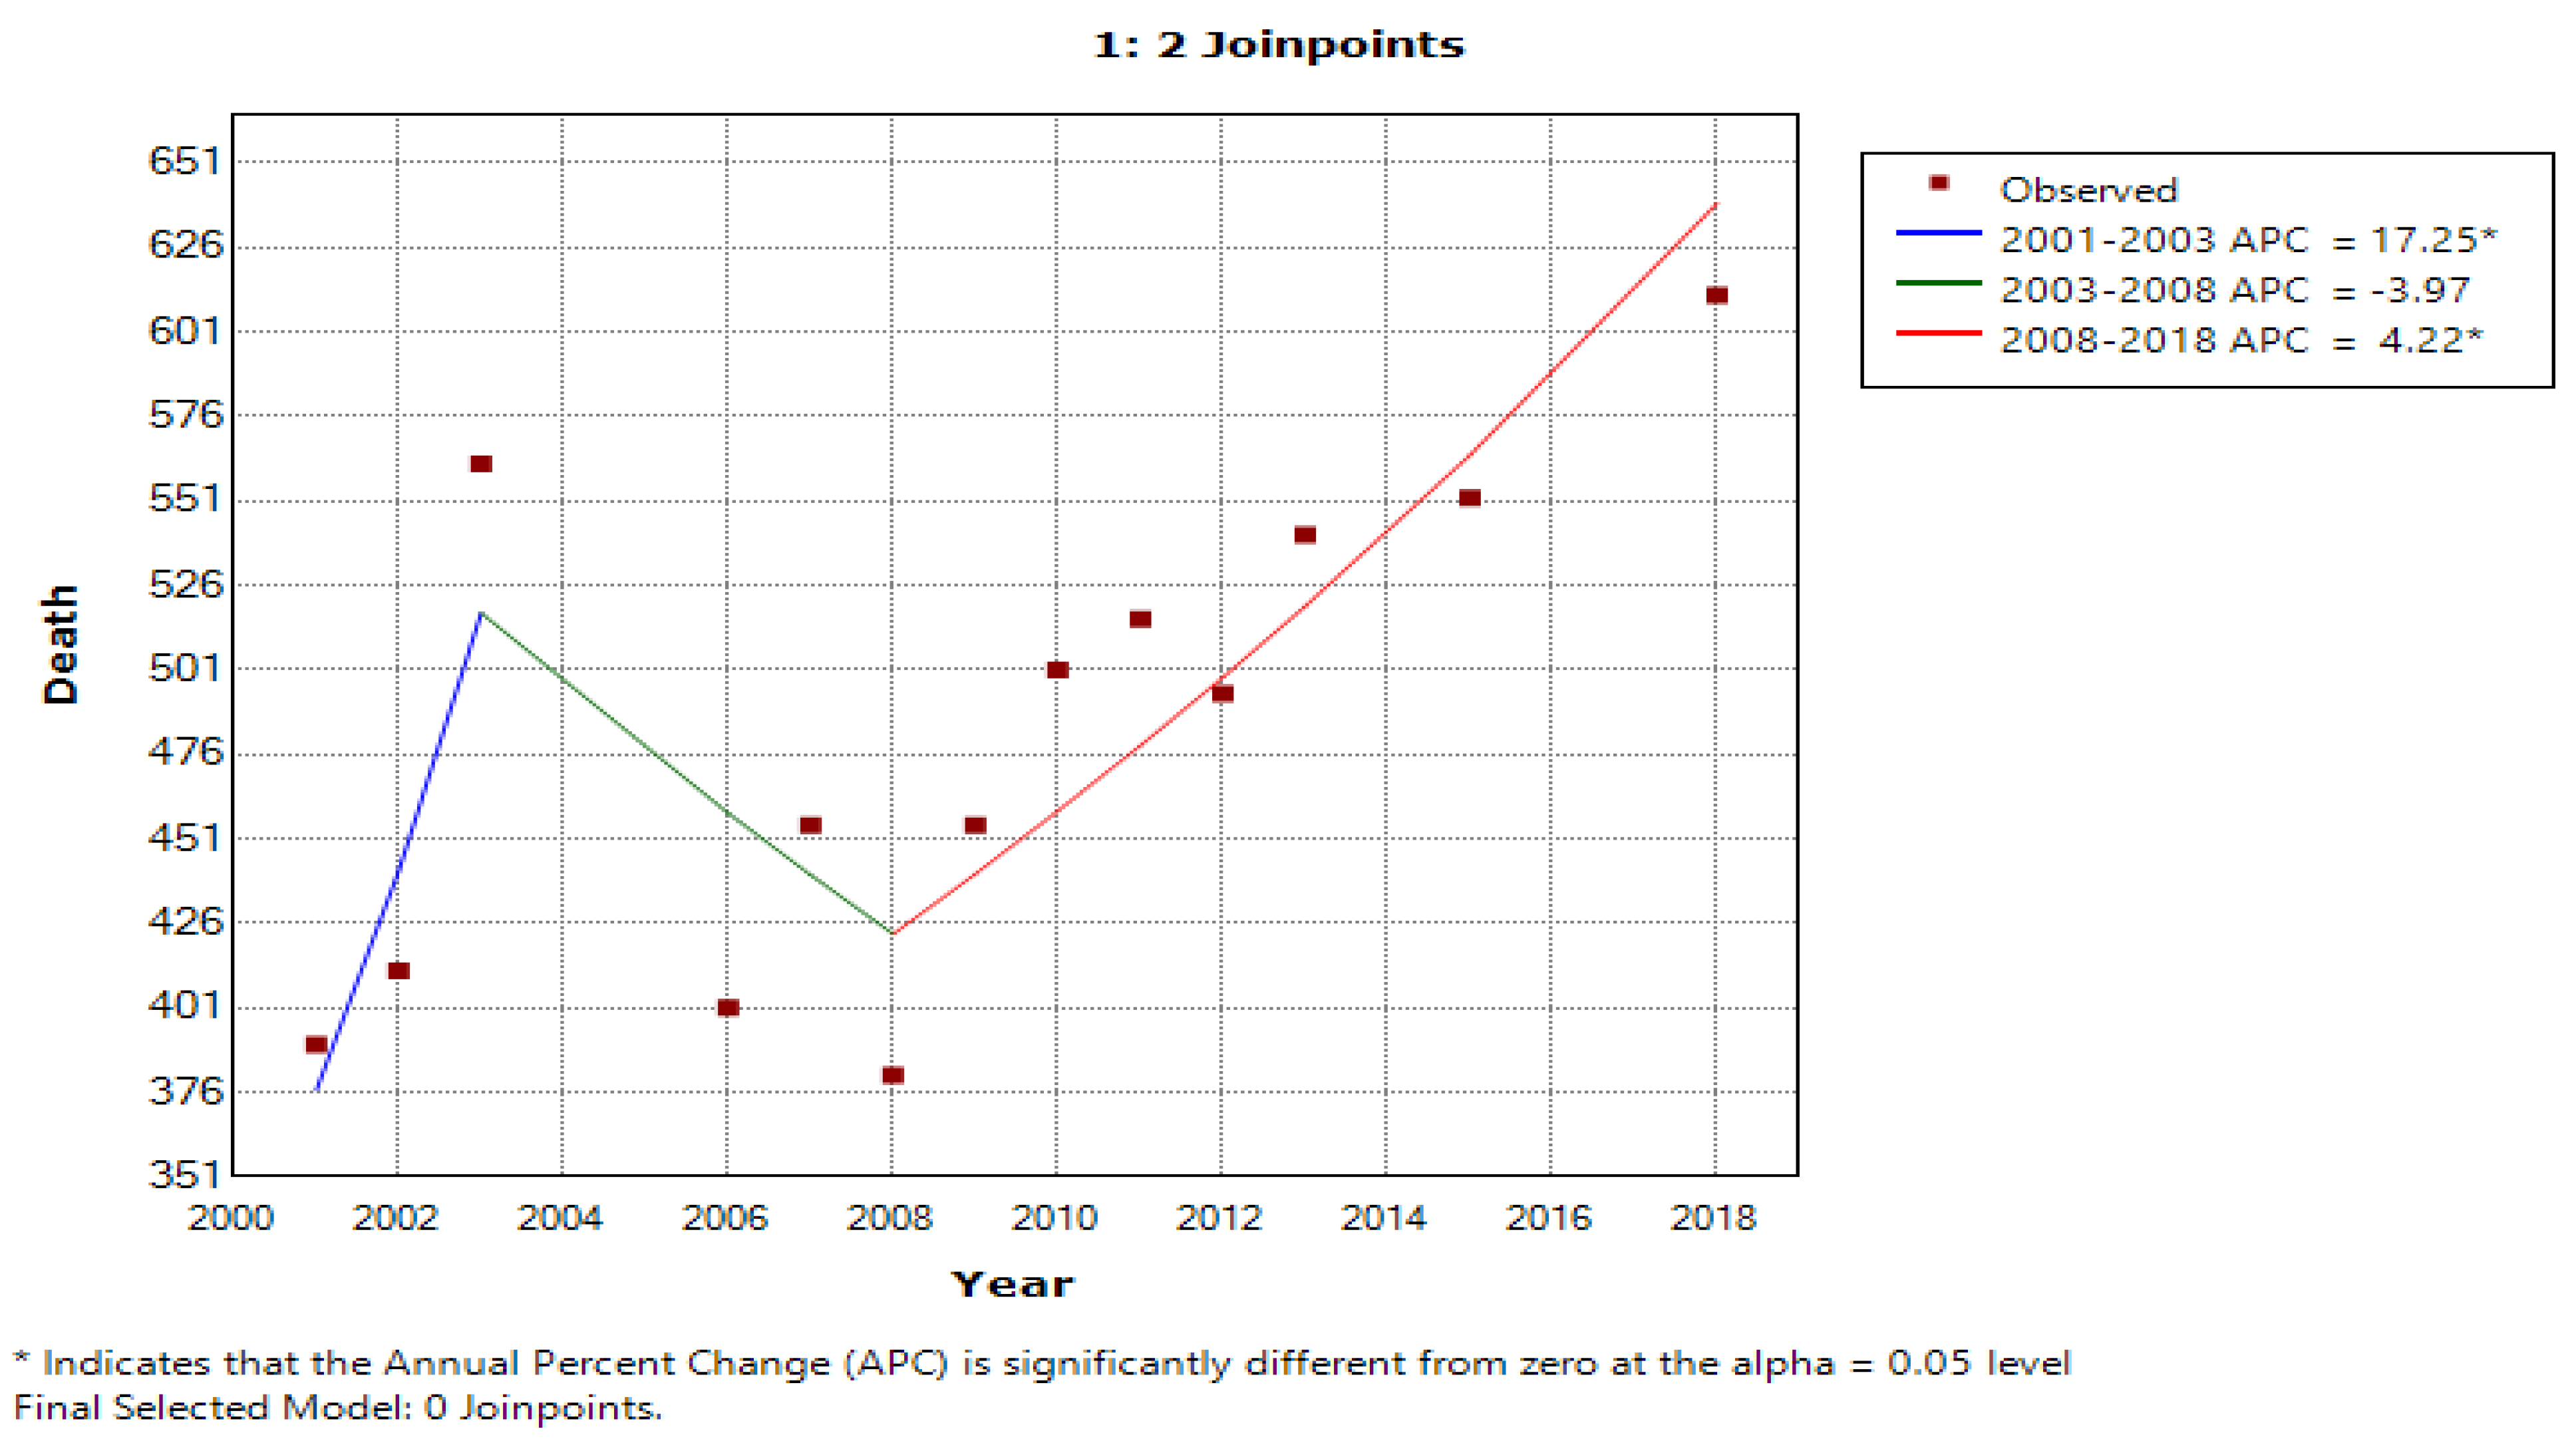
3.2. Joinpoint Regression Analysis
4. Discussion
5. Limitations
6. Conclusions
Author Contributions
Funding
Institutional Review Board Statement
Informed Consent Statement
Data Availability Statement
Conflicts of Interest
References
- Jayaraju, N.; Kumar, M.P.; Sreenivasulu, G.; Prasad, T.L.; Lakshmanna, B.; Nagalaksmi, K.; Madakka, M. Mobile phone and base stations radiation and its effects on human health and environment: A review. Sustain. Technol. Entrep. 2023, 2, 100031. [Google Scholar] [CrossRef]
- Hardell, L.; Carlberg, M. Increasing Rates of Brain Tumours in the Swedish National Inpatient Register and the Causes of Death Register. Int. J. Environ. Res. Public Health 2015, 12, 3793–3813. [Google Scholar] [CrossRef] [Green Version]
- Karipidis, K.; Elwood, M.; Benke, G.; Sanagou, M.; Tjong, L.; Croft, R.J. Mobile phone use and incidence of brain tumour histological types, grading or anatomical location: A population-based ecological study. BMJ Open 2018, 8, e024489. [Google Scholar] [CrossRef] [PubMed]
- IARC. Non-ionizing Radiation, Part 2: Radiofrequency Electromagnetic Fields. IARC Monogr. Eval. Carcinog. Risks Hum. 2011, 105. [Google Scholar]
- Lu, S.-Y.; Chen, J.-J.; Pan, J.-I.; Fu, Z.-X.; Wu, J.-L.; Hsieh, T.-C. The Association Between Different Patterns of Traditional Chinese Medicine Treatment and All-Cause Mortality Among Cancer Patients. Integr. Cancer Ther. 2019, 18, 1534735418823273. [Google Scholar] [CrossRef] [Green Version]
- Lee, H.-A.; Chen, K.-W.; Hsu, C.-Y. Prediction Model for Pancreatic Cancer—A Population-Based Study from NHIRD. Cancers 2022, 14, 882. [Google Scholar] [CrossRef] [PubMed]
- Lai, Y.-L.; Su, W.H. Palliative medicine and the hospice movement in Taiwan. Support. Care Cancer 1997, 5, 348–350. [Google Scholar] [CrossRef] [PubMed]
- Kuo, C.-N.; Liao, Y.-M.; Kuo, L.-N.; Tsai, H.-J.; Chang, W.-C.; Yen, Y. Cancers in Taiwan: Practical insight from epidemiology, treatments, biomarkers, and cost. J. Formos. Med. Assoc. 2020, 119, 1731–1741. [Google Scholar] [CrossRef]
- Voisin, M.R.; Sasikumar, S.; Mansouri, A.; Zadeh, G. Incidence and prevalence of primary malignant brain tumours in Canada from 1992 to 2017: An epidemiologic study. CMAJ Open 2021, 9, E973–E979. [Google Scholar] [CrossRef]
- Patel, A.P.; Fisher, J.L.; Nichols, E.; Abd-Allah, F.; Abdela, J.; Abdelalim, A.; Abraha, H.N.; Agius, D.; Alahdab, F.; Alam, T.; et al. Global, regional, and national burden of brain and other CNS cancer, 1990–2016: A systematic analysis for the Global Burden of Disease Study 2016. Lancet Neurol. 2019, 18, 376–393. [Google Scholar] [CrossRef] [Green Version]
- Khazaei, Z.; Goodarzi, E.; Borhaninejad, V.; Iranmanesh, F.; Mirshekarpour, H.; Mirzaei, B.; Naemi, H.; Bechashk, S.M.; Darvishi, I.; Sarabi, R.E.; et al. The association between incidence and mortality of brain cancer and human development index (HDI): An ecological study. BMC Public Health 2020, 20, 1696. [Google Scholar] [CrossRef] [PubMed]
- Chen, C.-J.; You, S.-L.; Lin, L.-H.; Hsu, W.-L.; Yang, Y.-W. Cancer epidemiology and control in Taiwan: A brief review. Jpn. J. Clin. Oncol. 2002, 32, S66–S81. [Google Scholar] [CrossRef] [PubMed] [Green Version]
- Philips, A.; Henshaw, D.L.; Lamburn, G.; O’carroll, M.J. Brain Tumours: Rise in Glioblastoma Multiforme Incidence in England 1995–2015 Suggests an Adverse Environmental or Lifestyle Factor. J. Environ. Public Health 2018, 2018, 7910754. [Google Scholar] [CrossRef] [PubMed] [Green Version]
- Hardell, L.; Carlberg, M. Mobile phones, cordless phones and rates of brain tumors in different age groups in the Swedish National Inpatient Register and the Swedish Cancer Register during 1998–2015. PLoS ONE 2017, 12, e0185461. [Google Scholar] [CrossRef] [Green Version]
- Coureau, G.; Bouvier, G.; Lebailly, P.; Fabbro-Peray, P.; Gruber, A.; Leffondre, K.; Guillamo, J.-S.; Loiseau, H.; Mathoulin-Pélissier, S.; Salamon, R.; et al. Mobile phone use and brain tumours in the CERENAT case-control study. Occup. Environ. Med. 2014, 71, 514–522. [Google Scholar] [CrossRef] [Green Version]
- Inskip, P.D.; Hoover, R.N.; Devesa, S.S. Brain cancer incidence trends in relation to cellular telephone use in the United States. Neuro-Oncology 2010, 12, 1147–1151. [Google Scholar] [CrossRef] [Green Version]
- Hardell, L.; Carlberg, M.; Mild, K.H. Pooled analysis of case-control studies on malignant brain tumours and the use of mobile and cordless phones including living and deceased subjects. Int. J. Oncol. 2011, 38, 1465–1474. [Google Scholar] [CrossRef] [Green Version]
- Group, T.I.S. Brain tumour risk in relation to mobile telephone use: Results of the INTERPHONE international case–control study. Int. J. Epidemiol. 2010, 39, 675–694. [Google Scholar] [CrossRef] [Green Version]
- Grell, K.; Frederiksen, K.; Schüz, J.; Cardis, E.; Armstrong, B.; Siemiatycki, J.; Krewski, D.R.; McBride, M.L.; Johansen, C.; Auvinen, A.; et al. The Intracranial Distribution of Gliomas in Relation to Exposure From Mobile Phones: Analyses From the INTERPHONE Study. Am. J. Epidemiol. 2016, 184, 818–828. [Google Scholar] [CrossRef] [Green Version]
- Cardis, E.; Richardson, L.; Deltour, I.; Armstrong, B.; Feychting, M.; Johansen, C.; Kilkenny, M.; McKinney, P.; Modan, B.; Sadetzki, S.; et al. The INTERPHONE study: Design, epidemiological methods, and description of the study population. Eur. J. Epidemiol. 2007, 22, 647–664. [Google Scholar] [CrossRef] [Green Version]
- Deltour, I.; Auvinen, A.; Feychting, M.; Johansen, C.; Klaeboe, L.; Sankila, R.; Schüz, J. Mobile Phone Use and Incidence of Glioma in the Nordic Countries 1979–2008: Consistency Check. Epidemiology 2012, 23, 301–307. [Google Scholar] [CrossRef] [PubMed]
- Little, M.P.; Rajaraman, P.; Curtis, R.E.; Devesa, S.S.; Inskip, P.D.; Check, D.P.; Linet, M.S. Mobile phone use and glioma risk: Comparison of epidemiological study results with incidence trends in the United States. BMJ 2012, 344, e1147. [Google Scholar] [CrossRef] [PubMed] [Green Version]
- Baan, R.; Grosse, Y.; Lauby-Secretan, B.; El Ghissassi, F.; Bouvard, V.; Benbrahim-Tallaa, L.; Guha, N.; Islami, F.; Galichet, L.; Straif, K. Carcinogenicity of radiofrequency electromagnetic fields. Lancet Oncol. 2011, 12, 624–626. [Google Scholar] [CrossRef] [PubMed]
- International Commission on Non-Ionizing Radiation Protection. Guidelines for Limiting Exposure to Electromagnetic Fields (100 kHz to 300 GHz). Health Phys. 2020, 118, 483–524. [Google Scholar] [CrossRef]
- Hardell, L.; Nilsson, M.; Koppel, T.; Carlberg, M. Aspects on the International Commission on Non-Ionizing Radiation Protection (ICNIRP) 2020 Guidelines on Radiofrequency Radiation. J. Cancer Sci. Clin. Ther. 2021, 5, 250–285. [Google Scholar] [CrossRef]
- Röösli, M.; Lagorio, S.; Schoemaker, M.J.; Schüz, J.; Feychting, M. Brain and Salivary Gland Tumors and Mobile Phone Use: Evaluating the Evidence from Various Epidemiological Study Designs. Annu. Rev. Public Health 2019, 40, 221–238. [Google Scholar] [CrossRef] [Green Version]
- Villeneuve, P.J.; Momoli, F.; Parent, M.É.; Siemiatycki, J.; Turner, M.C.; Krewski, D. Cell phone use and the risk of glioma: Are case-control study findings consistent with Canadian time trends in cancer incidence? Environ. Res. 2021, 200, 111283. [Google Scholar] [CrossRef]
- Schüz, J.; Pirie, K.; Reeves, G.K.; Floud, S.; Beral, V. For the Million Women Study Collaborators Cellular Telephone Use and the Risk of Brain Tumors: Update of the UK Million Women Study. Gynecol. Oncol. 2022, 114, 704–711. [Google Scholar] [CrossRef]
- Benson, V.S.; Pirie, K.; Schüz, J.; Reeves, G.K.; Beral, V.; Green, J.; for the Million Women Study Collaborators. Mobile phone use and risk of brain neoplasms and other cancers: Prospective study. Leuk. Res. 2013, 42, 792–802. [Google Scholar] [CrossRef] [Green Version]
- Schüz, J.; Jacobsen, R.; Olsen, J.H.; Boice, J.D., Jr.; McLaughlin, J.K.; Johansen, C. Faculty Opinions recommendation of Cellular telephone use and cancer risk: Update of a nationwide Danish cohort. J. Natl. Cancer Inst. 2006, 98. [Google Scholar] [CrossRef]
- Johansen, C.; et alJohansen, C.; Boice, J.D., Jr.; McLaughlin, J.K.; Olsen, J.H. Cellular telephones and cancer—A nationwide cohort study in Denmark. J. Natl. Cancer Inst. 2001, 93, 203–207. [Google Scholar] [CrossRef] [PubMed] [Green Version]
- NIH National Cancer Institute. Cell Phones and Cancer Risk. Cancer Causes and Prevention 2022. Cited 15 June 2023. Available online: https://www.cancer.gov/about-cancer/causes-prevention/risk/radiation/cell-phones-fact-sheet (accessed on 2 April 2023).
- Cho, J.H.; Lim, Y.C.; Han, K.-D.; Lee, J.Y.; Choi, J.H. The incidence of malignant brain tumors is increased in patients with obstructive sleep apnea: A national health insurance survey. PLoS ONE 2020, 15, e0241598. [Google Scholar] [CrossRef] [PubMed]
- Ostrom, Q.T.; Fahmideh, M.A.; Cote, D.J.; Muskens, I.S.; Schraw, J.; Scheurer, M.; Bondy, M.L. Risk factors for childhood and adult primary brain tumors. Neuro-Oncology 2019, 21, 1357–1375. [Google Scholar] [CrossRef]
- Vienne-Jumeau, A.; Tafani, C.; Ricard, D. Environmental risk factors of primary brain tumors: A review. Rev. Neurol. 2019, 175, 664–678. [Google Scholar] [CrossRef] [PubMed]
- Teng, W.; Lu, H.-P.; Yu, H. Exploring the mass adoption of third-generation (3G) mobile phones in Taiwan. Telecommun. Policy. 2009, 33, 628–641. [Google Scholar] [CrossRef]
- Liu, C.C.; Day, W.-W.; Sun, S.-W.; Wang, G. User Behavior and the “Globalness” of Internet: From a Taiwan Users' Perspective. J. Comput.-Mediat. Commun. 2002, 7, JCMC723. [Google Scholar] [CrossRef]
- Hsu, M.-H.; Syed-Abdul, S.; Scholl, J.; Jian, W.-S.; Lee, P.; Iqbal, U.; Li, Y.-C. The incidence rate and mortality of malignant brain tumors after 10 years of intensive cell phone use in Taiwan. Eur. J. Cancer Prev. 2013, 22, 596–598. [Google Scholar] [CrossRef]
- Kulubya, E.S.; Kercher, M.J.; Phillips, H.W.; Antony, R.; Edwards, M.S.B. Advances in the Treatment of Pediatric Brain Tumors. Children 2022, 10, 62. [Google Scholar] [CrossRef]
- Hu, L.S.; Brat, D.J.; Bloch, O.; Ramkissoon, S.; Lesser, G.J. The Practical Application of Emerging Technologies Influencing the Diagnosis and Care of Patients With Primary Brain Tumors. Am. Soc. Clin. Oncol. Educ. Book 2020, 40, e35–e46. [Google Scholar] [CrossRef]
- Gao, H.; Jiang, X. Progress on the diagnosis and evaluation of brain tumors. Cancer Imaging 2013, 13, 466–481. [Google Scholar] [CrossRef] [Green Version]
- Ellingson, B.M.; Bendszus, M.; Sorensen, A.G.; Pope, W.B. Emerging techniques and technologies in brain tumor imaging. Neuro-Oncology 2014, 16, vii12–vii23. [Google Scholar] [CrossRef] [PubMed] [Green Version]
- Mathews, J.D.; Forsythe, A.V.; Brady, Z.; Butler, M.W.; Goergen, S.K.; Byrnes, G.B.; Giles, G.G.; Wallace, A.B.; Anderson, P.R.; Guiver, T.A.; et al. Cancer risk in 680,000 people exposed to computed tomography scans in childhood or adolescence: Data linkage study of 11 million Australians. BMJ Br. Med. J. 2013, 346, f2360. [Google Scholar] [CrossRef] [Green Version]
- Miller, A.B.; Morgan, L.L.; Udasin, I.; Davis, D.L. Cancer epidemiology update, following the 2011 IARC evaluation of radiofrequency electromagnetic fields (Monograph 102). Environ. Res. 2018, 167, 673–683. [Google Scholar] [CrossRef] [PubMed]
- Lin, J.C. Carcinogenesis from chronic exposure to radio-frequency radiation. Front. Public Health 2022, 10, 4167. [Google Scholar] [CrossRef] [PubMed]
- Pinto, R.; Ardoino, L.; Villani, P.; Marino, C. In Vivo Studies on Radiofrequency (100 kHz–300 GHz) Electromagnetic Field Exposure and Cancer: A Systematic Review. Int. J. Environ. Res. Public Health 2023, 20, 2071. [Google Scholar] [CrossRef] [PubMed]
- Morgan, L.L.; Miller, A.B.; Sasco, A.; Davis, D.L. Mobile phone radiation causes brain tumors and should be classified as a probable human carcinogen (2A) (Review). Int. J. Oncol. 2015, 46, 1865–1871. [Google Scholar] [CrossRef] [Green Version]
- Kühn, S.; Cabot, E.; Christ, A.; Capstick, M.; Kuster, N. Assessment of the radio-frequency electromagnetic fields induced in the human body from mobile phones used with hands-free kits. Phys. Med. Biol. 2009, 54, 5493–5508. [Google Scholar] [CrossRef]
- IARC Working Group on the Evaluation of Carcinogenic Risks to Humans. Non-ionizing radiation, Part 2: Radiofrequency electromagnetic fields. IARC Monogr. Eval. Carcinog. Risks Hum. 2013, 102, 1. [Google Scholar]


| Item | No. of Mobile Phone Users | No. of Incidences of MNB | No. of Deaths Due to MNB |
|---|---|---|---|
| AAPC | 63.41 | 9.10 | 62.00 |
| CAGR | 1.95 | 1.07 | 2.30 |
| Factors | Model 1 (Incidence) | Model 2 (Deaths) |
|---|---|---|
| Constant | 2.910 * | −3.542 * |
| MOB | 0.354 * | 0.9572 * |
| Std. Error. | 0.115 | 0.172 |
| R2 | 0.58 | 0.631 |
| Adjusted R2 | 0.343 | 0.610 |
| Cohort | Annual Percent Change (APC) | |
| Upper Joinpoint | APC | |
| Increase (1) | 2003 | −8.4 * |
| 2010 | 3.4 | |
| 2018 | 0.4 | |
| Average Annual Percent Change (AAPC) | ||
| Upper Joinpoint | AAPC | |
| 2018 | 0.5 | |
| * Indicates that the annual percent change (APC) is slightly different from zero at the alpha = 0.05 level | ||
| Decrease (0) | Upper Joinpoint | APC |
| 2019 | 1.1 * | |
| Upper Joinpoint | AAPC | |
| 2019 | 1.1 * | |
| * Indicates that the average annual percent change (AAPC) is slightly different from zero at the alpha = 0.05 level | ||
| Cohort | Annual Percent Change (APC) | |
| Upper Joinpoint | APC | |
| Increase (1) | 2003 | 17.3 * |
| 2008 | −4.0 | |
| 2018 | 4.2 * | |
| Average Annual Percent Change (AAPC) | ||
| Upper Joinpoint | AAPC | |
| 2019 | 3.2 * | |
| * Indicates that the annual percent change (APC) is slightly different from zero at the alpha = 0.05 level | ||
| Decrease (0) | Upper Joinpoint | APC |
| 2019 | 2.4 * | |
| Upper Joinpoint | AAPC | |
| 2019 | 2.4 * | |
| * Indicates that the average annual percent change (AAPC) is slightly different from zero at the alpha = 0.05 level | ||
Disclaimer/Publisher’s Note: The statements, opinions and data contained in all publications are solely those of the individual author(s) and contributor(s) and not of MDPI and/or the editor(s). MDPI and/or the editor(s) disclaim responsibility for any injury to people or property resulting from any ideas, methods, instructions or products referred to in the content. |
© 2023 by the authors. Licensee MDPI, Basel, Switzerland. This article is an open access article distributed under the terms and conditions of the Creative Commons Attribution (CC BY) license (https://creativecommons.org/licenses/by/4.0/).
Share and Cite
Uddin, M.; Dhanta, R.; Pitti, T.; Barsasella, D.; Scholl, J.; Jian, W.-S.; Li, Y.-C.; Hsu, M.-H.; Syed-Abdul, S. Incidence and Mortality of Malignant Brain Tumors after 20 Years of Mobile Use. Cancers 2023, 15, 3492. https://doi.org/10.3390/cancers15133492
Uddin M, Dhanta R, Pitti T, Barsasella D, Scholl J, Jian W-S, Li Y-C, Hsu M-H, Syed-Abdul S. Incidence and Mortality of Malignant Brain Tumors after 20 Years of Mobile Use. Cancers. 2023; 15(13):3492. https://doi.org/10.3390/cancers15133492
Chicago/Turabian StyleUddin, Mohy, Rozy Dhanta, Thejkiran Pitti, Diana Barsasella, Jeremiah Scholl, Wen-Shan Jian, Yu-Chuan (Jack) Li, Min-Huei Hsu, and Shabbir Syed-Abdul. 2023. "Incidence and Mortality of Malignant Brain Tumors after 20 Years of Mobile Use" Cancers 15, no. 13: 3492. https://doi.org/10.3390/cancers15133492
APA StyleUddin, M., Dhanta, R., Pitti, T., Barsasella, D., Scholl, J., Jian, W. -S., Li, Y. -C., Hsu, M. -H., & Syed-Abdul, S. (2023). Incidence and Mortality of Malignant Brain Tumors after 20 Years of Mobile Use. Cancers, 15(13), 3492. https://doi.org/10.3390/cancers15133492