Treatment Patterns and Outcomes for Patients with Ampullary Carcinoma Who Do Not Undergo Surgery
Abstract
Simple Summary
Abstract
1. Introduction
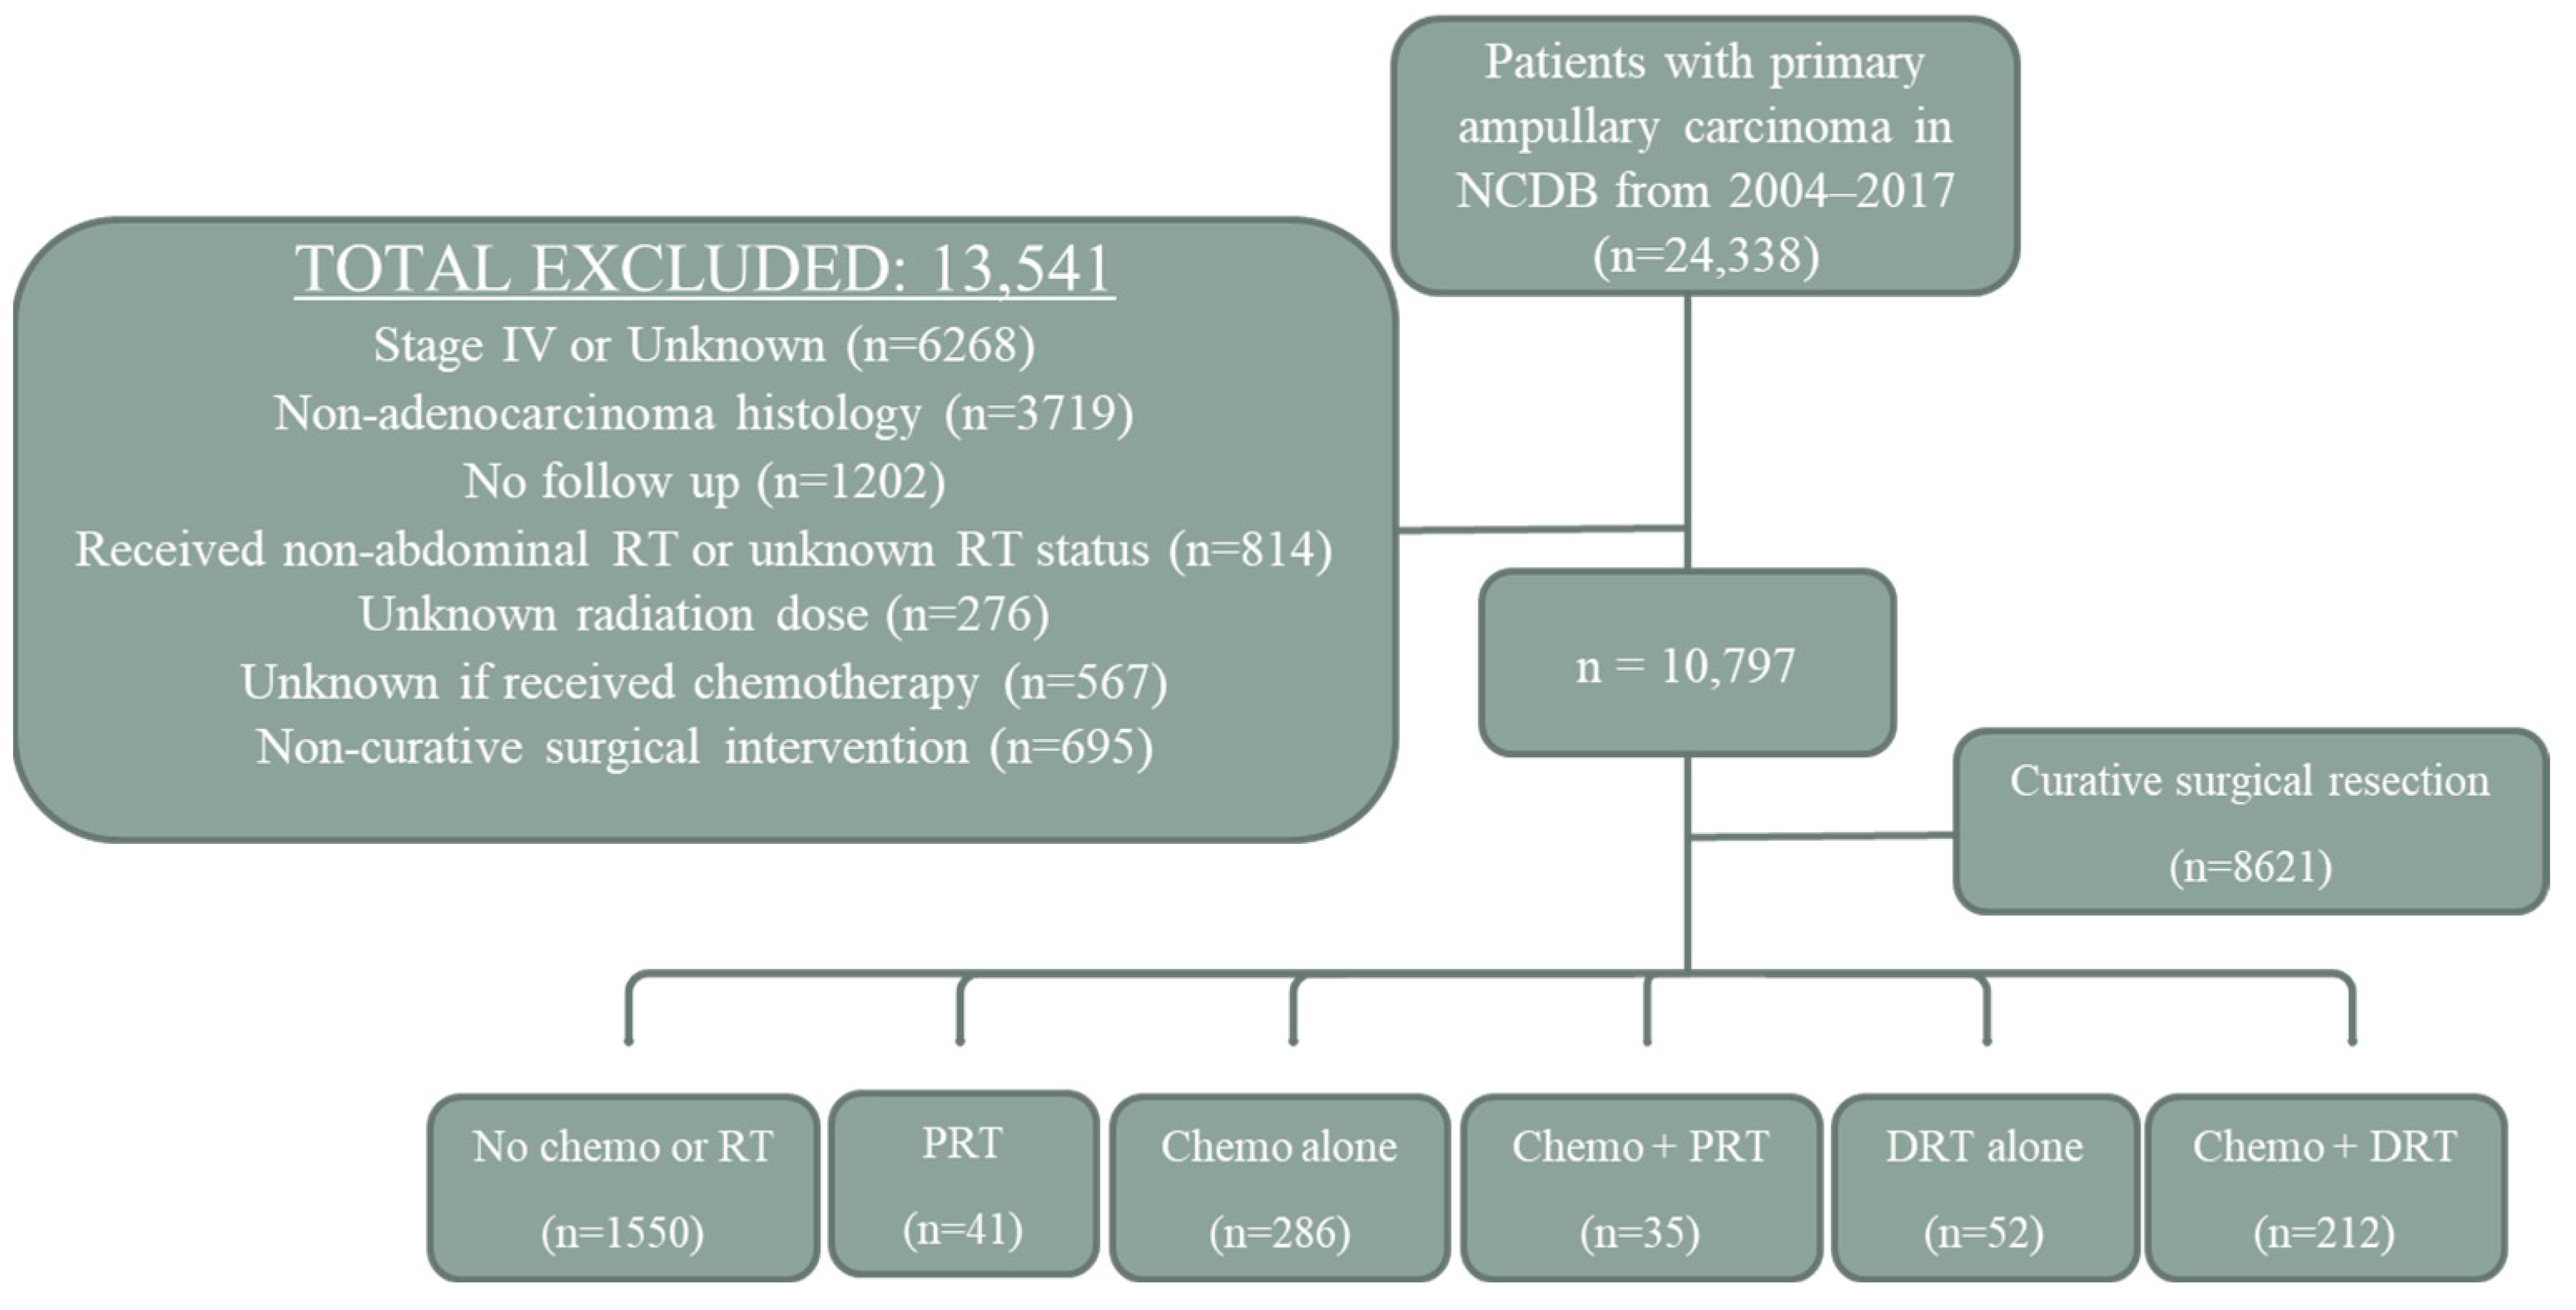
2. Materials and Methods
2.1. Patient Selection
2.2. Treatment Groups
2.3. Statistical Methods
3. Results
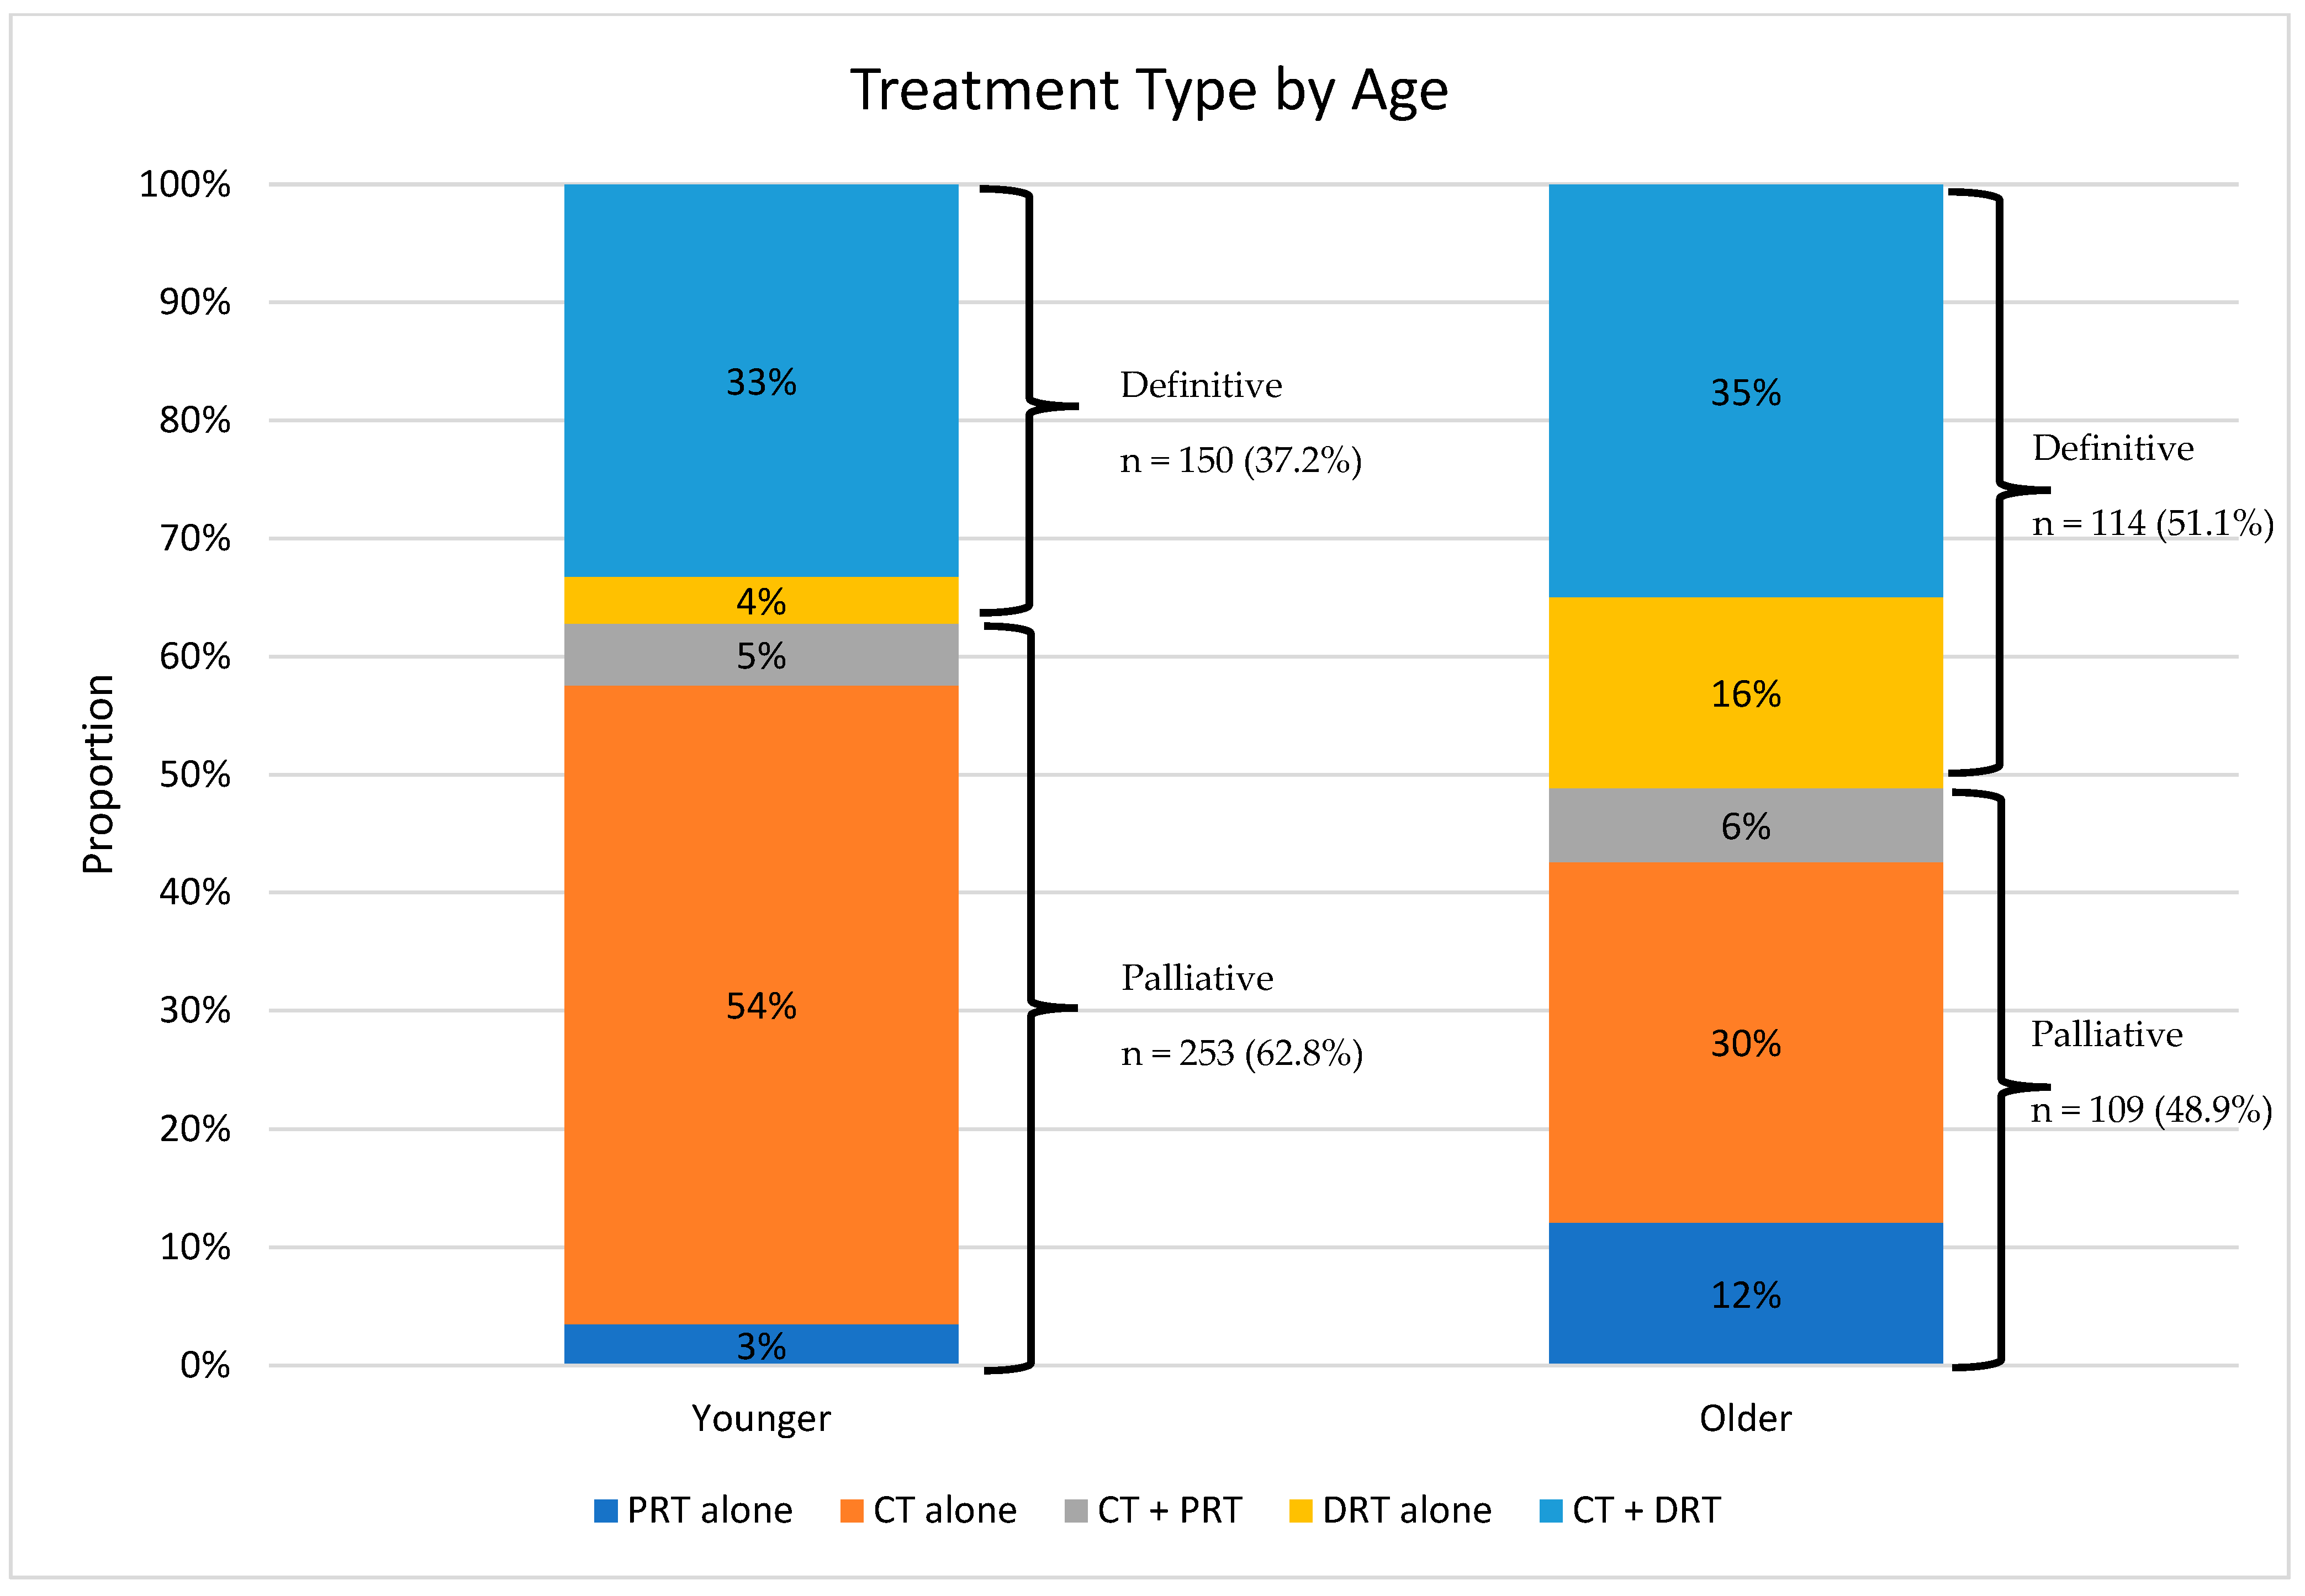
3.1. Treatment Groups
3.2. No Treatment vs. Treatment
3.3. Palliative Therapy vs. Definitive Therapy
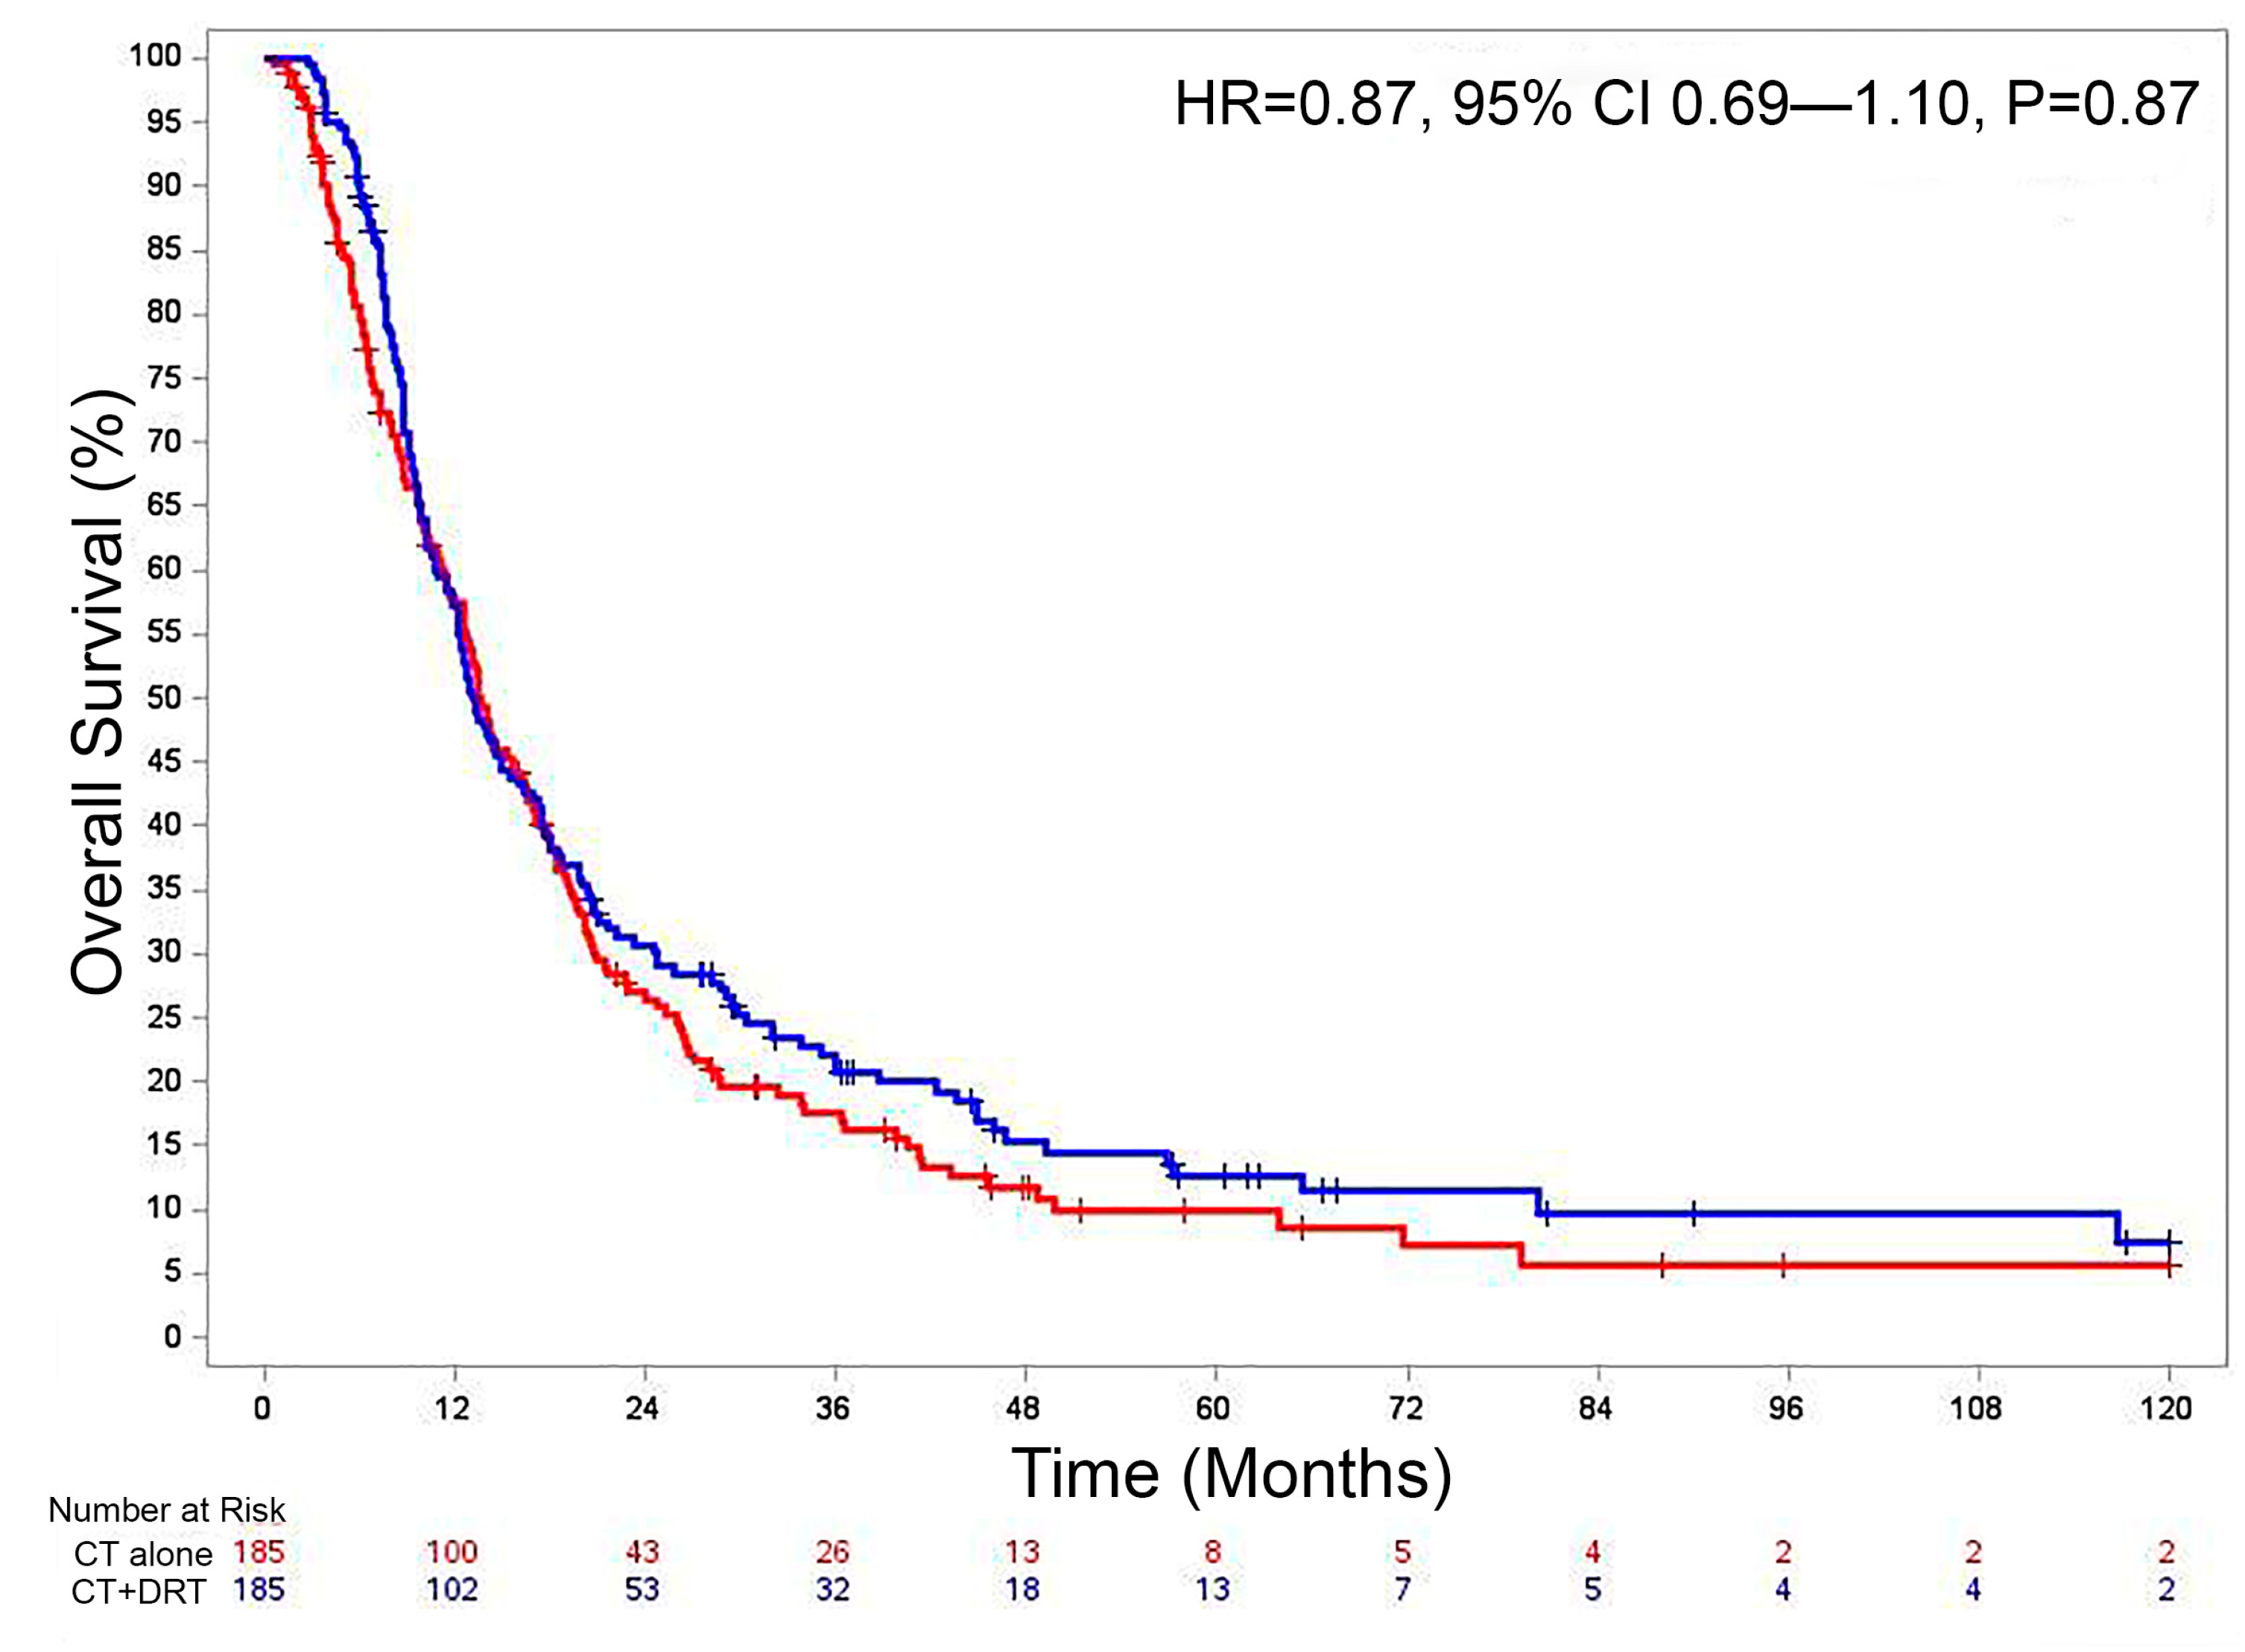
3.4. Chemotherapy Alone vs. Chemotherapy and Definitive Radiation Therapy
3.5. Overall Survival
4. Discussion
5. Conclusions
Author Contributions
Funding
Institutional Review Board Statement
Informed Consent Statement
Data Availability Statement
Conflicts of Interest
References
- Albores-Saavedra, J.; Schwartz, A.M.; Batich, K.; Henson, D.E. Cancers of the ampulla of vater: Demographics, morphology, and survival based on 5625 cases from the SEER program. J. Surg. Oncol. 2009, 100, 598–605. [Google Scholar] [CrossRef] [PubMed]
- O’Connell, J.B.; Maggard, M.A.; Manunga, J.; Tomlinson, J.S.; Reber, H.A.; Ko, C.Y.; Hines, O.J. Survival After Resection of Ampullary Carcinoma: A National Population-Based Study. Ann. Surg. Oncol. 2008, 15, 1820–1827. [Google Scholar] [CrossRef] [PubMed]
- Rostain, F.; Hamza, S.; Drouillard, A.; Faivre, J.; Bouvier, A.M.; Lepage, C. Trends in incidence and management of cancer of the ampulla of Vater. World J. Gastroenterol. 2014, 20, 10144–10150. [Google Scholar] [CrossRef] [PubMed]
- de Jong, E.J.M.; Geurts, S.M.E.; van der Geest, L.G.; Besselink, M.G.; Bouwense, S.A.W.; Buijsen, J.; Dejong, C.H.C.; Heij, L.R.; Koerkamp, B.G.; de Hingh, I.H.J.T.; et al. A population-based study on incidence, treatment, and survival in ampullary cancer in the Netherlands. Eur. J. Surg. Oncol. 2021, 47, 1742–1749. [Google Scholar] [CrossRef] [PubMed]
- Manne, A.; Hatic, H.; Li, P.; Jacob, R.; Williams, G.; Paluri, R. The Clinical Benefit of Adjuvant Therapy in Long-Term Survival of Early-Stage Ampullary Carcinoma: A Single Institutional Experience. J. Clin. Med. Res. 2020, 12, 560–567. [Google Scholar] [CrossRef] [PubMed]
- Guo, M.; Beal, E.W.; Miller, E.D.; Williams, T.M.; Tsung, A.; Dillhoff, M.; Ejaz, A.; Pawlik, T.M.; Cloyd, J.M. Neoadjuvant therapy versus surgery first for ampullary carcinoma: A propensity score-matched analysis of the NCDB. J. Surg. Oncol. 2021, 123, 1558–1567. [Google Scholar] [CrossRef] [PubMed]
- Regalla, D.K.R.; Jacob, R.; Manne, A.; Paluri, R.K. Therapeutic options for ampullary carcinomas. A review. Oncol Rev. 2019, 13, 440. [Google Scholar] [CrossRef] [PubMed]
- Cloyd, J.M.; Wang, H.; Overman, M.; Zhao, J.; Denbo, J.; Prakash, L.; Kim, M.P.; Shroff, R.; Javle, M.; Varadhachary, G.R.; et al. Influence of Preoperative Therapy on Short- and Long-Term Outcomes of Patients with Adenocarcinoma of the Ampulla of Vater. Ann. Surg. Oncol. 2017, 24, 2031–2039. [Google Scholar] [CrossRef] [PubMed]
- Nassour, I.; Hynan, L.S.; Christie, A.; Minter, R.M.; Yopp, A.C.; Choti, M.A.; Mansour, J.C.; Porembka, M.R.; Wang, S.C. Association of Adjuvant Therapy with Improved Survival in Ampullary Cancer: A National Cohort Study. J. Gastrointest. Surg. 2018, 22, 695–702. [Google Scholar] [CrossRef] [PubMed]
- Stiles, Z.E.; Behrman, S.W.; Deneve, J.L.; Glazer, E.S.; Dong, L.; Wan, J.Y.; Martin, M.G.; Dickson, P.V. Ampullary adenocarcinoma: Defining predictors of survival and the impact of adjuvant therapy following surgical resection for stage I disease. J. Surg. Oncol. 2018, 117, 1500–1508. [Google Scholar] [CrossRef] [PubMed]
- Edge, S.B.; McKellar, D.; Stewart, A.K. Using the American College of Surgeons Cancer Registry to Drive Quality. JOP 2013, 9, 149–151. [Google Scholar] [CrossRef] [PubMed]
- Amin, M. (Ed.) AJCC Cancer Staging Manual, 8th ed.; Springer: Berlin/Heidelberg, Germany, 2017. [Google Scholar]
- American Community Survey. 2012. Available online: https://data.census.gov/cedsci/ (accessed on 4 November 2022).
- Rosenbaum, P.R.; Rubin, D.B. Constructing a Control Group Using Multivariate Matched Sampling Methods That Incorporate the Propensity Score. Am. Stat. 1985, 39, 33–38. [Google Scholar]
- Valle, J.; Wasan, H.; Palmer, D.H.; Cunningham, D.; Anthoney, A.; Maraveyas, A.; Madhusudan, S.; Iveson, T.; Hughes, S.; Pereira, S.P.; et al. Cisplatin plus Gemcitabine versus Gemcitabine for Biliary Tract Cancer. N. Engl. J. Med. 2010, 362, 1273–1281. [Google Scholar] [CrossRef] [PubMed]
- Hammel, P.; Huguet, F.; van Laethem, J.L.; Goldstein, D.; Glimelius, B.; Artru, P.; Borbath, I.; Bouché, O.; Shannon, J.; André, T.; et al. Effect of Chemoradiotherapy vs Chemotherapy on Survival in Patients with Locally Advanced Pancreatic Cancer Controlled After 4 Months of Gemcitabine with or without Erlotinib: The LAP07 Randomized Clinical Trial. JAMA 2016, 315, 1844–1853. [Google Scholar] [CrossRef] [PubMed]


| No Treatment | PRT Alone | CT Alone | CT + PRT | DRT Alone | CT + DRT | |||||||
|---|---|---|---|---|---|---|---|---|---|---|---|---|
| N | % | N | % | N | % | N | % | N | % | N | % | |
| Patients | 1550 | 71.2% | 41 | 1.9% | 286 | 13.1% | 35 | 1.6% | 52 | 2.4% | 212 | 9.7% |
| Mean age | 77.8 | 80.2 | 69.6 | 74.9 | 81.7 | 73.3 | ||||||
| Age groups | ||||||||||||
| 79 or younger | 694 | 44.8% | 14 | 34.1% | 218 | 76.2% | 21 | 60.0% | 16 | 30.8% | 134 | 63.2% |
| 80 or older | 856 | 55.2% | 27 | 65.9% | 68 | 23.8% | 14 | 40.0% | 36 | 69.2% | 78 | 36.8% |
| Mean follow-up (months) | 14.8 | 10.9 | 18.5 | 13.7 | 20.0 | 21.8 | ||||||
| Gender | ||||||||||||
| Male | 780 | 50.3% | 27 | 65.9% | 172 | 60.1% | 22 | 62.9% | 31 | 59.6% | 129 | 60.8% |
| Female | 770 | 49.7% | 14 | 34.1% | 114 | 39.9% | 13 | 37.1% | 21 | 40.4% | 83 | 39.2% |
| Charlson-Deyo Comorbidity Score | ||||||||||||
| 0 | 935 | 60.3% | 22 | 53.7% | 191 | 66.8% | 16 | 45.7% | 28 | 53.8% | 142 | 67.0% |
| 1+ | 615 | 39.7% | 19 | 46.3% | 95 | 33.2% | 19 | 54.3% | 24 | 46.2% | 70 | 33.0% |
| Distance from care | ||||||||||||
| <10.2 mi | 738 | 47.6% | 25 | 61.0% | 130 | 45.5% | 21 | 60.0% | 27 | 51.9% | 90 | 42.5% |
| ≥10.2 mi | 747 | 48.2% | 12 | 29.3% | 142 | 49.7% | 14 | 40.0% | 24 | 46.2% | 107 | 50.5% |
| Unknown | 65 | 4.2% | 4 | 9.8% | 14 | 4.9% | 0 | 0.0% | 1 | 1.9% | 15 | 7.1% |
| Race | ||||||||||||
| White | 1321 | 85.2% | 37 | 90.2% | 238 | 83.2% | 29 | 82.9% | 44 | 84.6% | 185 | 87.3% |
| Non-White | 229 | 14.8% | 4 | 9.8% | 48 | 16.8% | 6 | 17.1% | 8 | 15.4% | 27 | 12.7% |
| Income | ||||||||||||
| <$48,000 per year | 653 | 42.1% | 16 | 39.0% | 115 | 40.2% | 19 | 54.3% | 19 | 36.5% | 87 | 41.0% |
| ≥$48,000 per year | 826 | 53.3% | 21 | 51.2% | 157 | 54.9% | 16 | 45.7% | 32 | 61.5% | 109 | 51.4% |
| Unknown | 71 | 4.6% | 4 | 9.8% | 14 | 4.9% | 0 | 0.0% | 1 | 1.9% | 16 | 7.5% |
| Year diagnosed | ||||||||||||
| 2004–2010 | 680 | 43.9% | 10 | 24.4% | 81 | 28.3% | 12 | 34.3% | 29 | 55.8% | 91 | 42.9% |
| 2011–2017 | 870 | 56.1% | 31 | 75.6% | 205 | 71.7% | 23 | 65.7% | 23 | 44.2% | 121 | 57.1% |
| Clinical Stage | ||||||||||||
| I | 911 | 58.8% | 28 | 68.3% | 88 | 30.8% | 14 | 40.0% | 30 | 57.7% | 98 | 46.2% |
| II or III | 639 | 41.2% | 13 | 31.7% | 198 | 69.2% | 21 | 60.0% | 22 | 42.3% | 114 | 53.8% |
| T Stage | ||||||||||||
| 1 or 2 | 646 | 41.7% | 24 | 58.5% | 105 | 36.7% | 12 | 34.3% | 17 | 32.7% | 76 | 35.8% |
| 3 or 4 | 385 | 24.8% | 10 | 24.4% | 125 | 43.7% | 15 | 42.9% | 10 | 19.2% | 58 | 27.4% |
| Unknown | 519 | 33.5% | 7 | 17.1% | 56 | 19.6% | 8 | 22.9% | 25 | 48.1% | 78 | 36.8% |
| N Stage | ||||||||||||
| 0 | 892 | 57.5% | 29 | 70.7% | 152 | 53.1% | 19 | 54.3% | 24 | 46.2% | 101 | 47.6% |
| 1 | 119 | 7.7% | 5 | 12.2% | 74 | 25.9% | 8 | 22.9% | 3 | 5.8% | 33 | 15.6% |
| Unknown | 539 | 34.8% | 7 | 17.1% | 60 | 21.0% | 8 | 22.9% | 25 | 48.1% | 78 | 36.8% |
| Univariate | Multivariate | |||||||
|---|---|---|---|---|---|---|---|---|
| Variable | OR | Lower CI | Upper CI | p-Value | OR | Lower CI | Upper CI | p-Value |
| Age: ≥80 vs. <80 | 0.85 | 0.82 | 0.88 | 0.000 | 0.88 | 0.84 | 0.92 | 0.000 |
| Sex: F vs. M | 0.92 | 0.88 | 0.95 | 0.000 | 0.94 | 0.90 | 0.99 | 0.012 |
| Race: non-white vs. white | 1.00 | 0.95 | 1.06 | 0.961 | ||||
| Income: ≥$48,000 vs. <$48,000 | 1.01 | 0.97 | 1.05 | 0.730 | ||||
| Comorbidity: ≥1 vs. 0 | 0.97 | 0.93 | 1.01 | 0.140 | ||||
| Distance to care: <10.2 mi vs. ≥10.2 mi | 1.00 | 1.00 | 0.96 | 1.040 | ||||
| Year of diagnosis: 2011–2017 vs. 2004–2010 | 1.07 | 1.03 | 1.11 | 0.000 | 1.07 | 1.01 | 1.01 | 0.026 |
| Stage II–III vs. Stage I | 1.16 | 1.11 | 1.20 | 0.000 | 1.13 | 1.00 | 1.27 | 0.049 |
| T3–4 vs. T1–2 | 1.10 | 1.05 | 1.15 | 0.000 | 0.96 | 0.86 | 1.07 | 0.442 |
| N1 vs. N0 | 1.27 | 1.20 | 1.36 | 0.000 | 1.16 | 1.07 | 1.26 | 0.000 |
| Univariate | Multivariate | |||||||
|---|---|---|---|---|---|---|---|---|
| Variable | OR | Lower CI | Upper CI | p-Value | OR | Lower CI | Upper CI | p-Value |
| Age: ≥80 vs. <80 | 1.15 | 1.06 | 1.25 | 0.001 | 1.19 | 1.09 | 1.31 | 0.000 |
| Sex: F vs. M | 1.00 | 0.93 | 1.09 | 0.911 | ||||
| Race: non-white vs. white | 0.95 | 0.85 | 1.06 | 0.338 | ||||
| Income: ≥$48,000 vs. <$48,000 | 1.01 | 0.94 | 1.10 | 0.747 | ||||
| Comorbidity: ≥1 vs. 0 | 0.99 | 0.91 | 1.07 | 0.771 | ||||
| Distance to care: <10.2 mi vs. ≥10.2 mi | 1.04 | 0.96 | 1.13 | 0.339 | ||||
| Year of diagnosis: 2011–2017 vs. 2004–2010 | 0.83 | 0.77 | 0.90 | 0.000 | 1.01 | 0.88 | 1.16 | 0.916 |
| Stage II–III vs. Stage I | 0.88 | 0.81 | 0.95 | 0.002 | 0.94 | 0.78 | 1.14 | 0.531 |
| T3–4 vs. T1–2 | 0.92 | 0.84 | 1.00 | 0.058 | 0.98 | 0.83 | 1.15 | 0.815 |
| N1 vs. N0 | 0.91 | 0.83 | 1.01 | 0.071 | 0.98 | 0.85 | 1.12 | 0.746 |
| Univariate | Multivariate | |||||||
|---|---|---|---|---|---|---|---|---|
| Variable | OR | Lower CI | Upper CI | p-Value | OR | Lower CI | Upper CI | p-Value |
| Age: ≥80 vs. <80 | 1.16 | 1.06 | 1.28 | 0.002 | 1.24 | 1.11 | 1.38 | 0.000 |
| Sex: F vs. M | 0.99 | 0.91 | 1.09 | 0.873 | ||||
| Race: non-white vs. white | 0.93 | 0.82 | 1.05 | 0.212 | ||||
| Income: ≥$48,000 vs. <$48,000 | 0.99 | 0.91 | 1.08 | 0.853 | ||||
| Comorbidity: ≥1 vs. 0 | 1.00 | 0.91 | 1.09 | 0.963 | ||||
| Distance to care: <10.2 mi vs. ≥10.2 mi | 1.02 | 0.93 | 1.12 | 0.652 | ||||
| Year of diagnosis: 2011–2017 vs. 2004–2010 | 0.85 | 0.78 | 0.93 | 0.001 | 1.04 | 0.90 | 1.21 | 0.583 |
| Stage II–III vs. Stage I | 0.85 | 0.78 | 0.93 | 0.040 | 0.87 | 0.75 | 1.02 | 0.093 |
| T3–4 vs. T1–2 | 0.90 | 0.82 | 1.00 | 0.042 | 1.01 | 0.87 | 1.17 | 0.895 |
| N1 vs. N0 | 0.91 | 0.82 | 1.02 | 0.104 | ||||
| Treatment Groups | Median OS (mo) | 1 yr OS | 3 yr OS |
|---|---|---|---|
| No Treatment | 7.9 | 36.7% | 13.6% |
| PRT alone | 9.5 | 35.1% | 4.1% |
| CT alone | 13.1 | 53.4% | 17.3% |
| CT + PRT | 10.4 | 45.7% | 8.6% |
| DRT alone | 14.7 | 56.7% | 15.6% |
| CT + DRT | 13.7 | 59.4% | 20.1% |
| Univariate Analysis | Multivariate Analysis | |||||||
|---|---|---|---|---|---|---|---|---|
| Variable | HR | Lower CI | Upper CI | p-Value | HR | Lower CI | Upper CI | p-Value |
| CT + DRT vs. CT Alone | 0.86 | 0.71 | 1.05 | 0.139 | 0.88 | 0.72 | 1.08 | 0.227 |
| Year of Diagnosis: 2011–2017 vs. 2004–2010 | 0.79 | 0.65 | 0.97 | 0.021 | 0.81 | 0.66 | 0.99 | 0.039 |
| Stage II–III vs. Stage I | 1.24 | 1.01 | 1.51 | 0.038 | 1.22 | 0.99 | 1.50 | 0.063 |
| Age (continuous) | 1.00 | 0.99 | 1.01 | 0.992 | 1.01 | 1.00 | 1.01 | 0.262 |
| Sex: F vs. M | 1.07 | 0.88 | 1.30 | 0.503 | ||||
| Race: Non-white vs. white | 0.81 | 0.62 | 1.06 | 0.129 | ||||
| Comorbidity: ≥1 vs. 0 | 1.06 | 0.86 | 1.29 | 0.599 | ||||
| Income: ≥$48,000 vs. <$48,000 | 0.87 | 0.72 | 1.05 | 0.153 | ||||
| Distance to care | ||||||||
| <10.2 mi | Ref | Ref | Ref | Ref | ||||
| ≥10.2 mi | 1.23 | 1.01 | 1.50 | 0.041 | 1.23 | 1.01 | 1.50 | 0.043 |
| Unknown | 0.60 | 0.38 | 0.97 | 0.036 | 0.67 | 0.41 | 1.08 | 0.097 |
Disclaimer/Publisher’s Note: The statements, opinions and data contained in all publications are solely those of the individual author(s) and contributor(s) and not of MDPI and/or the editor(s). MDPI and/or the editor(s) disclaim responsibility for any injury to people or property resulting from any ideas, methods, instructions or products referred to in the content. |
© 2023 by the authors. Licensee MDPI, Basel, Switzerland. This article is an open access article distributed under the terms and conditions of the Creative Commons Attribution (CC BY) license (https://creativecommons.org/licenses/by/4.0/).
Share and Cite
Facer, B.D.; Cloyd, J.M.; Manne, A.; Pitter, K.L.; Diaz, D.A.; Bazan, J.G.; Miller, E.D. Treatment Patterns and Outcomes for Patients with Ampullary Carcinoma Who Do Not Undergo Surgery. Cancers 2023, 15, 3727. https://doi.org/10.3390/cancers15143727
Facer BD, Cloyd JM, Manne A, Pitter KL, Diaz DA, Bazan JG, Miller ED. Treatment Patterns and Outcomes for Patients with Ampullary Carcinoma Who Do Not Undergo Surgery. Cancers. 2023; 15(14):3727. https://doi.org/10.3390/cancers15143727
Chicago/Turabian StyleFacer, Benjin D., Jordan M. Cloyd, Ashish Manne, Kenneth L. Pitter, Dayssy A. Diaz, Jose G. Bazan, and Eric D. Miller. 2023. "Treatment Patterns and Outcomes for Patients with Ampullary Carcinoma Who Do Not Undergo Surgery" Cancers 15, no. 14: 3727. https://doi.org/10.3390/cancers15143727
APA StyleFacer, B. D., Cloyd, J. M., Manne, A., Pitter, K. L., Diaz, D. A., Bazan, J. G., & Miller, E. D. (2023). Treatment Patterns and Outcomes for Patients with Ampullary Carcinoma Who Do Not Undergo Surgery. Cancers, 15(14), 3727. https://doi.org/10.3390/cancers15143727


