Simple Summary
This study found that high levels of STMN1 expression in neuroblastoma indicate malignant potential, proliferation potency, and poor prognosis. STMN1 knockdown inhibited neuroblastoma cell growth regardless of MYCN overexpression. The study suggests that assessing STMN1 expression could be a powerful indicator of prognosis and a promising therapeutic candidate against refractory neuroblastoma.
Abstract
Background. Stathmin 1 (STMN1), a marker for immature neurons and tumors, controls microtubule dynamics by destabilizing tubulin. It plays an essential role in cancer progression and indicates poor prognosis in several cancers. This potential protein has not been clarified in clinical patients with neuroblastoma. Therefore, this study aimed to assess the clinical significance and STMN1 function in neuroblastoma with and without MYCN amplification. Methods. Using immunohistochemical staining, STMN1 expression was examined in 81 neuroblastoma samples. Functional analysis revealed the association among STMN1 suppression, cellular viability, and endogenous or exogenous MYCN expression in neuroblastoma cell lines. Result. High levels of STMN1 expression were associated with malignant potential, proliferation potency, and poor prognosis in neuroblastoma. STMN1 expression was an independent prognostic factor in patients with neuroblastoma. Furthermore, STMN1 knockdown inhibited neuroblastoma cell growth regardless of endogenous and exogenous MYCN overexpression. Conclusion. Our data suggest that assessing STMN1 expression in neuroblastoma could be a powerful indicator of prognosis and that STMN1 might be a promising therapeutic candidate against refractory neuroblastoma with and without MYCN amplification.
1. Introduction
Neuroblastoma (NB) is a common pediatric extracranial solid tumor. In clinical practice, the diagnosis of high-risk NB requires the presence of several factors such as MYCN (proto-oncogene BHLH transcription factor) amplification and copy number variation [1]. However, the prognosis of high-risk NB patients remains poor despite a multidisciplinary approach to treatment [2,3]. On the contrary, certain cases of NB show treatment resistance, although the current system of diagnosis does not identify such cases as high-risk [4,5]. Therefore, research and development of new biomarkers and therapeutic targets are necessary to diagnose tumor aggressiveness correctly and to improve prognoses in patients with refractory NB.
Stathmin 1 (STMN1), also known as oncoprotein 18, is a cytosolic phosphoprotein that controls microtubule dynamics by preventing tubulin polymerization and facilitating microtubule destabilization [6]. STMN1 is a neural differentiation marker [7,8]. It is overexpressed in several human malignancies [9]. High STMN1 expression in tumor tissues correlates with tumor aggressiveness, poor prognosis, and therapeutic resistance in several cancers [10,11,12,13,14,15,16,17]. These findings indicate that STMN1 may be a potential biomarker and therapeutic target in different types of primary tumors, including NB.
STMN1 could be upregulated in some chemo-resistant NB cell lines and could also be related to NB cell migration ability [18,19]. Its suppression by RNA interference (RNAi) caused an inhibitory effect on metastatic potential in a NB xenograft mouse model [20]. Moreover, it has been reported that STMN1 phosphorylation was associated with MYCN amplification in NB [21]. However, the importance of this potential protein as a tumor promotion factor, prognostic biomarker, and therapeutic candidate has not been elucidated in clinical NB with and without MYCN amplification.
This study aimed to evaluate the clinical significance of STMN1 expression in NB by examining the association of tumoral STMN1 expression levels with various clinicopathological parameters, including MYCN status and survival. Functional analysis of STMN1 was also performed in NB cell lines, with and without MYCN overexpression, to determine whether STMN1 targeting is promising for patients with refractory NB.
2. Materials and Methods
2.1. Patients and Samples
Surgical specimens were obtained from 102 NB-suspected patients who underwent surgical biopsy or curative surgery at Gunma University Hospital and Gunma Children’s Medical Center between 1991 and 2020. Eleven patients had received preoperative chemotherapy; hence, they were excluded from further analysis. Among the patients without preoperative chemotherapy, 81 were pathologically diagnosed with NB, 9 with ganglioneuroblastoma, and 1 with ganglioneuroma (Supplementary Figure S1). Among the 81 NB tumor samples, 69 cases were non-MYCN-amplified, and 8 cases were MYCN-amplified. The MYCN status in four cases was not evaluated. In addition, the 81 patients with NB had 18 postoperative complications, including the ileus, renal dysfunction, liver disorder, chylothorax, sepsis, hearing disorder, Horner’s syndrome, herpes zoster, pseudomembranous enteritis, and opsoclonus-myoclonus syndrome. This study was conducted in accordance with the tenets of the Declaration of Helsinki and was approved by the Institutional Review Board for Clinical Research of Gunma University Hospital (Maebashi, Gunma, Japan; approval number: HS2020-069). Patient consent was obtained via the opt-out method.
The SK-N-AS (non-MYCN-amplified) cell line was purchased from the American Type Culture Collection. The NB69 (non-MYCN-amplified) cell line and the LAN-5 (MYCN-amplified) cell line were purchased from RIKEN Cell Bank. These are all human NB cell lines.
SK-N-AS cells were cultured in Dulbecco’s modified eagle medium (Wako, Osaka, Japan) supplemented with 10% fetal bovine serum and 1% penicillin–streptomycin, and NB69 and LAN-5 were used as the Roswell Park Memorial Institute (RPMI-1640) medium (Wako, Osaka, Japan); 10% fetal bovine serum and 1% penicillin–streptomycin were added. Cultured cells were incubated at 37 °C in a humidified atmosphere containing 5% carbon dioxide.
2.2. Immunohistochemistry
Paraffin-embedded specimens, including 81 NB, 9 ganglioneuroblastoma, and 1 ganglioneuroma, were sliced into 3.5 µm thick sections and mounted on glass slides. Then, these sections were incubated at 60 °C for 60 min, followed by deparaffinization with xylene and rehydration. Freshly prepared 0.3% hydrogen peroxide in 100% methanol was used to incubate the specimens for 30 min at room temperature to block endogenous peroxidase activity. After rehydration through a graded series of ethanol treatments, antigens were retrieved using an Immunosaver (Nishin EM, Tokyo, Japan) at 98 °C–100 °C for 45 min. The sections were passively cooled to room temperature and then incubated in a protein block serum-free reagent (DAKO, CA, USA) for 30 min. Then, tumor sections were incubated with a mouse monoclonal STMN1 antibody (1:200; Santa Cruz Biotechnology, CA, USA, sc-48362) in a Dako REAL antibody diluent at 4 °C for 24 h. According to the manufacturer’s instructions, Histofine Simple Stain MAX-PO (Multi) Kit (Nichirei, Tokyo, Japan) was used to visualized primary antibody staining. The sections were stained with 3,3-diaminobenzidine tetrahydrochloride (0.02% in 50 mM ammonium acetate–citrate acid buffer containing 0.005% hydrogen peroxide), lightly counterstained with hematoxylin, and mounted. Negative controls were not treated with the primary antibody. Immunohistochemical slides were evaluated by two experienced pathologists blinded to the clinical data. The staining score for each sample was the average of two pathologists’ evaluations.
2.3. Evaluation of Immunostaining
Immunoreactivity of STMN1 and Ki67 was assessed as follows: The positive cell number of STMN1 and Ki67 was calculated as the percentage of cytoplasmic and nuclear-stained cells for each section based on 500 NB cells and was counted at the site with the maximum amount of positive stain in the slide. The patients with NB were classified as high or low groups based on the receiver operating characteristic (ROC)-derived cut-off value of STMN1 and the number of Ki67-positive cells regarding poor prognosis. Based on the number of the ROC-derived cut-off value of STMN1 and Ki67-positive cells, the tumors were classified as high or low-STMN1-expression groups. Accordingly, a disease prognosis was made. A STMN1-positive cell number of ≥255 was defined as the high-STMN1-expression group, and <255 was defined as the low-STMN1-expression group. In addition, A Ki67-positive cell number of ≥88 was defined as the high-Ki67-expression group, and <88 was defined as the low-Ki67-expression group.
2.4. siRNA Transfection
STMN1-specific siRNA oligos (STMN1 siRNA1: GAAACGAGAGCACGAGAAAtt, STMN1 siRNA2: CGAGACUGAAGCUGACUAAtt) and non-targeting control siRNA oligos (control siRNA) were purchased from Theoria Science (Tokyo, Japan). First, target cell lines were subjected to siRNA using in vitro electroporation. Cells were suspended in serum-free Opti-MEM I (Life Technologies, Tokyo, Japan) at a density of 1 × 10⁷ cells/mL. Then, 1.5 µM siRNA was added to the cell suspension. A total of 200 µM of the cell suspension was transferred to a 2 mm gap cuvette electrode and electroporated with an electroporator (CUY21EDIT II; BEX Co., Tokyo, Japan).
2.5. Establishment of MYCN-Overexpressing NB Cell Lines
Non-MYCN-amplified NB cell lines, including SK-N-AS and NB69, were transduced to overexpress exogenous MYCN. Mock lentiviral vectors and the MYCN overexpression lentiviral vector pLV[Exp]-EGFP:-T2A:Puro-CMV>hMYCN were constructed and packaged by VectorBuilder (Chicago, IL, USA). SK-N-AS and NB69 cells were treated with viral particles in accordance with the manufacturer’s protocol and selected using 4.0 μg/mL of puromycin. Detailed information about the vector can be obtained from https://www.vectorbuilder.jp/ accessed on 14 June 2021, using the ID VB210615-1342kuf.
2.6. Western Blot Analysis
Western blot analysis was performed to confirm the expression of STMN1 (anti-STMN1 mouse monoclonal antibody, 1:1000; Santa Cruz Biotechnology, CA, USA sc-48362) and MYCN (anti-MYCN rabbit polyclonal antibody, 1:1000; Proteintech, 10159-2-AP). In addition, 10 μg of the total protein was loaded per lane, and β-actin expression (anti-β-actin mouse monoclonal antibody, 1:1000; Sigma-Aldrich, St. Louis, MO, USA) was used as a protein-loading control. The blots were detected using the ECL Western Blot Analysis Detection System and an Image Quant LAS 4000 machine (GE Healthcare Life Sciences, Westborough, MA, USA).
2.7. Cell Proliferation Assay
The proliferation of NB cell lines, with and without MYCN overexpression, treated with control or STMN1 siRNA was assessed. Cells were seeded in 96-well plates (SK-N-AS: 5000 cells, NB69: 5000 cells, LAN-5: 20,000 cells per well in 100 μL of medium containing 10% FBS). Cell proliferation was measured at 0, 24, 48, and 72 h after seeding with a Cell Counting Kit-8 (Dojindo Laboratories, Tokyo, Japan). A total of 10 µL of the solution Cell Counting Kit-8 was added to each well and incubated for 2 h at 37 °C. The absorbance of each well was measured with a microplate reader (Thermo, Waltham, MA, USA) at 450 nm.
2.8. Statistical Analysis
Group differences were evaluated using the Wilcoxon or the Chi-square test. ROC curve analyses were used to define the suitable cut-off value of STMN1 and Ki67 immunohistochemical evaluation to predict poor prognosis (overall death). Kaplan–Meier curves were generated for overall survival, and statistical significance was determined using the log-rank test. Univariate and multivariate survival analyses were conducted using the Cox proportional hazard regression model. In vitro data in three or four groups were analyzed using ANOVA. When the results of the ANOVA were significant, Dunnett’s multiple comparison tests were used to assess differences among groups. A p-value of <0.05 was considered statistical significance. All statistical analyses were performed with JMP Pro 14 software (SAS Institute, Cary, NC, USA).
3. Results
3.1. Immunohistochemical Staining of STMN1 in Clinical NB Tissues
In NB tumor sections, STMN1 was expressed in the cytoplasm of neuroblasts and a neuropil-like background (Figure 1) in a relatively uniform pattern. Of the 91 NB-suspected specimens, the ratio of positive STMN1 expression was higher in NB (23.5%, 19/81 cases) than in ganglioneuroma (0%, 0/9 cases), ganglioneuroblastoma (0%, 0/1 case), and surrounding non-tumoral tissues (Figure 1 and Figure S1). Of the 81 NB-diagnosed specimens, 62 (77%) and 19 (23%) were categorized as the low-STMN1-expression (Figure 1C) and high-STMN1-expression groups (Figure 1D), respectively (Table 1).
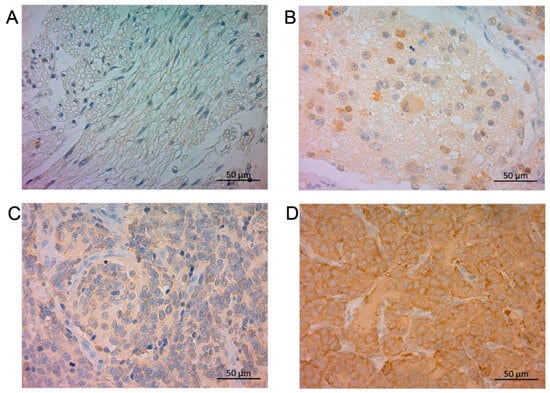
Figure 1.
Immunohistochemical staining of STMN1 protein in ganglioneuroma, ganglioneuroblastoma, and neuroblastoma samples. Representative sections of (A) ganglioneuroma tissue without STMN1 expression, (B) ganglioneuroblastoma tissue with low STMN1 expression, (C) neuroblastoma tissue with low STMN1 expression, and (D) neuroblastoma tissue with high STMN1 expression. Scale bar = 50 μm.

Table 1.
The relationship of clinicopathlogical factors and STMN1 expression in NB patients.
3.2. Association of STMN1 Expression with the Clinicopathological Features of Clinical Neuroblastoma Patients
The relationship between STMN1 and patient clinicopathological characteristics is shown in Table 1. High STMN1 expression was significantly associated with age; radical resection; proliferation marker Ki-67 expression; and the progression of INRGSS, INPC, and INRG risk groups (Table 1, left part). In patients with non-MYCN-amplified NB (n = 69), high STMN1 expression showed similar expression significance (Table 1, middle part). Regarding MYCN-amplified cases (n = 8), the number of cases in our cohort was small; hence, the statistical significance of STMN1 expression could not be demonstrated (Table 1, right part).
3.3. Prognostic Significance of STMN1 Expression in NB Patients with and without MYCN Amplification
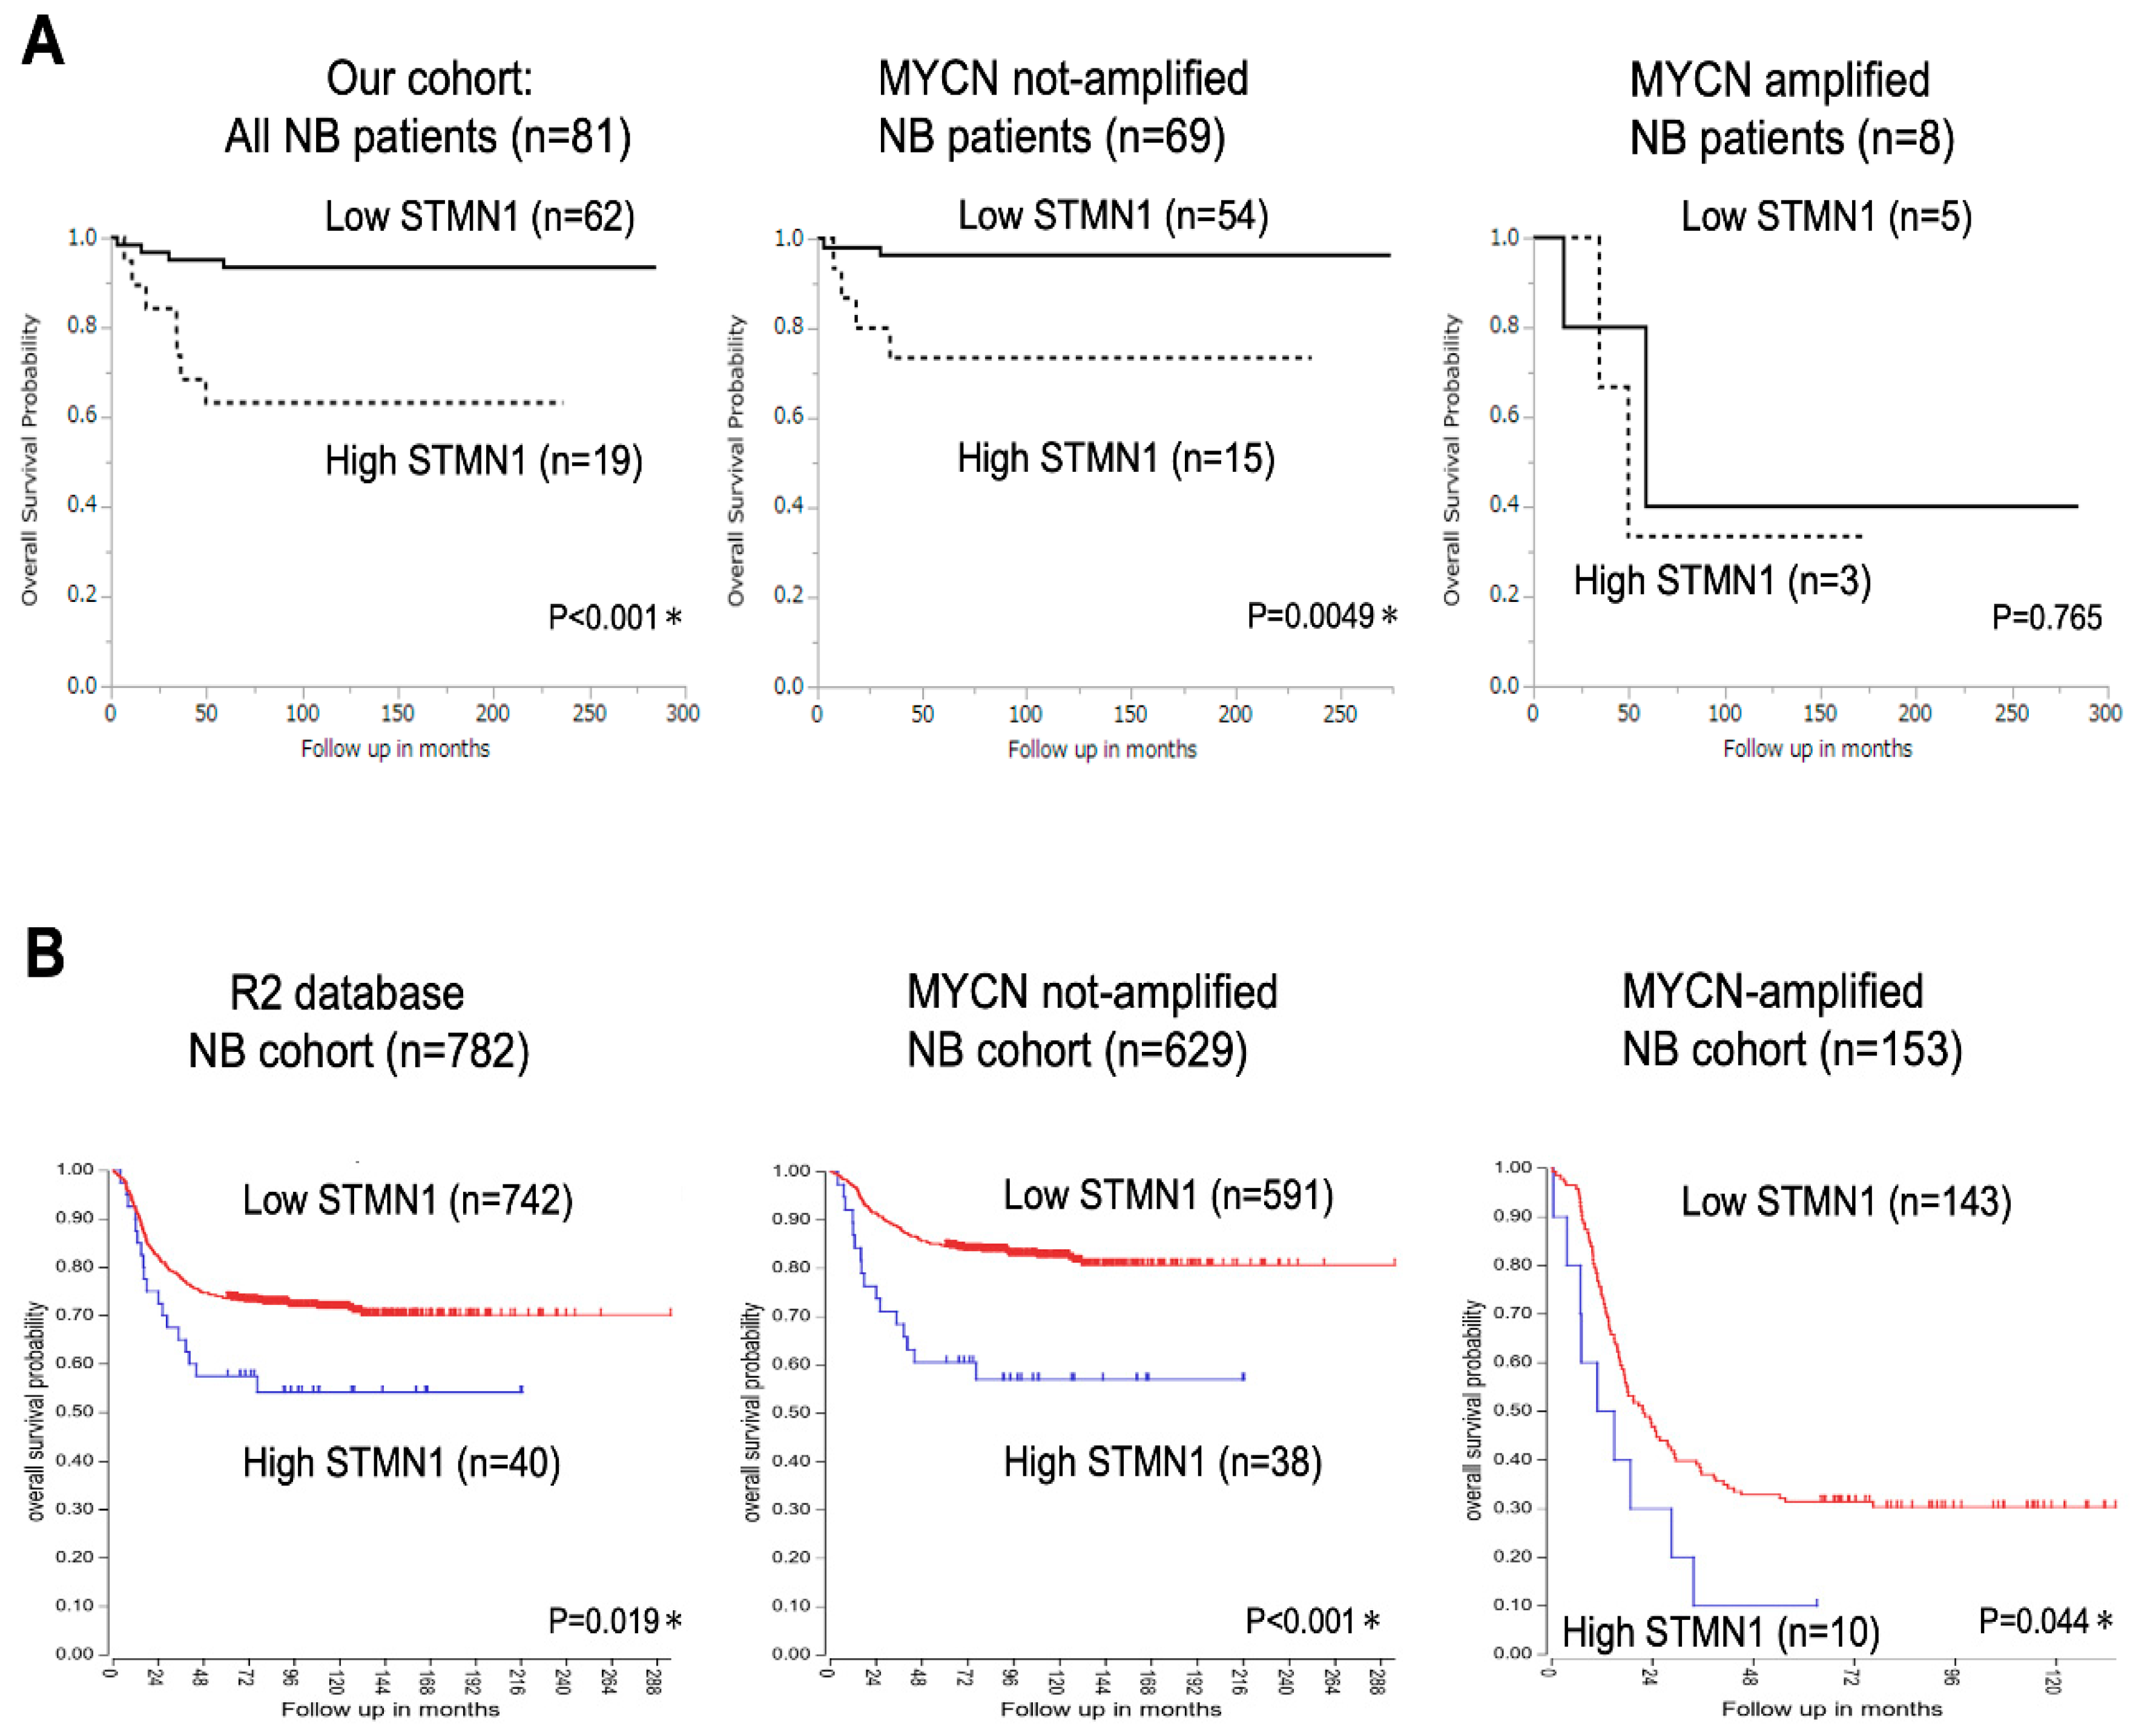
Kaplan–Meier analysis of data from 81 patients with NB revealed significantly lower overall survival in the high-STMN1-expression group than in the low-expression group (p < 0.001, Figure 2A, left panel). Moreover, among the 69 patients with non-MYCN-amplified NB, the high-STMN1-expression group had poor prognosis compared with the low-expression group (p = 0.0049, Figure 2A, middle panel). In contrast to overall NB cases and non-MYCN-amplified ones, fewer MYCN-amplified NB cases (n = 8; p = 0.765, Figure 2A, right panel) hindered the drawing of any statistically significant conclusion about the prognostic value of STMN1 expression.
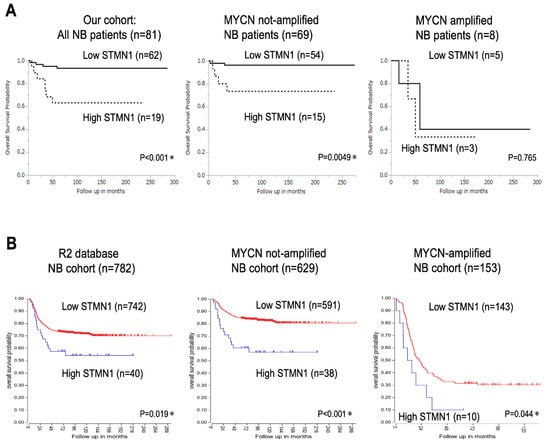
Figure 2.
Kaplan–Meier survival curves of patients with neuroblastoma (NB) based on STMN1 expression. (A) Kaplan–Meier survival analysis based on SMNT1 expression, overall survival in our cohort of all NB patients (n = 81, p < 0.001, left panel), non-MYCN-amplified (n = 69, p = 0.0049, middle panel), and MYCN-amplified (n = 8, p = 0.765, right panel) NB cases. MYCN status in four cases was not evaluated. * p < 0.05. (B) Kaplan–Meier survival analysis based on SMNT1 expression in the R2 database of all NB (n = 782, p = 0.019, left panel), non-MYCN-amplified (n = 629, p < 0.001, middle panel), and MYCN-amplified (n = 153, p = 0.044, right panel) NB patients. We used an online R2 Genomics Analysis and Visualization Platform to verify the relevance of STMN1 mRNA expression to the overall survival of patients with NB: R2 internal identifier, ps_avgpres_dgc2102a786_dgc2102.
In confirming the prognostic significance of STMN1 expression in a larger cohort, the R2 Genomics Analysis and Visualization Platform with the prognostic data of 782 patients with NB was used (R2 internal identifier: ps_avgpres_dgc2102a786_dgc2102). The results show that the high-STMN1-expression group had poorer prognosis than the low-expression group in not only all cases (n = 782, p = 0.019) and non-MYCN-amplified cases (n = 629) (p < 0.001), but also MYCN-amplified cases (n = 153, p = 0.044). By using a large NB cohort from the R2 database, high STMN1 expression in NB, with or without MYCN amplification, provides statistically significant poor prognosis.
Our univariate analysis of 81 NB cases identified a high level of STMN1 expression as a significant prognostic factor associated with poor survival (hazard ratio = 6.439, 95% CI = 1.882–22.03, p = 0.003). Moreover, multivariate analysis identified high STMN1 expression as an independent risk factor for poor overall survival (hazard ratio = 16.95, 95% CI = 1.567–183.4, p = 0.019; Table 2).
Table 2.
Univariate and multivariate analyses of overall survival in 81 NB patients.
3.4. STMN1 Suppression Inhibited Cellular Viability in NB Cell Lines with and without MYCN Amplification
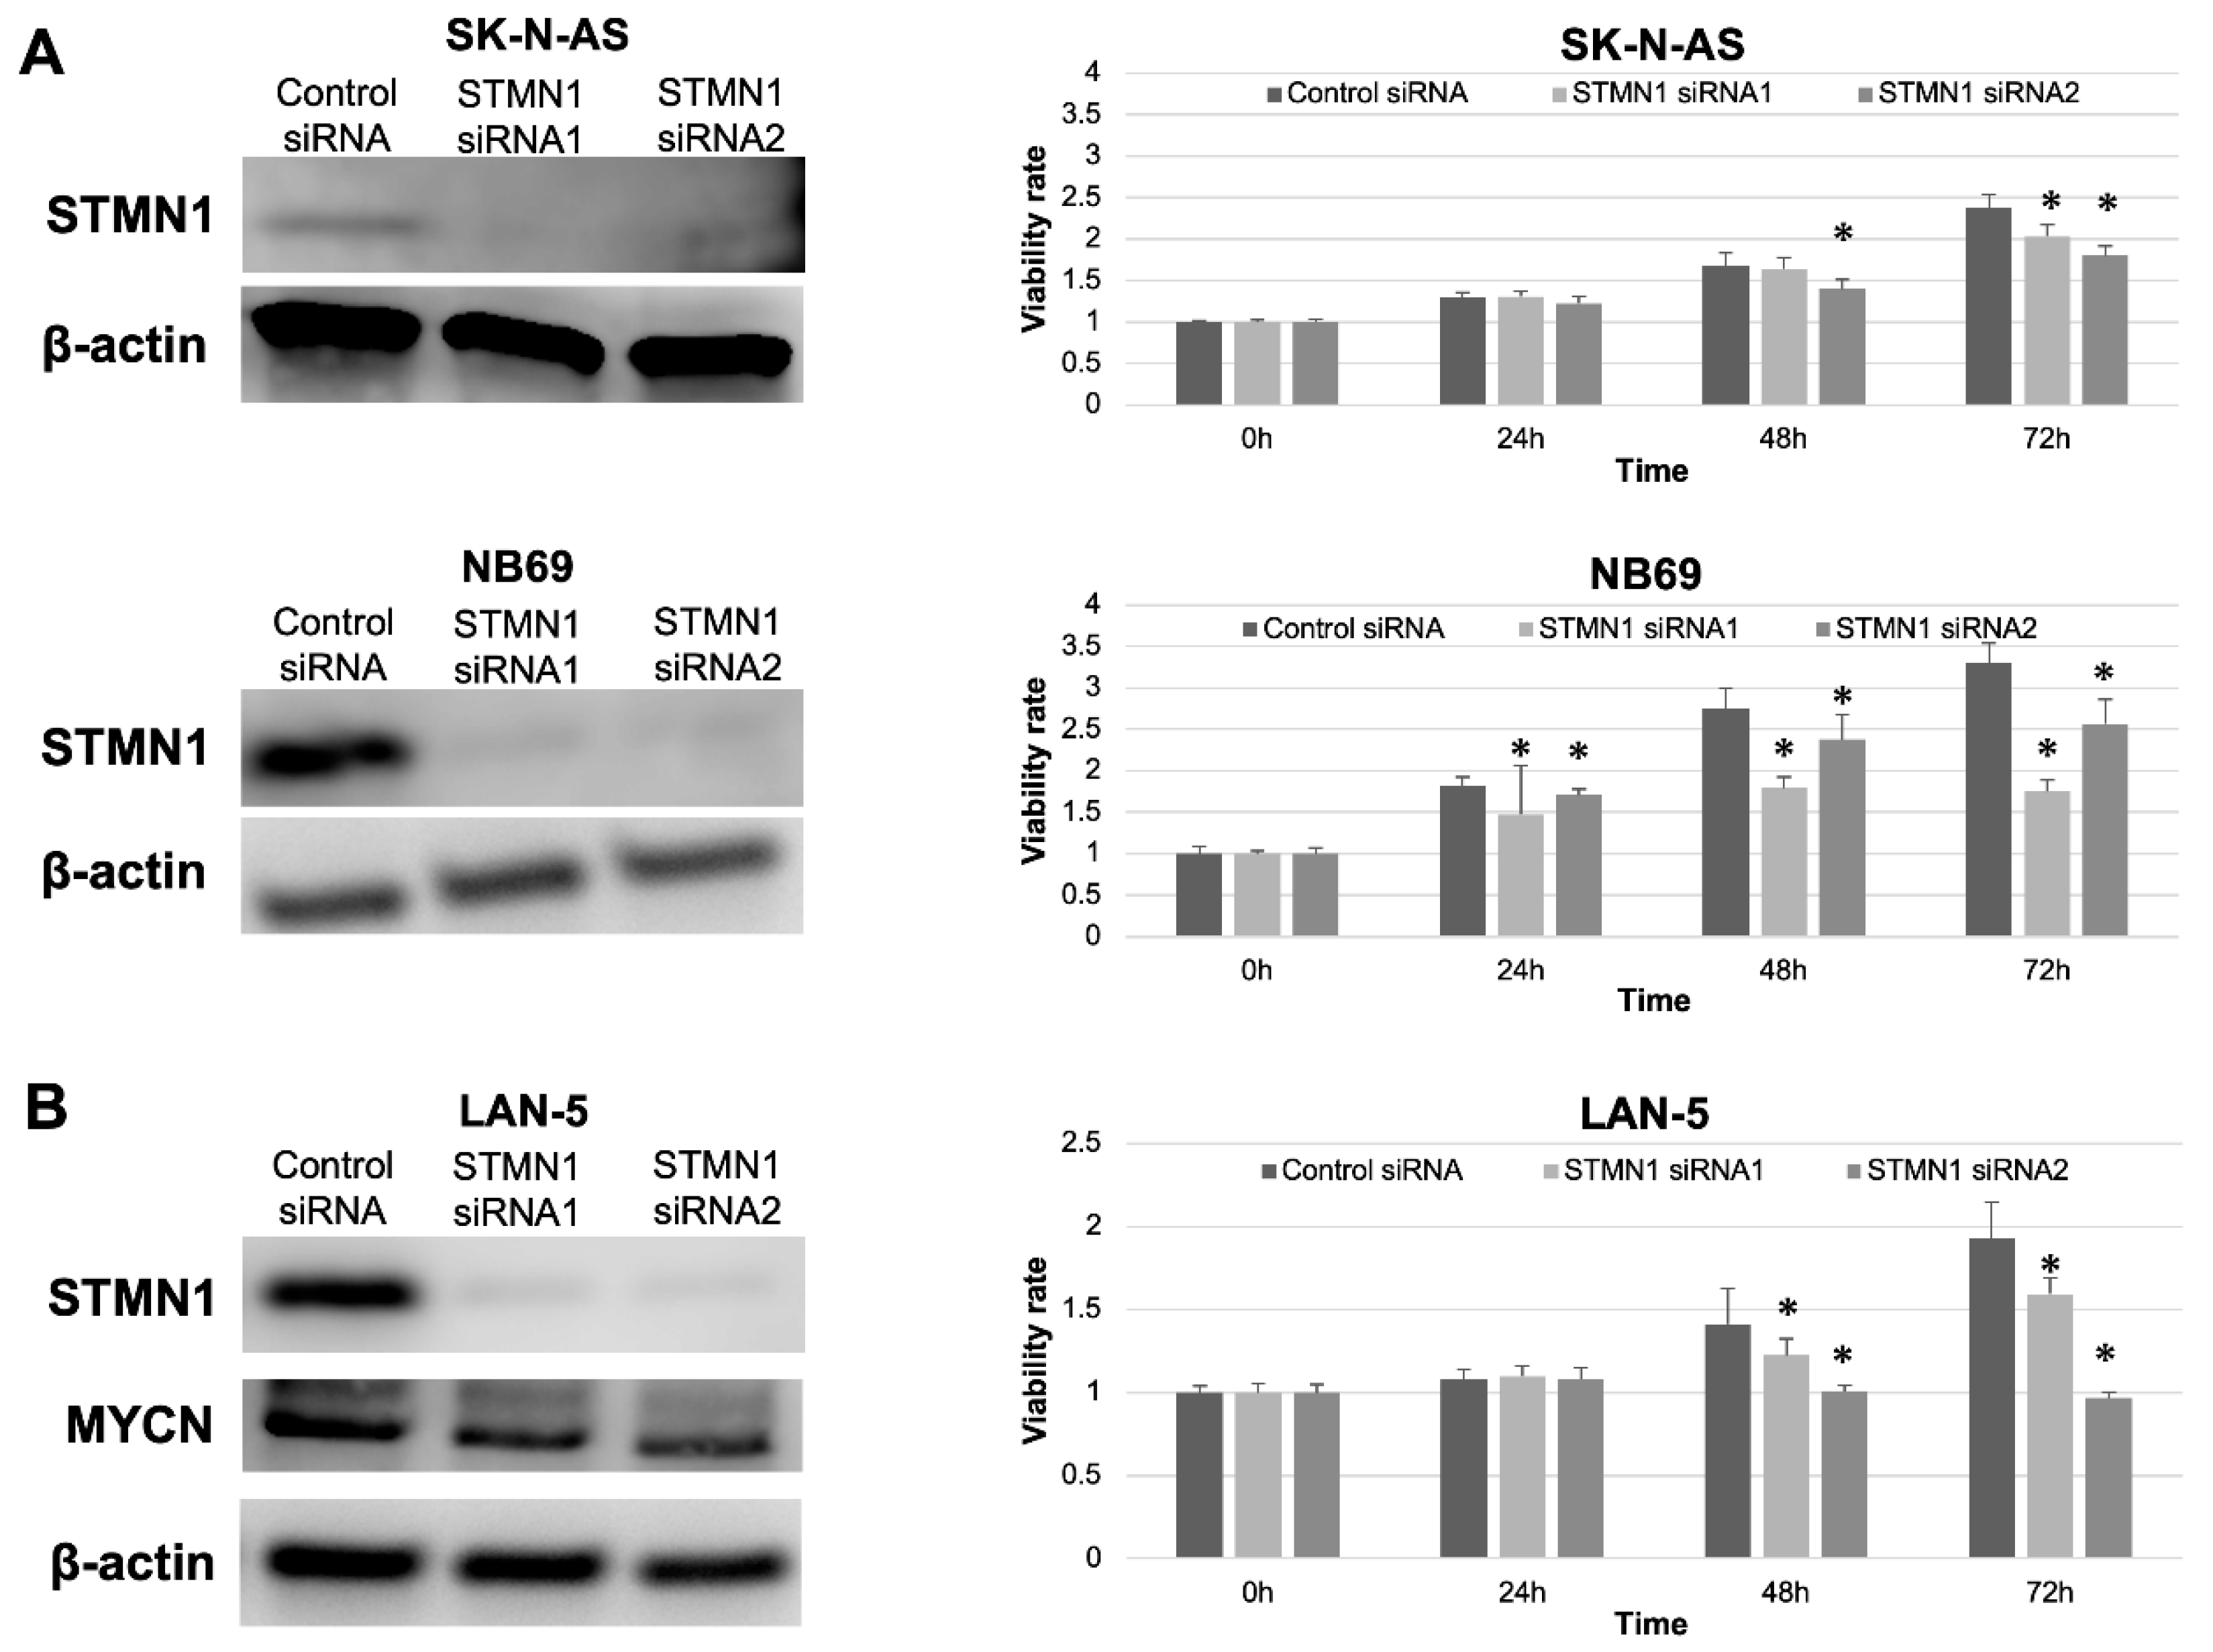
STMN1 suppression by siRNA in non-MYCN-amplified SK-N-AS and NB69 cells was confirmed by Western blotting. The expression level of STMN1 protein was clearly suppressed in STMN1 siRNA groups compared with the control siRNA group (Figure 3A,B, left panel). Furthermore, significant reductions in cellular viability were observed in STMN1-siRNA-treated (suppressed) cells compared with control-siRNA-treated cells (Figure 3A right panel). In confirming the growth inhibition effect by STMN1 suppression against MYCN-amplified cells, cellular viability assay was performed using MYCN-amplified NB cell line LAN-5 cells. The viability in STMN1-siRNA-treated LAN5 cells was significantly suppressed compared with that in control-siRNA-treated cells (Figure 3B, right panel). In addition, STMN1 siRNA treatment against LAN-5 cells suppressed not only the target STMN1 protein but also the endogenous MYCN protein (Figure 3B, left panel), which plays a key role in NB aggressiveness.
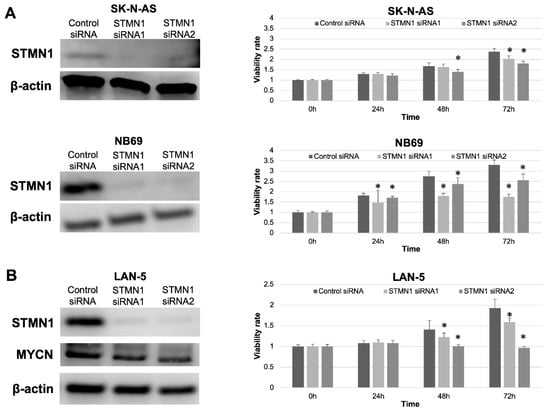
Figure 3.
STMN1 knockdown inhibited cellular viability in non-MYCN-amplified and MYCN-amplified neuroblastoma cell lines. Cell lines were transfected with STMN1-specific siRNAs and control siRNA. β-actin expression was used as gel loading control. Cellular viability was verified using the Cell Counting Kit-8. (A) Left panel: Western blot showing a decrease in STMN1 expression levels in lysates from non-MYCN-amplified SK-N-AS and NB69 neuroblastoma cells. Right panel: cellular viability. (B) Left panel: Western blot showing a decrease in STMN1 and endogenous MYCN expression levels in lysates from MYCN-amplified LAN-5 neuroblastoma cells. Right panel: Cellular viability. The control siRNA group was defined as the control for Dunnett’s multiple comparison tests. * p < 0.05. All WB images are included in File S1.
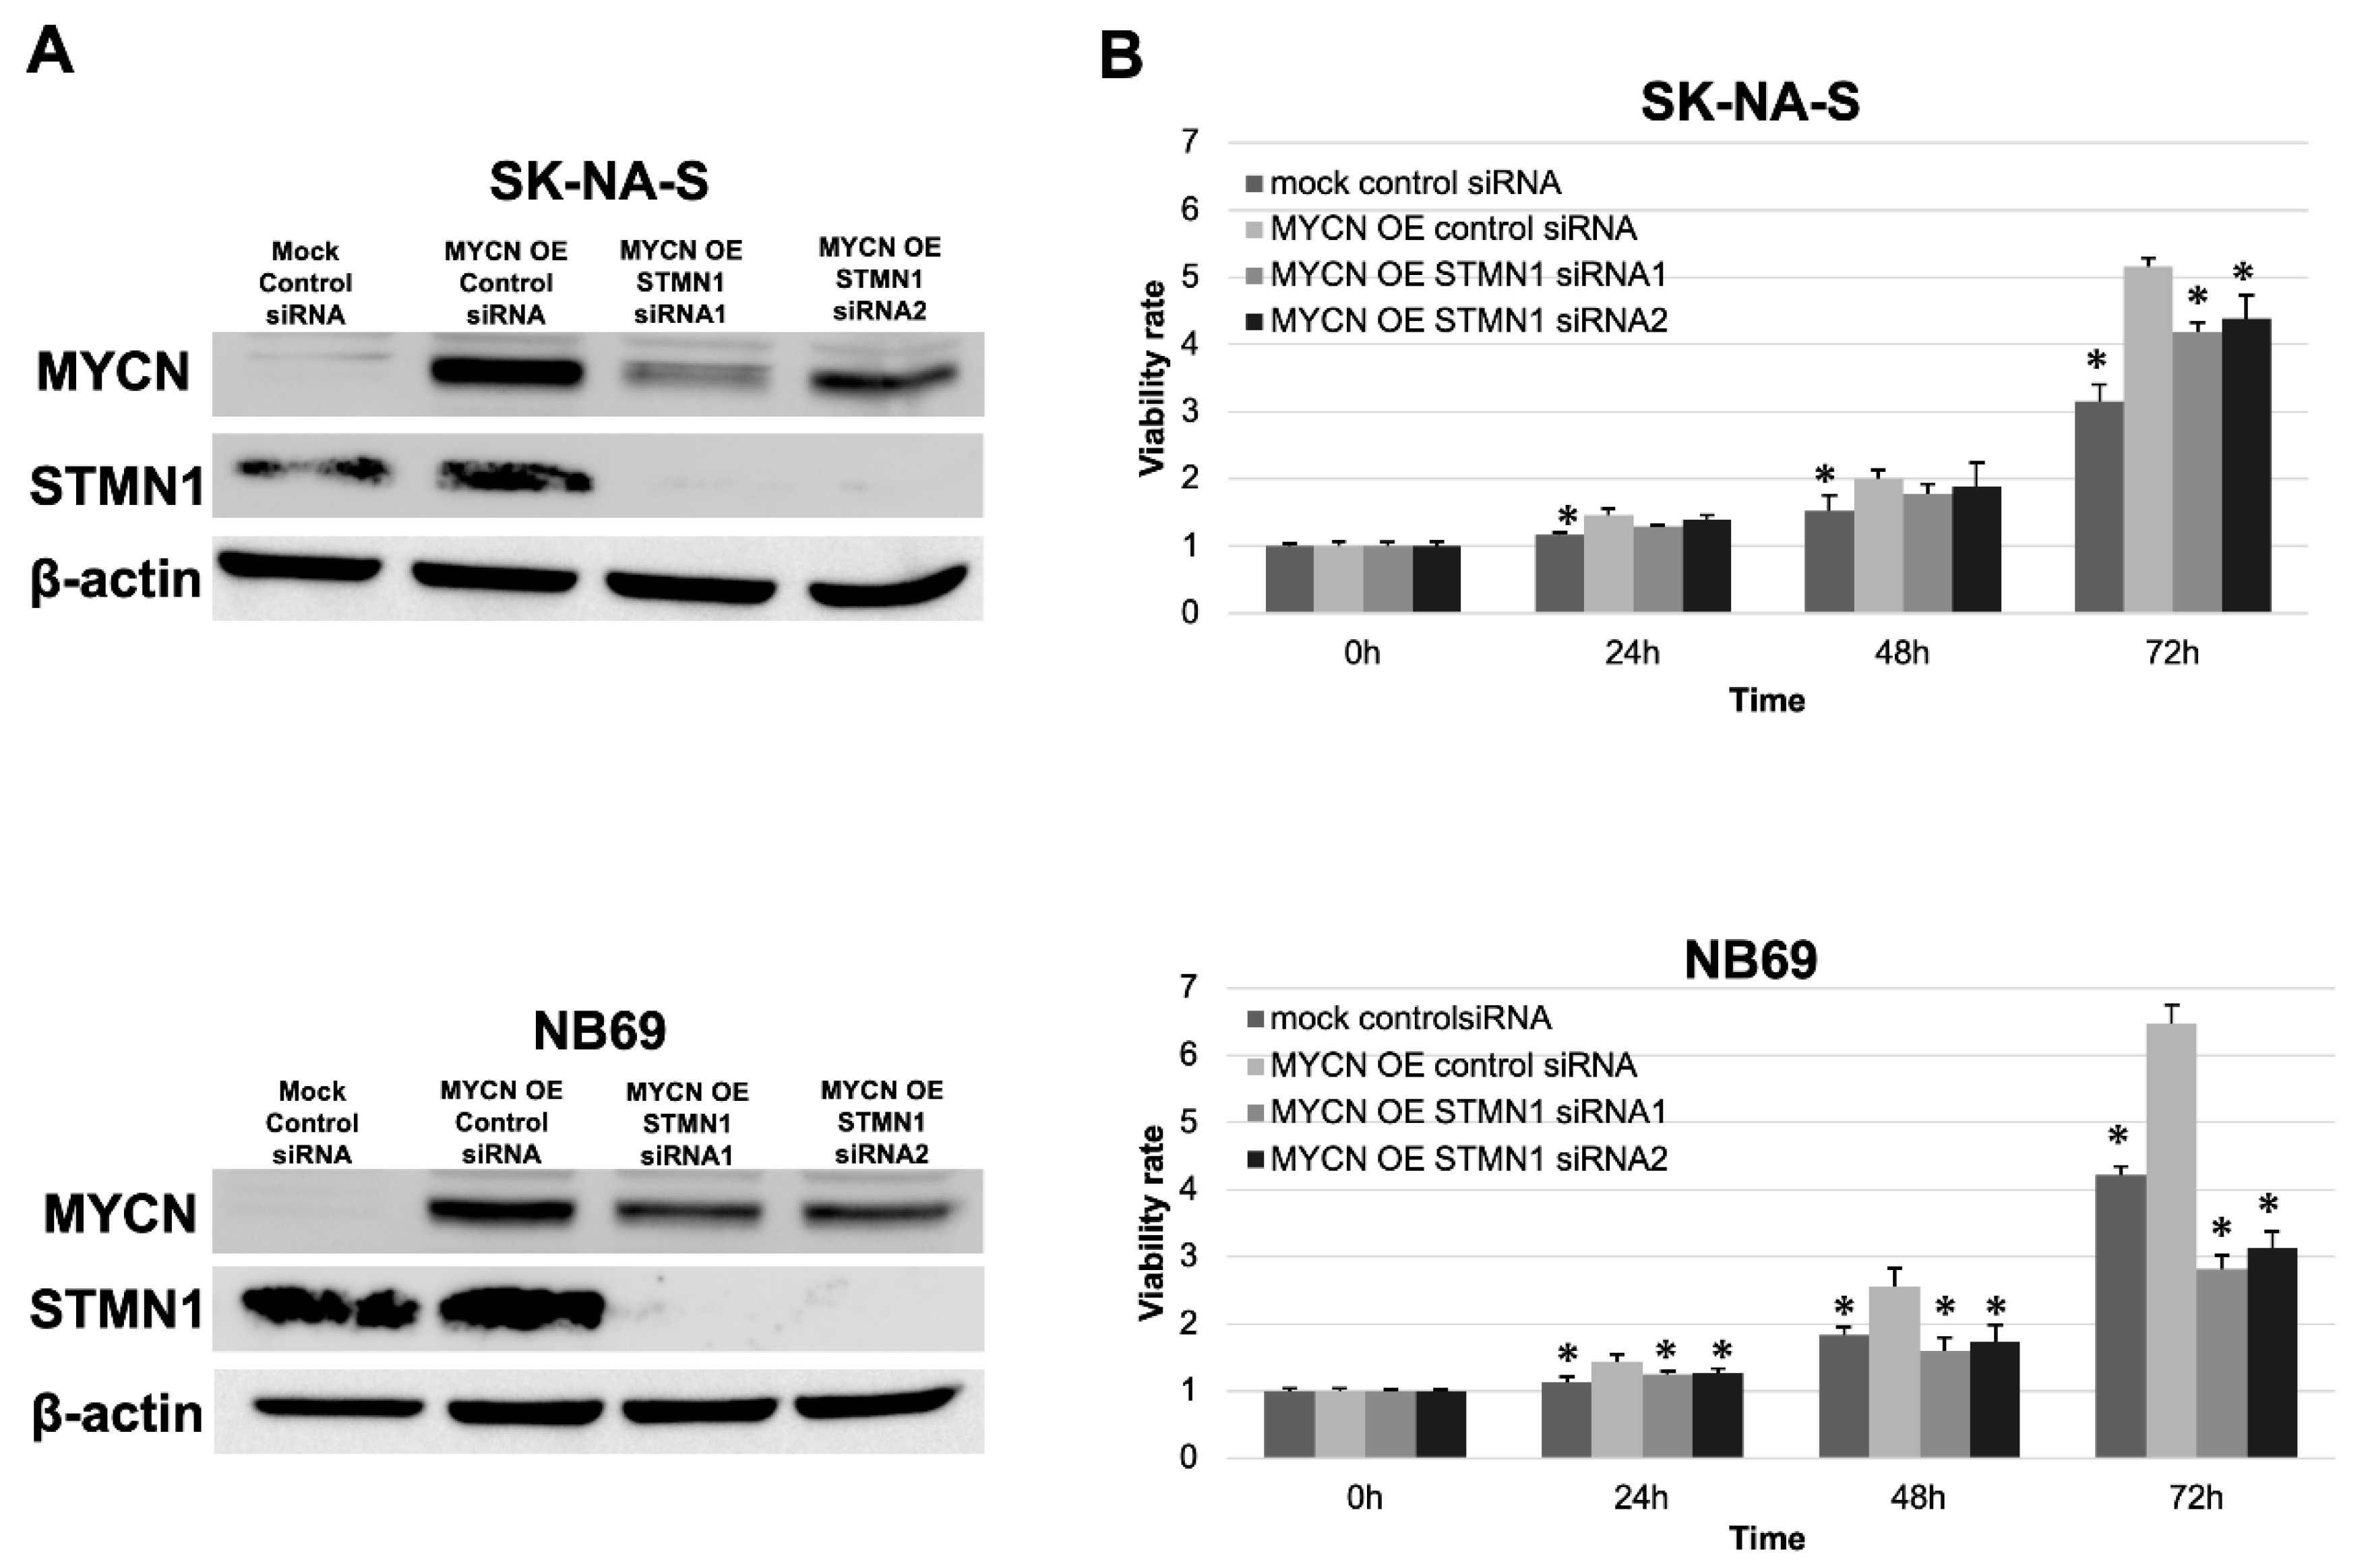
In validating the interesting relationship between STMN1 suppression and endogenous MYCN downregulation, exogenous MYCN (MYCN OE) was overexpressed in non-MYCN-amplified cell lines SK-N-AS and NB69. Consistent with the MYCN reduction in STMN1-suppressed LAN-5 cells, the expression level of exogenous MYCN was lower in MYCN OE STMN1 siRNA-treated cells compared with MYCN OE control siRNA-treated cells (Figure 4A).

Figure 4.
STMN1 suppression inhibited the MYCN expression and MYCN-induced proliferation in neuroblastoma cell lines overexpressing exogenous MYCN. Non-MYCN-amplified SK-N-AS and NB69 neuroblastoma cell lines were transduced for overexpressing exogenous MYCN (MYCN OE). (A) Western blot showing a decrease in STMN1 and exogenous MYCN expression levels in lysates from cells transduced with STMN1-specific siRNAs compared with the negative control siRNA transfectants. β-actin expression was used as gel loading control. These experiments were performed in triplicate. (B) MYCN-induced proliferation in cells with MYCN OE or MYCN OE + STMN1 siRNAs. Cell viability in control siRNA, MYCN OE, and MYCN OE + STMN1 siRNA groups was verified using the Cell Counting Kit-8. The MYCN OE control siRNA group was defined as the control for Dunnett’s multiple comparison tests. * p < 0.05. These experiments were performed in triplicate. All WB images are included in File S1.
These experiments were performed in triplicate.
Moreover, the STMN1 siRNA treatment of MYCN OE cells could counteract MYCN OE-induced proliferation to a certain extent (Figure 4B).
4. Discussion
In this study, high levels of STMN1 expression were associated with tumor aggressiveness and poor prognosis in NB, and STMN1 expression was an independent prognostic factor in patients with NB. These results are consistent with those of previous studies of several other types of cancer [10]. Furthermore, STMN1 suppression can inhibit NB cell growth regardless of endogenous and exogenous MYCN overexpression.
The neuronal marker STMN1, or Oncoprotein18, is overexpressed in a wide variety of various tumor cells and nerve cancers. Many STMN1-inducible upstream factors, such as E2F [22], mutant p53 [23,24], PTEN loss [25], NF-κB [26], Sonic hedgehog signal [27], PPP1R14B [28], and diverse microRNAs [24,29,30,31,32], have been reported to promote aggressiveness in several cancers. STMN1 expression was upregulated in vincristine-resistant NB cells [18]. On the contrary, STMN1 expression levels are low in NB with Chromosome 1p36 (STMN1 locus) loss of heterozygosity (LOH), suggesting the existence of a regulatory mechanism of STMN1 expression in NB through genomic alterations [33]. In addition, the 1p36 LOH has been identified as an important locus alteration that is frequently observed in aggressive NB with MYCN amplification [34,35]. Previous studies show that aggressive NB has low STMN1 expression in 1p36 LOH cases with MYCN amplification, whereas our study shows high STMN1 expression as an independent poor prognostic factor. Therefore, STMN1 expression in MYCN-amplified and non-MYCN-amplified cases was compared using the R2 public database. As a result, STMN1 expression associated with poor prognosis was significantly lower in MYCN-amplified cases than in non-amplified cases (Supplementary Figure S2). The data shown in Figure 2B indicate that the MYCN-amplified STMN1-expressing cases had a significantly poor prognosis. In using the neuronal marker STMN1 as a tumor marker for NB, the possibility of different regulatory mechanisms of STMN1 expression and appropriate cut-off values between low-risk NB and high-risk NB with 1p36 LOH and MYCN amplification should also be considered for risk classification.
Our in vitro data showed that STMN1 suppression downregulated endogenous and exogenous MYCN expression in NB cell lines. MYCN is an important factor that is strongly associated with malignant potential and poor prognosis in patients with NB. The development of methods and tools to regulate MYCN has been the focus of many researchers. To our knowledge, this report is the first to show MYCN expression regulation by STMN1. Our work shows that suppressing STMN1 lowers MYCN levels, indicating that STMN1 may be a novel upstream regulator of MYCN. Many investigators have examined therapeutic strategies to suppress STMN1, with some reporting that STMN1 function is activated by AKT, which can be an activation marker for the PI3K/AKT signaling pathway [25,36,37]. STMN1 silencing suppresses AKT activation in cancer cells [38,39]. In addition, highly aggressive neuroendocrine prostate cancer overexpresses MYCN, and AKT inhibition against such tumors could destabilize the MYCN protein [40]. We hypothesize that microtubule dynamics dysfunction is the main mechanism of the anti-tumor effect of STMN1 silencing. Moreover, the downregulation of the AKT/MYCN axis via STMN1-targeted therapeutic strategies can be a novel approach against refractory NB with MYCN amplification.
Database analysis indicated the significant prognostic value of STMN1 expression in NB with MYCN amplification (Figure 2B). Our in vitro data also showed that STMN1 suppression inhibited cellular viability in NB cells with endogenous and exogenous MYCN overexpression. These data strongly indicate the importance of STMN1 in refractory NB with and without MYCN amplification. We hypothesize that cell cycle dysregulation based on microtubule dynamics dysfunction is the main mechanism of the anti-tumor effect of STMN1 silencing. Moreover, the downregulation of the AKT/MYCN axis via STMN1-targeted therapeutic strategies can be a novel approach against refractory NB with MYCN amplification. Our study is the first report showing that assessing STMN1 protein expression by immunohistochemistry, frequently performed in clinical practice, may predict the clinical prognosis of patients with NB.
We think that immunostaining-based evaluation focusing only on neuroblasts can be used for STMN1-based prognosis for NB.
However, the sample size of MYCN-amplified cases in our cohort was insufficient to validate the potential of STMN1 protein assessment as a prognostic marker. Thus, further studies must be conducted to determine whether STMN1 protein expression assessment by immunohistological studies can also predict prognosis in NB with and without MYCN amplification.
This study had also some limitations. First, this study was retrospective in nature, and only operated patients without preoperative treatments were enrolled to know the significance of STMN1 baseline expression in NB. Second, the number of patients with resected samples was small in this study because NB is a rare type of malignant tumor, which may have introduced a bias in our results. Finally, functional analysis of STMN1 was not performed using RNAi in tumor-bearing mouse models because animal experiments have reported that STMN1 suppression by RNAi inhibited the metastatic potential in an orthotopic NB mouse model [19]. In developing effective STMN1 inhibition-based therapy for treating high-grade NB with MYCN amplification, the efficacy of STMN1 inhibitors and related tools should be investigated in cell and animal experiments.
5. Conclusions
In this study, high levels of STMN1 expression were shown to be a powerful marker of poor prognosis in patients with NB. STMN1 suppression could reduce the cellular viability and MYCN expression in NB cells. In developing new therapeutic tools, STMN1 might be a potential candidate for treating refractory NB with and without MYCN amplification.
Supplementary Materials
The following supporting information can be downloaded at:https://www.mdpi.com/article/10.3390/cancers15184482/s1, Figure S1: Eligible criteria of this study and STMN1 positive rate in patients with neuroblastoma, ganglioneuroblastoma, and ganglioneuroma. Figure S2: Expression of STMN1 mRNA in non-MYCN-amplified and amplified neuroblastoma tissues. File S1: Original images of Western Blot.
Author Contributions
Conceived and designed study: K.O., T.Y., A.N., H.S. and K.S. Performed experiments: K.O., S.N., T.S., J.H., B.E.-O., H.O., G.D., M.S. and S.O. Analyzed data: K.O., T.Y., S.N., T.S., J.H., B.E.-O., M.S. and S.O. Wrote manuscript: K.O., T.Y., K.S. and K.S. All authors have read and agreed to the published version of the manuscript.
Funding
The work was supported by grants-in-Aid for Scientific Research from the Japan Society for the Promotion of Science (JSPS; grant numbers: 21K08749, 22H02912, 22K08766, and 22K08792). The work was also supported in part by the GIAR Linkage Grant 2022 and a Research Grant of the Princess Takamatsu Cancer Research Fund.
Institutional Review Board Statement
This study complied with the Declaration of Helsinki and was approved by the Institutional Review Board for Clinical Research of Gunma University Hospital (Maebashi, Gunma, Japan; approval number: HS2020-069).
Informed Consent Statement
Patient consent was obtained by the opt-out method.
Data Availability Statement
All data generated or analyzed in this study are included in this publication and its Supplementary Materials data.
Acknowledgments
We thank Mariko Nakamura, Yukiko Suto, Harumi Kanai, Kao Abe, Kyoko Miyoshi, Chiho Noguchi, Saori Suto, and Sayaka Okada for their assistance with this study.
Conflicts of Interest
The authors declare no conflict of interest.
References
- Nakagawara, A.; Li, Y.; Izumi, H.; Muramori, K.; Inada, H.; Nishi, M. Neuroblastoma. Jpn. J. Clin. Oncol. 2018, 48, 214–241. [Google Scholar] [CrossRef] [PubMed]
- Chung, C.; Boterberg, T.; Lucas, J.; Panoff, J.; Valteau-Couanet, D.; Hero, B.; Bagatell, R.; Hill-Kayser, C.E. Neuroblastoma. Pediatr. Blood Cancer 2021, 68 (Suppl. S2), e28473. [Google Scholar] [CrossRef] [PubMed]
- Chan, G.C.; Chan, C.M. Anti-GD2 Directed Immunotherapy for High-Risk and Metastatic Neuroblastoma. Biomolecules 2022, 12, 358. [Google Scholar] [CrossRef] [PubMed]
- Newman, E.A.; Abdessalam, S.; Aldrink, J.H.; Austin, M.; Heaton, T.E.; Bruny, J.; Ehrlich, P.; Dasgupta, R.; Baertschiger, R.M.; Lautz, T.B.; et al. Update on neuroblastoma. J. Pediatr. Surg. 2019, 54, 383–389. [Google Scholar] [CrossRef]
- Cohn, S.L.; Pearson, A.D.; London, W.B.; Monclair, T.; Ambros, P.F.; Brodeur, G.M.; Faldum, A.; Hero, B.; Iehara, T.; Machin, D.; et al. The International Neuroblastoma Risk Group (INRG) classification system: An INRG Task Force report. J. Clin. Oncol. 2009, 27, 289–297. [Google Scholar] [CrossRef]
- Andersen, S.S. Balanced regulation of microtubule dynamics during the cell cycle: A contemporary view. Bioessays 1999, 21, 53–60. [Google Scholar] [CrossRef]
- Wang, W.; Wang, M.; Yang, M.; Zeng, B.; Qiu, W.; Ma, Q.; Jing, X.; Zhang, Q.; Wang, B.; Yin, C.; et al. Transcriptome dynamics of hippocampal neurogenesis in macaques across the lifespan and aged humans. Cell Res. 2022, 32, 729–743. [Google Scholar] [CrossRef]
- Takekoshi, K.; Nomura, F.; Isobe, K.; Motooka, M.; Nammoku, T.; Nakai, T. Identification and initial characterization of stathmin by the differential display method in nerve growth factor-treated PC12 cells. Eur. J. Endocrinol. 1998, 138, 707–712. [Google Scholar] [CrossRef]
- Rana, S.; Maples, P.B.; Senzer, N.; Nemunaitis, J. Stathmin 1: A novel therapeutic target for anticancer activity. Expert Rev. Anticancer Ther. 2008, 8, 1461–1470. [Google Scholar] [CrossRef]
- Zhang, D.; Dai, L.; Yang, Z.; Wang, X.; LanNing, Y. Association of STMN1 with survival in solid tumors: A systematic review and meta-analysis. Int. J. Biol. Markers 2019, 34, 108–116. [Google Scholar] [CrossRef]
- Suzuki, S.; Yokobori, T.; Altan, B.; Hara, K.; Ozawa, D.; Tanaka, N.; Sakai, M.; Sano, A.; Sohda, M.; Bao, H.; et al. High stathmin 1 expression is associated with poor prognosis and chemoradiation resistance in esophageal squamous cell carcinoma. Int. J. Oncol. 2017, 50, 1184–1190. [Google Scholar] [CrossRef] [PubMed]
- Bai, T.; Yokobori, T.; Altan, B.; Ide, M.; Mochiki, E.; Yanai, M.; Kimura, A.; Kogure, N.; Yanoma, T.; Suzuki, M.; et al. High STMN1 level is associated with chemo-resistance and poor prognosis in gastric cancer patients. Br. J. Cancer 2017, 116, 1177–1185. [Google Scholar] [CrossRef]
- Suzuki, K.; Watanabe, A.; Araki, K.; Yokobori, T.; Harimoto, N.; Gantumur, D.; Hagiwara, K.; Yamanaka, T.; Ishii, N.; Tsukagoshi, M.; et al. High STMN1 Expression Is Associated with Tumor Differentiation and Metastasis in Clinical Patients with Pancreatic Cancer. Anticancer Res. 2018, 38, 939–944. [Google Scholar] [CrossRef]
- Watanabe, A.; Suzuki, H.; Yokobori, T.; Tsukagoshi, M.; Altan, B.; Kubo, N.; Suzuki, S.; Araki, K.; Wada, S.; Kashiwabara, K.; et al. Stathmin1 regulates p27 expression, proliferation and drug resistance, resulting in poor clinical prognosis in cholangiocarcinoma. Cancer Sci. 2014, 105, 690–696. [Google Scholar] [CrossRef] [PubMed]
- Obayashi, S.; Horiguchi, J.; Higuchi, T.; Katayama, A.; Handa, T.; Altan, B.; Bai, T.; Bao, P.; Bao, H.; Yokobori, T.; et al. Stathmin1 expression is associated with aggressive phenotypes and cancer stem cell marker expression in breast cancer patients. Int. J. Oncol. 2017, 51, 781–790. [Google Scholar] [CrossRef]
- Bao, P.; Yokobori, T.; Altan, B.; Iijima, M.; Azuma, Y.; Onozato, R.; Yajima, T.; Watanabe, A.; Mogi, A.; Shimizu, K.; et al. High STMN1 Expression is Associated with Cancer Progression and Chemo-Resistance in Lung Squamous Cell Carcinoma. Ann. Surg. Oncol. 2017, 24, 4017–4024. [Google Scholar] [CrossRef] [PubMed]
- Shimizu, K.; Ohtaki, Y.; Altan, B.; Yokobori, T.; Nagashima, T.; Arai, M.; Mogi, A.; Kuwano, H. Prognostic impact of stathmin 1 expression in patients with lung adenocarcinoma. J. Thorac. Cardiovasc. Surg. 2017, 154, 1406–1417.e1403. [Google Scholar] [CrossRef]
- Don, S.; Verrills, N.M.; Liaw, T.Y.; Liu, M.L.; Norris, M.D.; Haber, M.; Kavallaris, M. Neuronal-associated microtubule proteins class III beta-tubulin and MAP2c in neuroblastoma: Role in resistance to microtubule-targeted drugs. Mol. Cancer Ther. 2004, 3, 1137–1146. [Google Scholar] [CrossRef]
- Po’uha, S.T.; Le Grand, M.; Brandl, M.B.; Gifford, A.J.; Goodall, G.J.; Khew-Goodall, Y.; Kavallaris, M. Stathmin levels alter PTPN14 expression and impact neuroblastoma cell migration. Br. J. Cancer 2020, 122, 434–444. [Google Scholar] [CrossRef]
- Byrne, F.L.; Yang, L.; Phillips, P.A.; Hansford, L.M.; Fletcher, J.I.; Ormandy, C.J.; McCarroll, J.A.; Kavallaris, M. RNAi-mediated stathmin suppression reduces lung metastasis in an orthotopic neuroblastoma mouse model. Oncogene 2014, 33, 882–890. [Google Scholar] [CrossRef]
- Hailat, N.; Strahler, J.; Melhem, R.; Zhu, X.X.; Brodeur, G.; Seeger, R.C.; Reynolds, C.P.; Hanash, S. N-myc gene amplification in neuroblastoma is associated with altered phosphorylation of a proliferation related polypeptide (Op18). Oncogene 1990, 5, 1615–1618. [Google Scholar]
- Hsu, H.P.; Li, C.F.; Lee, S.W.; Wu, W.R.; Chen, T.J.; Chang, K.Y.; Liang, S.S.; Tsai, C.J.; Shiue, Y.L. Overexpression of stathmin 1 confers an independent prognostic indicator in nasopharyngeal carcinoma. Tumour Biol. 2014, 35, 2619–2629. [Google Scholar] [CrossRef] [PubMed]
- San-Marina, S.; Han, Y.; Liu, J.; Minden, M.D. Suspected leukemia oncoproteins CREB1 and LYL1 regulate Op18/STMN1 expression. Biochim. Biophys. Acta 2012, 1819, 1164–1172. [Google Scholar] [CrossRef] [PubMed]
- Masciarelli, S.; Fontemaggi, G.; Di Agostino, S.; Donzelli, S.; Carcarino, E.; Strano, S.; Blandino, G. Gain-of-function mutant p53 downregulates miR-223 contributing to chemoresistance of cultured tumor cells. Oncogene 2014, 33, 1601–1608. [Google Scholar] [CrossRef] [PubMed]
- Xun, G.; Hu, W.; Li, B. PTEN loss promotes oncogenic function of STMN1 via PI3K/AKT pathway in lung cancer. Sci. Rep. 2021, 11, 14318. [Google Scholar] [CrossRef]
- Shi, D.; Zhang, Z.; Kong, C. CARMA3 Transcriptional Regulation of STMN1 by NF-kappaB Promotes Renal Cell Carcinoma Proliferation and Invasion. Technol. Cancer Res. Treat. 2021, 20, 15330338211027915. [Google Scholar] [CrossRef]
- Chung, M.K.; Kim, H.J.; Lee, Y.S.; Han, M.E.; Yoon, S.; Baek, S.Y.; Kim, B.S.; Kim, J.B.; Oh, S.O. Hedgehog signaling regulates proliferation of prostate cancer cells via stathmin1. Clin. Exp. Med. 2010, 10, 51–57. [Google Scholar] [CrossRef]
- Liao, L.; Zhang, Y.L.; Deng, L.; Chen, C.; Ma, X.Y.; Andriani, L.; Yang, S.Y.; Hu, S.Y.; Zhang, F.L.; Shao, Z.M.; et al. Protein Phosphatase 1 Subunit PPP1R14B Stabilizes STMN1 to Promote Progression and Paclitaxel Resistance in Triple-Negative Breast Cancer. Cancer Res. 2023, 83, 471–484. [Google Scholar] [CrossRef]
- Zheng, F.; Liao, Y.J.; Cai, M.Y.; Liu, T.H.; Chen, S.P.; Wu, P.H.; Wu, L.; Bian, X.W.; Guan, X.Y.; Zeng, Y.X.; et al. Systemic delivery of microRNA-101 potently inhibits hepatocellular carcinoma in vivo by repressing multiple targets. PLoS Genet. 2015, 11, e1004873. [Google Scholar] [CrossRef]
- Wang, L.; Zhang, X.; Jia, L.T.; Hu, S.J.; Zhao, J.; Yang, J.D.; Wen, W.H.; Wang, Z.; Wang, T.; Zhao, J.; et al. c-Myc-mediated epigenetic silencing of MicroRNA-101 contributes to dysregulation of multiple pathways in hepatocellular carcinoma. Hepatology 2014, 59, 1850–1863. [Google Scholar] [CrossRef]
- Chen, J.; Abi-Daoud, M.; Wang, A.; Yang, X.; Zhang, X.; Feilotter, H.E.; Tron, V.A. Stathmin 1 is a potential novel oncogene in melanoma. Oncogene 2013, 32, 1330–1337. [Google Scholar] [CrossRef] [PubMed]
- Li, Y.; Liang, Y.; Sang, Y.; Song, X.; Zhang, H.; Liu, Y.; Jiang, L.; Yang, Q. MiR-770 suppresses the chemo-resistance and metastasis of triple negative breast cancer via direct targeting of STMN1. Cell Death Dis. 2018, 9, 14. [Google Scholar] [CrossRef] [PubMed]
- Janoueix-Lerosey, I.; Novikov, E.; Monteiro, M.; Gruel, N.; Schleiermacher, G.; Loriod, B.; Nguyen, C.; Delattre, O. Gene expression profiling of 1p35-36 genes in neuroblastoma. Oncogene 2004, 23, 5912–5922. [Google Scholar] [CrossRef]
- Caron, H.; van Sluis, P.; de Kraker, J.; Bokkerink, J.; Egeler, M.; Laureys, G.; Slater, R.; Westerveld, A.; Voute, P.A.; Versteeg, R. Allelic loss of chromosome 1p as a predictor of unfavorable outcome in patients with neuroblastoma. N. Engl. J. Med. 1996, 334, 225–230. [Google Scholar] [CrossRef] [PubMed]
- Maris, J.M.; Weiss, M.J.; Guo, C.; Gerbing, R.B.; Stram, D.O.; White, P.S.; Hogarty, M.D.; Sulman, E.P.; Thompson, P.M.; Lukens, J.N.; et al. Loss of heterozygosity at 1p36 independently predicts for disease progression but not decreased overall survival probability in neuroblastoma patients: A Children’s Cancer Group study. J. Clin. Oncol. 2000, 18, 1888–1899. [Google Scholar] [CrossRef]
- Jiang, W.; Huang, S.; Song, L.; Wang, Z. STMN1, a prognostic predictor of esophageal squamous cell carcinoma, is a marker of the activation of the PI3K pathway. Oncol. Rep. 2018, 39, 834–842. [Google Scholar] [CrossRef]
- Allen, M.M.; Douds, J.J.; Liang, S.X.; Desouki, M.M.; Parkash, V.; Fadare, O. An immunohistochemical analysis of stathmin 1 expression in uterine smooth muscle tumors: Differential expression in leiomyosarcomas and leiomyomas. Int. J. Clin. Exp. Pathol. 2015, 8, 2795–2801. [Google Scholar]
- Shu, F.; Zou, X.; Tuo, H.; She, S.; Huang, J.; Ren, H.; Hu, H.; Peng, S.; Wang, J.; Yang, Y. Stathmin gene silencing suppresses proliferation, migration and invasion of gastric cancer cells via AKT/sCLU and STAT3 signaling. Int. J. Oncol. 2019, 54, 1086–1098. [Google Scholar] [CrossRef]
- Yoshie, M.; Miyajima, E.; Kyo, S.; Tamura, K. Stathmin, a microtubule regulatory protein, is associated with hypoxia-inducible factor-1alpha levels in human endometrial and endothelial cells. Endocrinology 2009, 150, 2413–2418. [Google Scholar] [CrossRef]
- Elhasasna, H.; Khan, R.; Bhanumathy, K.K.; Vizeacoumar, F.S.; Walke, P.; Bautista, M.; Dahiya, D.K.; Maranda, V.; Patel, H.; Balagopal, A.; et al. A Drug Repurposing Screen Identifies Fludarabine Phosphate as a Potential Therapeutic Agent for N-MYC Overexpressing Neuroendocrine Prostate Cancers. Cells 2022, 11, 2246. [Google Scholar] [CrossRef]

Disclaimer/Publisher’s Note: The statements, opinions and data contained in all publications are solely those of the individual author(s) and contributor(s) and not of MDPI and/or the editor(s). MDPI and/or the editor(s) disclaim responsibility for any injury to people or property resulting from any ideas, methods, instructions or products referred to in the content. |
© 2023 by the authors. Licensee MDPI, Basel, Switzerland. This article is an open access article distributed under the terms and conditions of the Creative Commons Attribution (CC BY) license (https://creativecommons.org/licenses/by/4.0/).