Could Immune Checkpoint Disorders and EBV Reactivation Be Connected in the Development of Hematological Malignancies in Immunodeficient Patients?
Abstract
Simple Summary
Abstract
1. Introduction
2. Materials and Methods
2.1. Characteristics of Participants and Study Materials
- Ongoing viral, bacterial, and fungal infections;
- Severe allergies;
- History of hematopoietic cell or organ allotransplantation;
- Ongoing treatment for active malignancy or other autoimmune diseases;
- Pregnancy or lactation;
- Use of investigational drugs;
- Presence of tumor metastases in the central nervous system or mental illness.
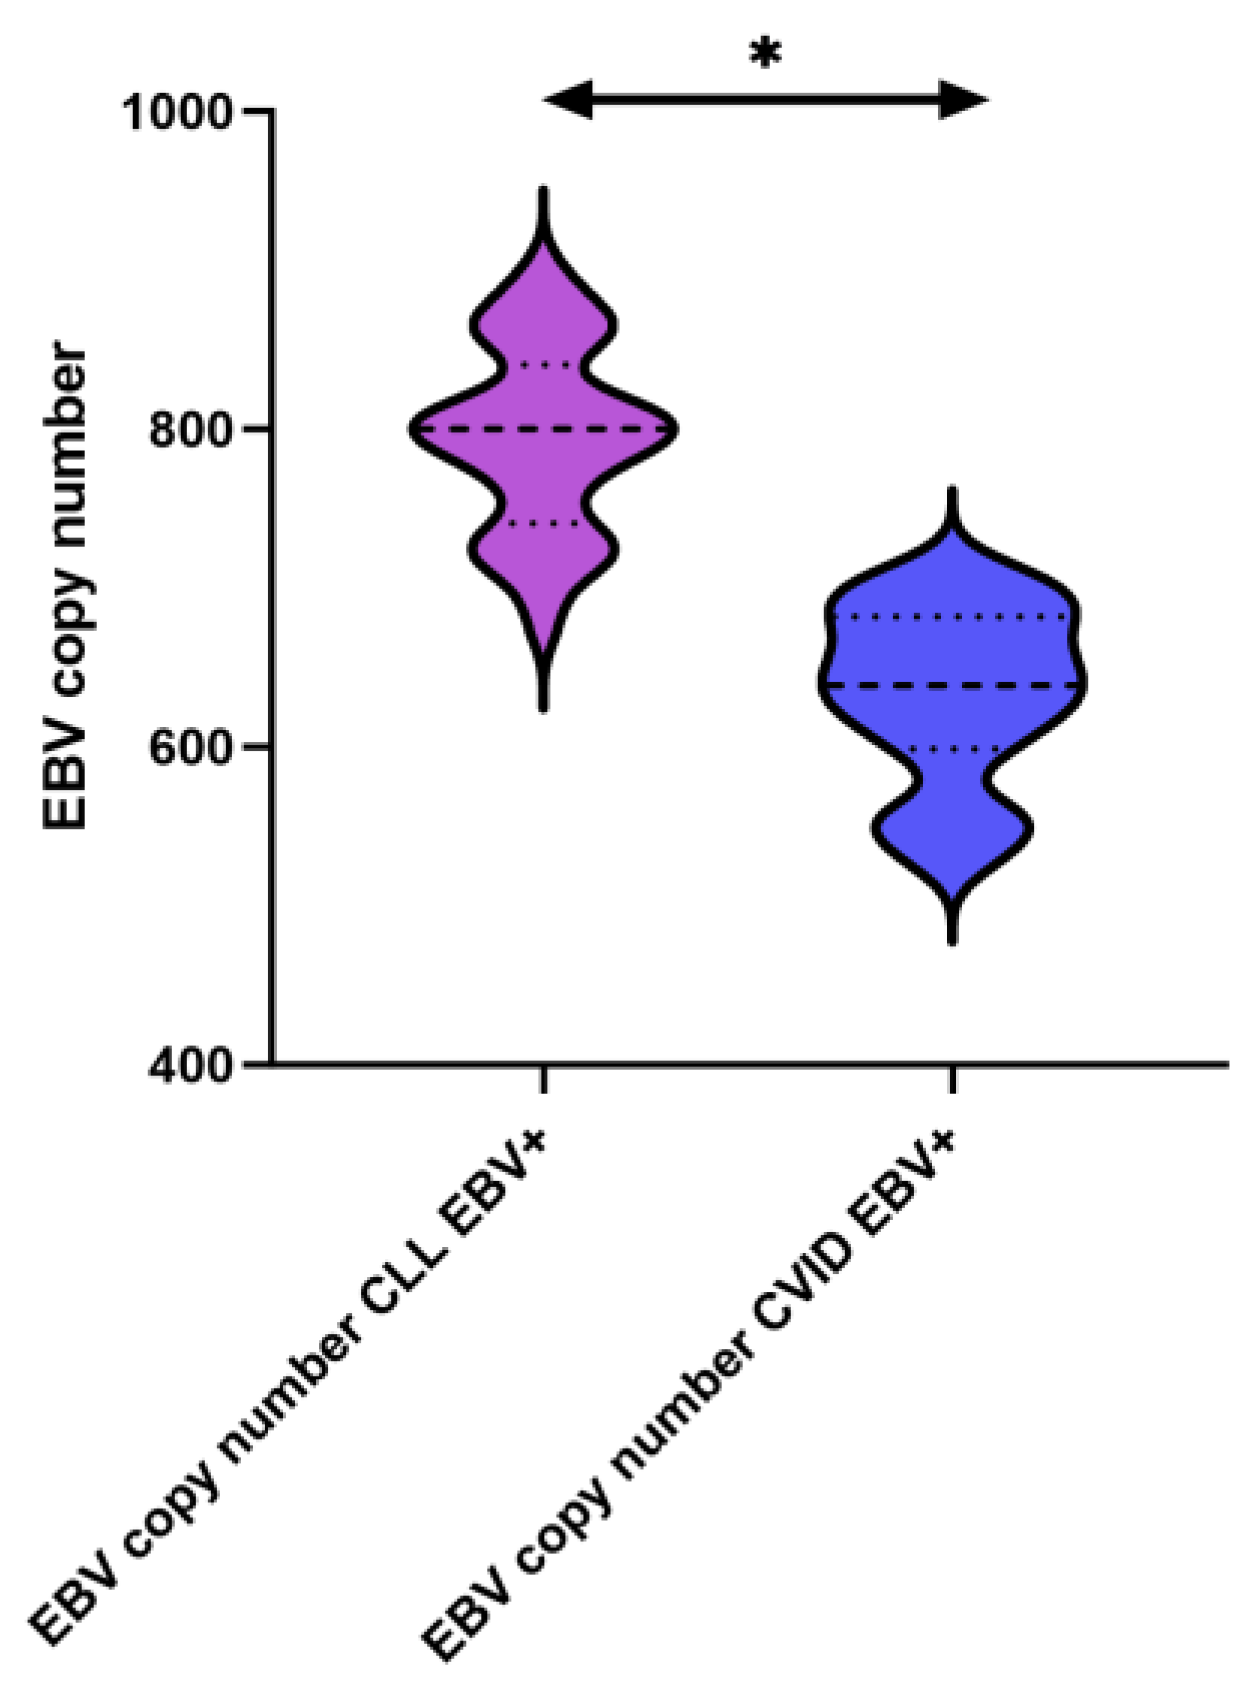
2.2. Quantification of EBV Genomic Copies in PBMC-Derived DNA
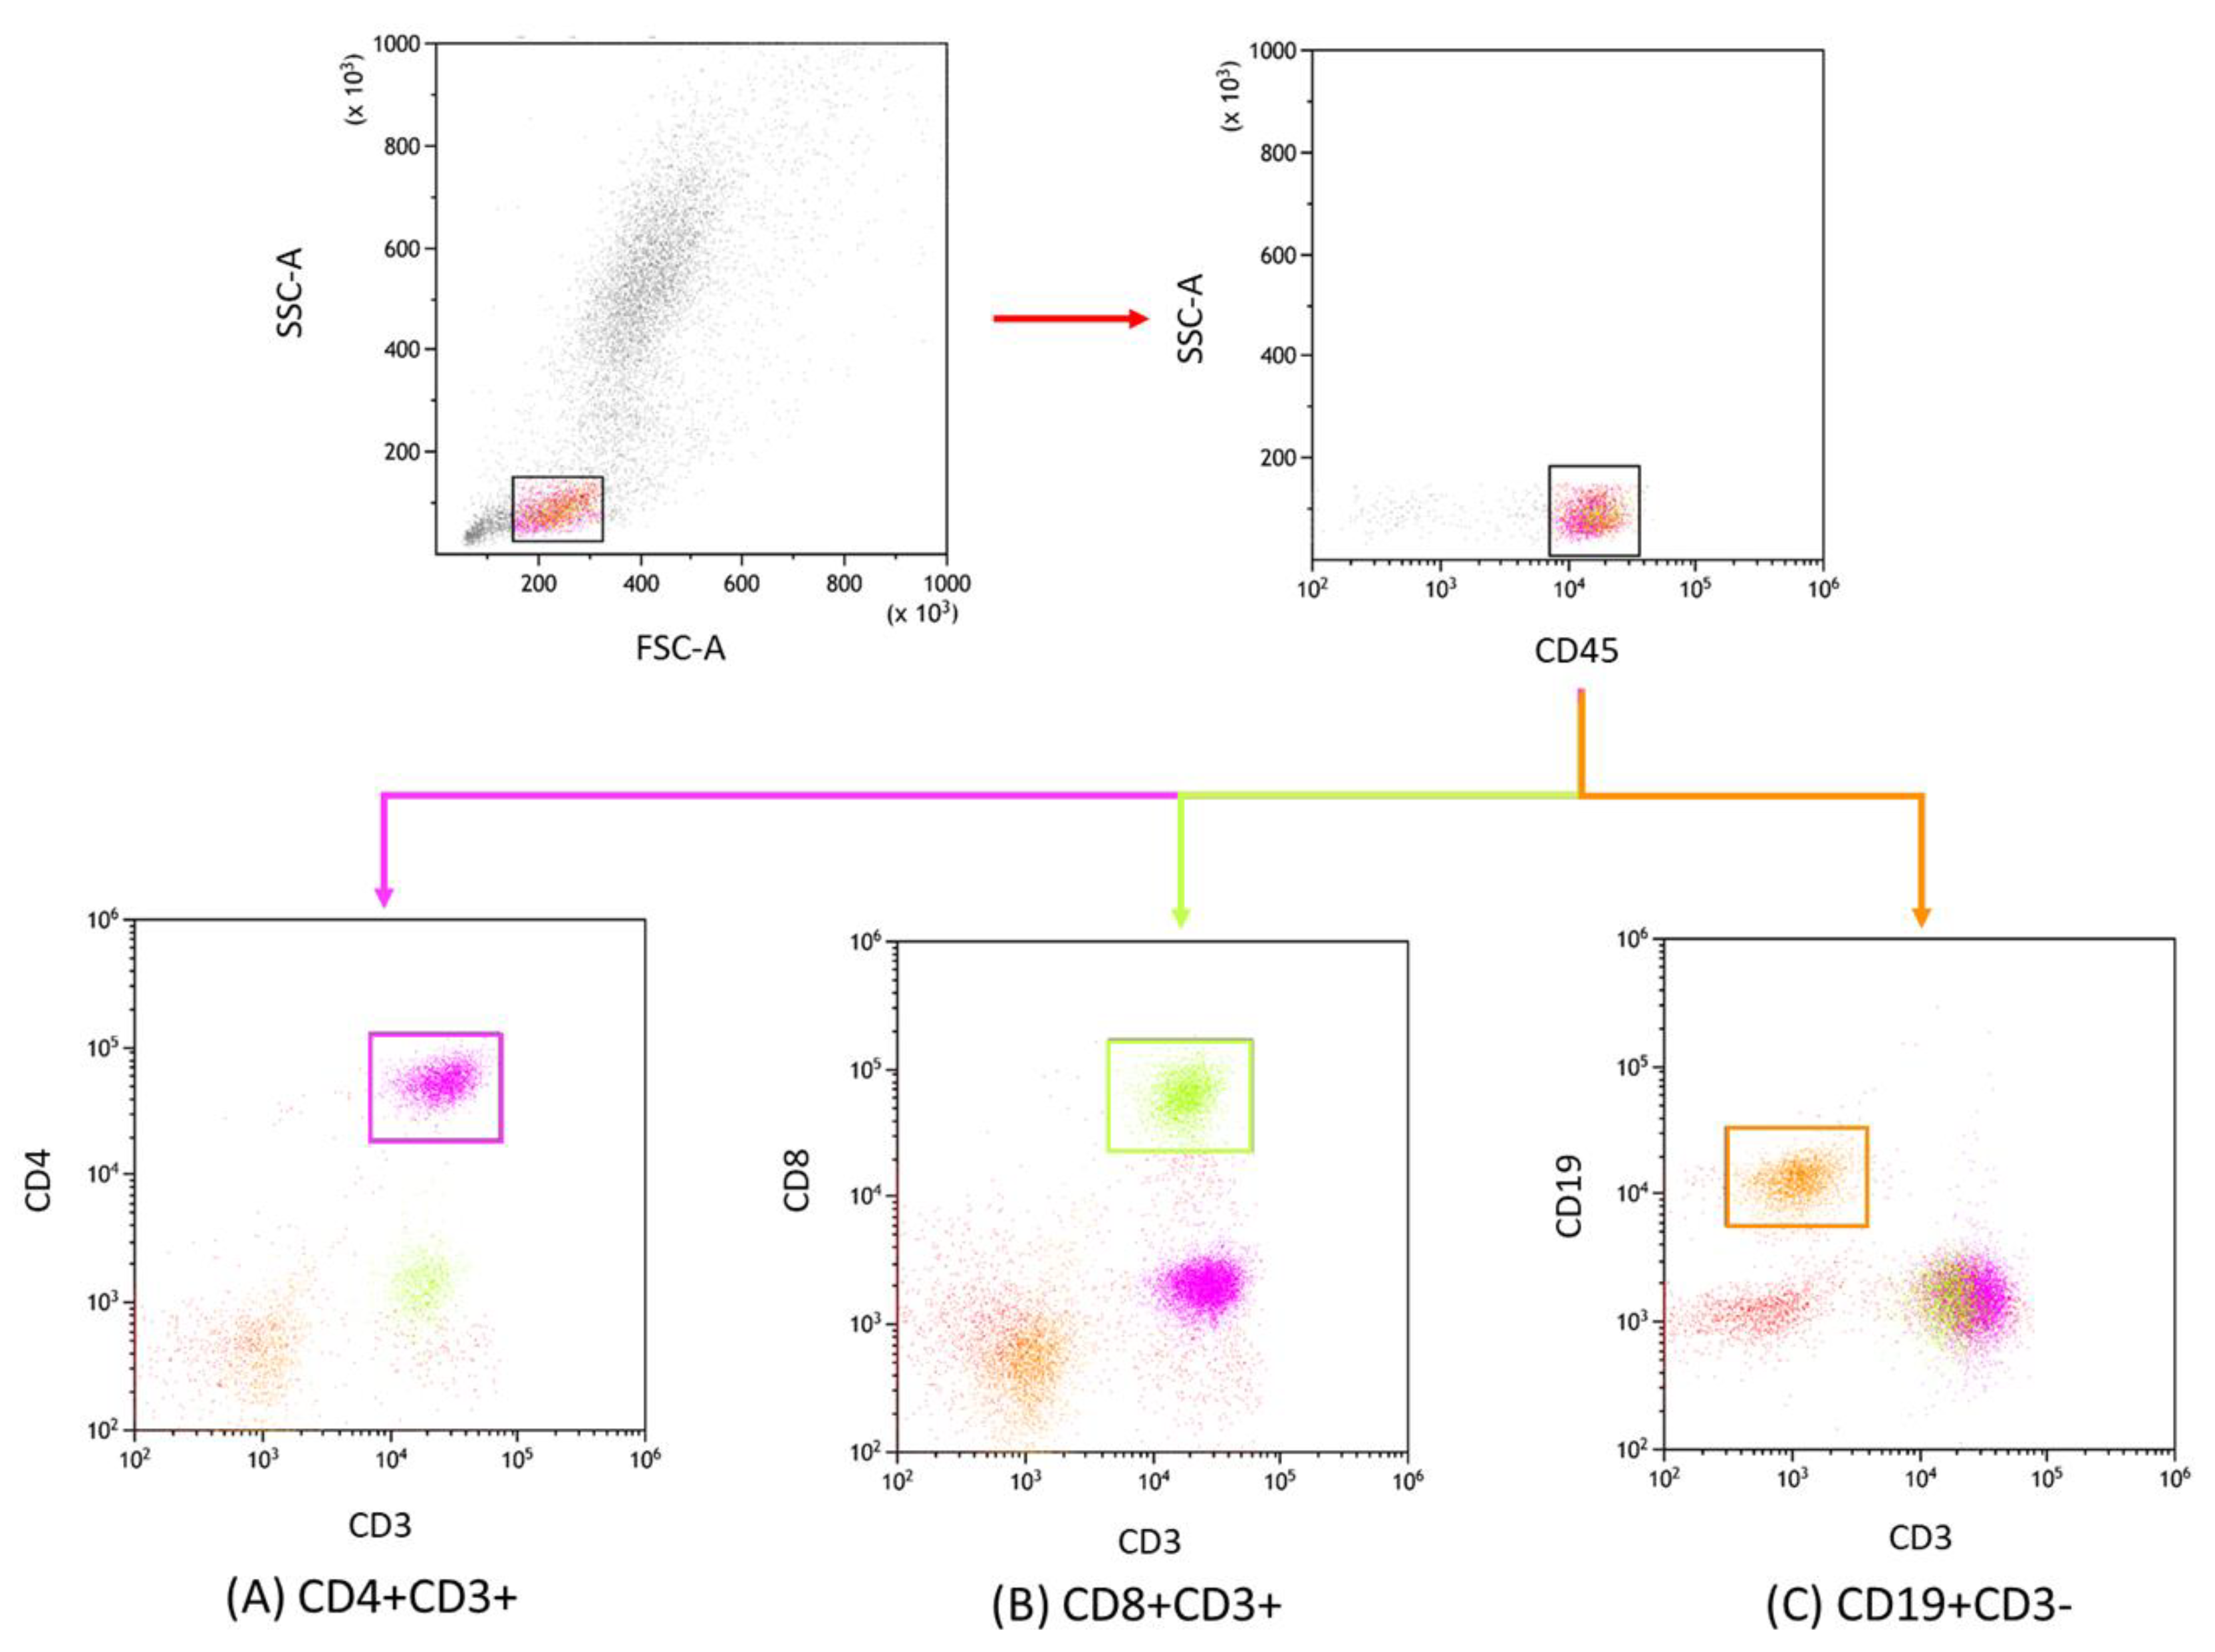
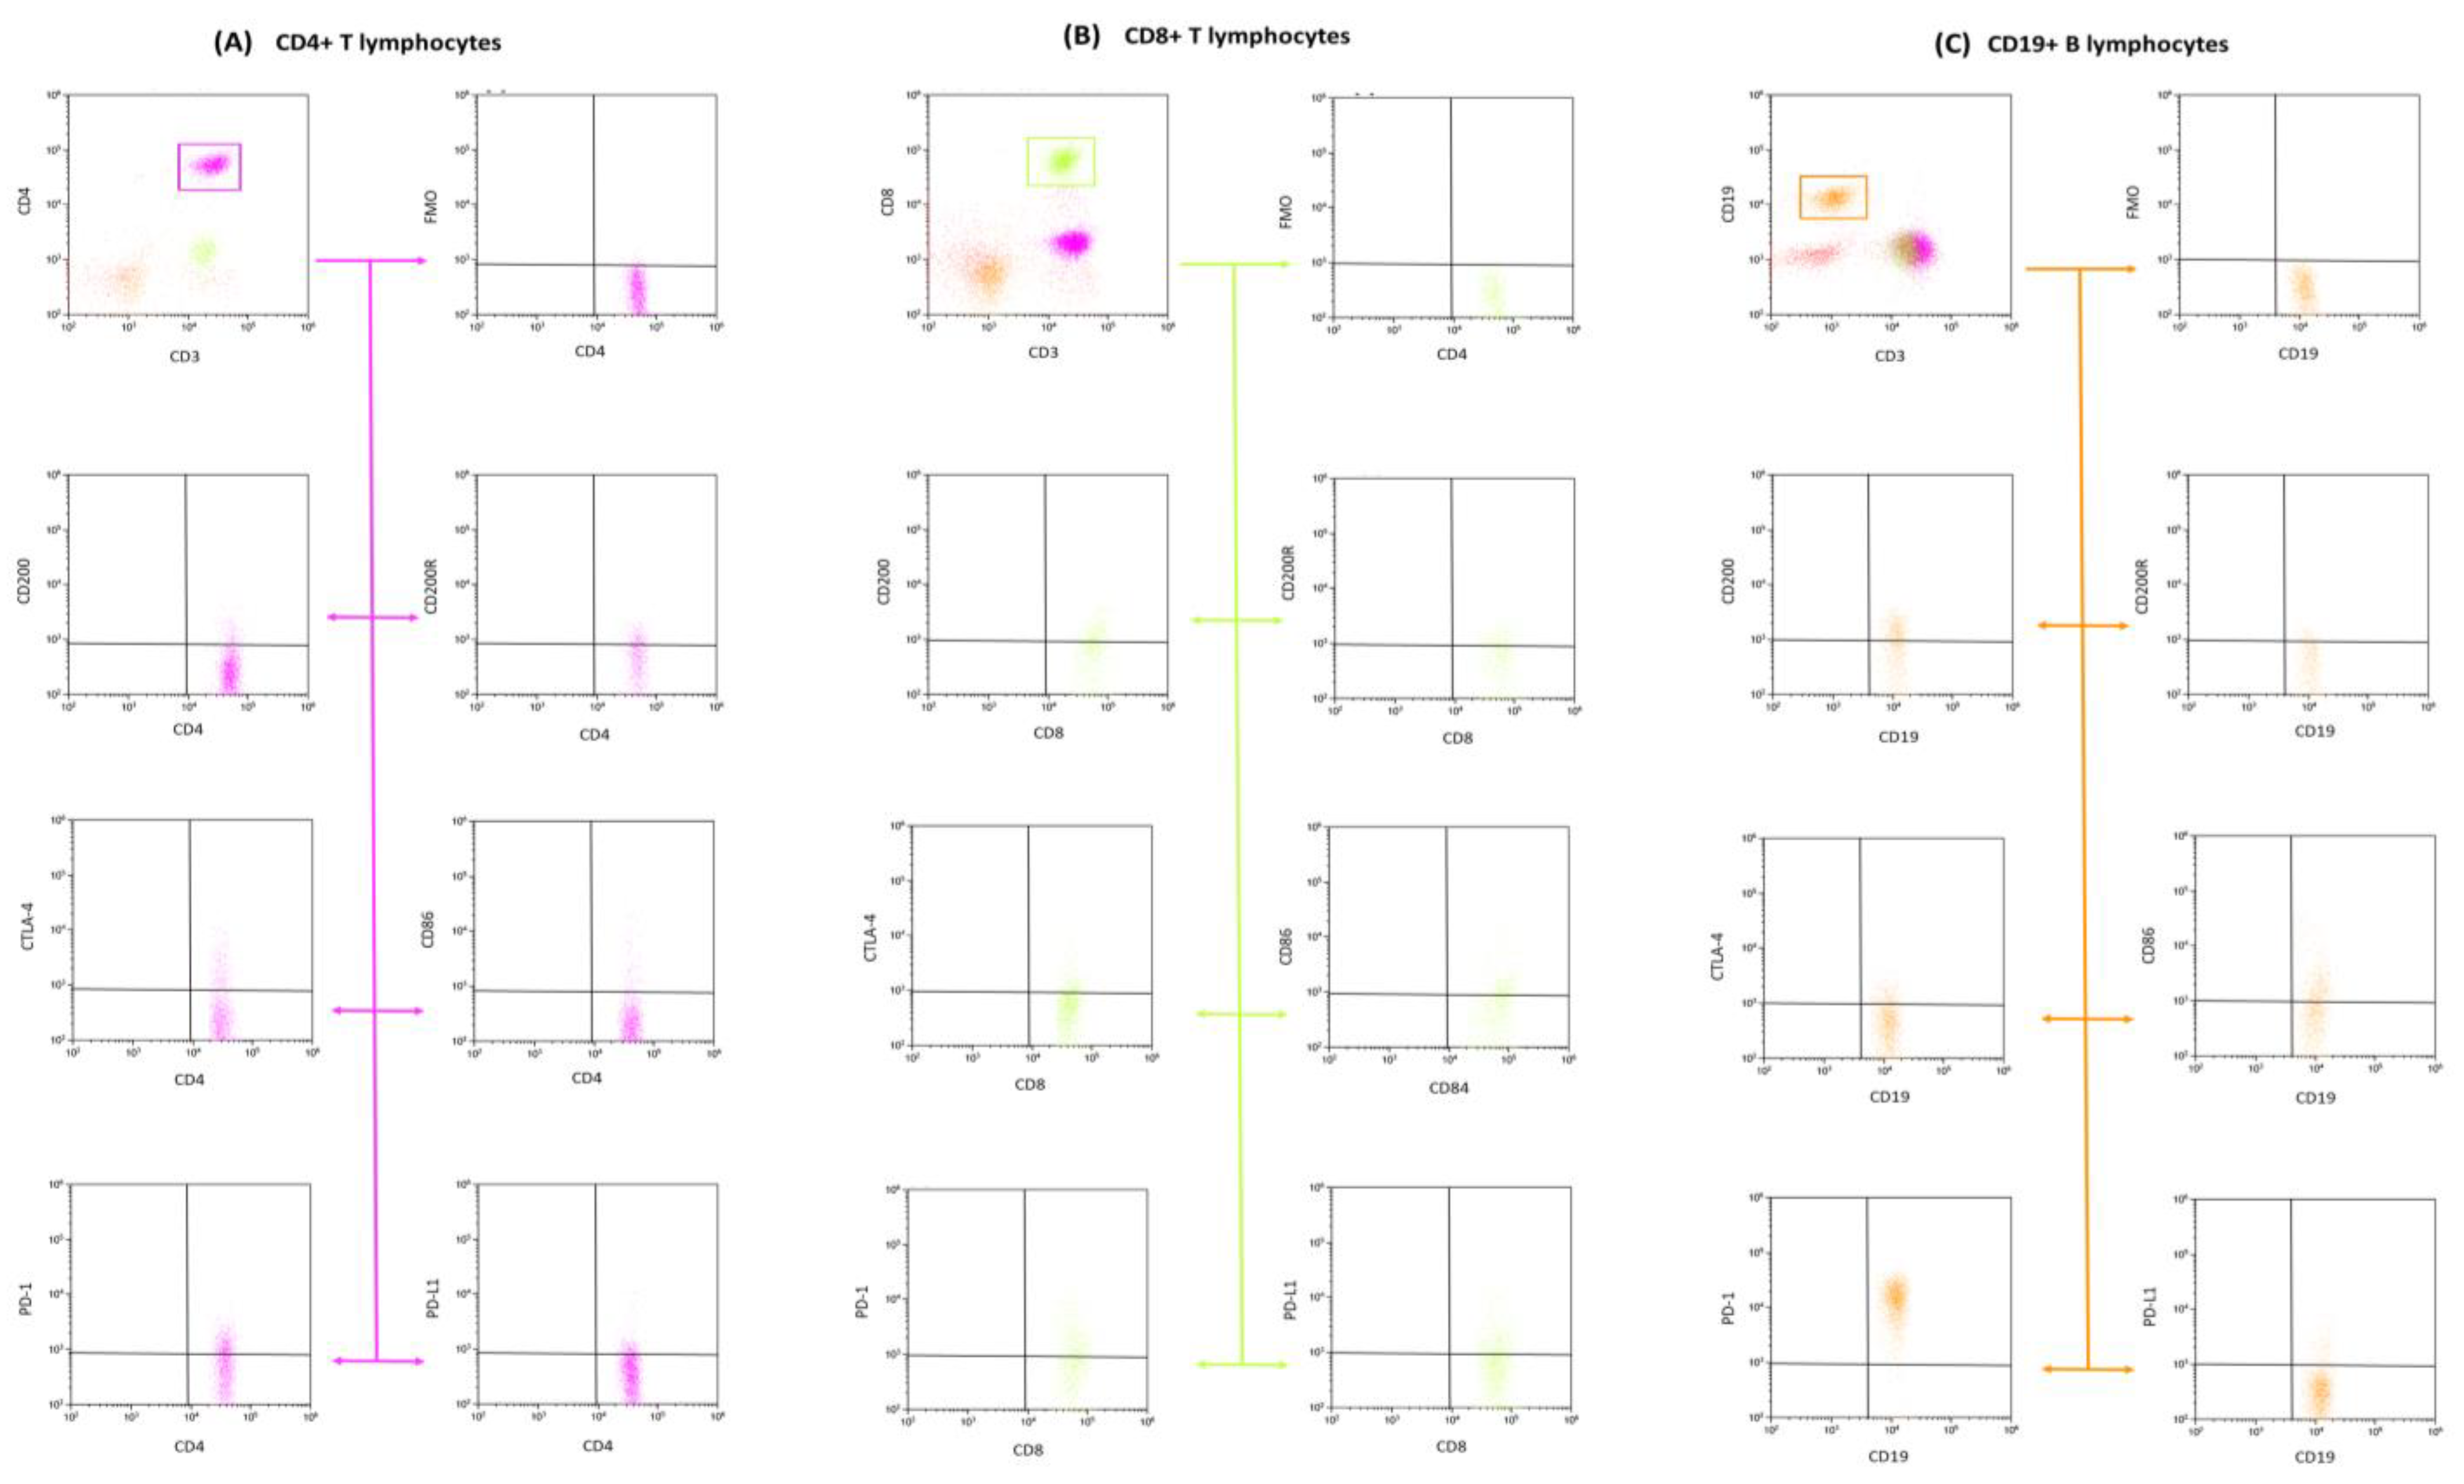
2.3. Lymphocyte Immunophenotyping
2.4. Serological Profiling of Anti-EBV Specific Antibodies
2.5. Assessment of Soluble Immune Checkpoint and Ligand Concentrations in Serum
- Human CD200 ELISA Kit (Sensitivity: 20 pg/mL) from Invitrogen, Waltham, MA, USA;
- Human CD200R ELISA Kit (Sensitivity: 11.89 pg/mL) from Abcam, Cambridge, UK;
- Human CTLA-4 ELISA Kit (Sensitivity: 0.13 ng/mL) from Invitrogen, Waltham, MA, USA;
- Human CD86 ELISA Kit (Sensitivity: 0.82 ng/mL) from Invitrogen, Waltham, MA, USA;
- Human PD-1 ELISA Kit (Sensitivity: 1.14 pg/mL) from Invitrogen, Waltham, MA, USA;
- Human PD-L1 ELISA Kit (Sensitivity: 0.6 pg/mL) from Invitrogen, Waltham, MA, USA.
2.6. Statistical Analysis of Obtained Data
3. Results
3.1. Classification and Characteristics of Selected Peripheral Blood Parameters of Patients with CLL and CVID in the Context of EBV Reactivation
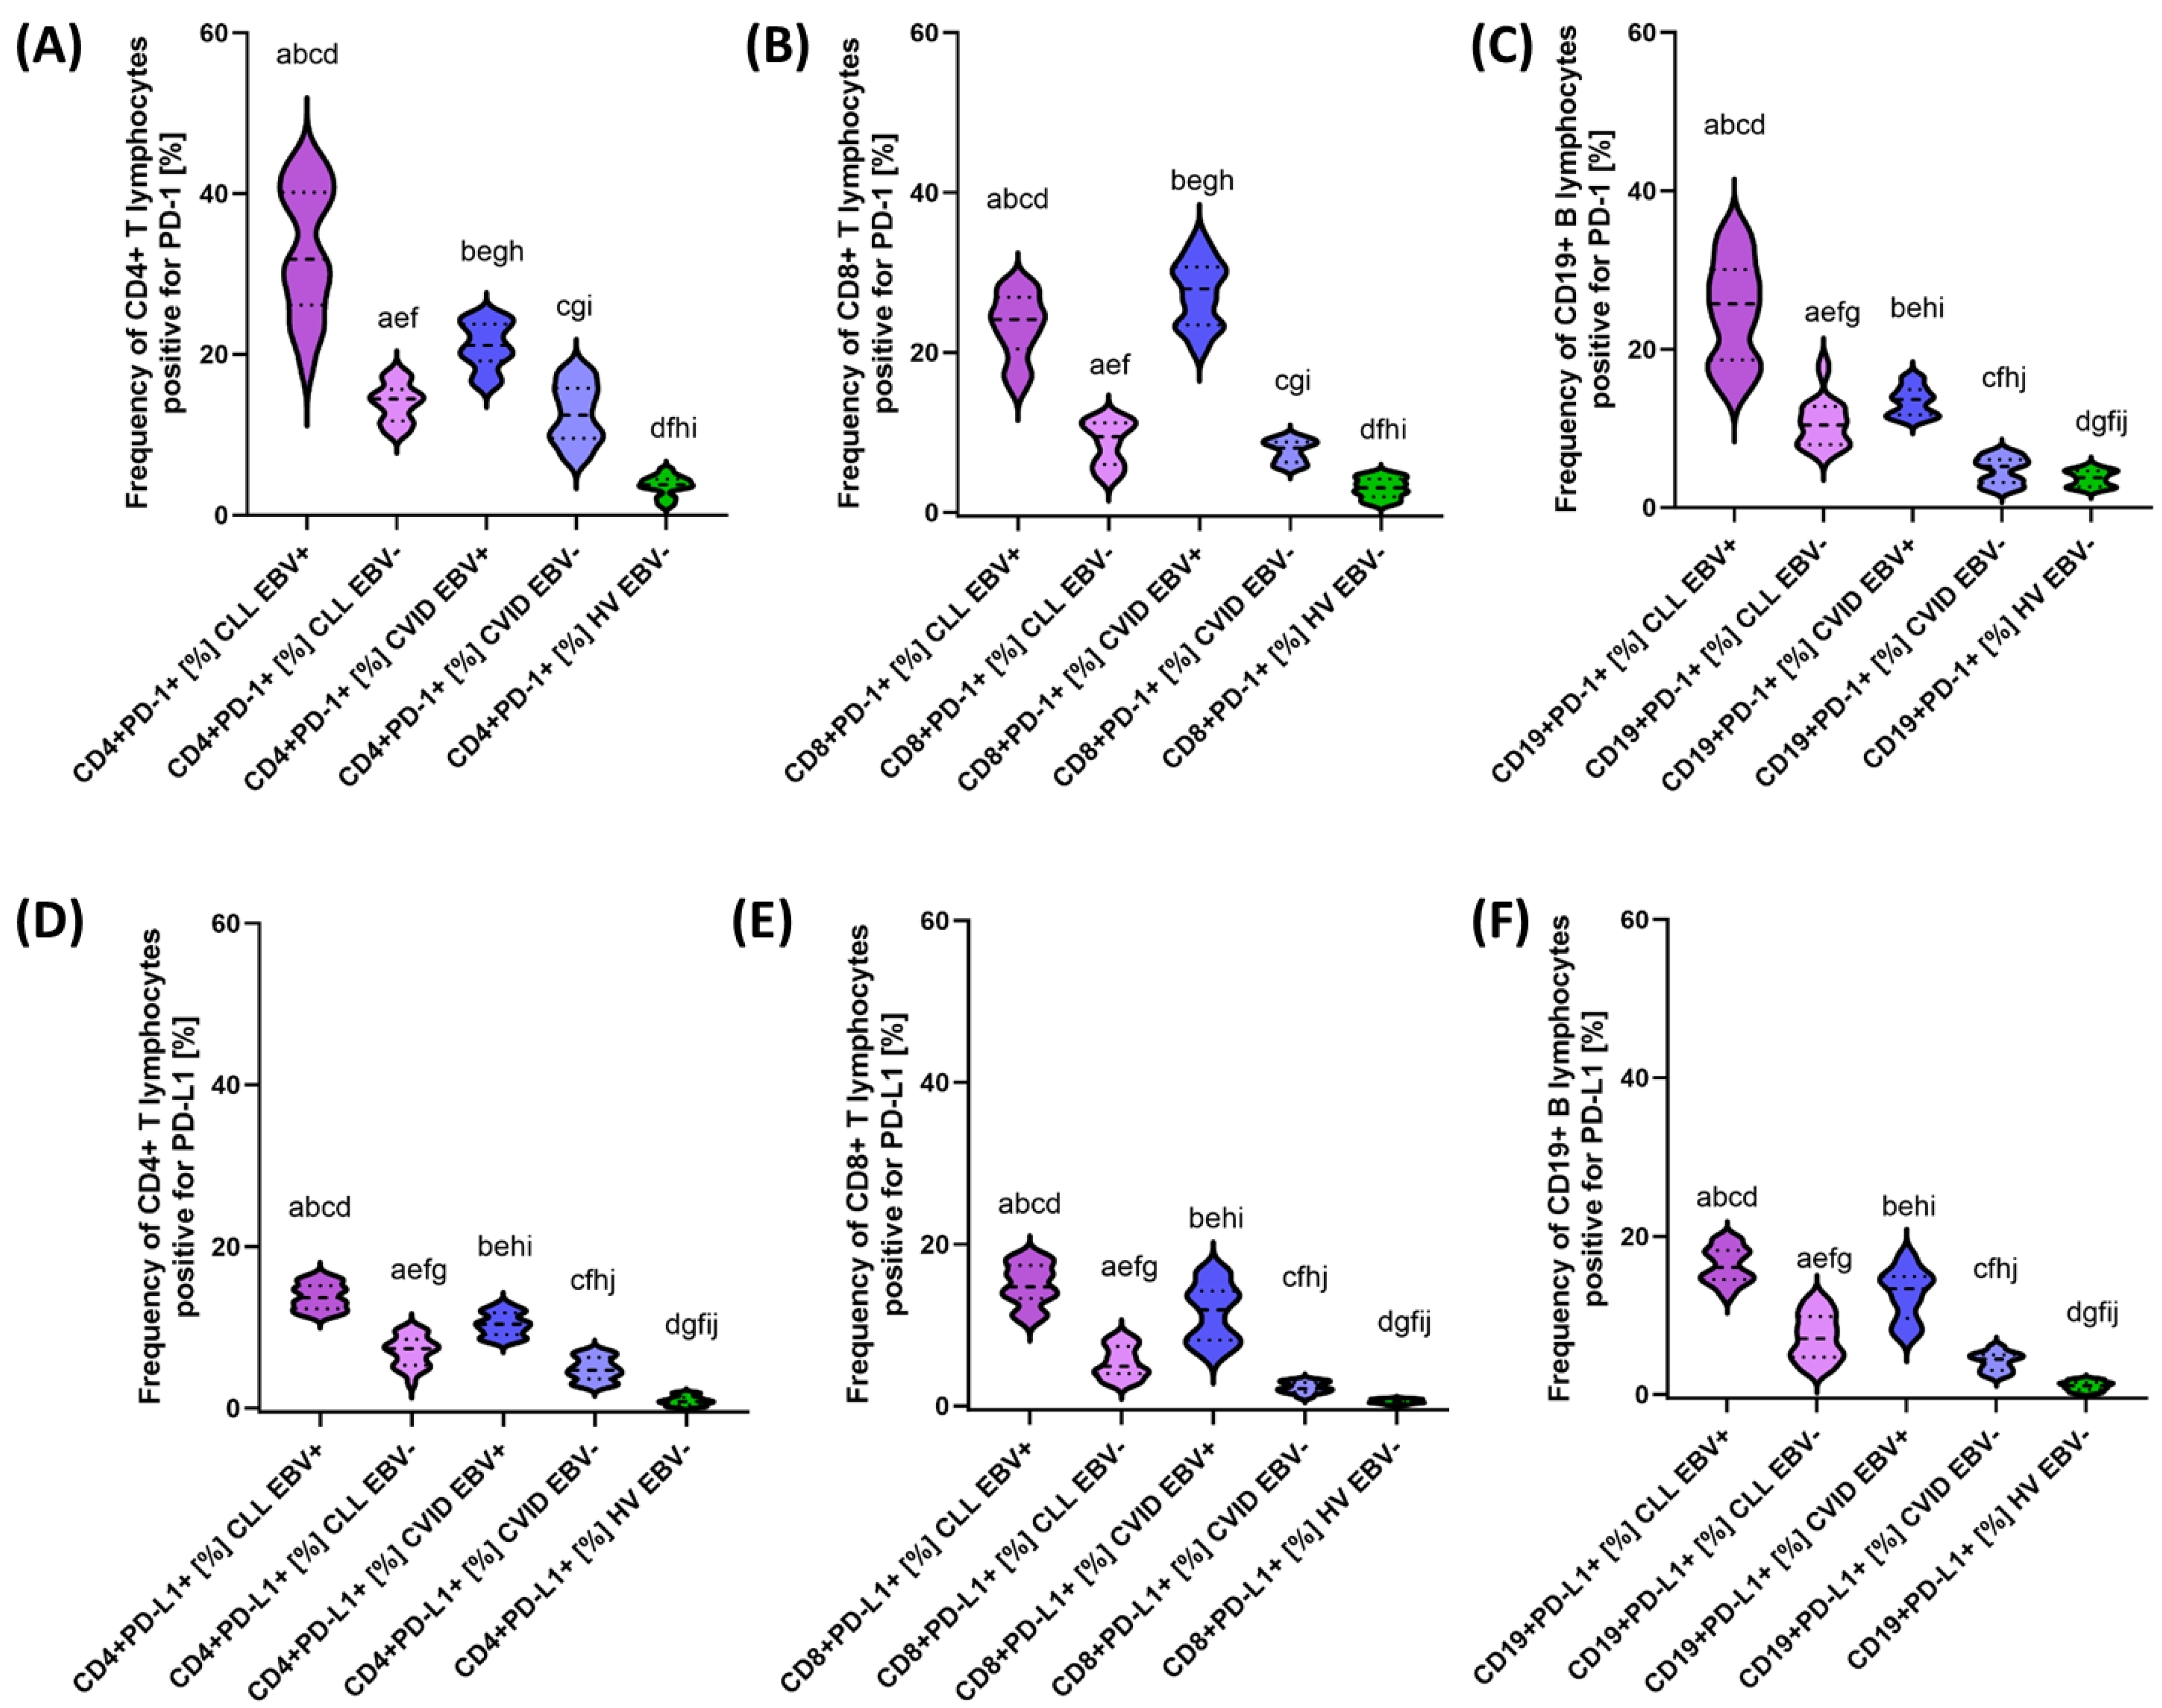
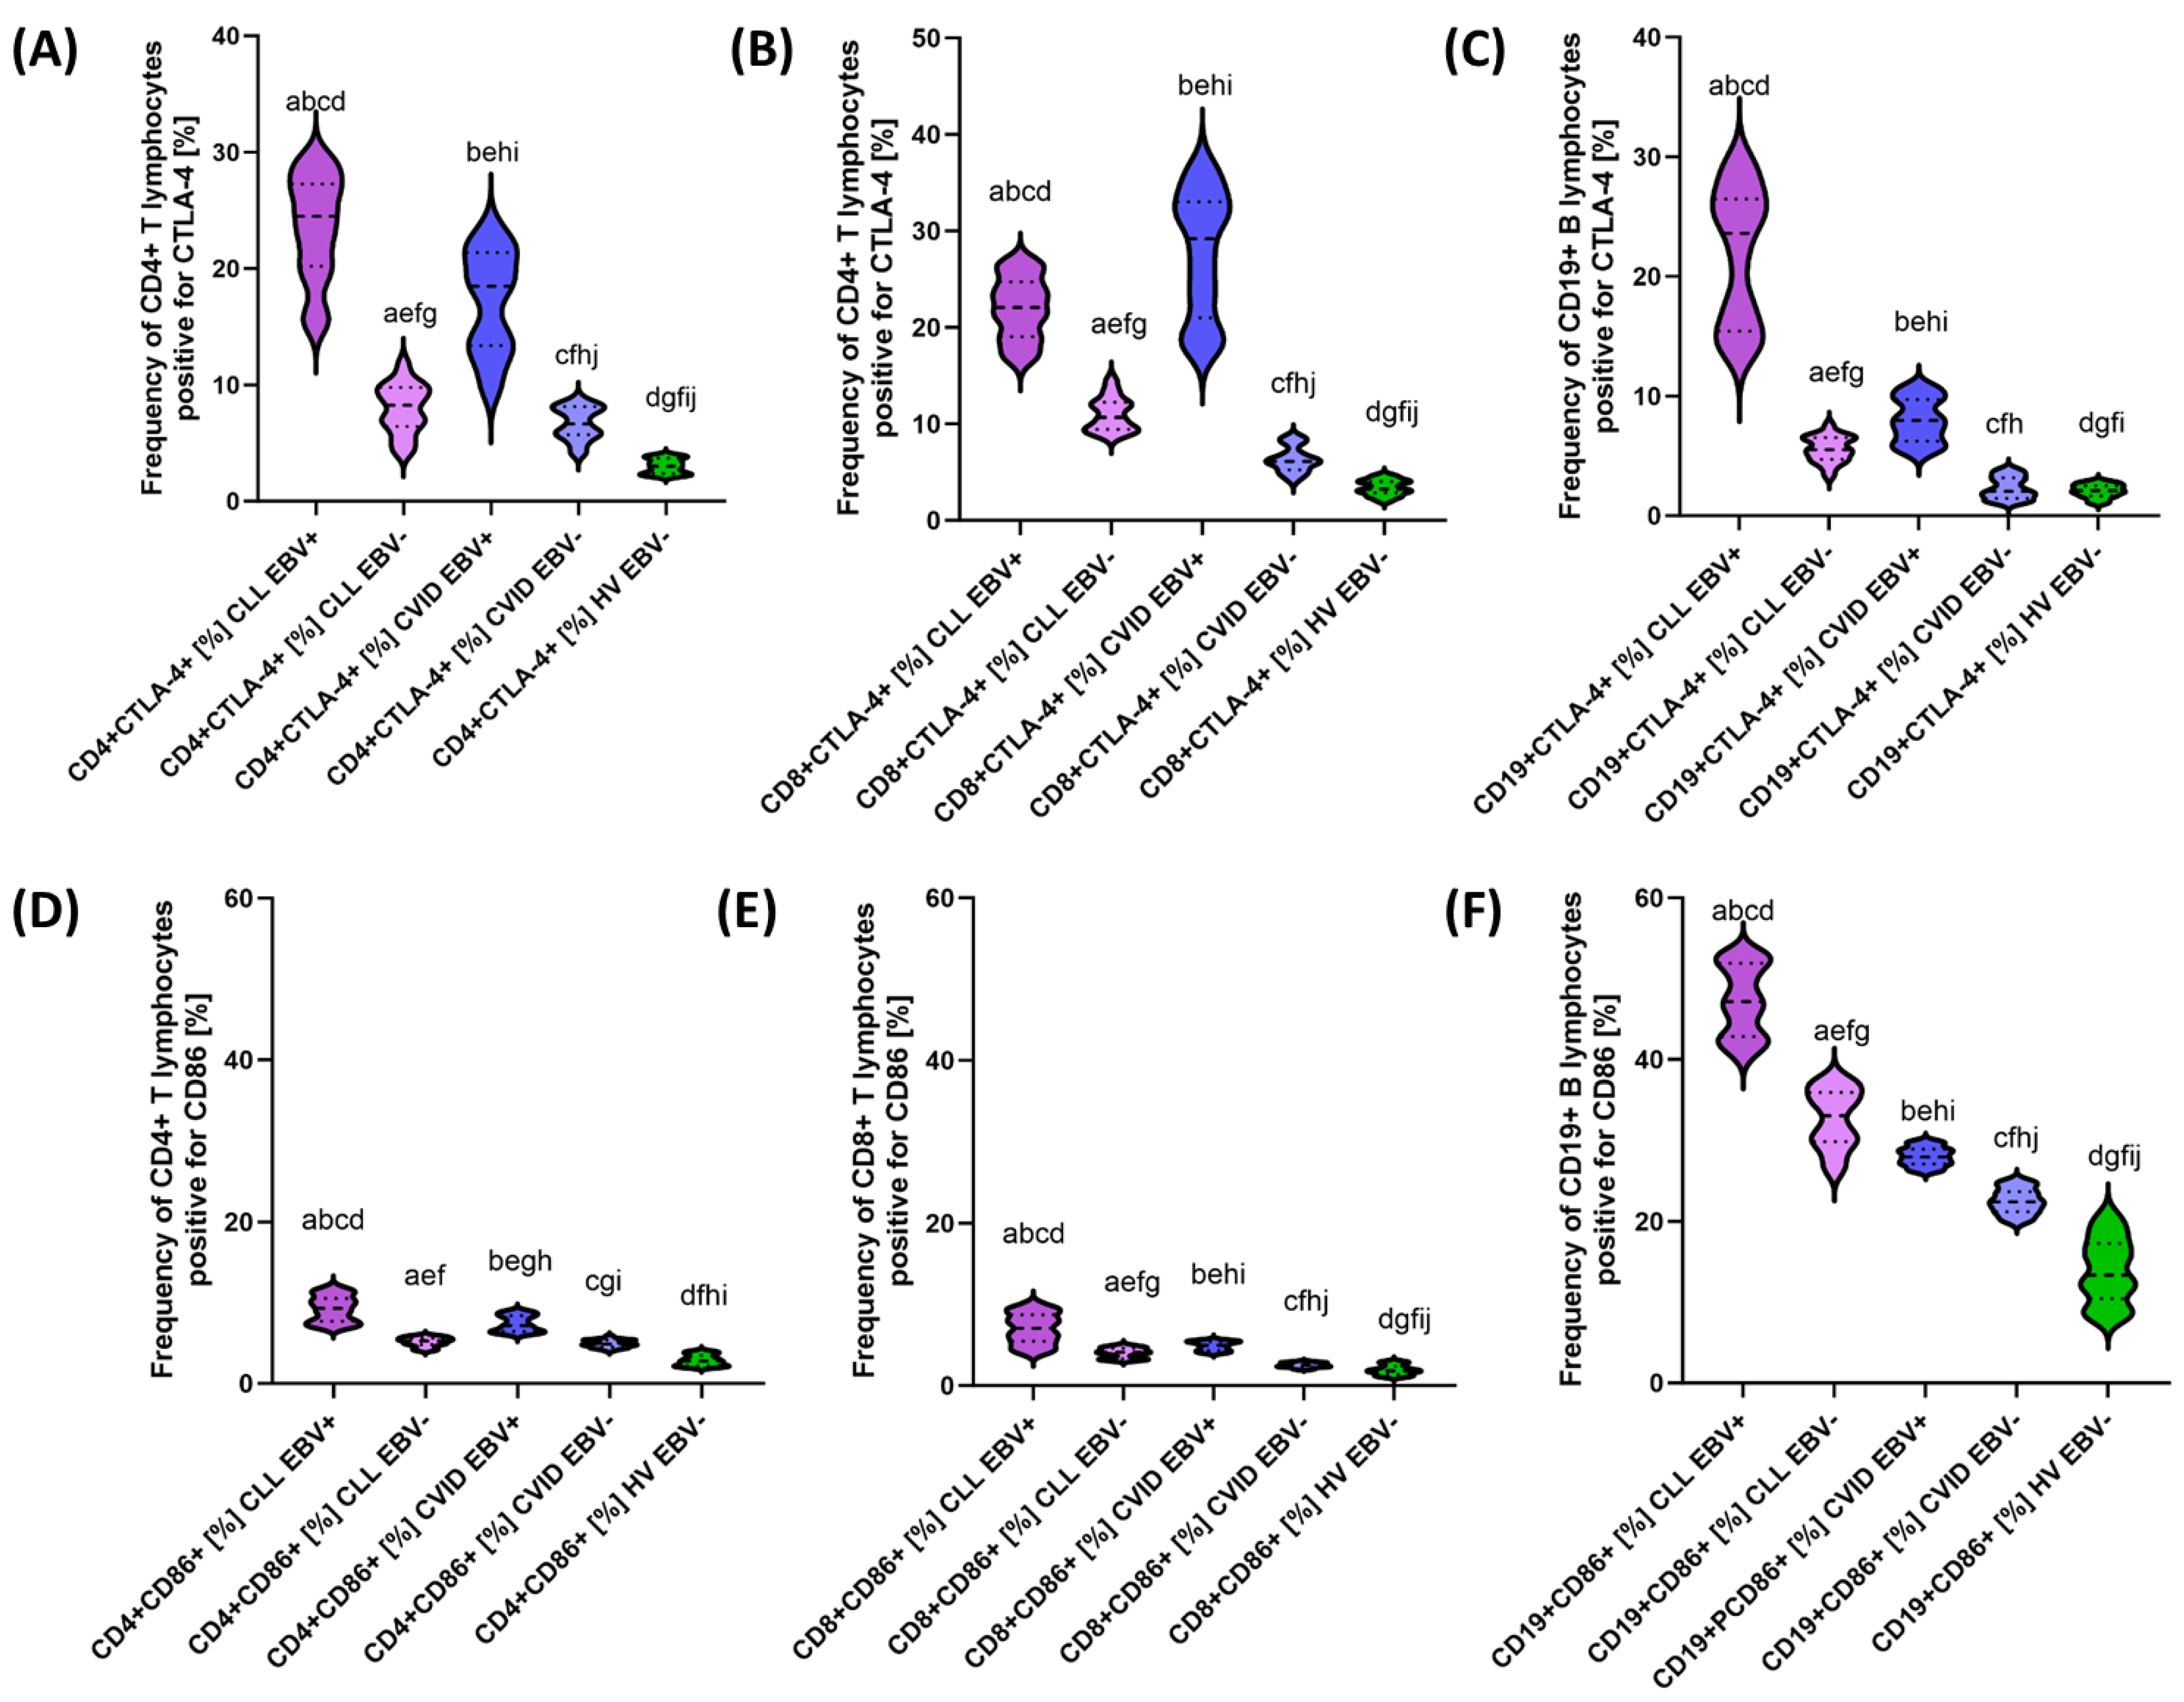
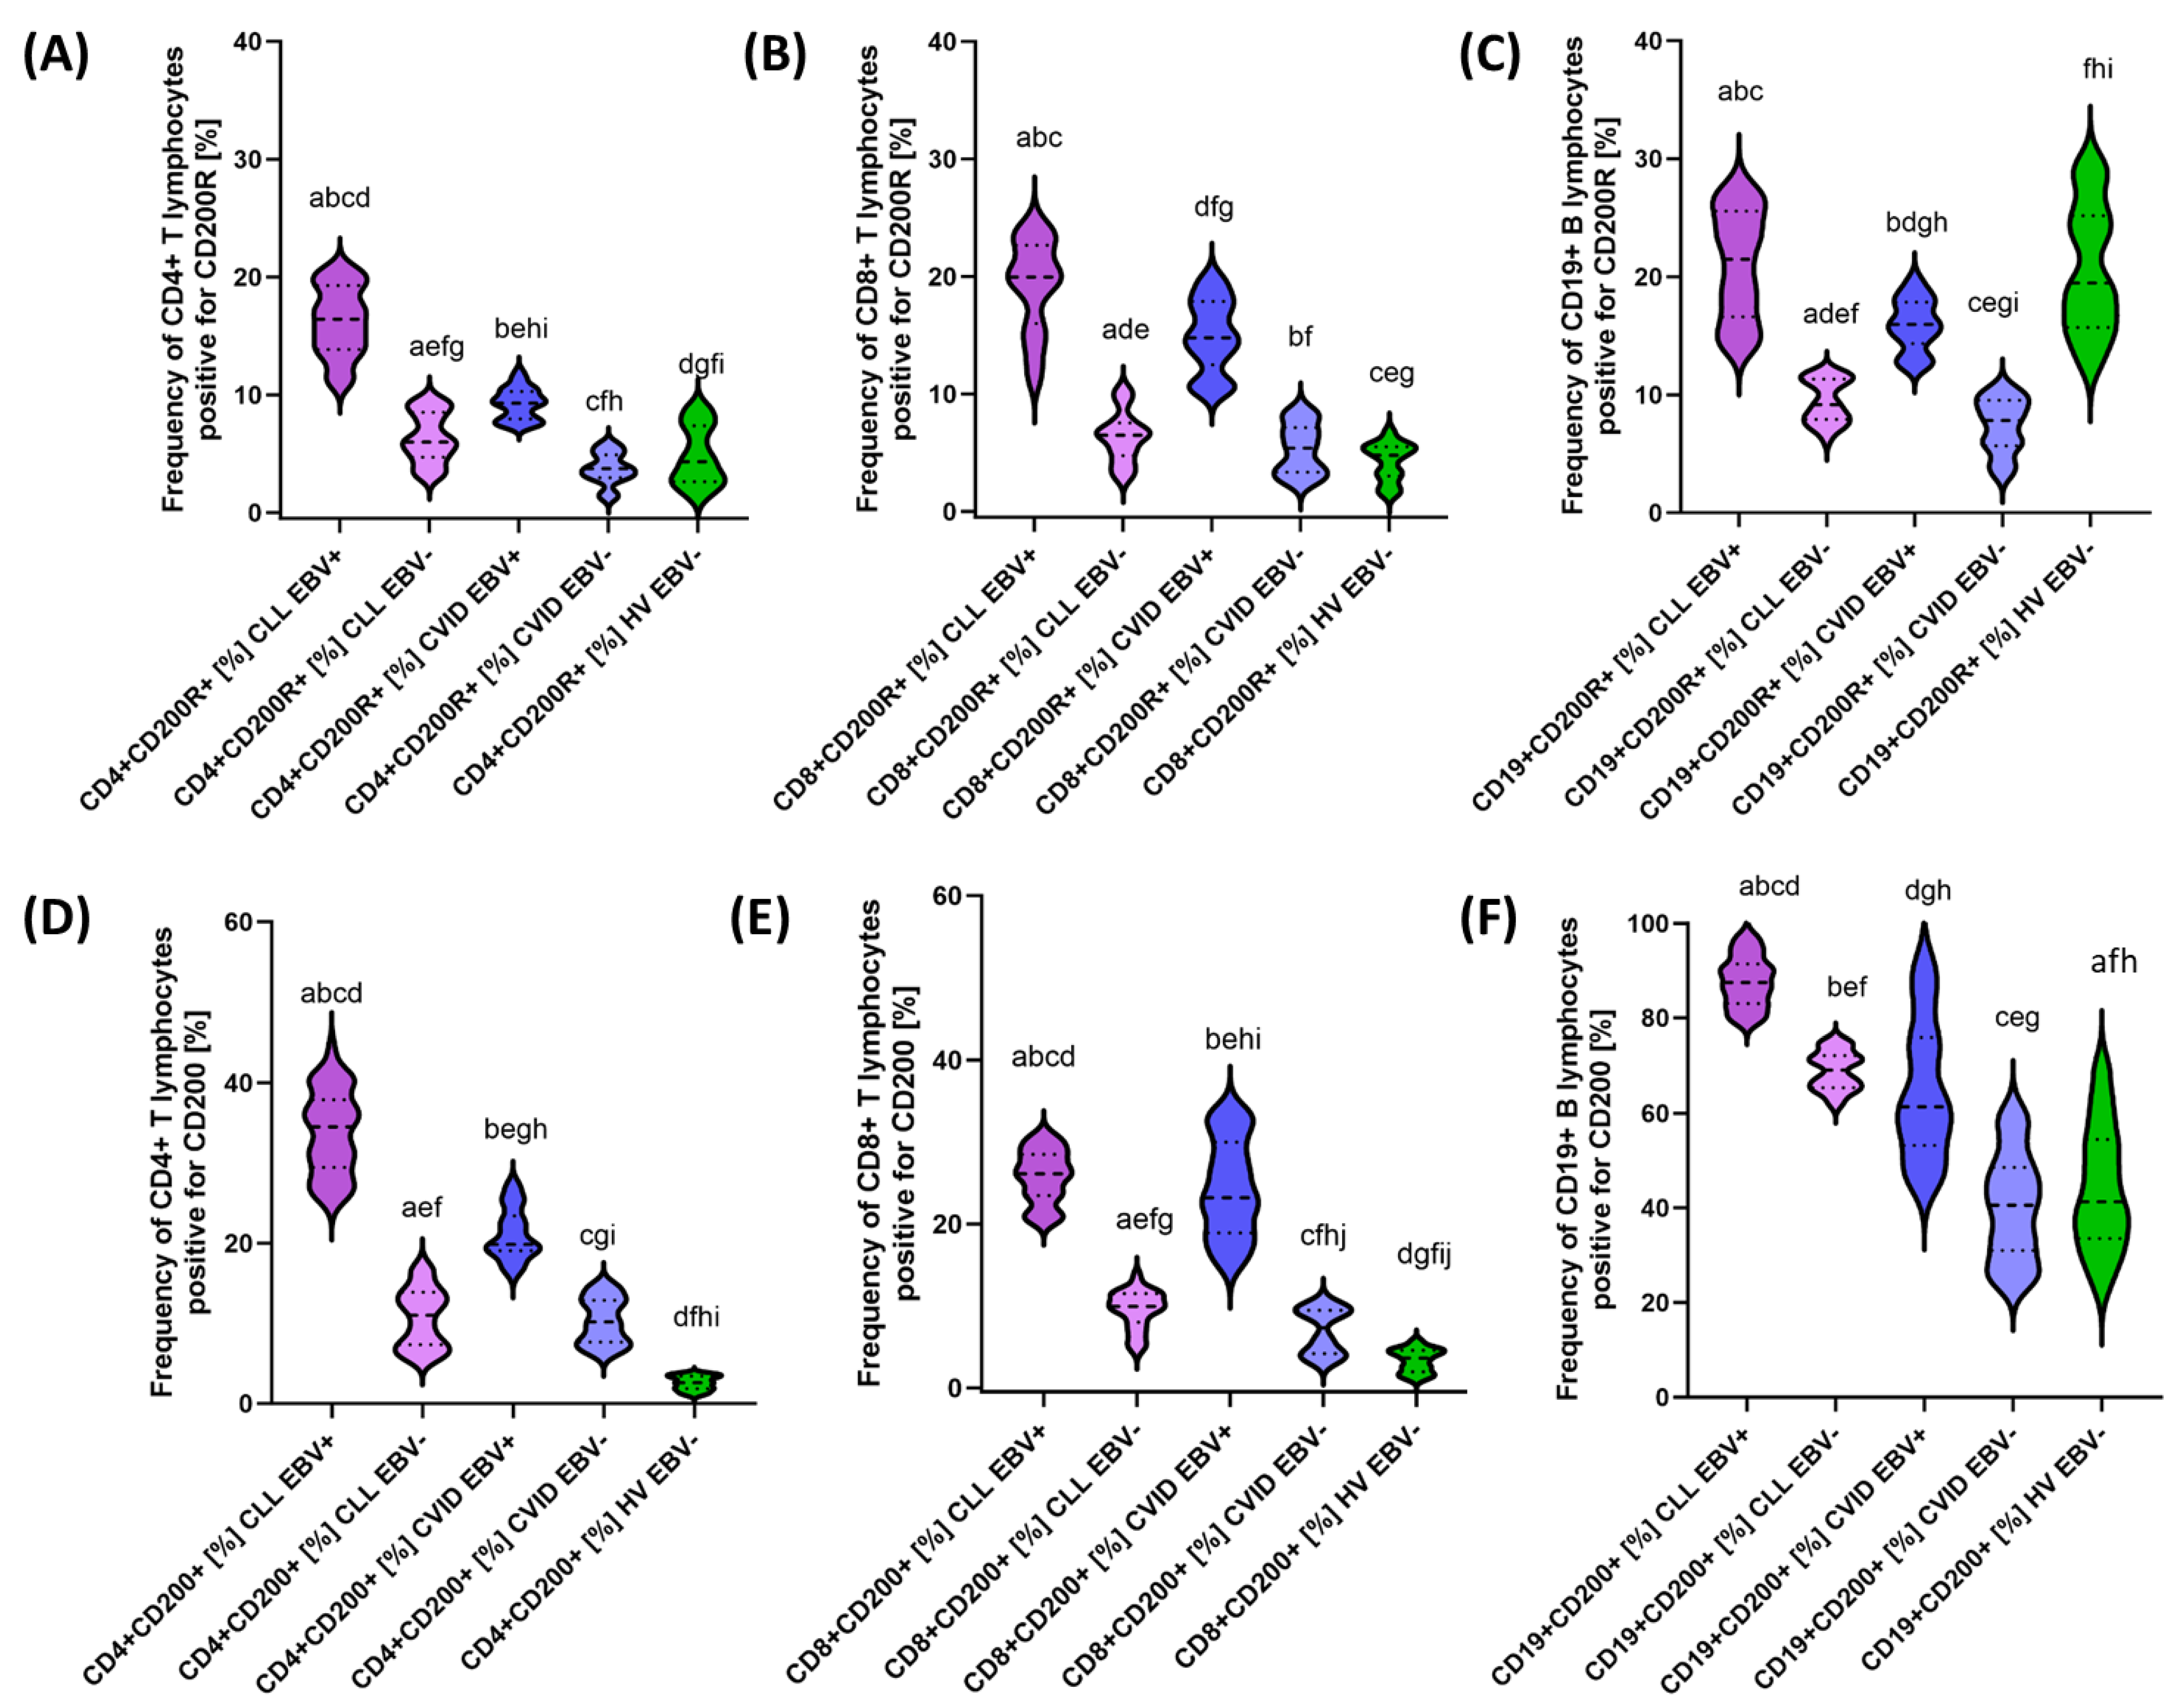
3.2. Analysis of the Effect of EBV Reactivation on the Percentage of Lymphocytes Expressing Positive Immune Checkpoints and Their Ligands
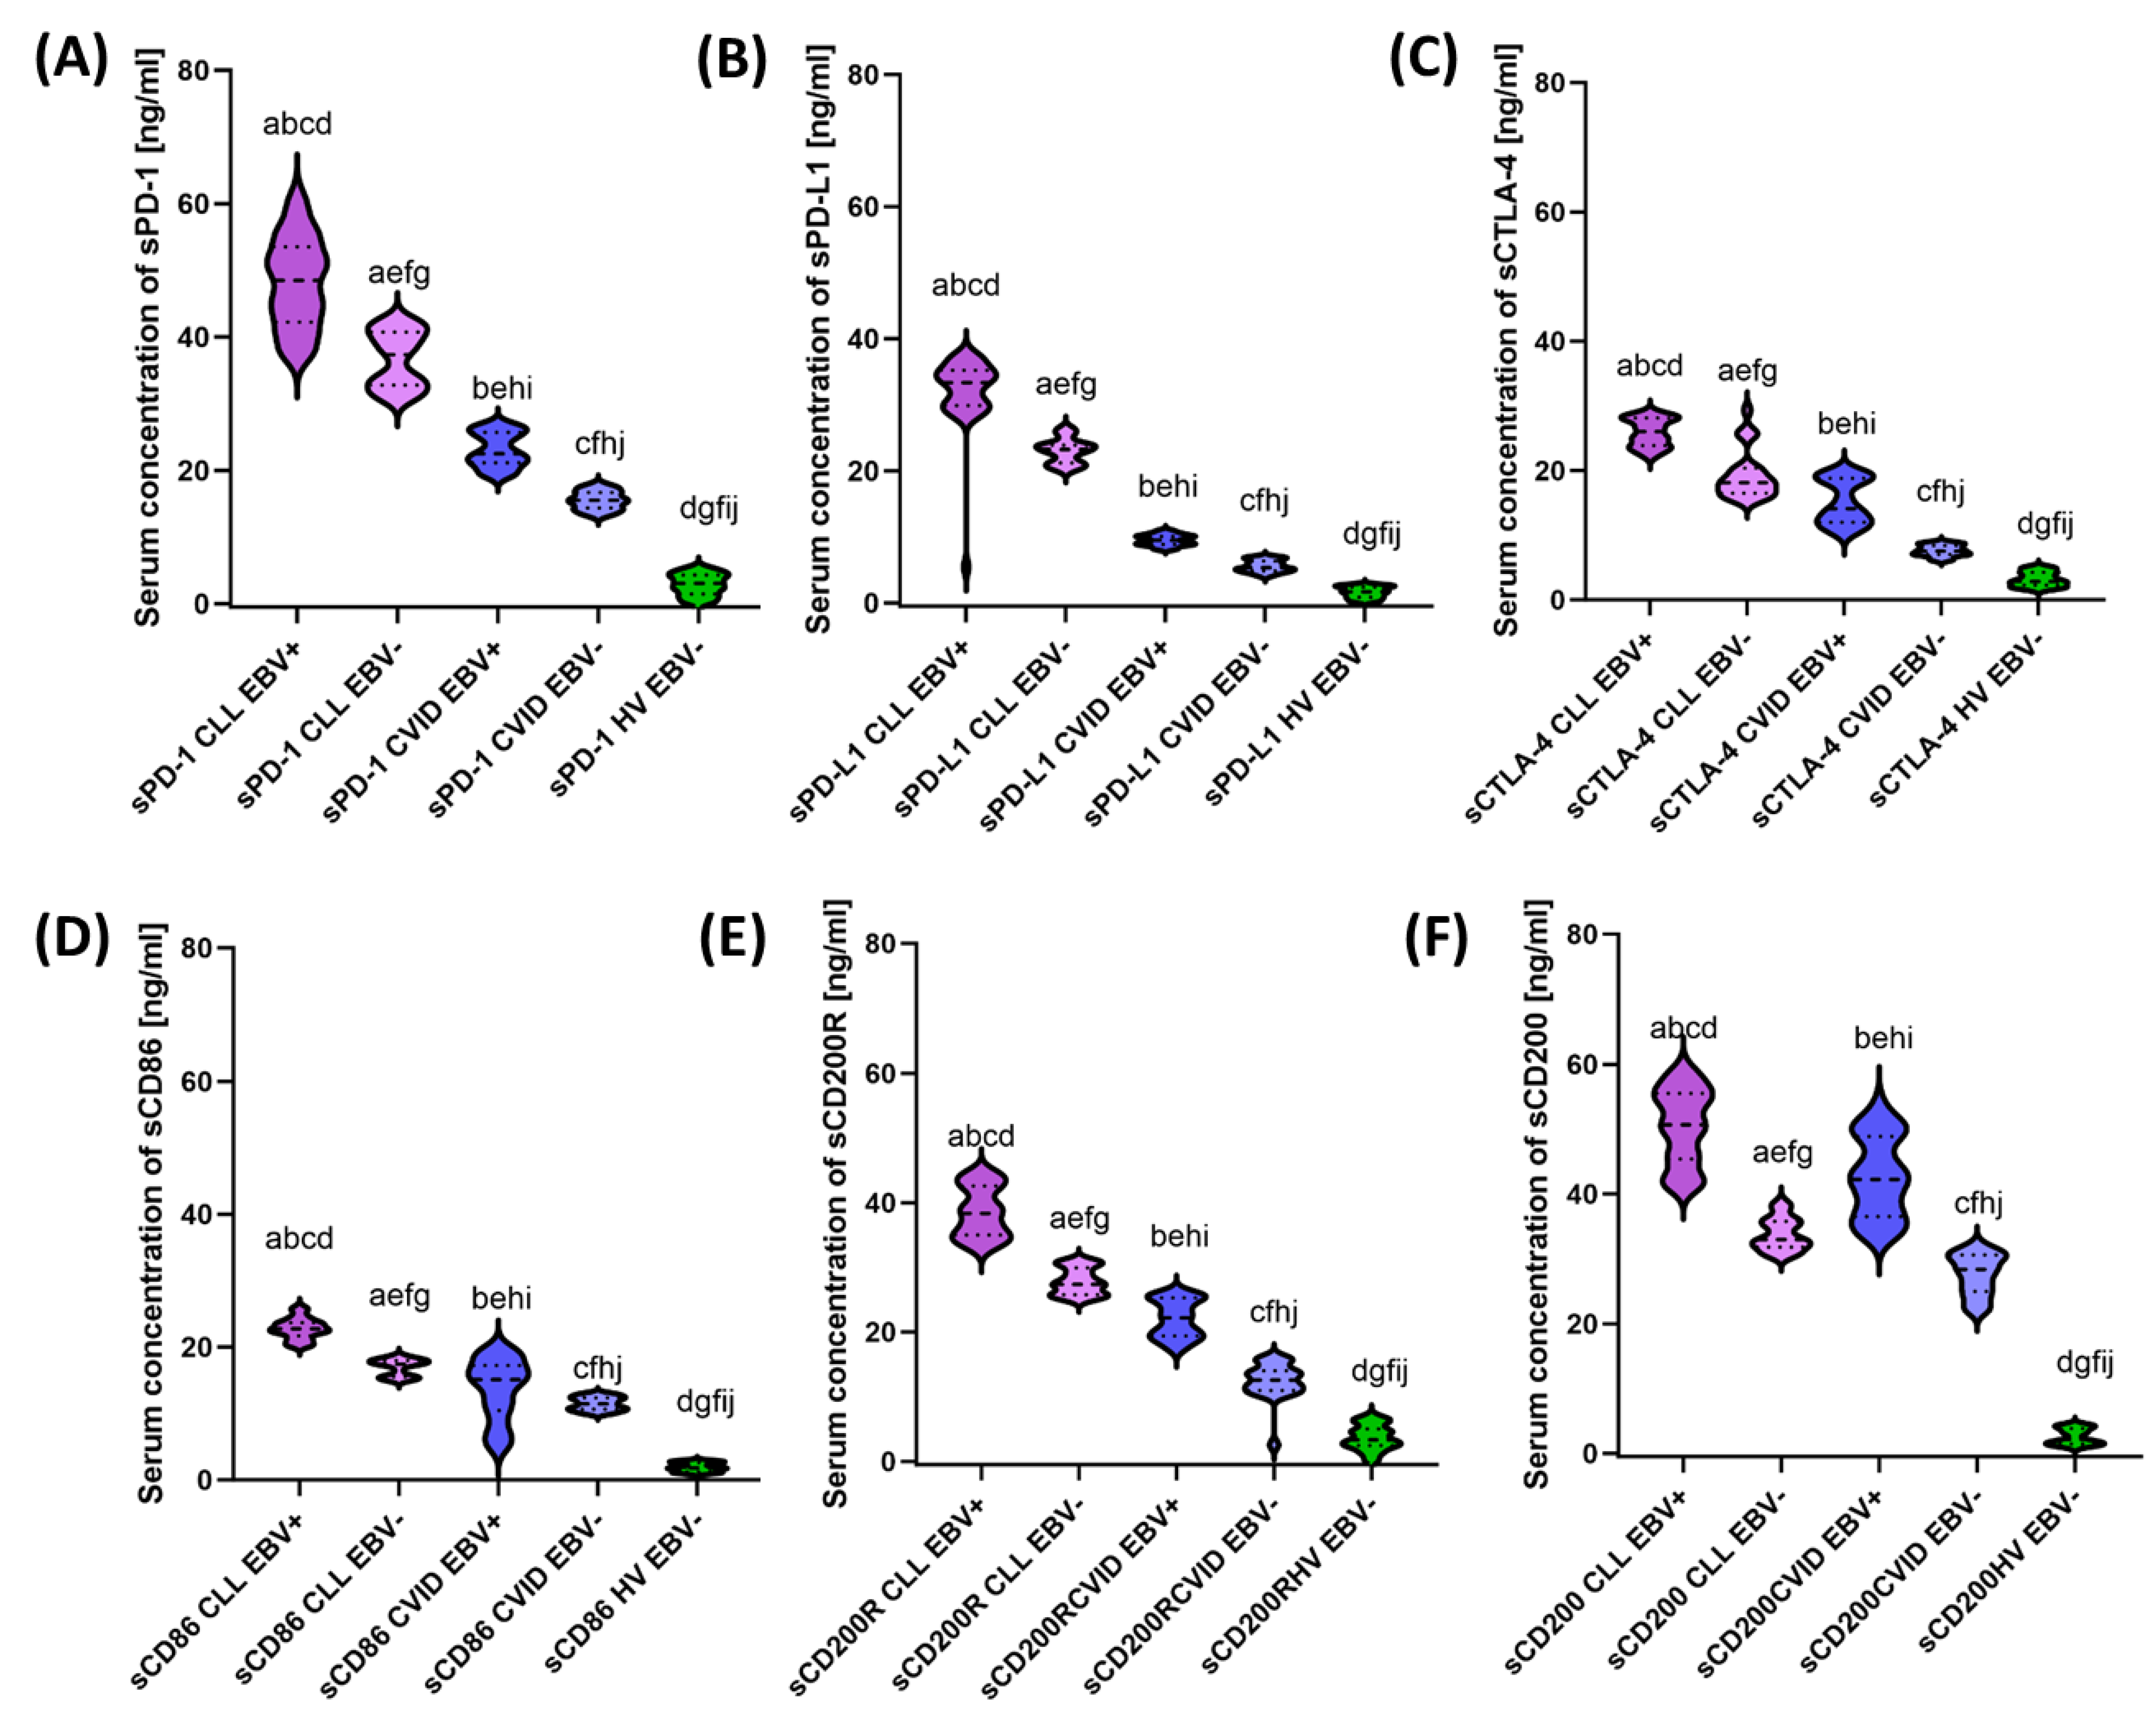
3.3. Analysis of the Effect of EBV Reactivation on Serum Concentrations of Soluble Forms of Immunological Checkpoints and Their Ligands
3.4. Influence of EBV Reactivation on Correlations of Selected Analyzed Parameters of the Immune System
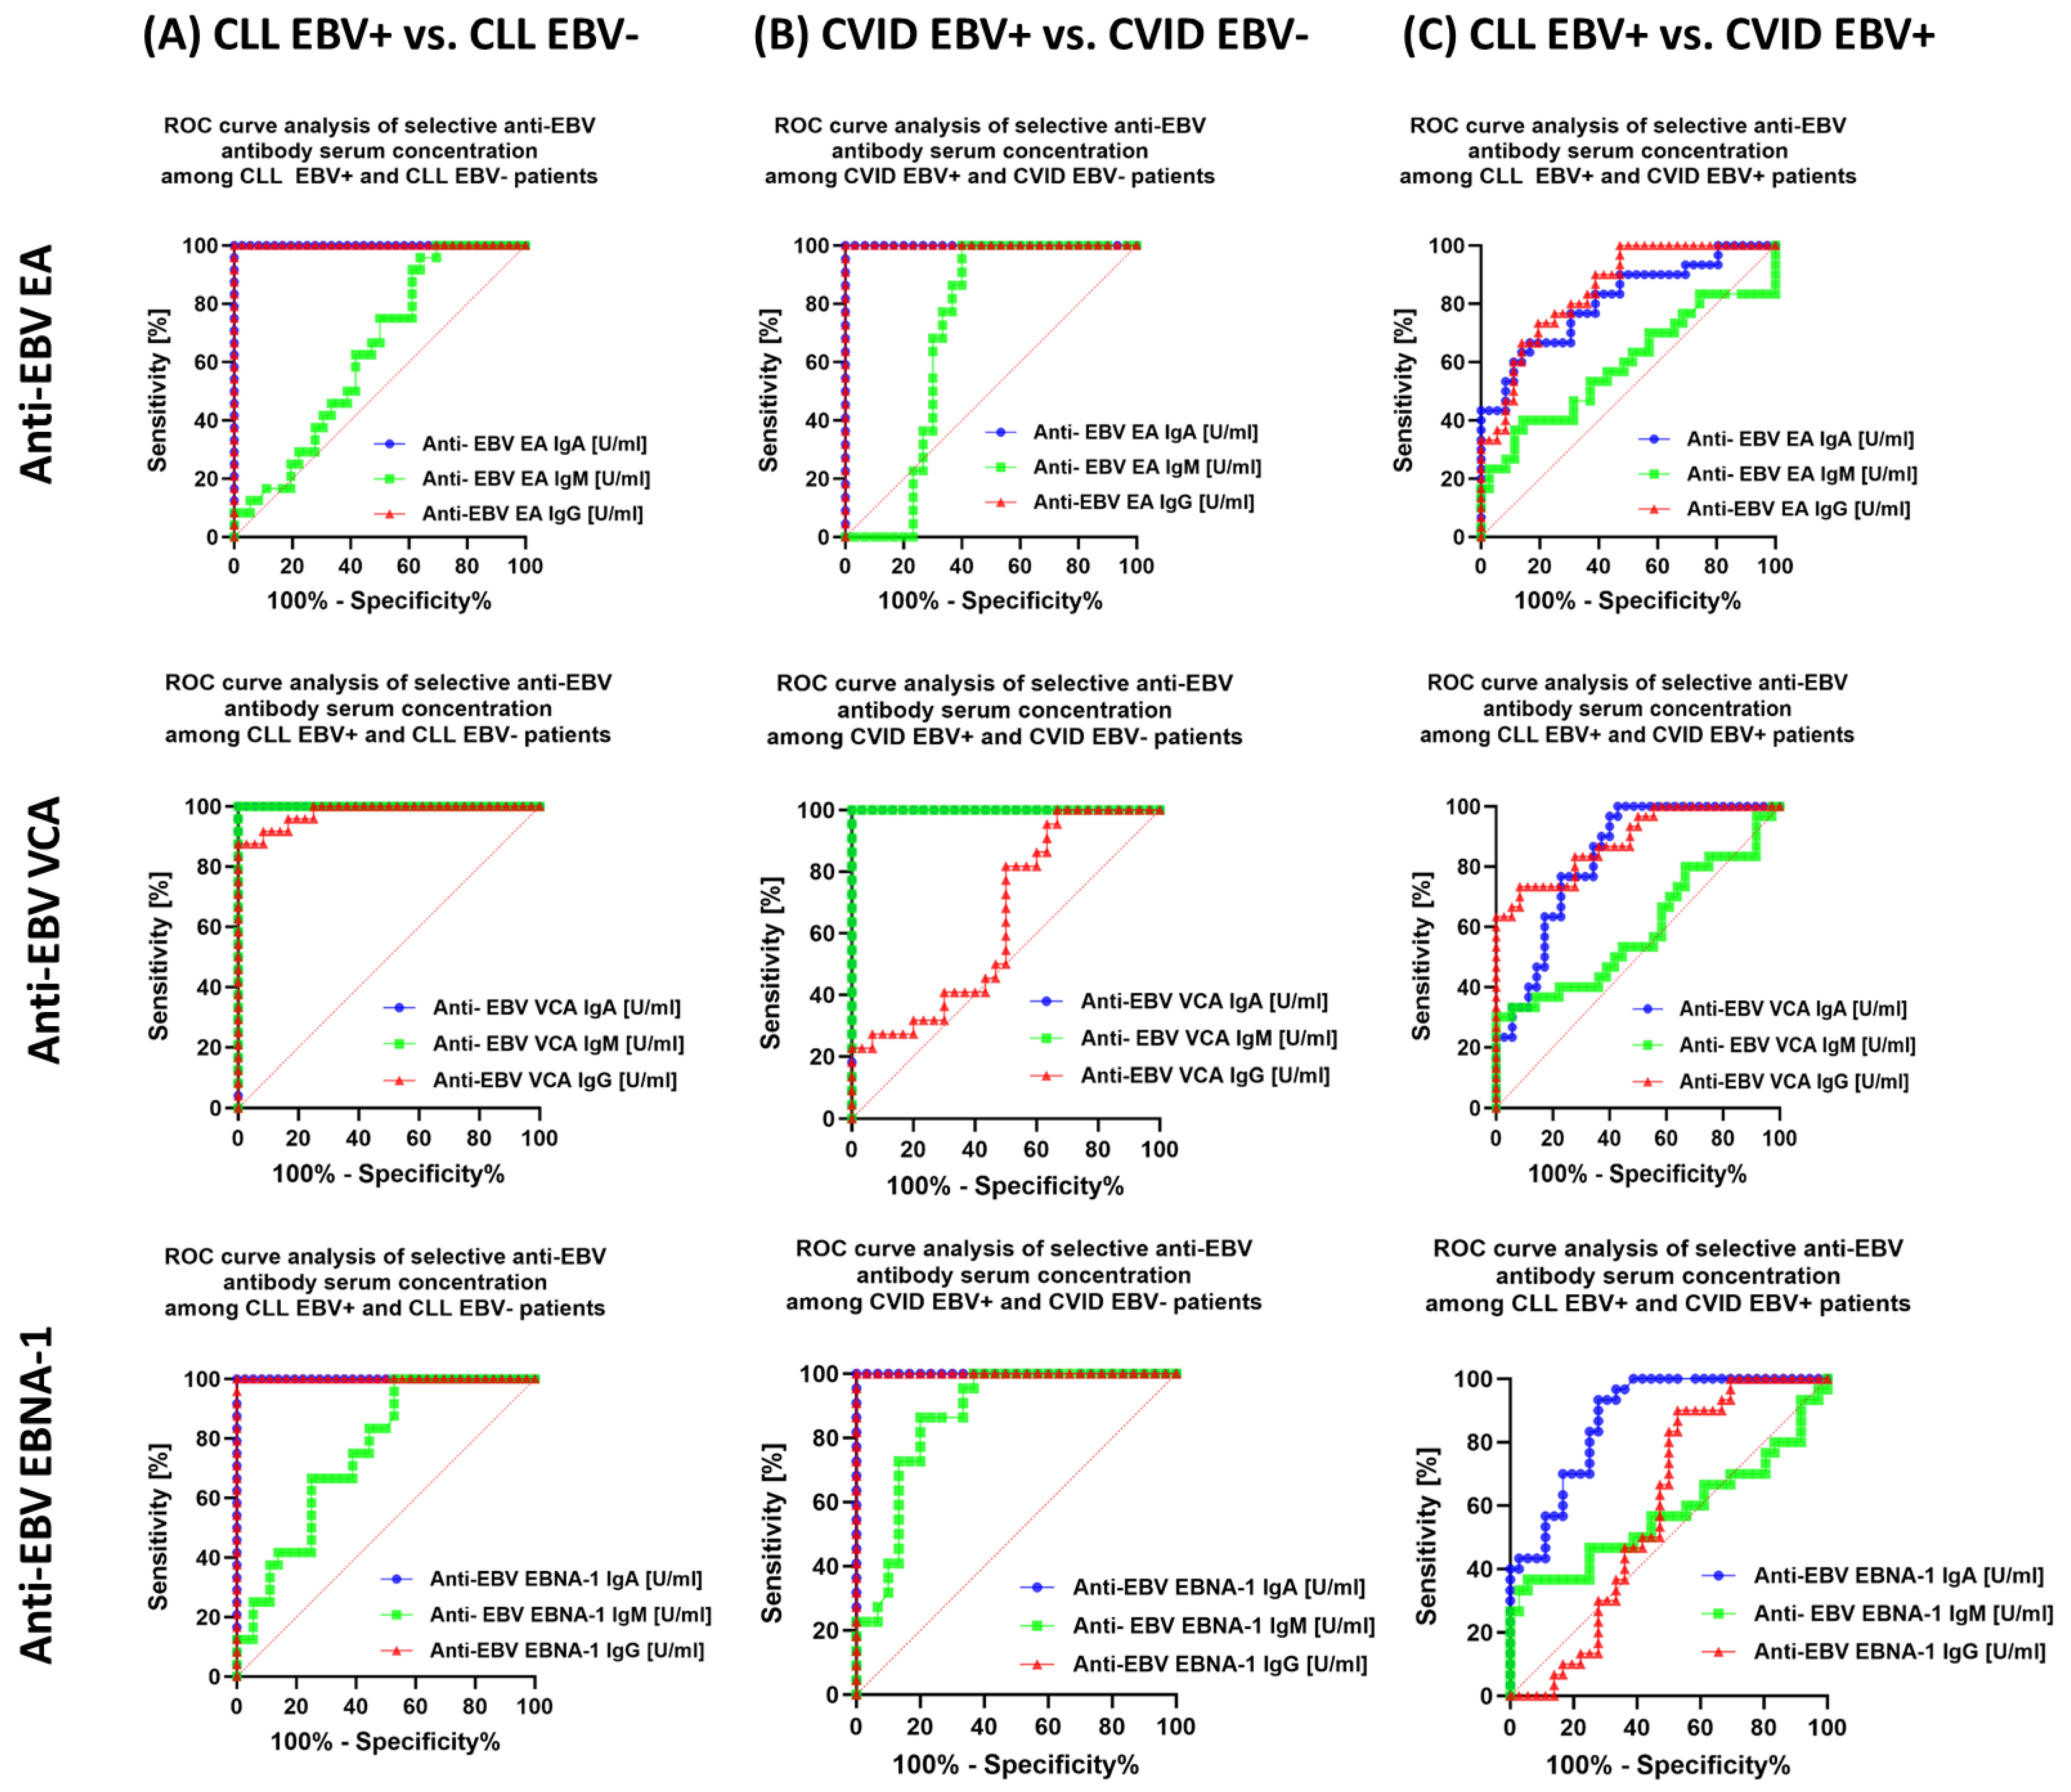
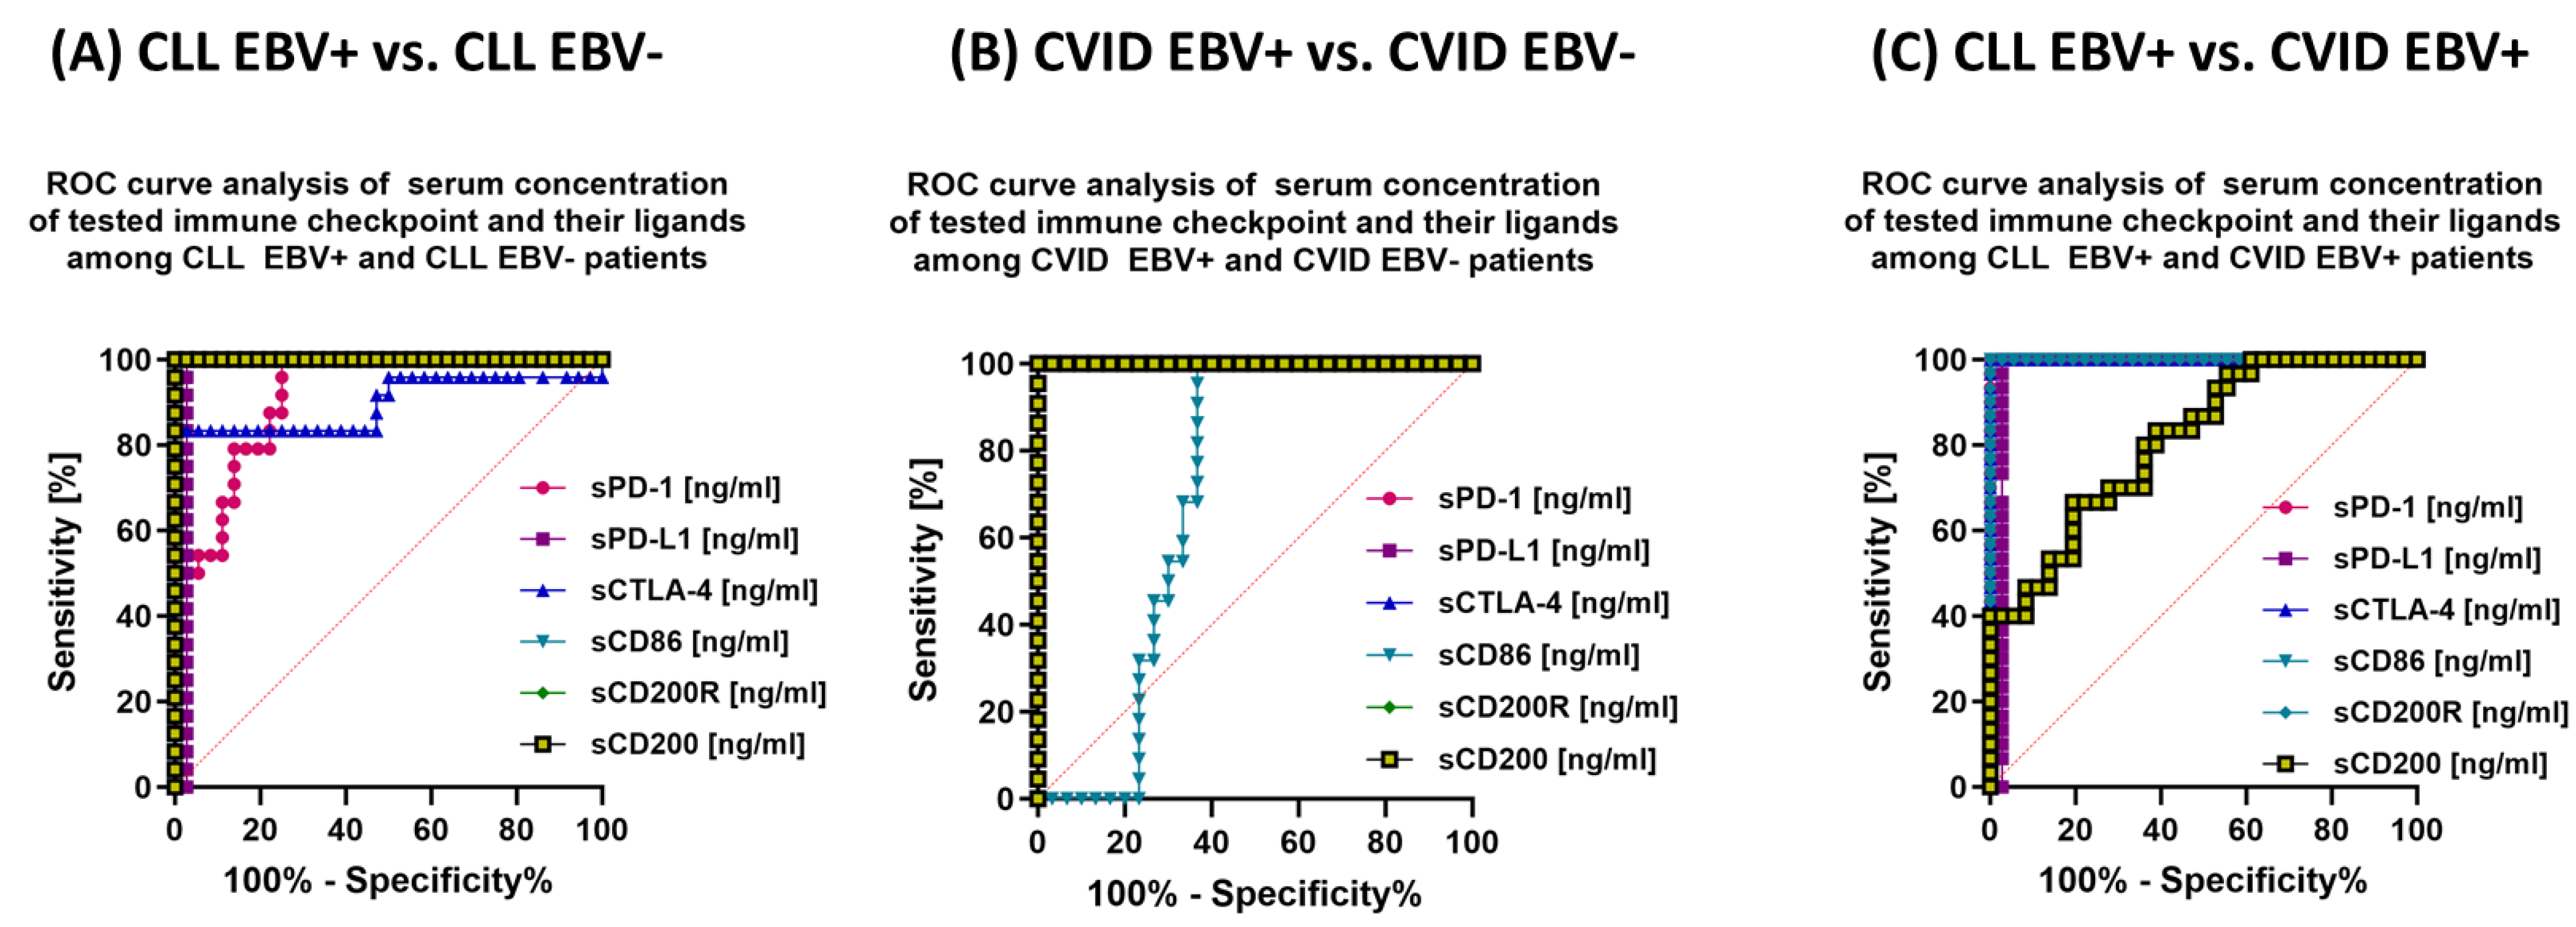
3.5. Can Changes in Selected Parameters of the Immune System in the Context of EBV Reactivation in Patients with CLL and CVID Be a Potential Diagnostic Marker?
4. Discussion
5. Conclusions
Supplementary Materials
Author Contributions
Funding
Institutional Review Board Statement
Informed Consent Statement
Data Availability Statement
Conflicts of Interest
References
- Haas, O.A. Primary Immunodeficiency and Cancer Predisposition Revisited: Embedding Two Closely Related Concepts Into an Integrative Conceptual Framework. Front. Immunol. 2019, 9, 3136. [Google Scholar] [CrossRef]
- Satgé, D. A Tumor Profile in Primary Immune Deficiencies Challenges the Cancer Immune Surveillance Concept. Front. Immunol. 2018, 9, 1149. [Google Scholar] [CrossRef] [PubMed]
- Ballow, M.; Sánchez-Ramón, S.; Walter, J.E. Secondary Immune Deficiency and Primary Immune Deficiency Crossovers: Hematological Malignancies and Autoimmune Diseases. Front. Immunol. 2022, 13, 928062. [Google Scholar] [CrossRef] [PubMed]
- McCusker, C.; Upton, J.; Warrington, R. Primary Immunodeficiency. Allergy Asthma Clin. Immunol. 2018, 14, 61. [Google Scholar] [CrossRef]
- Meyts, I.; Bousfiha, A.; Duff, C.; Singh, S.; Lau, Y.L.; Condino-Neto, A.; Bezrodnik, L.; Ali, A.; Adeli, M.; Drabwell, J. Primary Immunodeficiencies: A Decade of Progress and a Promising Future. Front. Immunol. 2021, 11, 625753. [Google Scholar] [CrossRef] [PubMed]
- Todoric, K.; Koontz, J.B.; Mattox, D.; Tarrant, T.K. Autoimmunity in Immunodeficiency. Curr. Allergy Asthma Rep. 2013, 13, 361–370. [Google Scholar] [CrossRef] [PubMed]
- Cooper, M.A.; Pommering, T.L.; Korányi, K. Primary Immunodeficiencies. AFP 2003, 68, 2001–2009. [Google Scholar]
- Matza Porges, S.; Shamriz, O. Genetics of Immune Dysregulation and Cancer Predisposition: Two Sides of the Same Coin. Clin. Exp. Immunol. 2022, 210, 114–127. [Google Scholar] [CrossRef] [PubMed]
- Mortaz, E.; Tabarsi, P.; Mansouri, D.; Khosravi, A.; Garssen, J.; Velayati, A.; Adcock, I.M. Cancers Related to Immunodeficiencies: Update and Perspectives. Front. Immunol. 2016, 7, 365. [Google Scholar] [CrossRef]
- Verhoeven, D.; Stoppelenburg, A.J.; Meyer-Wentrup, F.; Boes, M. Increased Risk of Hematologic Malignancies in Primary Immunodeficiency Disorders: Opportunities for Immunotherapy. Clin. Immunol. 2018, 190, 22–31. [Google Scholar] [CrossRef]
- Leone, P.; Vacca, A.; Dammacco, F.; Racanelli, V. Common Variable Immunodeficiency and Gastric Malignancies. Int. J. Mol. Sci. 2018, 19, 451. [Google Scholar] [CrossRef]
- Bruns, L.; Panagiota, V.; von Hardenberg, S.; Schmidt, G.; Adriawan, I.R.; Sogka, E.; Hirsch, S.; Ahrenstorf, G.; Witte, T.; Schmidt, R.E.; et al. Common Variable Immunodeficiency-Associated Cancers: The Role of Clinical Phenotypes, Immunological and Genetic Factors. Front. Immunol. 2022, 13, 742530. [Google Scholar] [CrossRef]
- Gangemi, S.; Allegra, A.; Musolino, C. Lymphoproliferative Disease and Cancer among Patients with Common Variable Immunodeficiency. Leuk. Res. 2015, 39, 389–396. [Google Scholar] [CrossRef]
- Kralickova, P.; Milota, T.; Litzman, J.; Malkusova, I.; Jilek, D.; Petanova, J.; Vydlakova, J.; Zimulova, A.; Fronkova, E.; Svaton, M.; et al. CVID-Associated Tumors: Czech Nationwide Study Focused on Epidemiology, Immunology, and Genetic Background in a Cohort of Patients with CVID. Front. Immunol. 2019, 9, 3135. [Google Scholar] [CrossRef]
- Pescador Ruschel, M.A.; Vaqar, S. Common Variable Immunodeficiency. In StatPearls; StatPearls Publishing: Treasure Island, FL, USA, 2023. [Google Scholar]
- Cunningham-Rundles, C. How I Treat Common Variable Immune Deficiency. Blood 2010, 116, 7–15. [Google Scholar] [CrossRef] [PubMed]
- Chawla, S.; Barman, P.; Tyagi, R.; Jindal, A.K.; Sharma, S.; Rawat, A.; Singh, S. Autoimmune Cytopenias in Common Variable Immunodeficiency Are a Diagnostic and Therapeutic Conundrum: An Update. Front. Immunol. 2022, 13, 869466. [Google Scholar] [CrossRef] [PubMed]
- Andersen, J.B.; Midttun, K.; Feragen, K.J.B. Measuring Quality of Life of Primary Antibody Deficiency Patients Using a Disease-Specific Health-Related Quality of Life Questionnaire for Common Variable Immunodeficiency (CVID_QoL). J. Patient-Rep. Outcomes 2019, 3, 15. [Google Scholar] [CrossRef]
- Tak Manesh, A.; Azizi, G.; Heydari, A.; Kiaee, F.; Shaghaghi, M.; Hossein-Khannazer, N.; Yazdani, R.; Abolhassani, H.; Aghamohammadi, A. Epidemiology and Pathophysiology of Malignancy in Common Variable Immunodeficiency? Allergol. Immunopathol. 2017, 45, 602–615. [Google Scholar] [CrossRef] [PubMed]
- Szepanowski, F.; Warnke, C.; Meyer zu Hörste, G.; Mausberg, A.K.; Hartung, H.-P.; Kleinschnitz, C.; Stettner, M. Secondary Immunodeficiency and Risk of Infection Following Immune Therapies in Neurology. CNS Drugs 2021, 35, 1173–1188. [Google Scholar] [CrossRef] [PubMed]
- Allegra, A.; Tonacci, A.; Musolino, C.; Pioggia, G.; Gangemi, S. Secondary Immunodeficiency in Hematological Malignancies: Focus on Multiple Myeloma and Chronic Lymphocytic Leukemia. Front. Immunol. 2021, 12, 738915. [Google Scholar] [CrossRef] [PubMed]
- Arruga, F.; Gyau, B.B.; Iannello, A.; Vitale, N.; Vaisitti, T.; Deaglio, S. Immune Response Dysfunction in Chronic Lymphocytic Leukemia: Dissecting Molecular Mechanisms and Microenvironmental Conditions. Int. J. Mol. Sci. 2020, 21, 1825. [Google Scholar] [CrossRef] [PubMed]
- Moreno, C.; Muñoz, C.; Terol, M.J.; Hernández-Rivas, J.-Á.; Villanueva, M. Restoration of the Immune Function as a Complementary Strategy to Treat Chronic Lymphocytic Leukemia Effectively. J. Exp. Clin. Cancer Res. 2021, 40, 321. [Google Scholar] [CrossRef] [PubMed]
- Goldman, D. Chronic Lymphocytic Leukemia and Its Impact on the Immune System. Clin. J. Oncol. Nurs. 2000, 4, 233–234. [Google Scholar]
- Griggio, V.; Perutelli, F.; Salvetti, C.; Boccellato, E.; Boccadoro, M.; Vitale, C.; Coscia, M. Immune Dysfunctions and Immune-Based Therapeutic Interventions in Chronic Lymphocytic Leukemia. Front. Immunol. 2020, 11, 594556. [Google Scholar] [CrossRef] [PubMed]
- He, R.; Ding, W.; Viswanatha, D.S.; Chen, D.; Shi, M.; Van Dyke, D.; Tian, S.; Dao, L.N.; Parikh, S.A.; Shanafelt, T.D.; et al. PD-1 Expression in Chronic Lymphocytic Leukemia/Small Lymphocytic Lymphoma (CLL/SLL) and Large B-Cell Richter Transformation (DLBCL-RT): A Characteristic Feature of DLBCL-RT and Potential Surrogate Marker for Clonal Relatedness. Am. J. Surg. Pathol. 2018, 42, 843–854. [Google Scholar] [CrossRef] [PubMed]
- Landego, I.; Hewitt, D.; Hibbert, I.; Dhaliwal, D.; Pieterse, W.; Grenier, D.; Wong, R.; Johnston, J.; Banerji, V. PD-1 Inhibition in Malignant Melanoma and Lack of Clinical Response in Chronic Lymphocytic Leukemia in the Same Patients: A Case Series. Curr. Oncol. 2020, 27, 169–172. [Google Scholar] [CrossRef] [PubMed]
- Mittal, A.K.; Chaturvedi, N.K.; Rohlfsen, R.A.; Gupta, P.; Joshi, A.D.; Hegde, G.V.; Bociek, R.G.; Joshi, S.S. Role of CTLA4 in the Proliferation and Survival of Chronic Lymphocytic Leukemia. PLoS ONE 2013, 8, e70352. [Google Scholar] [CrossRef] [PubMed]
- Do, P.; Beckwith, K.A.; Cheney, C.; Tran, M.; Beaver, L.; Griffin, B.G.; Mo, X.; Liu, Y.; Lapalombella, R.; Hertlein, E.; et al. Leukemic B Cell CTLA-4 Suppresses Costimulation of T Cells. J. Immunol. 2019, 202, 2806–2816. [Google Scholar] [CrossRef]
- Mbemi, A.; Khanna, S.; Njiki, S.; Yedjou, C.G.; Tchounwou, P.B. Impact of Gene–Environment Interactions on Cancer Development. Int. J. Environ. Res. Public. Health 2020, 17, 8089. [Google Scholar] [CrossRef]
- Greten, F.R.; Grivennikov, S.I. Inflammation and Cancer: Triggers, Mechanisms and Consequences. Immunity 2019, 51, 27–41. [Google Scholar] [CrossRef]
- Biggi, A.F.B.; Elgui de Oliveira, D. The Epstein-Barr Virus Hacks Immune Checkpoints: Evidence and Consequences for Lymphoproliferative Disorders and Cancers. Biomolecules 2022, 12, 397. [Google Scholar] [CrossRef] [PubMed]
- Sundaresan, B.; Shirafkan, F.; Ripperger, K.; Rattay, K. The Role of Viral Infections in the Onset of Autoimmune Diseases. Viruses 2023, 15, 782. [Google Scholar] [CrossRef] [PubMed]
- Piccaluga, P.P.; Weber, A.; Ambrosio, M.R.; Ahmed, Y.; Leoncini, L. Epstein–Barr Virus-Induced Metabolic Rearrangements in Human B-Cell Lymphomas. Front. Microbiol. 2018, 9, 1233. [Google Scholar] [CrossRef]
- Hoover, K.; Higginbotham, K. Epstein-Barr Virus. In StatPearls; StatPearls Publishing: Treasure Island, FL, USA, 2023. [Google Scholar]
- Houen, G.; Trier, N.H. Epstein-Barr Virus and Systemic Autoimmune Diseases. Front. Immunol. 2021, 11, 587380. [Google Scholar] [CrossRef] [PubMed]
- Yu, H.; Robertson, E.S. Epstein–Barr Virus History and Pathogenesis. Viruses 2023, 15, 714. [Google Scholar] [CrossRef]
- Bakkalci, D.; Jia, Y.; Winter, J.R.; Lewis, J.E.; Taylor, G.S.; Stagg, H.R. Risk Factors for Epstein Barr Virus-Associated Cancers: A Systematic Review, Critical Appraisal, and Mapping of the Epidemiological Evidence. J. Glob. Health 2020, 10, 010405. [Google Scholar] [CrossRef]
- Patel, P.D.; Alghareeb, R.; Hussain, A.; Maheshwari, M.V.; Khalid, N. The Association of Epstein-Barr Virus with Cancer. Cureus 2022, 14, e26314. [Google Scholar] [CrossRef]
- Chakravorty, S.; Afzali, B.; Kazemian, M. EBV-Associated Diseases: Current Therapeutics and Emerging Technologies. Front. Immunol. 2022, 13, 1059133. [Google Scholar] [CrossRef]
- Chang, M.S.; Kim, W.H. Epstein-Barr Virus in Human Malignancy: A Special Reference to Epstein-Barr Virus Associated Gastric Carcinoma. Cancer Res. Treat. 2005, 37, 257–267. [Google Scholar] [CrossRef][Green Version]
- Shen, Y.; Zhang, S.; Sun, R.; Wu, T.; Qian, J. Understanding the Interplay between Host Immunity and Epstein-Barr Virus in NPC Patients. Emerg. Microbes Infect. 2015, 4, e20. [Google Scholar] [CrossRef]
- Chen, M.-R. Epstein–Barr Virus, the Immune System, and Associated Diseases. Front. Microbiol. 2011, 2, 5. [Google Scholar] [CrossRef] [PubMed]
- Gamaleldin, M.A.; Ghallab, O.M.; Nadwan, E.A.; Abo Elwafa, R.A. PD-1 and PD-L1 Gene Expressions and Their Association with Epstein-Barr Virus Infection in Chronic Lymphocytic Leukemia. Clin. Transl. Oncol. 2021, 23, 2309–2322. [Google Scholar] [CrossRef] [PubMed]
- Malpica, L.; Marques-Piubelli, M.L.; Beltran, B.E.; Chavez, J.C.; Miranda, R.N.; Castillo, J.J. EBV-Positive Diffuse Large B-Cell Lymphoma, Not Otherwise Specified: 2022 Update on Diagnosis, Risk-Stratification, and Management. Am. J. Hematol. 2022, 97, 951–965. [Google Scholar] [CrossRef] [PubMed]
- Ozturk, V.; Yikilmaz, A.S.; Kilicarslan, A.; Bakanay, S.M.; Akinci, S.; Dilek, İ. The Triple Positivity for EBV, PD-1, and PD-L1 Identifies a Very High Risk Classical Hodgkin Lymphoma. Clin. Lymphoma Myeloma Leuk. 2020, 20, e375–e381. [Google Scholar] [CrossRef]
- Gu, L.; Chen, M.; Guo, D.; Zhu, H.; Zhang, W.; Pan, J.; Zhong, X.; Li, X.; Qian, H.; Wang, X. PD-L1 and Gastric Cancer Prognosis: A Systematic Review and Meta-Analysis. PLoS ONE 2017, 12, e0182692. [Google Scholar] [CrossRef]
- Liu, X.; Choi, M.G.; Kim, K.; Kim, K.-M.; Kim, S.T.; Park, S.H.; Cristescu, R.; Peter, S.; Lee, J. High PD-L1 Expression in Gastric Cancer (GC) Patients and Correlation with Molecular Features. Pathol. Res. Pract. 2020, 216, 152881. [Google Scholar] [CrossRef]
- Zhang, W.-T.; Zhu, G.-L.; Xu, W.-Q.; Zhang, W.; Wang, H.-Z.; Wang, Y.-B.; Li, Y.-X. Association of PD-1/PD-L1 Expression and Epstein--Barr Virus Infection in Patients with Invasive Breast Cancer. Diagn. Pathol. 2022, 17, 61. [Google Scholar] [CrossRef]
- Zhou, Y.; Shi, D.; Miao, J.; Wu, H.; Chen, J.; Zhou, X.; Hu, D.; Zhao, C.; Deng, W.; Xie, C. PD-L1 Predicts Poor Prognosis for Nasopharyngeal Carcinoma Irrespective of PD-1 and EBV-DNA Load. Sci. Rep. 2017, 7, 43627. [Google Scholar] [CrossRef]
- Grywalska, E.; Mielnik, M.; Podgajna, M.; Hymos, A.; Ludian, J.; Rolińska, A.; Gosik, K.; Kwaśniewski, W.; Sosnowska-Pasiarska, B.; Smok-Kalwat, J.; et al. Expression of CTLA-4 and CD86 Antigens and Epstein-Barr Virus Reactivation in Chronic Lymphocytic Leukemia—Any Link with Known Prognostic Factors? Cancers 2022, 14, 672. [Google Scholar] [CrossRef]
- Ma, S.-D.; Xu, X.; Jones, R.; Delecluse, H.-J.; Zumwalde, N.A.; Sharma, A.; Gumperz, J.E.; Kenney, S.C. PD-1/CTLA-4 Blockade Inhibits Epstein-Barr Virus-Induced Lymphoma Growth in a Cord Blood Humanized-Mouse Model. PLOS Pathog. 2016, 12, e1005642. [Google Scholar] [CrossRef]
- Bai, Y.; Xie, T.; Wang, Z.; Tong, S.; Zhao, X.; Zhao, F.; Cai, J.; Wei, X.; Peng, Z.; Shen, L. Efficacy and Predictive Biomarkers of Immunotherapy in Epstein-Barr Virus-Associated Gastric Cancer. J. Immunother. Cancer 2022, 10, e004080. [Google Scholar] [CrossRef] [PubMed]
- An, G.; He, X.C.; Bai, J.; Wang, J. Immune Checkpoint Inhibitors Are Effective in the Treatment of Epstein-Barr Virus-Associated Gastric Cancer: A Case Report. Medicine 2023, 102, e33377. [Google Scholar] [CrossRef] [PubMed]
- Aran, A.; Peg, V.; Rabanal, R.M.; Bernadó, C.; Zamora, E.; Molina, E.; Arribas, Y.A.; Arribas, J.; Pérez, J.; Roura-Mir, C.; et al. Epstein–Barr Virus+ B Cells in Breast Cancer Immune Response: A Case Report. Front. Immunol. 2021, 12, 761798. [Google Scholar] [CrossRef] [PubMed]
- Han, S.; Tay, J.K.; Loh, C.J.L.; Chu, A.J.M.; Yeong, J.P.S.; Lim, C.M.; Toh, H.C. Epstein–Barr Virus Epithelial Cancers—A Comprehensive Understanding to Drive Novel Therapies. Front. Immunol. 2021, 12, 734293. [Google Scholar] [CrossRef]
- Batuello, C.; Mason, E.F. Diagnostic Utility of CD200 Immunohistochemistry in Distinguishing EBV-Positive Large B-Cell Lymphoma From Classic Hodgkin Lymphoma. Am. J. Clin. Pathol. 2023, 160, aqad053. [Google Scholar] [CrossRef]
- Cocks, B.G.; Chang, C.C.; Carballido, J.M.; Yssel, H.; de Vries, J.E.; Aversa, G. A Novel Receptor Involved in T-Cell Activation. Nature 1995, 376, 260–263. [Google Scholar] [CrossRef]
- Shabani, M.; Nichols, K.E.; Rezaei, N. Primary Immunodeficiencies Associated with EBV-Induced Lymphoproliferative Disorders. Crit. Rev. Oncol. Hematol. 2016, 108, 109–127. [Google Scholar] [CrossRef]
- Alkhairy, O.K.; Perez-Becker, R.; Driessen, G.J.; Abolhassani, H.; van Montfrans, J.; Borte, S.; Choo, S.; Wang, N.; Tesselaar, K.; Fang, M.; et al. Novel Mutations in TNFRSF7/CD27: Clinical, Immunologic, and Genetic Characterization of Human CD27 Deficiency. J. Allergy Clin. Immunol. 2015, 136, 703–712.e10. [Google Scholar] [CrossRef]
- Winter, S.; Martin, E.; Boutboul, D.; Lenoir, C.; Boudjemaa, S.; Petit, A.; Picard, C.; Fischer, A.; Leverger, G.; Latour, S. Loss of RASGRP1 in Humans Impairs T-Cell Expansion Leading to Epstein-Barr Virus Susceptibility. EMBO Mol. Med. 2018, 10, 188–199. [Google Scholar] [CrossRef]
- Somekh, I.; Marquardt, B.; Liu, Y.; Rohlfs, M.; Hollizeck, S.; Karakukcu, M.; Unal, E.; Yilmaz, E.; Patiroglu, T.; Cansever, M.; et al. Novel Mutations in RASGRP1 Are Associated with Immunodeficiency, Immune Dysregulation, and EBV-Induced Lymphoma. J. Clin. Immunol. 2018, 38, 699–710. [Google Scholar] [CrossRef]
- Borst, J.; Hendriks, J.; Xiao, Y. CD27 and CD70 in T Cell and B Cell Activation. Curr. Opin. Immunol. 2005, 17, 275–281. [Google Scholar] [CrossRef] [PubMed]
- Izawa, K.; Martin, E.; Soudais, C.; Bruneau, J.; Boutboul, D.; Rodriguez, R.; Lenoir, C.; Hislop, A.D.; Besson, C.; Touzot, F.; et al. Inherited CD70 Deficiency in Humans Reveals a Critical Role for the CD70-CD27 Pathway in Immunity to Epstein-Barr Virus Infection. J. Exp. Med. 2017, 214, 73–89. [Google Scholar] [CrossRef] [PubMed]
- Moshous, D.; Martin, E.; Carpentier, W.; Lim, A.; Callebaut, I.; Canioni, D.; Hauck, F.; Majewski, J.; Schwartzentruber, J.; Nitschke, P.; et al. Whole-Exome Sequencing Identifies Coronin-1A Deficiency in 3 Siblings with Immunodeficiency and EBV-Associated B-Cell Lymphoproliferation. J. Allergy Clin. Immunol. 2013, 131, 1594–1603. [Google Scholar] [CrossRef]
- Shiow, L.R.; Roadcap, D.W.; Paris, K.; Watson, S.R.; Grigorova, I.L.; Lebet, T.; An, J.; Xu, Y.; Jenne, C.N.; Föger, N.; et al. The Actin Regulator Coronin 1A Is Mutant in a Thymic Egress-Deficient Mouse Strain and in a Patient with Severe Combined Immunodeficiency. Nat. Immunol. 2008, 9, 1307–1315. [Google Scholar] [CrossRef] [PubMed]
- Abdollahpour, H.; Appaswamy, G.; Kotlarz, D.; Diestelhorst, J.; Beier, R.; Schäffer, A.A.; Gertz, E.M.; Schambach, A.; Kreipe, H.H.; Pfeifer, D.; et al. The Phenotype of Human STK4 Deficiency. Blood 2012, 119, 3450–3457. [Google Scholar] [CrossRef] [PubMed]
- Halacli, S.O.; Ayvaz, D.C.; Sun-Tan, C.; Erman, B.; Uz, E.; Yilmaz, D.Y.; Ozgul, K.; Tezcan, İ.; Sanal, O. STK4 (MST1) Deficiency in Two Siblings with Autoimmune Cytopenias: A Novel Mutation. Clin. Immunol. 2015, 161, 316–323. [Google Scholar] [CrossRef] [PubMed]
- Lucas, C.L.; Kuehn, H.S.; Zhao, F.; Niemela, J.E.; Deenick, E.K.; Palendira, U.; Avery, D.T.; Moens, L.; Cannons, J.L.; Biancalana, M.; et al. Dominant-Activating Germline Mutations in the Gene Encoding the PI(3)K Catalytic Subunit P110δ Result in T Cell Senescence and Human Immunodeficiency. Nat. Immunol. 2014, 15, 88–97. [Google Scholar] [CrossRef]
- Carpier, J.-M.; Lucas, C.L. Epstein-Barr Virus Susceptibility in Activated PI3Kδ Syndrome (APDS) Immunodeficiency. Front. Immunol. 2017, 8, 2005. [Google Scholar] [CrossRef]
- Palendira, U.; Rickinson, A.B. Primary Immunodeficiencies and the Control of Epstein–Barr Virus Infection. Ann. N.Y. Acad. Sci. 2015, 1356, 22–44. [Google Scholar] [CrossRef]

| Antibody Serum Concentration [U/mL] | CLL | CVID | HV | p-Value | p-Value | |||||||||||||
|---|---|---|---|---|---|---|---|---|---|---|---|---|---|---|---|---|---|---|
| EBV+ (Group 1) | EBV− (Group 2) | EBV+ (Group 3) | EBV+ (Group 4) | EBV− (Group 5) | ||||||||||||||
| Mean ± SD | Median (Range) | Mean ± SD | Median (Range) | Mean ± SD | Median (Range) | Mean ± SD | Median (Range) | Mean ± SD | Median (Range) | 1 vs. 2 | 1 vs. 3 | 1 vs. 4 | 2 vs. 3 | 3 vs. 4 | 2 vs. 4 | |||
| Anti-EBV EA | IgA | 59.10 ± 10.19 | 61.86 (40.21–73.83) | 3.30 ± 1.19 | 3.50 (1.21–4.96) | 45.52 ± 11.51 | 43.89 (30.98–69.49) | 4.82 ± 1.11 | 4.61 (3.07–6.70) | 4.84± 1.41 | 5.10 (2.29–6.96) | 0.000 * | 0.000 * | 0.000 * | 0.000 * | 0.000 * | 0.000 * | 0.000 * |
| IgM | 5.77 ±1.81 | 5.78 (3.15–8.72) | 4.87 ± 1.30 | 5.02 (2.21–6.77) | 6.35 ± 2.48 | 6.49 (2.06–9.74) | 4.86 ± 0.51 | 4.75 (4.06–5.85) | 4.96± 1.03 | 4.82 (3.15–6.98) | 0.000 * | 0.086 | 0.240 | 0.122 | 0.017 * | 0.015 * | 0.973 | |
| IgG | 93.32 ± 15.98 | 91.95 (63.77–119.75) | 5.24 ± 1.11 | 5.07 (3.09–6.97) | 70.82 ± 12.88 | 71.62 (52.58–91.21) | 4.26 ± 1.05 | 4.32 (2.20–5.95) | 3.72± 1.20 | 3.35 (2.16–5.96) | 0.000 * | 0.000 * | 0.000 * | 0.000 * | 0.000 * | 0.000 * | 0.001 * | |
| Anti-EBV VCA | IgA | 22.98 ± 5.23 | 23.11 (13.84–31.13) | 5.75 ± 1.48 | 6.34 (3.03–7.88) | 16.71± 2.77 | 16.69 (12.50–21.93) | 3.01 ± 1.08 | 3.04 (1.05–4.91) | 4.93 ± 1.08 | 4.92 (3.07–6.80) | 0.000 * | 0.000 * | 0.000 * | 0.000 * | 0.000 * | 0.000 * | 0.000 * |
| IgM | 45.46 ± 6.98 | 43.87 (33.73–58.09) | 5.89 ± 1.29 | 5.95 (4.11–7.59) | 42.19 ± 9.59 | 43.31 (26.01–56.58) | 4.58 ± 1.67 | 4.48 (2.22–696) | 5.33 ± 1.88 | 5.19 (2.19–8.83) | 0.000 * | 0.000 * | 0.215 | 0.000 * | 0.000 * | 0.000 * | 0.005 * | |
| IgG | 219.64 ± 22.14 | 219.51 (185.99–255.95) | 139.19 ± 32.30 | 138.74 (94.93–199.21) | 172.62 ± 29.08 | 170.33 (130.57–222.41) | 155.22 ± 23.27 | 160.77 (113.07–189.16) | 109.50 ± 22.37 | 111.28 (75.07–151.11) | 0.000 * | 0.000 * | 0.000 * | 0.000 * | 0.000 * | 0.007 * | 0.065 | |
| Anti-EBV EBNA-1 | IgA | 16.30 ± 1.70 | 16.51 (13.01–18.77) | 5.04 ± 0.55 | 4.95 (4.33–5.95) | 13.81 ± 1.15 | 13.79 (12.03–15.87) | 2.90 ± 0.99 | 3.25 (1.02–4.62) | 3.36 ± 1.33 | 3.20 (1.22–5.77) | 0.000 * | 0.000 * | 0.000 * | 0.000 * | 0.000 * | 0.000 * | 0.000 * |
| IgM | 7.84 ± 1.54 | 7.76 (5.13–10.54) | 6.41 ± 1.05 | 6.53 (4.21–7.98) | 7.13 ± 2.45 | 7.27 (2.73–10.63) | 3.97 ± 1.01 | 4.12 (2.47–5.66) | 5.12 ± 1.37 | 4.88 (3.14–7.96) | 0.000 * | 0.000 * | 0.290 | 0.000 * | 0.265 | 0.000 * | 0.000 * | |
| IgG | 242.84 ± 29.34 | 249.15 (194.57–294.76) | 60.66 ± 12.75 | 60.91 (41.42–78.80) | 235.62 ± 16.08 | 240.70 (207.77–259.26) | 67.27 ± 6.98 | 67.26 (52.78–79.56) | 61.46 ± 9.94 | 59.40 (45.62–78.50) | 0.000 * | 0.000 * | 0.197 | 0.000 * | 0.000 * | 0.000 * | 0.132 | |
| CLL | CVID | HV | p-Value | ||||||||
|---|---|---|---|---|---|---|---|---|---|---|---|
| EBV+ | EBV− | EBV+ | EBV− | EBV− | |||||||
| Mean ± SD | Median (Range) | Mean ± SD | Median (Range) | Mean ± SD | Median (Range) | Mean ± SD | Median (Range) | Mean ± SD | Median (Range) | ||
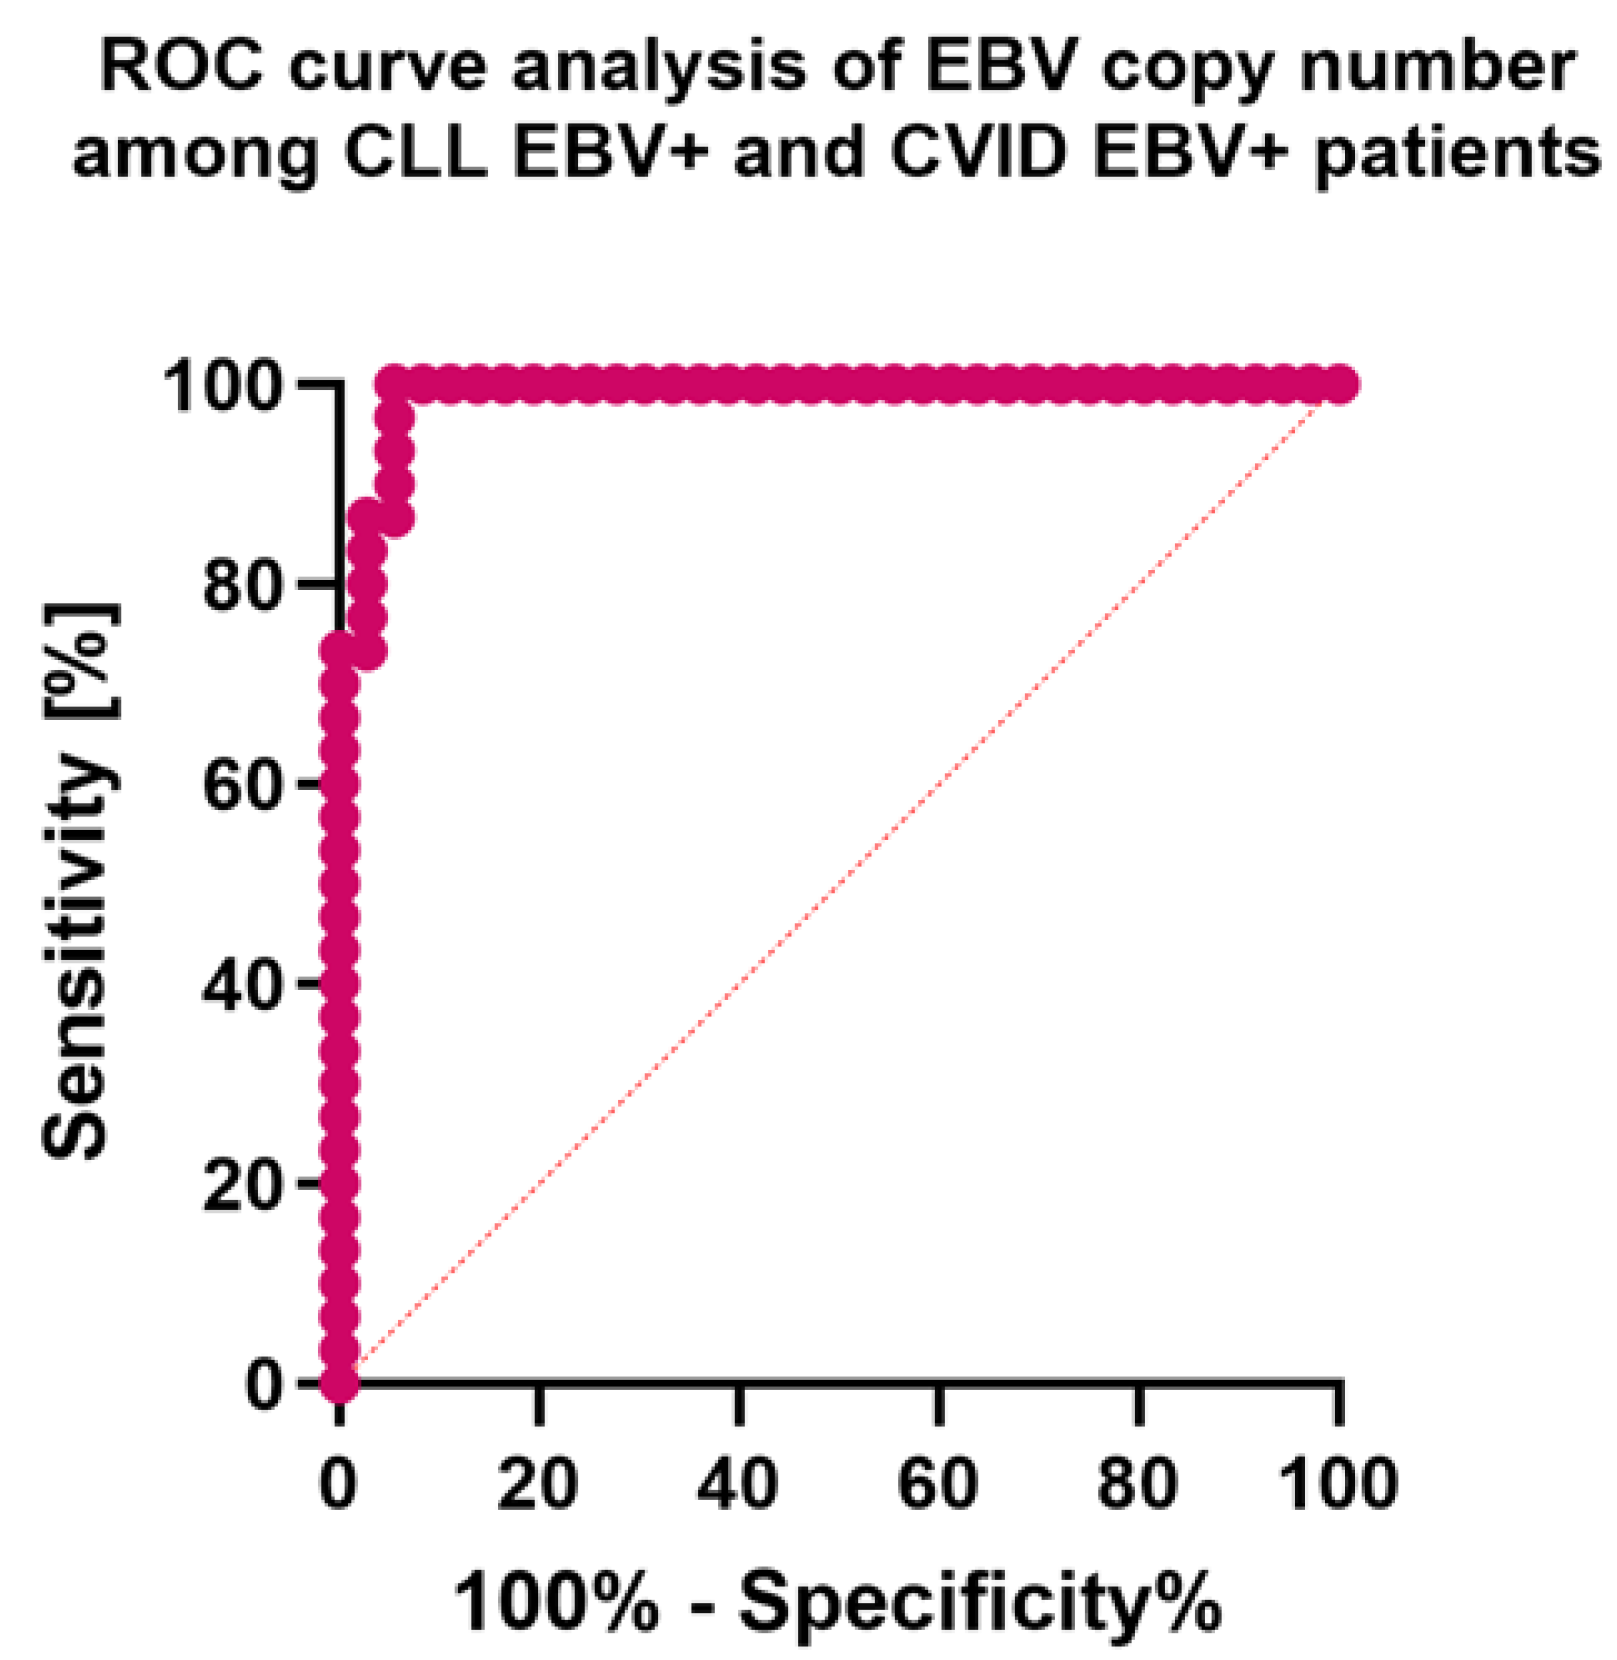
| EBV copy numer | 794.21 ± 56.61 | 800.24 (676.35–898.53) | N/A | N/A | 633.98 ± 53.69 | 638.89 (528.93–710.49) | N/A | N/A | N/A | N/A | 0.000 * |
| Parameter | CLL | CVID | HV | p-Value | p-Value | ||||||||||||
|---|---|---|---|---|---|---|---|---|---|---|---|---|---|---|---|---|---|
| EBV+ (Group 1) | EBV− (Group 2) | EBV+ (Group 3) | EBV− (Group 4) | EBV− (Group 5) | |||||||||||||
| Mean ± SD | Median (Range) | Mean ± SD | Median (Range) | Mean ± SD | Median (Range) | Mean ± SD | Median (Range) | Mean ± SD | Median (Range) | 1 vs. 2 | 1 vs. 3 | 1 vs. 4 | 2 vs. 3 | 3 vs. 4 | 2 vs. 4 | ||
| WBC | 28.38 ± 4.22 | 28.57 (20.50–36.21) | 26.00 ± 2.95 | 25.07 (22.23–32.38) | 5.94 ± 0.53 | 6.00 (5.04–6.98) | 6.44 ± 0.79 | 6.20 (5.37–7.73) | 5.02 ± 0.43 | 4.97 (4.28–5.82) | 0.000 * | 0.032 * | 0.000 * | 0.000 * | 0.000 * | 0.003 * | 0.000 * |
| LYM | 27.33 ± 4.96 | 27.65 (19.35–36.21) | 19.91 ± 7.23 | 21.10 (5.88–29.09) | 1.18 ± 0.73 | 1.01 (0.09–2.88) | 1.56 ± 0.69 | 1.53 (0.33–2.86) | 2.09 ± 0.50 | 2.14 (1.03–2.94) | 0.000 * | 0.000 * | 0.000 * | 0.000 * | 0.000 * | 0.003 * | 0.000 * |
| MON | 1.16 ± 0.59 | 1.24 (0.02–1.97) | 0.54 ± 0.29 | 0.52 (0.10–0.98) | 0.51 ± 0.29 | 0.50 (0.01–0.98) | 0.83 ± 0.43 | 0.90 (0.01–1.54) | 0.63 ± 0.25 | 0.65 (0.14–0.95) | 0.000 * | 0.000 * | 0.000 * | 0.026 * | 0.820 | 0.005 * | 0.000 * |
| NEU | 2.51 ± 0.87 | 2.48 (1.06–3.93) | 2.24 ± 0.88 | 2.06 (1.12–385) | 0.96 ± 0.60 | 0.91 (0.03–2.00) | 1.02 ± 0.60 | 0.97 (0.03–1.97) | 2.63 ± 0.99 | 2.49 (1.10–3.99) | 0.000 * | 0.204 | 0.000 * | 0.000 * | 0.000 * | 0.761 | 0.000 * |
| RBC | 3.22 ± 0.54 | 3.44 (2.01–3.98) | 3.44 ± 0.88 | 3.37 (20.6–4.94) | 2.89 ± 0.54 | 2.92 (2.06–3.97) | 3.07 ± 0.59 | 3.18 (1.67–3.99) | 4.78 ± 0.90 | 4.91 (3.10–6.02) | 0.000 * | 0.422 | 0.000 * | 0.368 | 0.02 * | 0.180 | 0.190 |
| HGB | 9.08 ± 1.33 | 9.27 (7.01–10.99) | 10.49 ± 1.46 | 10.30 (8.06–12.72) | 9.06 ± 0.59 | 9.02 (8.07–9.98) | 10.15 ± 1.17 | 10.53 (8.25–11.77) | 13.96 ± 1.42 | 14.44 (11.08–15.95) | 0.000 * | 0.001 * | 0.822 | 0.000 * | 0.000 * | 0.001 * | 0.376 |
| PLT | 130.36 ± 11.21 | 131.04 (111.68–147.84) | 159.31 ± 22.24 | 166.06 (121.23–187.19) | 108.70 ± 12.03 | 109.15 (87.00–127.39) | 134.57 ± 7.86 | 131.91 (123.49–147.92) | 280.04 ± 69.73 | 304.53 (143.11–378.16) | 0.000 * | 0.000 * | 0.000 * | 0.204 | 0.000 * | 0.000 * | 0.000 * |
| IgG | 6.01 ± 1.72 | 6.22 (3.10–8.80) | 5.87 ± 1.10 | 5.76 (4.10–7.97) | 2.42 ± 0.88 | 2.23 (1.08–3.80) | 3.72 ± 1.15 | 3.49 (2.09–5.87) | 11.49 ± 2.66 | 11.41 (7.24–15.69) | 0.000 * | 0.770 | 0.000 * | 0.000 * | 0.000 * | 0.000 * | 0.000 * |
| IgM | 2.03 ± 1.22 | 1.91 (0.10–3.95) | 0.96 ± 0.63 | 0.95 (0.01–1.99) | 1.13 ± 0.49 | 1.07 (0.18–1.94) | 1.04 ± 0.57 | 1.12 (0.25–1.95) | 2.11 ± 0.57 | 2.02 (1.12–2.95) | 0.000 * | 0.001 * | 0.000 * | 0.000 * | 0.303 | 0.490 | 0.670 |
| IgA | 0.48 ± 0.23 | 0.50 (0.09–0.98) | 0.48 ± 0.25 | 0.50 (0.06–0.83) | 0.58 ± 0.25 | 0.54 (0.06–1.00) | 0.52 ± 0.31 | 0.56 (0.02–0.96) | 2.85 ± 0.95 | 3.19 (1.02–3.97) | 0.000 * | 0.875 | 0.140 | 0.650 | 0.208 | 0.587 | 0.578 |
| Parameter | CLL | CVID | HV | p-Value | p-Value | ||||||||||||
|---|---|---|---|---|---|---|---|---|---|---|---|---|---|---|---|---|---|
| EBV+ (Group 1) | EBV− (Group 2) | EBV+ (Group 3) | EBV− (Group 4) | EBV− (Group 5) | |||||||||||||
| Mean ± SD | Median (Range) | Mean ± SD | Median (Range) | Mean ± SD | Median (Range) | Mean ± SD | Median (Range) | Mean ± SD | Median (Range) | 1 vs. 2 | 1 vs. 3 | 1 vs. 4 | 2 vs. 3 | 3 vs. 4 | 2 vs. 4 | ||
| CD45+ [%] | 91.08 ± 4.31 | 91.35 (82.29–97.33) | 93.09 ± 3.05 | 92.02 (88.50–97.84) | 88.31 ± 4.93 | 87.35 (80.33–97.12) | 88.75 ± 4.73 | 88.70 (80.16–96.73) | 93.97 ± 2.35 | 94.38 (90.38–97.91) | 0.000 * | 0.100 | 0.000 * | 0.079 | 0.000 * | 0.692 | 0.000 * |
| CD3+ [%] | 23.52 ± 8.29 | 23.56 (10.73–37.76) | 18.32 ± 4.45 | 19.47 (10.11–25.07) | 65.45 ± 14.83 | 65.27 (44.27–88.20) | 62.42 ± 8.84 | 61.26 (46.42–77.87) | 78.18 ± 8.94 | 75.16 (65.42–91.94) | 0.000 * | 0.03 * | 0.000 * | 0.000 * | 0.001 * | 0.514 | 0.000 * |
| CD19+ [%] | 68.34 ± 10.56 | 70.88 (43.30–86.98) | 62.08 ± 8.02 | 60.43 (46.23–75.09) | 9.86 ± 2.90 | 9.76 (4.25–14.64) | 9.43 ± 4.04 | 9.50 (3.37–16.30) | 10.92 ± 2.92 | 10.29 (7.05–15.88) | 0.000 * | 0.052 * | 0.000 * | 0.000 * | 0.000 * | 0.062 | 0.000 * |
| CD4+ [%] | 12.55 ± 5.10 | 11.68 (5.45–21.92) | 9.61 ± 3.64 | 10.38 (3.31–16.70) | 32.05 ± 11.35 | 33.52 (12.03–52.49) | 26.73 ± 8.76 | 24.73 (13.25–39.31) | 49.93 ± 5.63 | 48.69 (40.00–59.89) | 0.000 * | 0.524 | 0.000 * | 0.000 * | 0.000 * | 0.847 | 0.000 * |
| CD8+ [%] | 12.07 ± 6.64 | 11.13 (2.19–24.81) | 10.33 ± 4.26 | 9.64 (4.06–19.72) | 33.41 ± 17.19 | 33.16 (4.65–69.74) | 33.93 ± 13.27 | 34.91 (10.44–55.17) | 32.37 ± 9.86 | 30.50 (14.26–47.33) | 0.000 * | 0.011 * | 0.000 * | 0.000 * | 0.000 * | 0.720 | 0.000 * |
| CD4+/CD8+ ratio | 1.66 ± 1.63 | 1.06 (0.28–8.75) | 1.09 ± 0.55 | 1.13 (0.24–2.26) | 1.69 ± 0.89 | 0.99 (0.23–8.91) | 1.03 ± 0.78 | 0.80 (0.24–2.98) | 1.73 ± 0.67 | 1.58 (0.95–3.51) | 0.0028 * | 0.380 | 0.715 | 0.139 | 0.829 | 0.333 | 0.289 |
| Parameter | CLL | CVID | HV | p-Value | p-Value | |||||||||||||
|---|---|---|---|---|---|---|---|---|---|---|---|---|---|---|---|---|---|---|
| EBV+ (Group 1) | EBV− (Group 2) | EBV+ (Group 3) | EBV− (Group 4) | EBV− (Group 5) | ||||||||||||||
| Mean ± SD | Median (Range) | Mean ± SD | Median (Range) | Mean ± SD | Median (Range) | Mean ± SD | Median (Range) | Mean ± SD | Median (Range) | 1 vs. 2 | 1 vs. 3 | 1 vs. 4 | 2 vs. 3 | 3 vs. 4 | 2 vs. 4 | |||
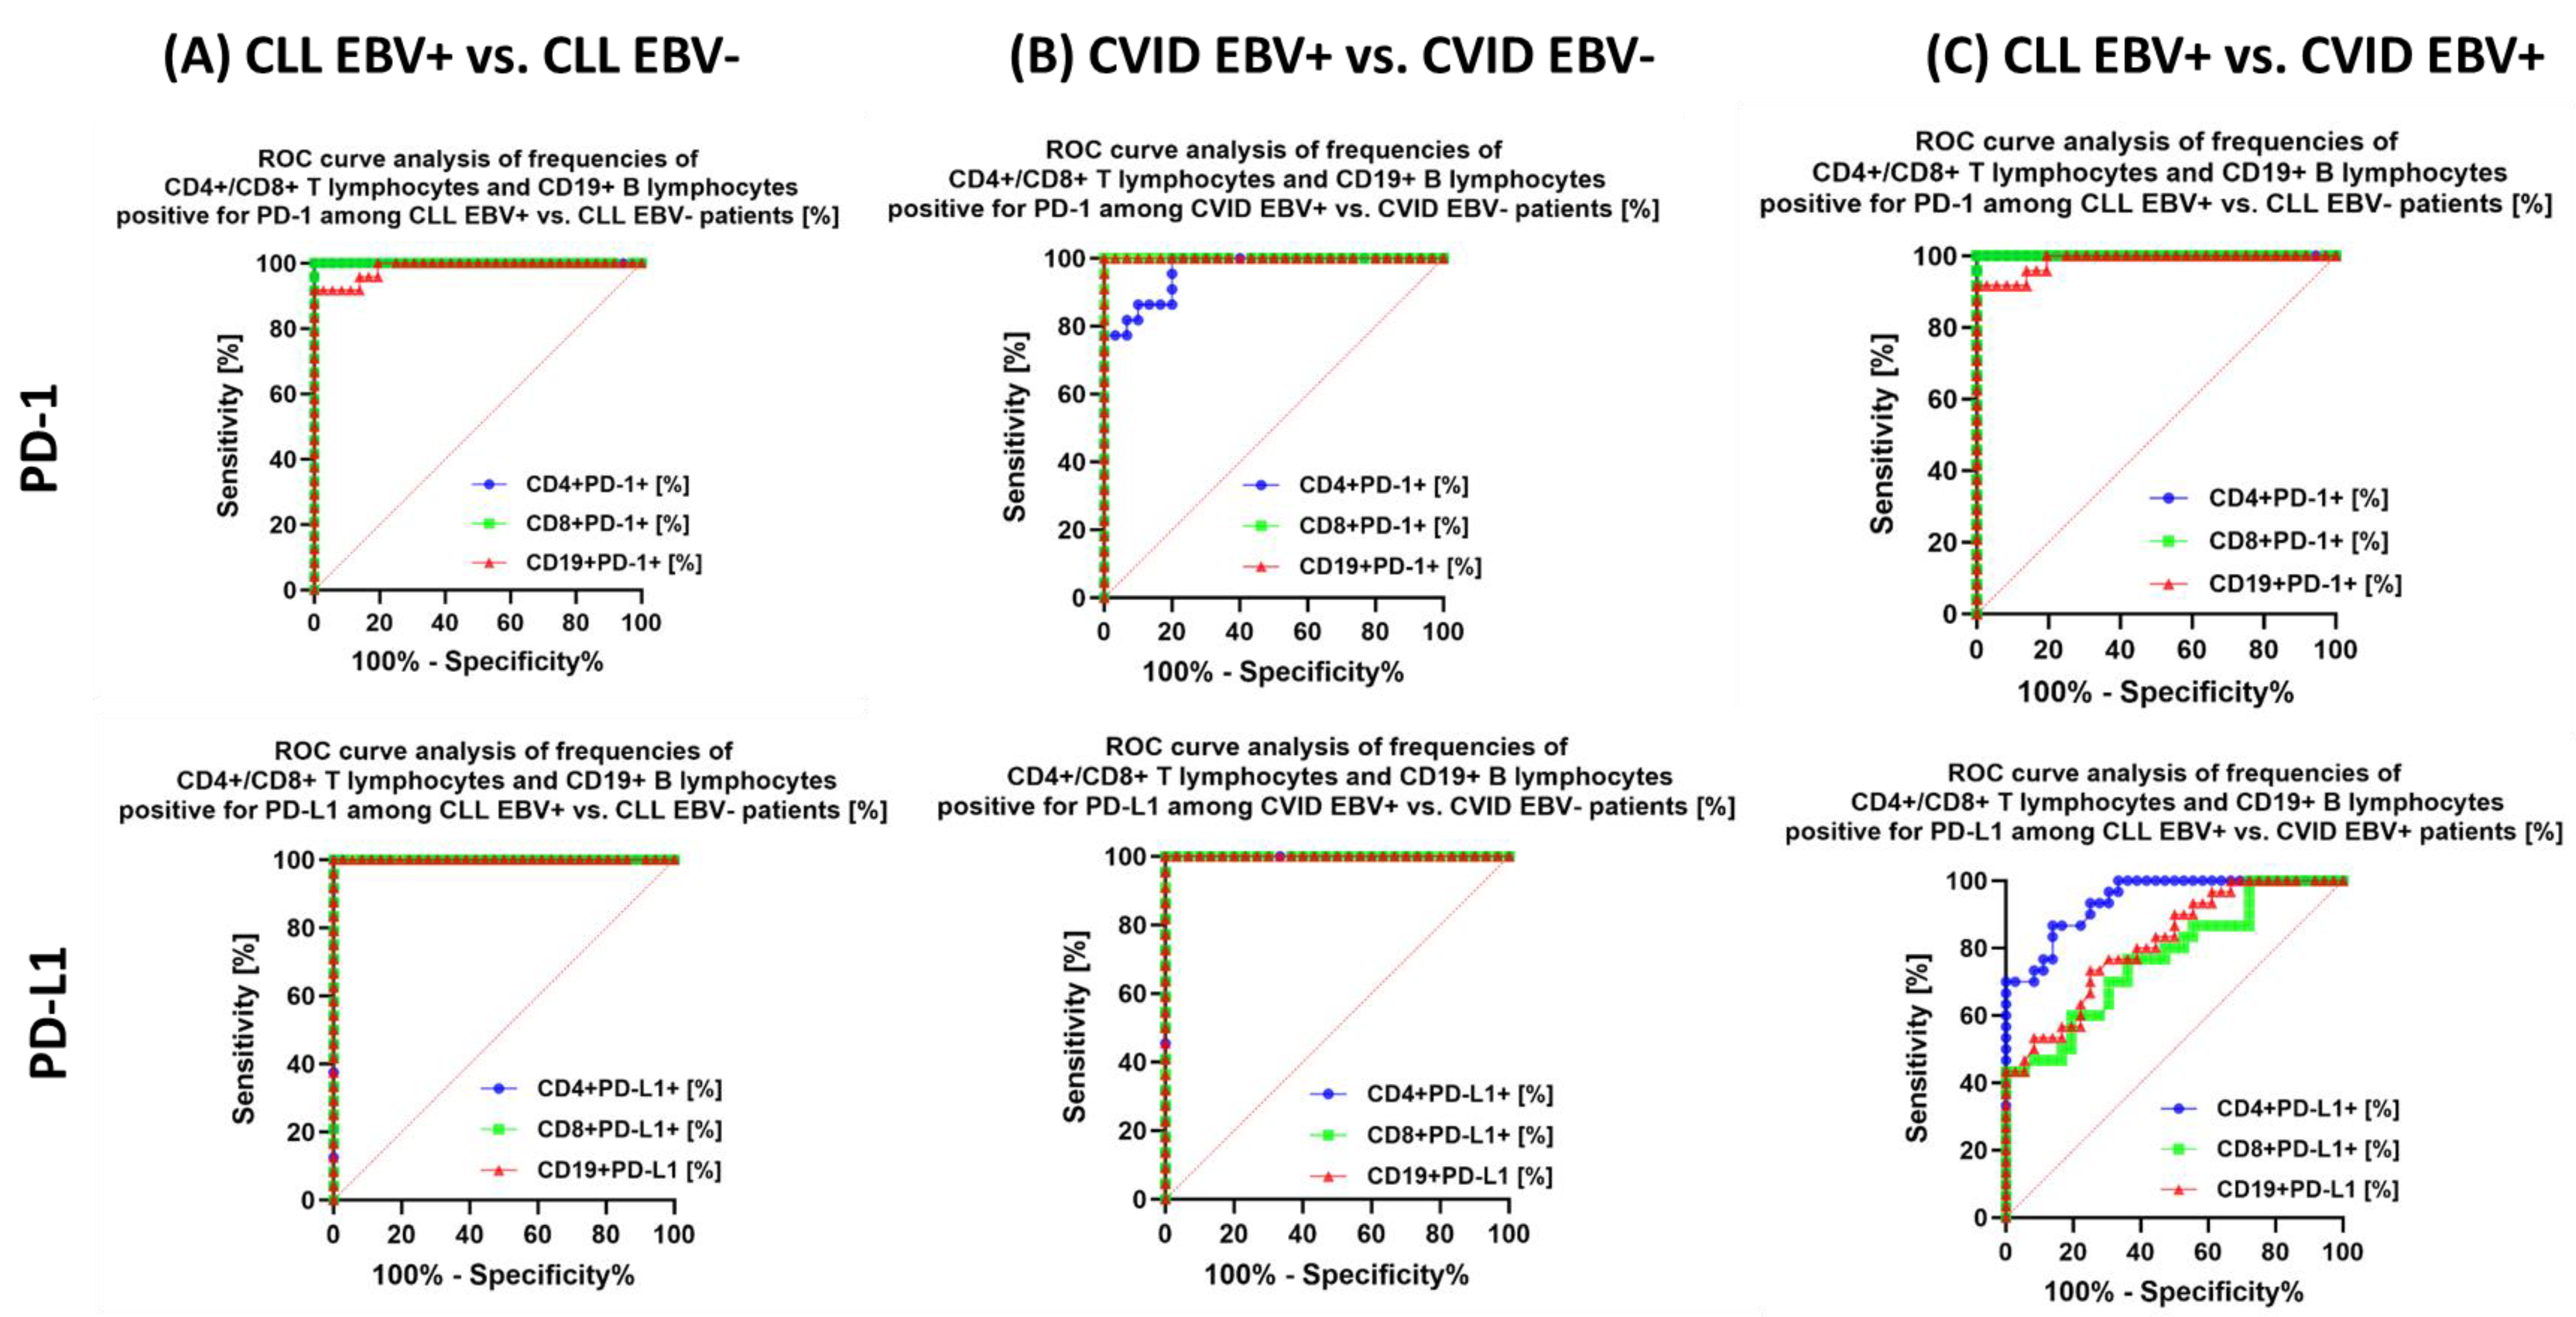
| PD-1 | CD4+ PD-1+ | 33.02 ± 7.88 | 31.83 (18.35–44.70) | 14.04 ± 2.32 | 14.46 (10.06–18.11) | 21.08 ± 2.80 | 21.12 (16.07–25.00) | 12.62 ± 3.59 | 12.47 (6.96–18.22) | 3.65 ± 1.22 | 3.80 (1.04–5.71) | 0.000 * | 0.000 * | 0.000 * | 0.000 * | 0.000 * | 0.000 * | 0.171 |
| CD8+ PD-1+ | 23.23 ± 3.99 | 24.12 (15.15–28.78) | 8.67 ± 2.69 | 9.45 (4.09–11.99) | 27.43 ± 4.03 | 27.96 (20.25–34.69) | 7.67 ± 1.34 | 8.03 (5.54–9.55) | 3.04 ± 1.20 | 3.05 (1.01–4.88) | 0.000 * | 0.000 * | 0.000 * | 0.000 * | 0.000 * | 0.000 * | 0.133 | |
| CD19+ PD-1+ | 24.85 ± 6.38 | 25.73 (14.15–35.63) | 10.63 ± 2.96 | 10.42 (6.38–18.43) | 13.45 ± 1.78 | 13.64 (1.01–16.74) | 4.67 ± 1.63 | 5.21 (2.29–6.98) | 3.69 ± 1.00 | 379 (2.08–5.46) | 0.000 * | 0.000 * | 0.000 * | 0.000 * | 0.000 * | 0.000 * | 0.000 * | |
| PD-L1 | CD4+ PD-L1+ | 13.81 ± 1.55 | 13.69 (11.32–16.62) | 7.04 ± 1.84 | 7.34 (3.05–9.83) | 10.37 ± 1.42 | 10.40 (8.19–12.99) | 4.81 ± 1.39 | 4.68 (2.85–6.99) | 0.89 ± 0.55 | 0.80 (0.11–1.89) | 0.000 * | 0.000 * | 0.000 * | 0.000 * | 0.000 * | 0.000 * | 0.000 * |
| CD8+ PD-L1+ | 14.97 ± 2.51 | 14.73 (10.31–18.77) | 5.38 ± 1.91 | 4.91 (2.70–8.75) | 11.51 ± 3.47 | 11.89 (6.04–16.97) | 2.27 ± 0.65 | 2.13 (1.02–3.28) | 0.56 ± 0.24 | 0.54 (0.11–0.96) | 0.000 * | 0.000 * | 0.000 * | 0.000 * | 0.000 * | 0.000 * | 0.000 * | |
| CD19+ PD-L1+ | 16.33 ± 2.19 | 16.07 (12.27–19.86) | 7.23 ± 2.83 | 7.06 (3.01–12.21) | 12.66 ± 3.16 | 13.38 (7.13–17.87) | 4.13 ± 1.13 | 4.45 (2.17–6.06) | 1.07 ± 0.55 | 1.08 (0.12–1.96) | 0.000 * | 0.000 * | 0.000 * | 0.000 * | 0.000 * | 0.000 * | 0.000 * | |
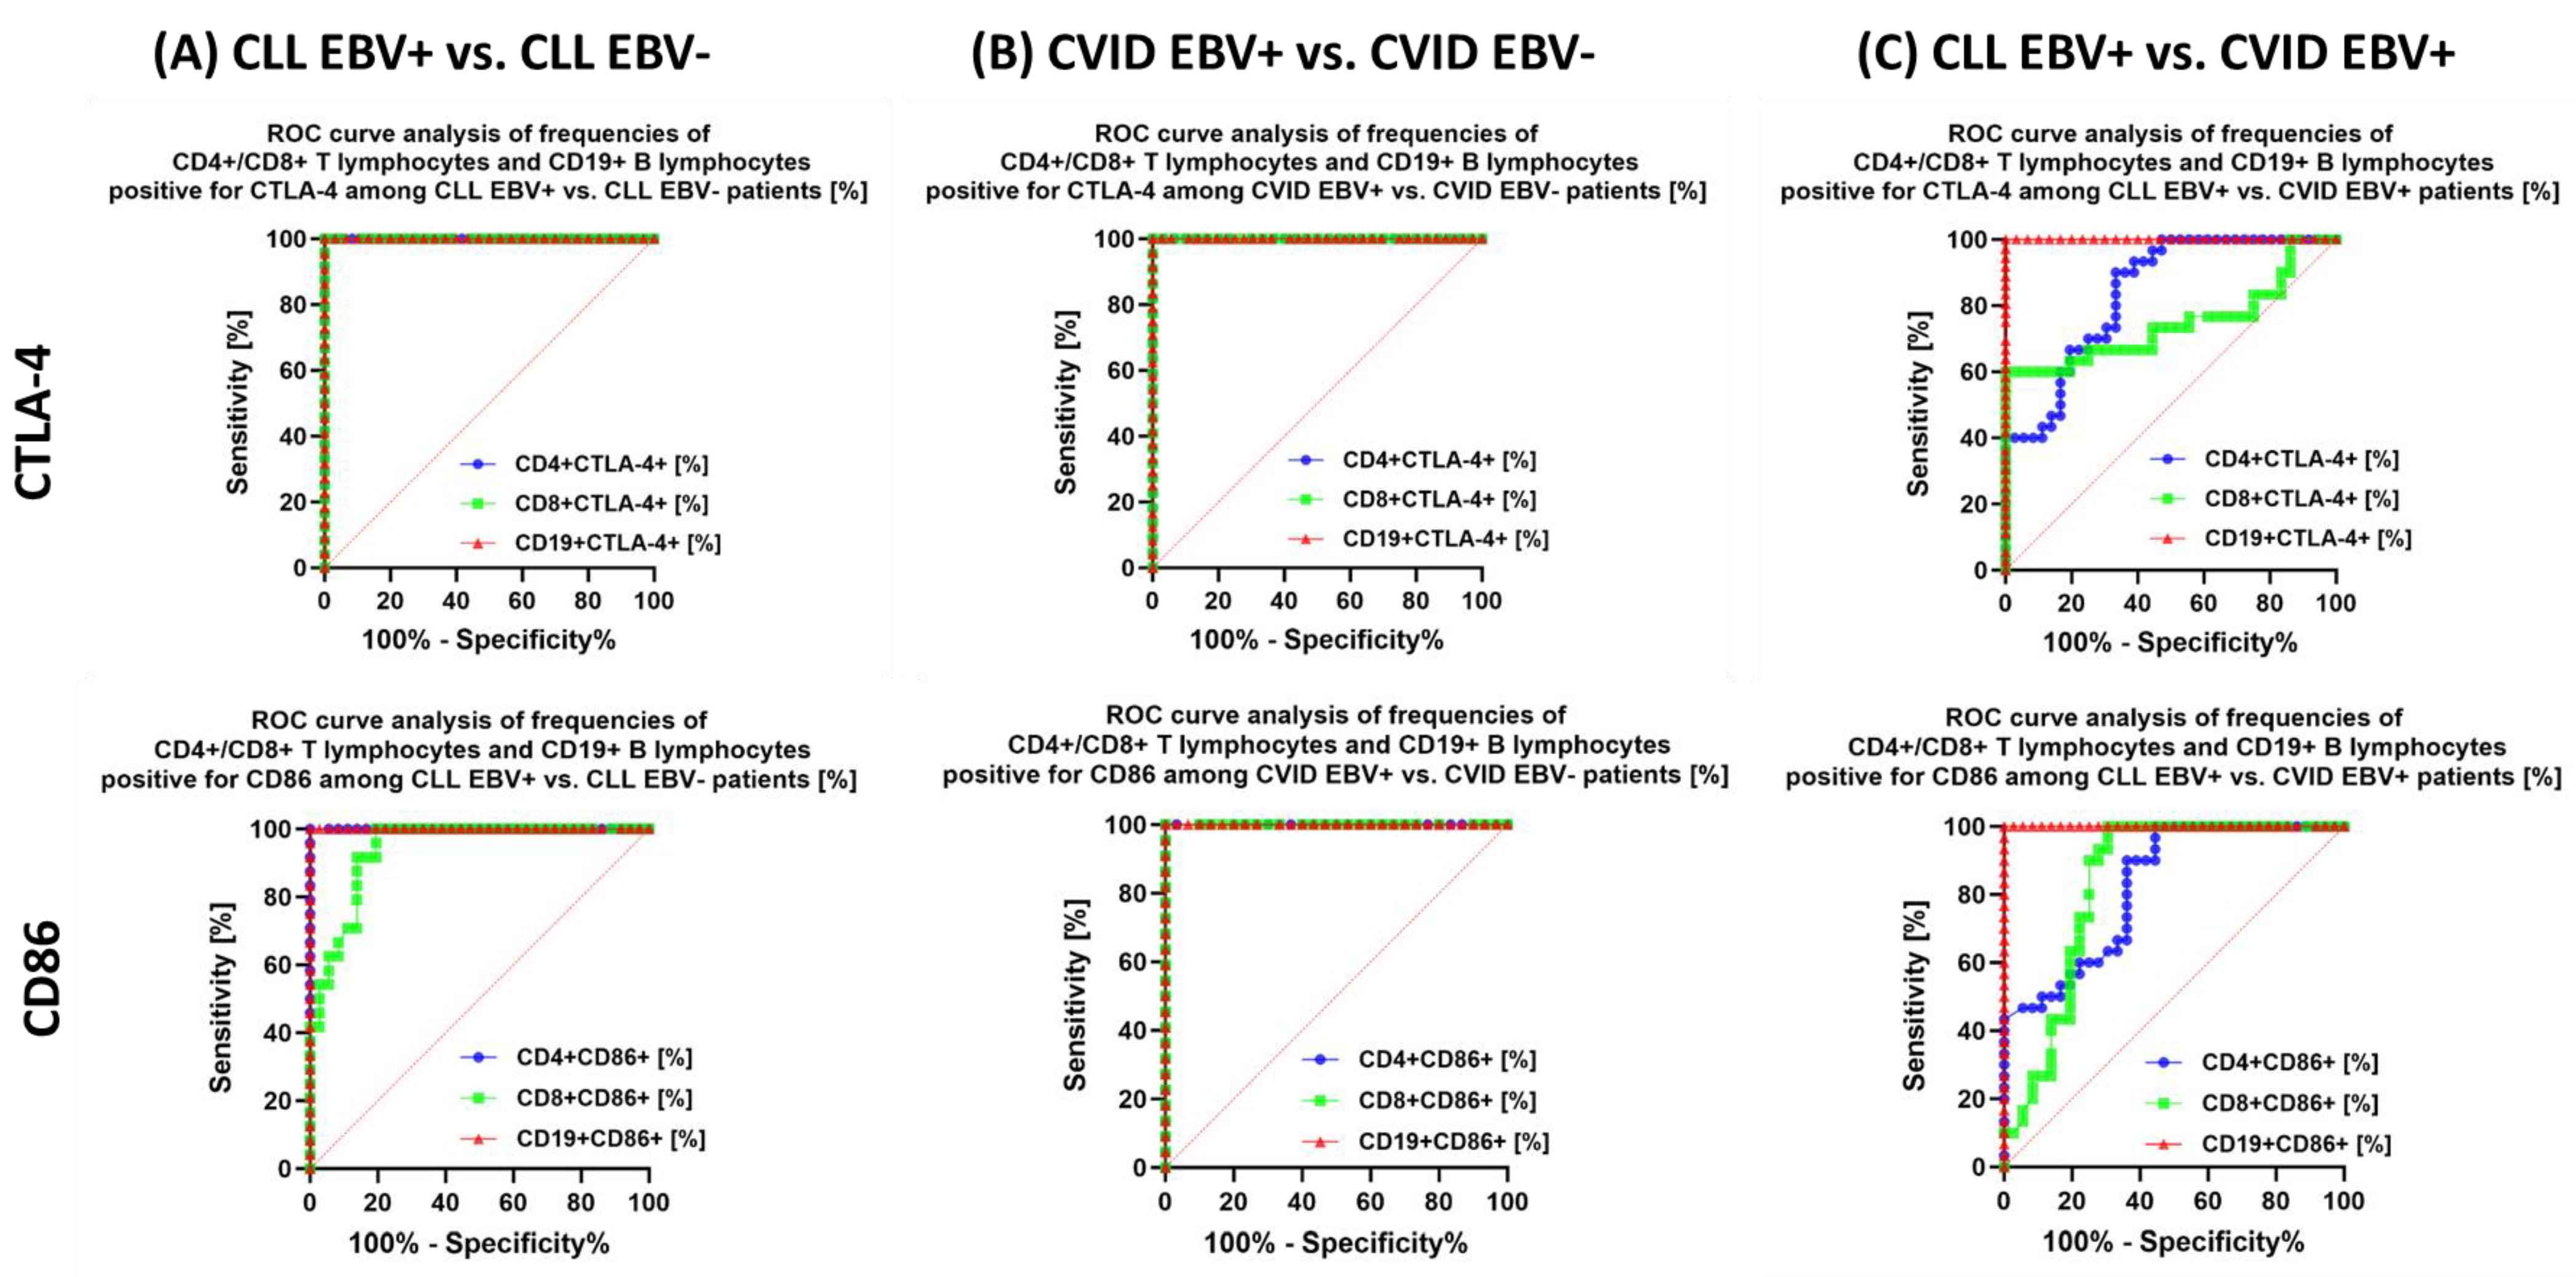
| CTLA-4 | CD4+ CTLA-4+ | 23.52 ± 4.41 | 24.49 (16.06–29.43) | 7.99 ± 2.08 | 8.24 (4.18–11.93) | 17.19 ± 4.33 | 18.48 (9.13–24.00) | 6.69 ± 1.38 | 6.66 (4.08–8.82) | 3.02 ± 0.62 | 3.02 (2.19–3.95) | 0.000 * | 0.000 * | 0.000 * | 0.000 * | 0.000 * | 0.000 * | 0.019 * |
| CD8+ CTLA-4+ | 22.01 ± 3.15 | 22.07 (16.33–26.86) | 11.00 ± 1.71 | 10.67 (8.65–14.69) | 27.70 ± 6.38 | 29.19 (18.15–36.56) | 6.33 ± 1.28 | 6.12 (4.17–8.61) | 3.40 ± 0.77 | 3.26 (2.01–4.72) | 0.000 * | 0.000 * | 0.000 * | 0.000 * | 0.000 * | 0.000 * | 0.000 * | |
| CD19+ CTLA-4+ | 21.85 ± 5.53 | 23.62 (13.15–29.63) | 5.58 ± 1.06 | 5.52 (3.32–7.58) | 7.98 1.80 | 7.98 (5.03–10.93) | 3.31 ± 0.90 | 3.06 (1.13–3.86) | 2.07 ± 0.53 | 2.09 (1.01–2.95) | 0.000 * | 0.000 * | 0.000 * | 0.000 * | 0.000 * | 0.000 * | 0.000 * | |
| CD86 | CD4+ CD86+ | 9.25 ± 1.58 | 9.31 (7.06–11.86) | 5.15 ± 0.54 | 5.27 (4.08–5.94) | 7.42 ± 0.97 | 7.17 (6.10–8.91) | 4.91 ± 0.45 | 4.87 (4.08–5.81) | 2.86 ± 0.64 | 2.76 (2.02–3.97) | 0.000 * | 0.000 * | 0.000 * | 0.000 * | 0.000 * | 0.000 * | 0.097 |
| CD8+ CD86+ | 7.03 ± 1.83 | 7.08 (4.02–9.96) | 4.04 ± 0.60 | 4.11 (3.12–4.95) | 4.89 ± 0.55 | 4.97 (4.01–5.71) | 2.51 ± 0.27 | 2.52 (2.01–2.99) | 1.91 ± 0.59 | 1.83 (1.05–3.00) | 0.000 * | 0.000 * | 0.000 * | 0.000 * | 0.000 * | 0.000 * | 0.000 * | |
| CD19+ CD86+ | 47.19 ± 4.28 | 47.15 (40.34–52.97) | 32.71 ± 3.56 | 33.11 (26.11–37.81) | 28.07 ± 1.12 | 28.00 (26.25–29.88) | 22.52 ± 1.51 | 22.42 (20.05–24.93) | 13.91 ± 3.96 | 13.36 (8.03–20.89) | 0.000 * | 0.000 * | 0.000 * | 0.000 * | 0.000 * | 0.000 * | 0.000 * | |
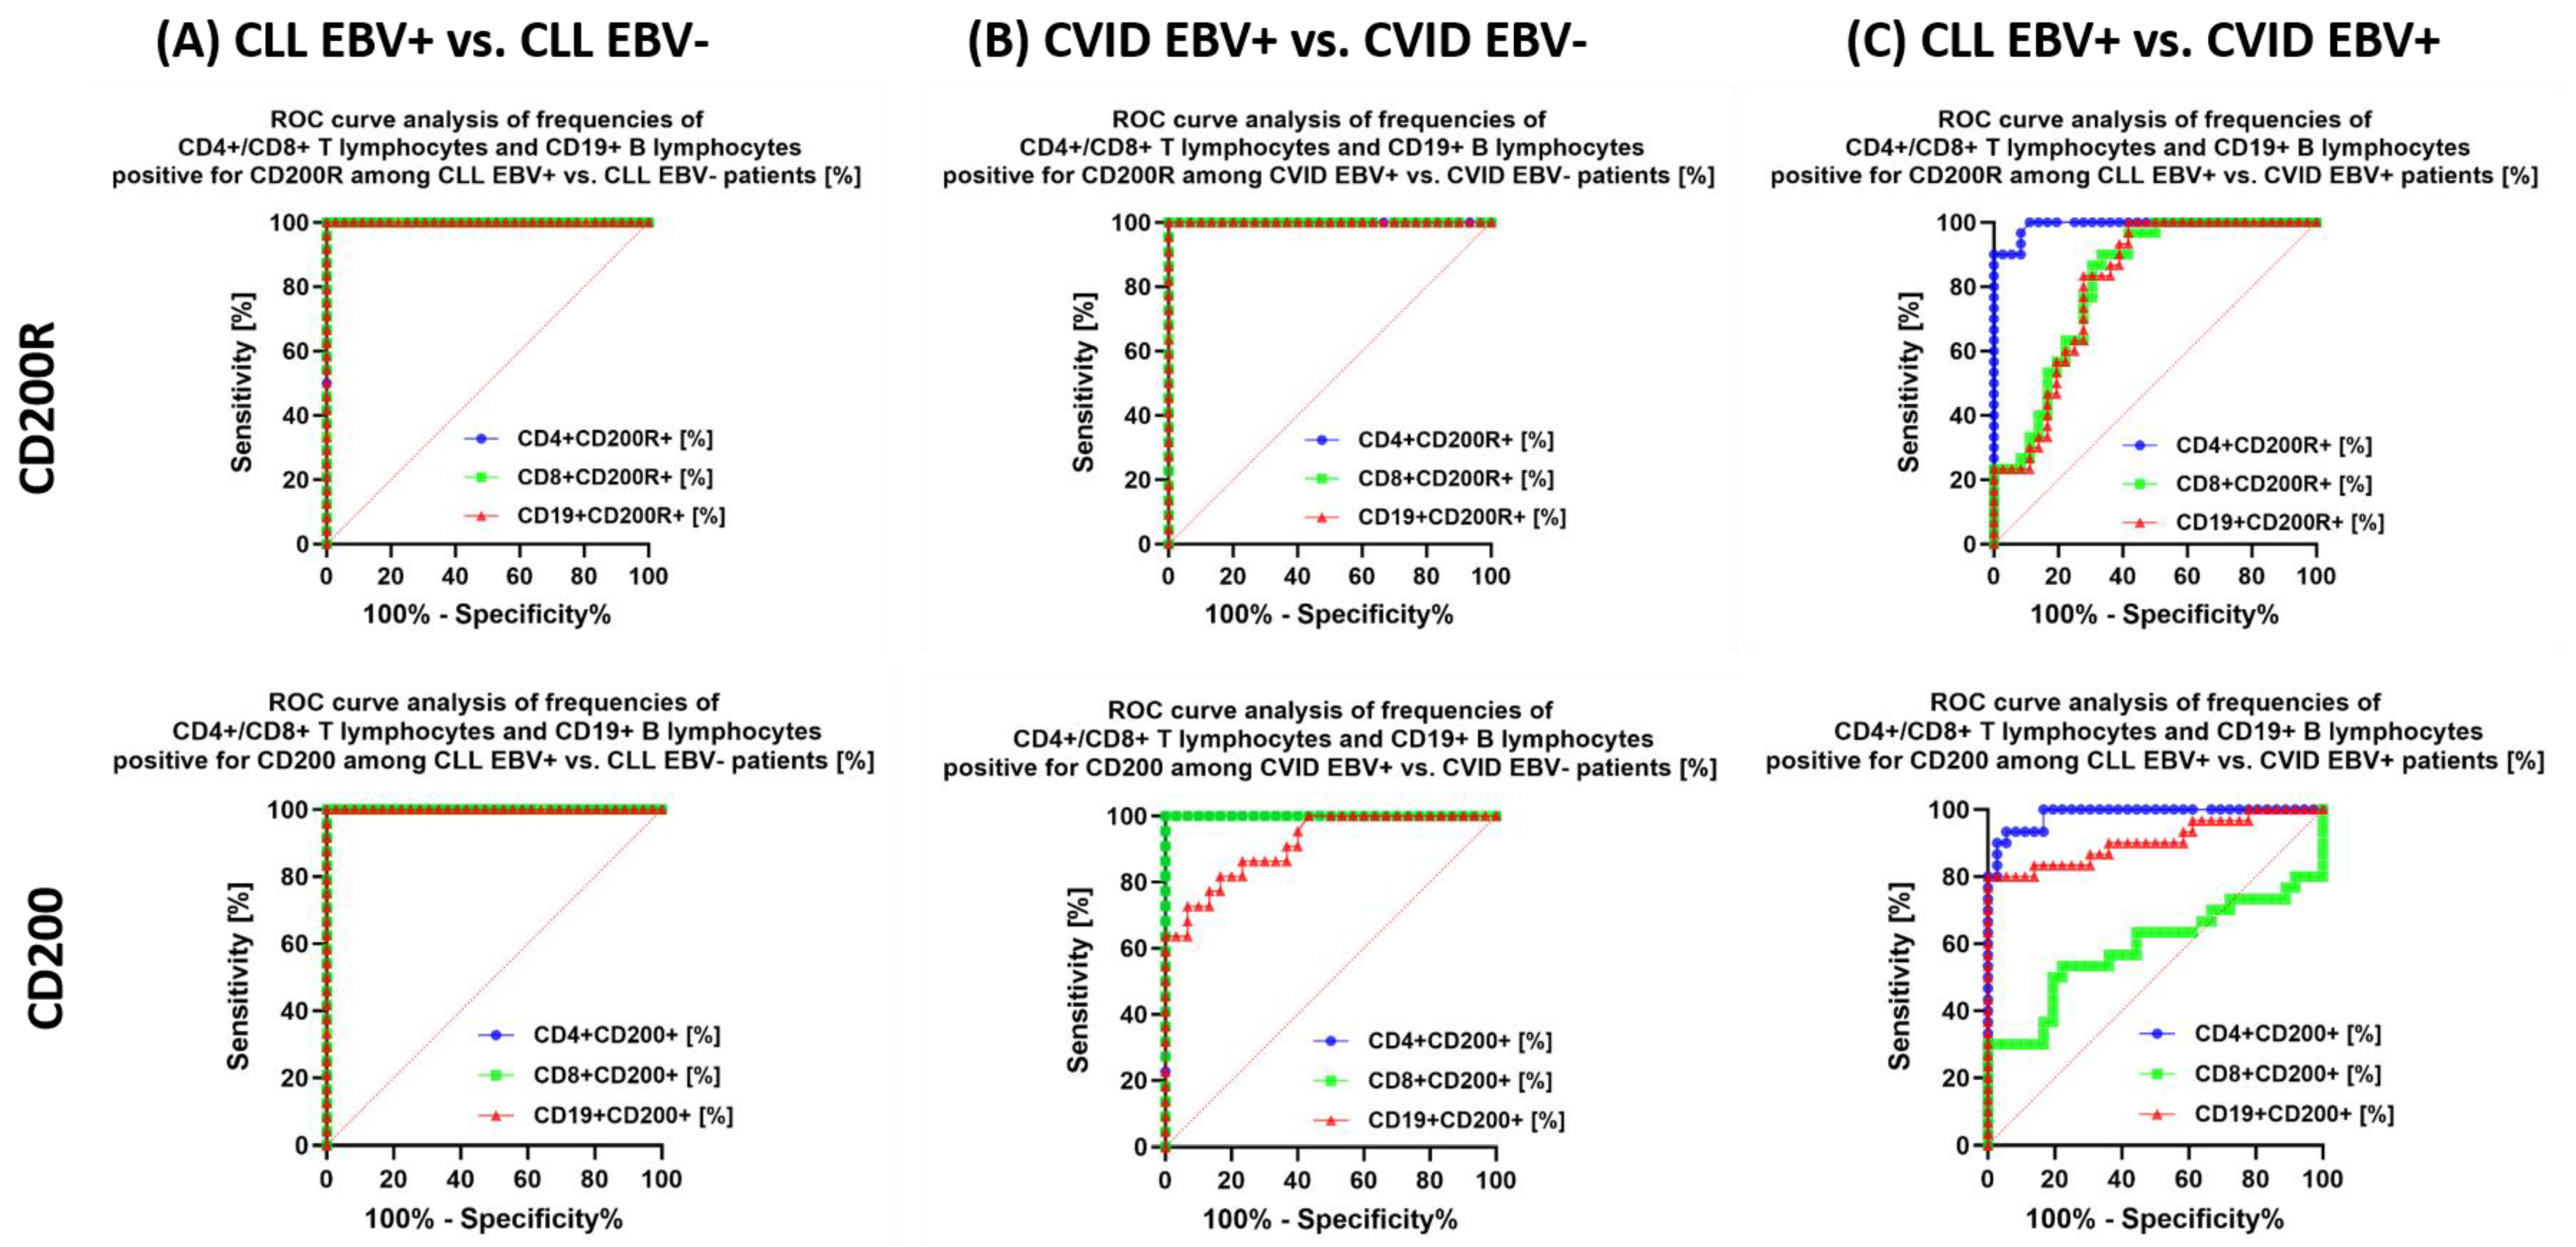
| CD200R | CD4+ CD200R+ | 16.26 ± 2.88 | 16.42 (11.09–20.65) | 6.36 ± 2.06 | 5.99 (3.19–9.48) | 9.25 ± 1.30 | 9.29 (7.40–11.98) | 3.75 ± 1.29 | 3.73 (1.28–5.89) | 4.80 ± 2.46 | 4.33 (1.21–8.99) | 0.000 * | 0.000 * | 0.000 * | 0.000 * | 0.000 * | 0.000 * | 0.000 * |
| CD8+ CD200R+ | 19.28 ± 3.87 | 19.96 (11.08–24.95) | 6.35 ± 2.10 | 6.50 (2.79–10.33) | 14.94 ± 3.04 | 14.78 (10.30–19.93) | 5.33 ± 2.09 | 5.40 (2.26–8.81) | 4.27 ± 1.58 | 4.79 (1.35–6.88) | 0.000 * | 0.000 * | 0.230 | 0.000 * | 0.000 * | 0.000 * | 0.170 | |
| CD19+ CD200R+ | 21.11 ± 4.52 | 21.49 (14.12–27.94) | 9.42 ± 1.80 | 9.17 (6.23–11.88) | 15.92 ± 2.18 | 15.97 (12.24–19.96) | 7.40 ± 2.26 | 7.81 (3.16–10.72) | 20.71 ± 5.30 | 19.48 (12.76–29.42) | 0.000 * | 0.000 * | 0.000 * | 0.000 * | 0.000 * | 0.000 * | 0.006 * | |
| CD200 | CD4 + CD200+ | 33.80 ± 5.16 | 34.51 (25.12–43.95) | 10.71 ± 3.61 | 11.02 (5.94–16.96) | 21.14 ± 3.13 | 19.85 (16.15–27.23) | 10.30 ± 2.79 | 10.18 (6.24–14.73) | 2.58 ± 0.85 | 2.62 (1.05–3.75) | 0.000 * | 0.000 * | 0.000 * | 0.000 * | 0.000 * | 0.000 * | 0.991 |
| CD8+ CD200+ | 25.82 ± 3.16 | 26.13 (20.32–30.91) | 9.54 ± 2.30 | 9.96 (4.59–13.60) | 24.33 ± 5.79 | 23.22 (15.25–33.71) | 6.94 ± 2.70 | 7.33 (3.11–10.59) | 3.37 ± 1.38 | 3.62 (1.01–5.74) | 0.000 * | 0.000 * | 0.000 * | 0.000 * | 0.000 * | 0.000 * | 0.001 * | |
| CD19+ CD200+ | 87.76 ± 5.26 | 87.47 (79.29–97.58) | 68.98 ± 3.93 | 69.12 (61.80–74.99) | 64.84 ± 14.22 | 61.33 (44.17–92.93) | 40.34 ± 11.03 | 40.58 (25.36–59.85) | 43.95 ± 12.81 | 41.27 (23.28–69.37) | 0.000 * | 0.000 * | 0.000 * | 0.000 * | 0.093 | 0.000 * | 0.000 * | |
| Serum Concentration [ng/mL] | CLL | CVID | HV | p-Value | p-Value | ||||||||||||
|---|---|---|---|---|---|---|---|---|---|---|---|---|---|---|---|---|---|
| EBV+ (Group 1) | EBV− (Group 2) | EBV+ (Group 3) | EBV− (Group 4) | EBV− (Group 5) | |||||||||||||
| Mean ± SD | Median (Range) | Mean ± SD | Median (Range) | Mean ± SD | Median (Range) | Mean ± SD | Median (Range) | Mean ± SD | Median (Range) | 1 vs. 2 | 1 vs. 3 | 1 vs. 4 | 2 vs. 3 | 3 vs. 4 | 2 vs. 4 | ||
| sPD-1 | 48.26 ± 6.65 | 48.50 (37.00–61.30) | 36.70 ± 4.14 | 37.36 (30.72–42.51) | 23.11 ± 2.51 | 22.52 (19.20–26.97) | 15.53 ± 1.35 | 15.51 (13.18–17.94) | 2.88 ± 1.60 | 3.09 (0.11–5.44) | 0.000 * | 0.000 * | 0.000 * | 0.000 * | 0.000 * | 0.000 * | 0.000 * |
| sPD-L1 | 32.22 ± 5.35 | 33.38 (5.47–37.64) | 23.03 ± 1.81 | 23.26 (20.05–26.43) | 9.52 ± 0.80 | 9.52 (8.18–10.96) | 5.59 ± 0.86 | 5.36 (4.08–6.94) | 1.61 ± 0.83 | 1.69 (0.17–2.80) | 0.000 * | 0.000 * | 0.000 * | 0.000 * | 0.000 * | 0.000 * | 0.000 * |
| sCTLA-4 | 25.90 ± 2.11 | 26.05 (22.14–28.98) | 19.23 ± 3.66 | 18.13 (15.44–29.34) | 15.20 ± 3.37 | 14.11 (10.15–19.96) | 7.62 ± 0.82 | 7.57 (6.13–8.96) | 3.19 ± 1.10 | 2.87 (1.49–5.13) | 0.000 * | 0.000 * | 0.000 * | 0.000 * | 0.000 * | 0.000 * | 0.000 * |
| sCD86 | 22.78 ± 1.53 | 22.73 (20.10–25.95) | 16.97 ± 1.21 | 17.42 (15.04–18.60) | 13.72 ± 4.52 | 15.13 (4.94–19.71) | 11.49 ± 0.94 | 11.48 (10.00–12.93) | 1.92 ± 0.65 | 1.82 (1.00–2.91) | 0.000 * | 0.000 * | 0.000 * | 0.000 * | 0.000 * | 0.000 * | 0.000 * |
| sCD200R | 38.60 ± 3.82 | 38.35 (32.74–44.82) | 27.84 ± 2.00 | 27.39 (25.06–30.94) | 22.04 ± 2.85 | 22.21 (17.26–26.05) | 12.42 ± 2.80 | 12.58 (2.57–15.89) | 3.69 ± 1.90 | 3.36 (0.09–6.96) | 0.000 * | 0.000 * | 0.000 * | 0.000 * | 0.000 * | 0.000 * | 0.000 * |
| sCD200 | 50.50 ± 5.72 | 50.70 (41.34–58.99) | 33.82 ± 2.42 | 32.99 (30.53–38.65) | 42.62 ± 6.11 | 42.25 (33.40–53.82) | 27.62 ± 3.11 | 28.38 (22.02–31.85) | 2.59 ± 1.21 | 2.14 (1.04–4.43) | 0.000 * | 0.000 * | 0.000 * | 0.000 * | 0.000 * | 0.000 * | 0.000 * |
| Disease Entity/Disorder | Mechanism | References |
|---|---|---|
| X-linked lymphoproliferative disease (XLP-1) | The heightened vulnerability of XLP-1 patients to EBV infection is likely a result of diminished NK cytolytic activity and reduced CD8+ T cell killing. This susceptibility stems from EBV’s strong attraction to B cells, coupled with the compromised ability of T and NK cells to interact with B cells due to a deficiency in the SLAM receptor-associated pathway. | [58,59] |
| CD27 deficiency | These patients were documented to exhibit symptomatic primary EBV infection or lymphadenopathy during early life, and a subset also experienced persistent EBV viremia. About half of the individuals developed a malignant neoplasm. | [60] |
| RASGRP1 deficiency | Patients with RASGRP1 deficiency commonly display a clinical profile characterized by recurrent infections, enlarged liver and spleen (hepatosplenomegaly), swollen lymph nodes (lymphadenopathy), EBV-related excessive lymph cell growth, and the emergence of B-cell lymphoma. Additionally, they may also present autoimmune traits like autoimmune hemolytic anemia, thrombocytopenia, and uveitis. | [61,62] |
| CD70 deficiency | The clinical signs of CD70 deficiency closely mirror those of CD27 deficiency. In both cases, patients universally exhibit EBV viremia, and the majority of them go on to develop EBV-associated lymphoproliferation or B-cell malignancy, alongside conditions like hypogammaglobulinemia and compromised targeted antibody responses. | [63,64] |
| Deficiency of the actin regulator—coronin 1A | Dysfunctional calcium flux and the buildup of β-actin at the immune synapse lead to heightened T cell apoptosis and a reduction in CD4+ lymphocyte count. In the case of coronin 1A deficiency, individuals experienced profound infections, and five of them went on to develop B-cell lymphoma induced by EBV. | [65,66] |
| Serine/threonine kinase 4 (STK4) deficiency | The aberrations in the immune system result in autoimmunity, EBV viremia, and the recurrence of sinopulmonary and mucocutaneous infections, predominantly associated with herpes viruses. Additionally, patients also face susceptibility to other infections caused by viruses such as molluscum contagiosum, fungi like candidiasis, and bacteria like staphylococci. | [67,68] |
| Activated phosphatidylinositide 3-kinase delta (PI3Kδ) syndrome (APDS) | Dysregulated function leads to the overactivity of the Akt-mTOR pathway, prompting an excessive terminal differentiation of effector lymphocytes, compromised cytokine generation, and hindered immunoglobulin class switching in B cells. Around 30% of APDS patients have EBV infection, which significantly raises the likelihood of B-cell lymphoma development (occurring in 20% of APDS patients who are infected with EBV). | [69,70] |
| Autoimmune lymphoproliferative syndrome (ALPS) | A deficit in the Fas-mediated apoptotic pathway could elevate the susceptibility to EBV-related lymphomas. Nonetheless, it is plausible that over extended periods of virus transmission, one of the mechanisms by which the immune system regulates EBV within the B cell framework involves the process of Fas-mediated cell elimination. | [71] |
Disclaimer/Publisher’s Note: The statements, opinions and data contained in all publications are solely those of the individual author(s) and contributor(s) and not of MDPI and/or the editor(s). MDPI and/or the editor(s) disclaim responsibility for any injury to people or property resulting from any ideas, methods, instructions or products referred to in the content. |
© 2023 by the authors. Licensee MDPI, Basel, Switzerland. This article is an open access article distributed under the terms and conditions of the Creative Commons Attribution (CC BY) license (https://creativecommons.org/licenses/by/4.0/).
Share and Cite
Mertowska, P.; Mertowski, S.; Smolak, K.; Kita, G.; Guz, K.; Kita, A.; Pasiarski, M.; Smok-Kalwat, J.; Góźdź, S.; Grywalska, E. Could Immune Checkpoint Disorders and EBV Reactivation Be Connected in the Development of Hematological Malignancies in Immunodeficient Patients? Cancers 2023, 15, 4786. https://doi.org/10.3390/cancers15194786
Mertowska P, Mertowski S, Smolak K, Kita G, Guz K, Kita A, Pasiarski M, Smok-Kalwat J, Góźdź S, Grywalska E. Could Immune Checkpoint Disorders and EBV Reactivation Be Connected in the Development of Hematological Malignancies in Immunodeficient Patients? Cancers. 2023; 15(19):4786. https://doi.org/10.3390/cancers15194786
Chicago/Turabian StyleMertowska, Paulina, Sebastian Mertowski, Konrad Smolak, Gabriela Kita, Katarzyna Guz, Aleksandra Kita, Marcin Pasiarski, Jolanta Smok-Kalwat, Stanisław Góźdź, and Ewelina Grywalska. 2023. "Could Immune Checkpoint Disorders and EBV Reactivation Be Connected in the Development of Hematological Malignancies in Immunodeficient Patients?" Cancers 15, no. 19: 4786. https://doi.org/10.3390/cancers15194786
APA StyleMertowska, P., Mertowski, S., Smolak, K., Kita, G., Guz, K., Kita, A., Pasiarski, M., Smok-Kalwat, J., Góźdź, S., & Grywalska, E. (2023). Could Immune Checkpoint Disorders and EBV Reactivation Be Connected in the Development of Hematological Malignancies in Immunodeficient Patients? Cancers, 15(19), 4786. https://doi.org/10.3390/cancers15194786


