
Standardization of Molecular MRD Levels in AML Using an Integral Vector Bearing ABL and the Mutation of Interest

 , , , ,
Abstract
:Simple Summary
Abstract
1. Introduction
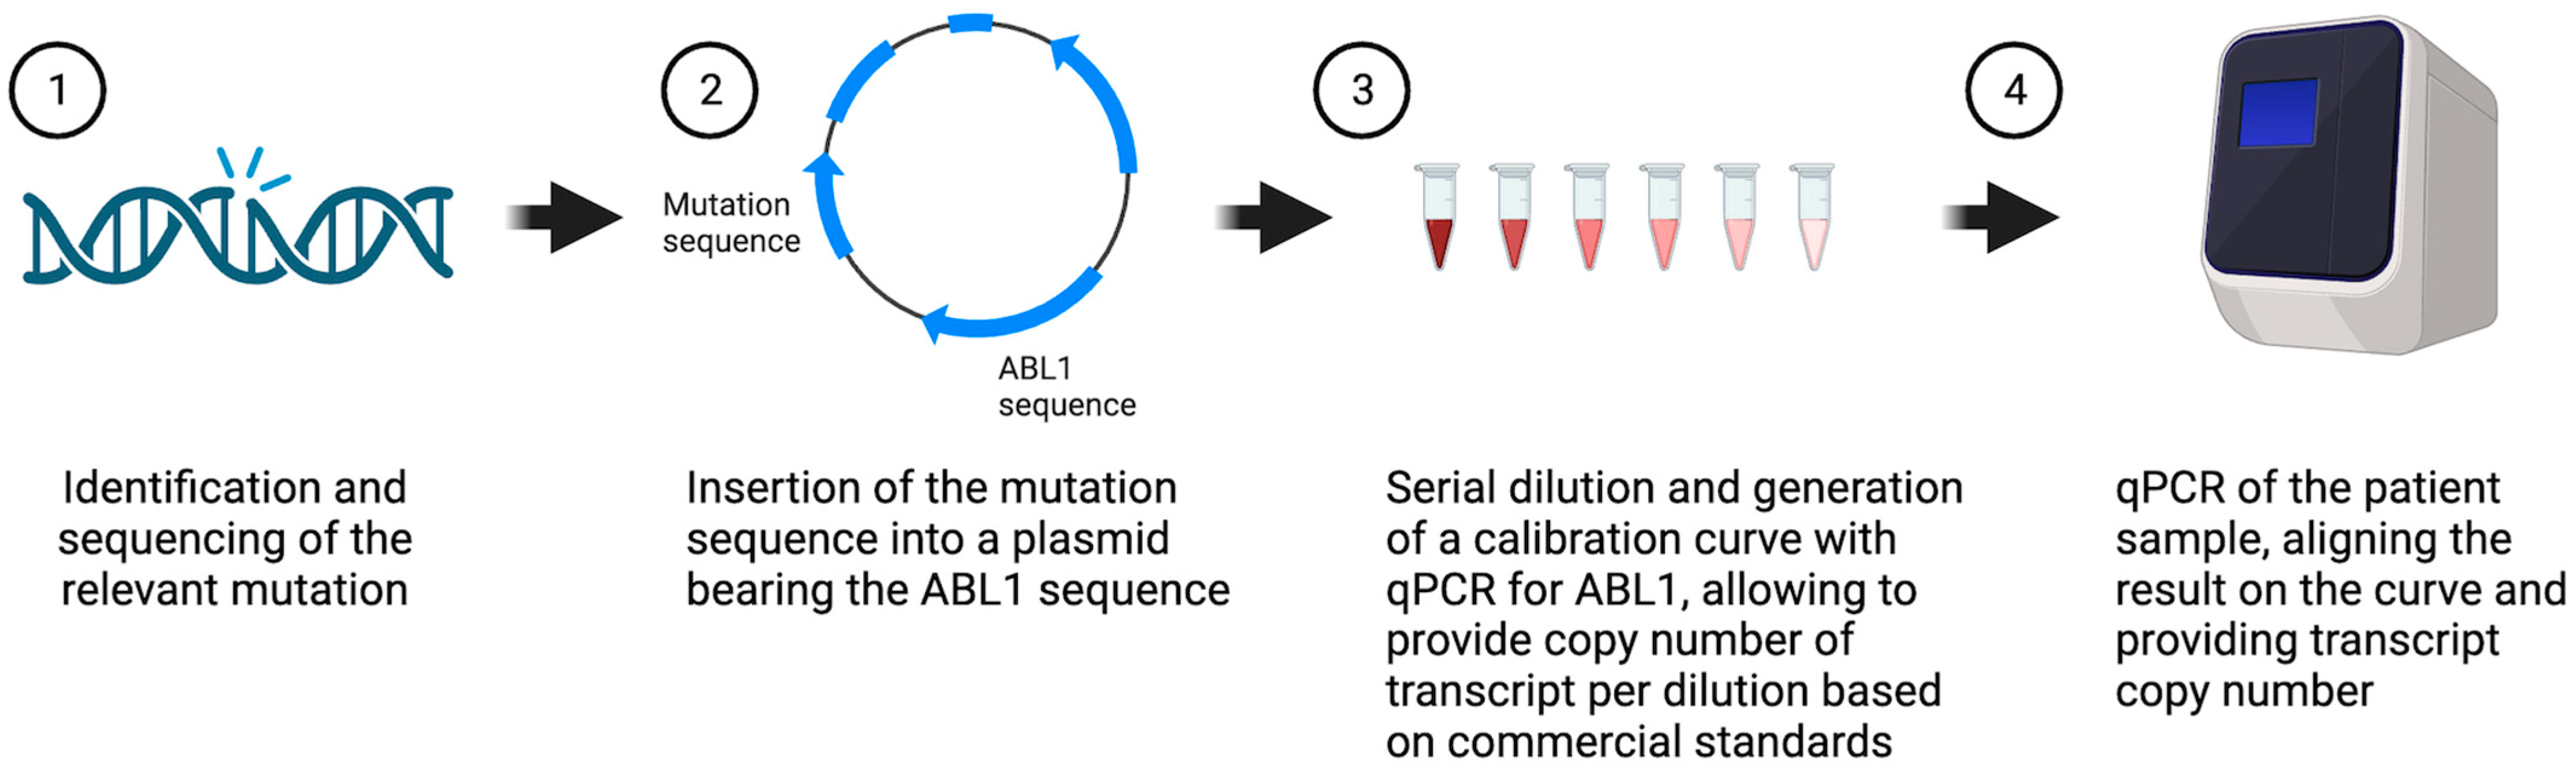
2. Materials and Methods
2.1. Patients
2.2. Mutation Detection
2.3. Measurable Residual Disease Monitoring
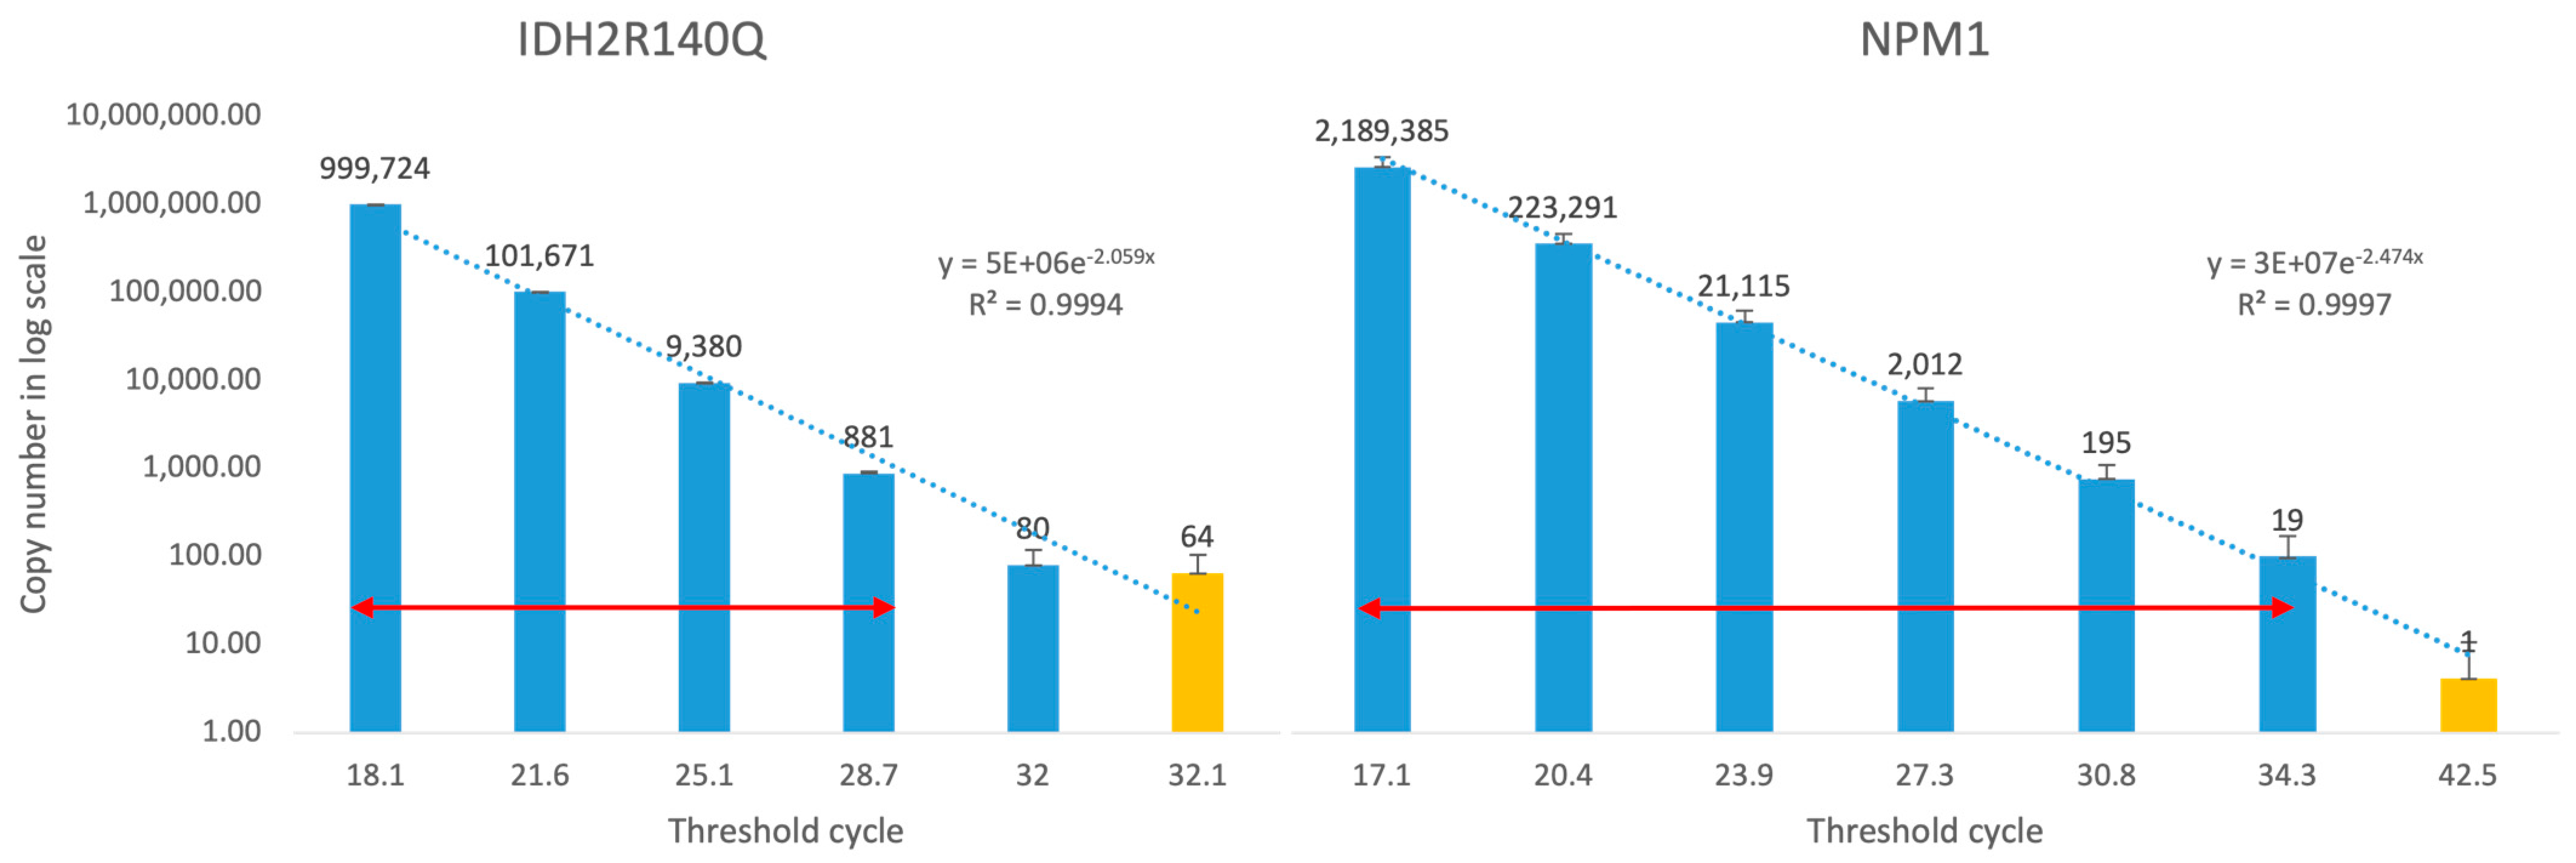
2.4. Linearity and Limit of Detection
3. Results
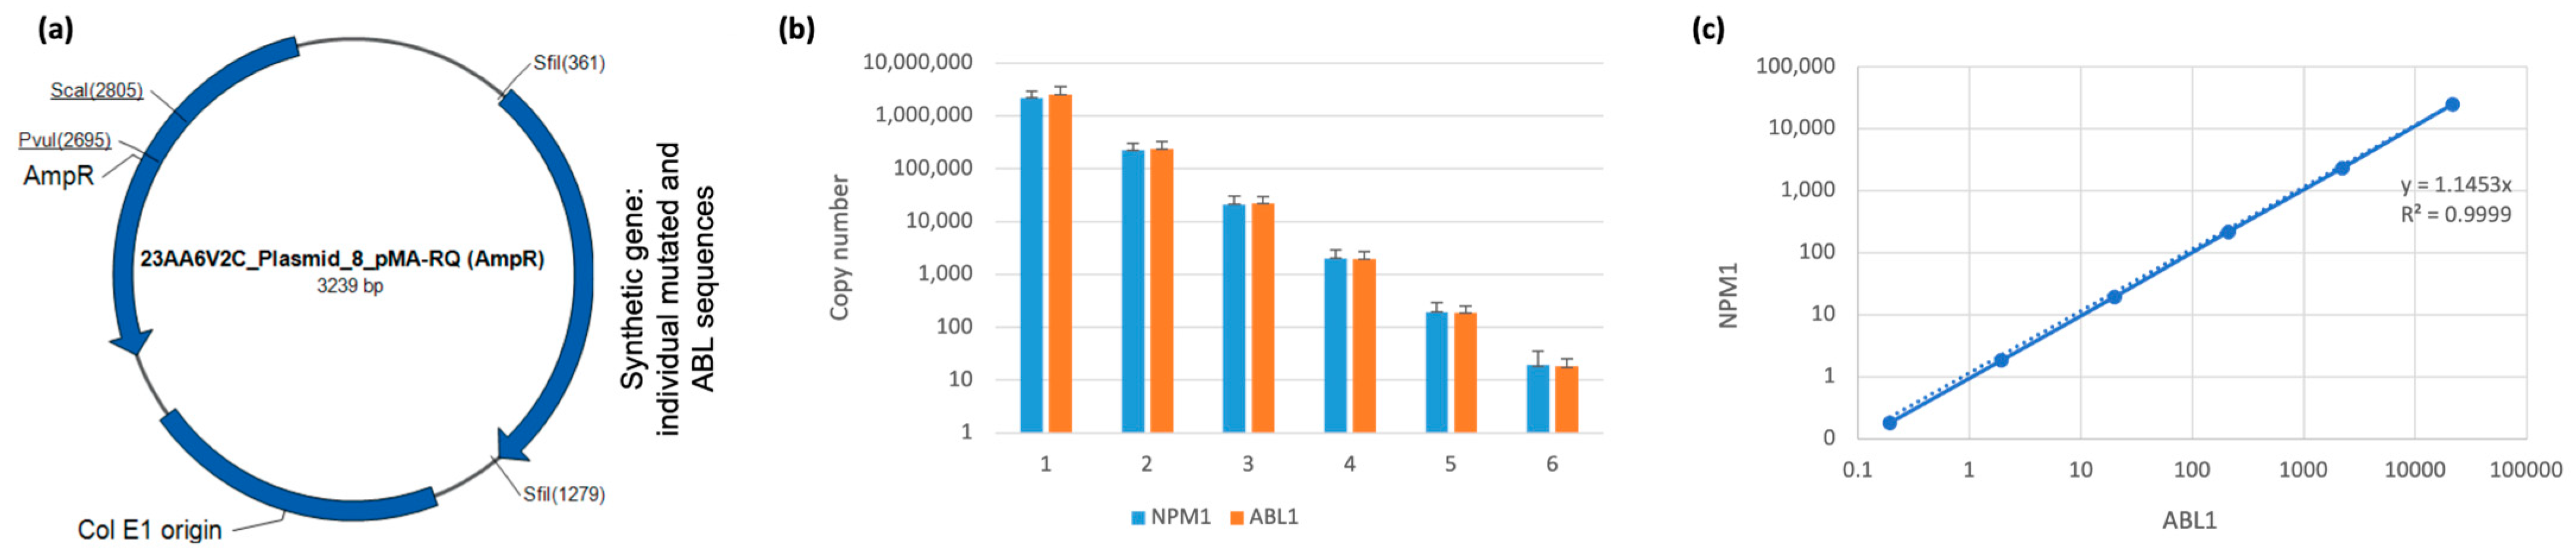
3.1. Generation and Validation of Plasmid-Base PCR for MRD Monitoring
3.2. Patient Characteristics and Mutation Profile
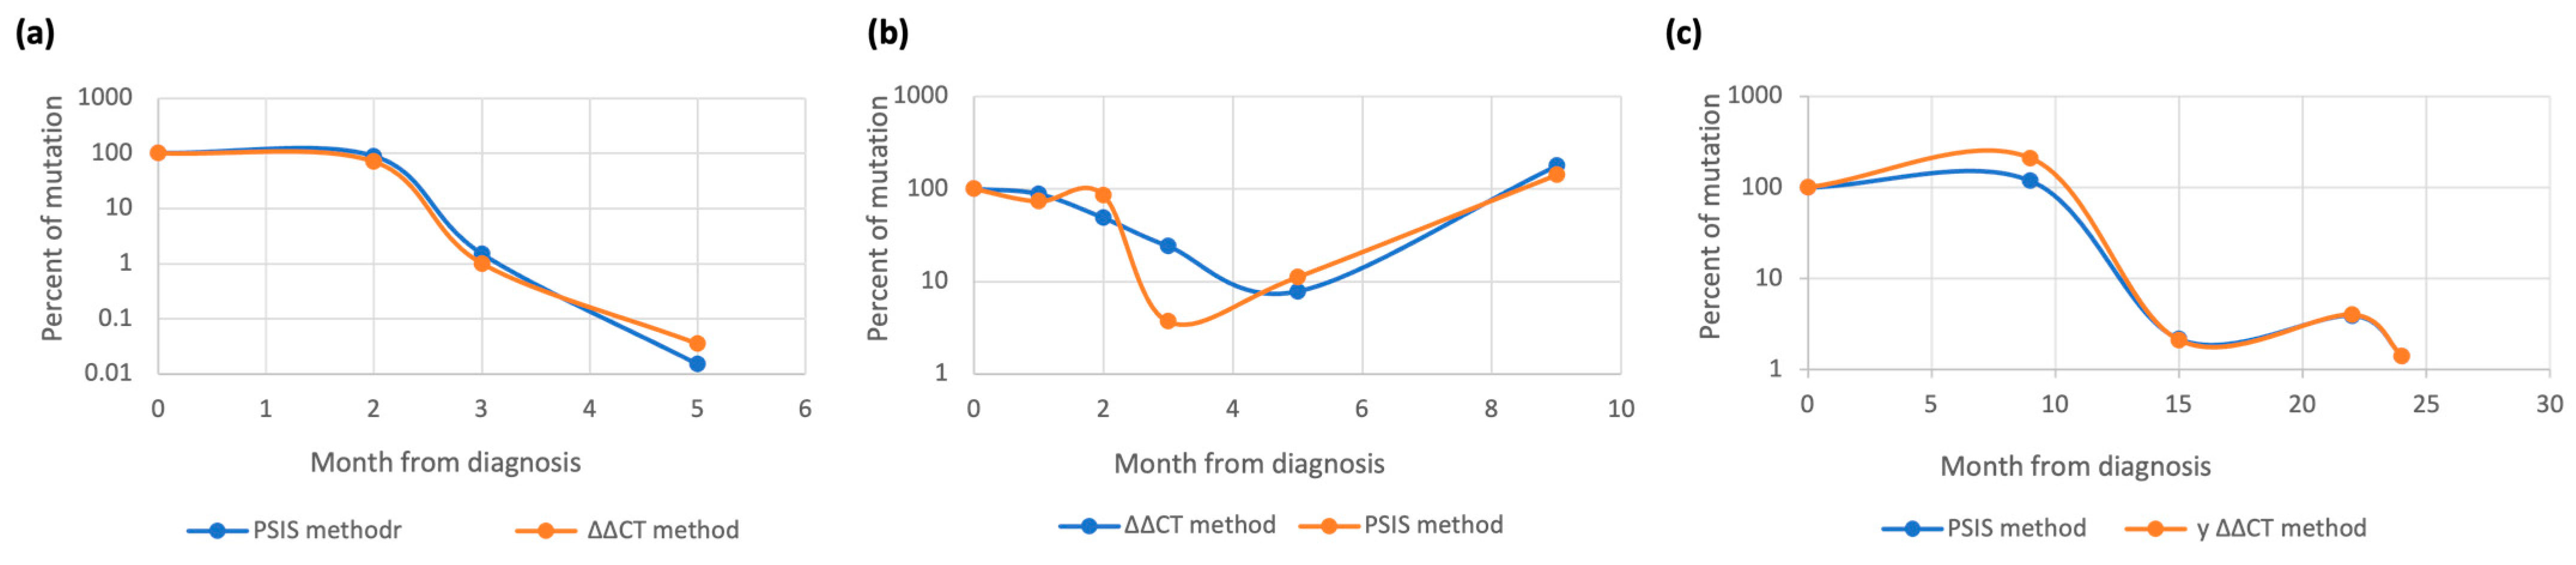
3.2.1. RUNX1 Monitoring
3.2.2. NPM1 Monitoring
3.2.3. IDH1/2 Monitoring
4. Discussion
5. Conclusions
Supplementary Materials
Author Contributions
Funding
Institutional Review Board Statement
Informed Consent Statement
Data Availability Statement
Conflicts of Interest
References
- Döhner, H.; Wei, A.H.; Appelbaum, F.R.; Craddock, C.; DiNardo, C.D.; Dombret, H.; Ebert, B.L.; Fenaux, P.; Godley, L.A.; Hasserjian, R.P.; et al. Diagnosis and Management of AML in Adults: 2022 Recommendations from an International Expert Panel on Behalf of the ELN. Blood 2022, 140, 1345–1377. [Google Scholar] [CrossRef] [PubMed]
- Tettero, J.M.; Freeman, S.; Buecklein, V.; Venditti, A.; Maurillo, L.; Kern, W.; Walter, R.B.; Wood, B.L.; Roumier, C.; Philippé, J.; et al. Technical Aspects of Flow Cytometry-Based Measurable Residual Disease Quantification in Acute Myeloid Leukemia: Experience of the European LeukemiaNet MRD Working Party. HemaSphere 2022, 6, e676. [Google Scholar] [CrossRef]
- Heuser, M.; Freeman, S.D.; Ossenkoppele, G.J.; Buccisano, F.; Hourigan, C.S.; Ngai, L.L.; Tettero, J.M.; Bachas, C.; Baer, C.; Béné, M.-C.; et al. 2021 Update on MRD in Acute Myeloid Leukemia: A Consensus Document from the European LeukemiaNet MRD Working Party. Blood 2021, 138, 2753–2767. [Google Scholar] [CrossRef] [PubMed]
- Ivey, A.; Hills, R.K.; Simpson, M.A.; Jovanovic, J.V.; Gilkes, A.; Grech, A.; Patel, Y.; Bhudia, N.; Farah, H.; Mason, J.; et al. Assessment of Minimal Residual Disease in Standard-Risk AML. N Engl. J. Med. 2016, 374, 422–433. [Google Scholar] [CrossRef] [PubMed]
- Balsat, M.; Renneville, A.; Thomas, X.; de Botton, S.; Caillot, D.; Marceau, A.; Lemasle, E.; Marolleau, J.-P.; Nibourel, O.; Berthon, C.; et al. Postinduction Minimal Residual Disease Predicts Outcome and Benefit from Allogeneic Stem Cell Transplantation in Acute Myeloid Leukemia with NPM1 Mutation: A Study by the Acute Leukemia French Association Group. J. Clin. Oncol. Off. J. Am. Soc. Clin. Oncol. 2017, 35, 185–193. [Google Scholar] [CrossRef]
- Tiong, I.S.; Loo, S. Targeting Measurable Residual Disease (MRD) in Acute Myeloid Leukemia (AML): Moving beyond Prognostication. Int. J. Mol. Sci. 2023, 24, 4790. [Google Scholar] [CrossRef] [PubMed]
- Meddi, E.; Savi, A.; Moretti, F.; Mallegni, F.; Palmieri, R.; Paterno, G.; Buzzatti, E.; Del Principe, M.I.; Buccisano, F.; Venditti, A.; et al. Measurable Residual Disease (MRD) as a Surrogate Efficacy-Response Biomarker in AML. Int. J. Mol. Sci. 2023, 24, 3062. [Google Scholar] [CrossRef]
- Buccisano, F.; Palmieri, R.; Piciocchi, A.; Maurillo, L.; Del Principe, M.I.; Paterno, G.; Soddu, S.; Cerretti, R.; De Angelis, G.; Mariotti, B.; et al. Use of Measurable Residual Disease to Evolve Transplant Policy in Acute Myeloid Leukemia: A 20-Year Monocentric Observation. Cancers 2021, 13, 1083. [Google Scholar] [CrossRef]
- Short, N.J.; Zhou, S.; Fu, C.; Berry, D.A.; Walter, R.B.; Freeman, S.D.; Hourigan, C.S.; Huang, X.; Nogueras Gonzalez, G.; Hwang, H.; et al. Association of Measurable Residual Disease with Survival Outcomes in Patients with Acute Myeloid Leukemia: A Systematic Review and Meta-Analysis. JAMA Oncol. 2020, 6, 1890–1899. [Google Scholar] [CrossRef]
- Venditti, A.; Piciocchi, A.; Candoni, A.; Melillo, L.; Calafiore, V.; Cairoli, R.; de Fabritiis, P.; Storti, G.; Salutari, P.; Lanza, F.; et al. GIMEMA AML1310 Trial of Risk-Adapted, MRD-Directed Therapy for Young Adults with Newly Diagnosed Acute Myeloid Leukemia. Blood 2019, 134, 935–945. [Google Scholar] [CrossRef]
- Löwenberg, B.; Pabst, T.; Maertens, J.; Gradowska, P.; Biemond, B.J.; Spertini, O.; Vellenga, E.; Griskevicius, L.; Tick, L.W.; Jongen-Lavrencic, M.; et al. Addition of Lenalidomide to Intensive Treatment in Younger and Middle-Aged Adults with Newly Diagnosed AML: The HOVON-SAKK-132 Trial. Blood Adv. 2021, 5, 1110–1121. [Google Scholar] [CrossRef] [PubMed]
- Short, N.J.; Macaron, W.; Kadia, T.; Dinardo, C.; Issa, G.C.; Daver, N.; Wang, S.; Jorgensen, J.; Nguyen, D.; Bidikian, A.; et al. Clinical Outcomes and Impact of Therapeutic Intervention in Patients with Acute Myeloid Leukemia Who Experience MEASURABLE RESIDUAL DISEASE (MRD) Recurrence Following MRD-negative Remission. Am. J. Hematol. 2022, 97, E408–E411. [Google Scholar] [CrossRef] [PubMed]
- Wei, A.H.; Iland, H.J.; Reynolds, J.; Loo, S.; Chua, C.C.; Westerman, D.; Tiong, I.S.; Ivey, A.; Blombery, P.; Anstee, N.S.; et al. ALLG AMLM26 Phase 1B/2 Study Investigating Novel Therapies to Target Early Relapse and Clonal Evolution as Pre-Emptive Therapy in AML (INTERCEPT): A Multi-Arm, Precision-Based, Recursive, Platform Trial. Blood 2022, 140, 3341–3343. [Google Scholar] [CrossRef]
- Mosalem, O.; Abdelsamia, M.; Abdelhakim, H. MRD Assessment Using NGS in Patients with Acute Myeloid Leukemia Undergoing Hematopoietic Stem Cell Transplantation: Meta-Analysis. J. Clin. Oncol. 2021, 39, e19002. [Google Scholar] [CrossRef]
- Della Starza, I.; De Novi, L.A.; Elia, L.; Bellomarino, V.; Beldinanzi, M.; Soscia, R.; Cardinali, D.; Chiaretti, S.; Guarini, A.; Foà, R. Optimizing Molecular Minimal Residual Disease Analysis in Adult Acute Lymphoblastic Leukemia. Cancers 2023, 15, 374. [Google Scholar] [CrossRef]
- Sharma, N.; Liesveld, J.L. NPM 1 Mutations in AML-The Landscape in 2023. Cancers 2023, 15, 1177. [Google Scholar] [CrossRef]
- Hoermann, G.; Greiner, G.; Griesmacher, A.; Valent, P. Clonal Hematopoiesis of Indeterminate Potential: A Multidisciplinary Challenge in Personalized Hematology. J. Pers. Med. 2020, 10, 94. [Google Scholar] [CrossRef]
- Rothenberg-Thurley, M.; Amler, S.; Goerlich, D.; Köhnke, T.; Konstandin, N.P.; Schneider, S.; Sauerland, M.C.; Herold, T.; Hubmann, M.; Ksienzyk, B.; et al. Persistence of Pre-Leukemic Clones during First Remission and Risk of Relapse in Acute Myeloid Leukemia. Leukemia 2018, 32, 1598–1608. [Google Scholar] [CrossRef]
- Yu, T.; Chi, J.; Wang, L. Clinical Values of Gene Alterations as Marker of Minimal Residual Disease in Non-M3 Acute Myeloid Leukemia. Hematology 2021, 26, 848–859. [Google Scholar] [CrossRef]
- Heuser, M.; Heida, B.; Büttner, K.; Wienecke, C.P.; Teich, K.; Funke, C.; Brandes, M.; Klement, P.; Liebich, A.; Wichmann, M.; et al. Posttransplantation MRD Monitoring in Patients with AML by Next-Generation Sequencing Using DTA and Non-DTA Mutations. Blood Adv. 2021, 5, 2294–2304. [Google Scholar] [CrossRef]
- Nachmias, B.; Krichevsky, S.; Filon, D.; Even-Or, E.; Gatt, M.E.; Saban, R.; Avni, B.; Grisariu, S.; Aumann, S.; Vainstein, V. Monitoring Minimal Residual Disease in RUNX1-Mutated Acute Myeloid Leukemia. Acta Haematol. 2022, 145, 642–649. [Google Scholar] [CrossRef]
- Gabert, J.; Beillard, E.; van der Velden, V.H.J.; Bi, W.; Grimwade, D.; Pallisgaard, N.; Barbany, G.; Cazzaniga, G.; Cayuela, J.M.; Cavé, H.; et al. Standardization and Quality Control Studies of “real-Time” Quantitative Reverse Transcriptase Polymerase Chain Reaction of Fusion Gene Transcripts for Residual Disease Detection in Leukemia–A Europe Against Cancer Program. Leukemia 2003, 17, 2318–2357. [Google Scholar] [CrossRef] [PubMed]
- Brüggemann, M.; Schrauder, A.; Raff, T.; Pfeifer, H.; Dworzak, M.; Ottmann, O.G.; Asnafi, V.; Baruchel, A.; Bassan, R.; on behalf of the European Working Group for Adult Acute Lymphoblastic Leukemia (EWALL) and the International Berlin–Frankfurt–Münster Study Group (I-BFM-SG); et al. Standardized MRD Quantification in European ALL Trials: Proceedings of the Second International Symposium on MRD Assessment in Kiel, Germany, 18–20 September 2008. Leukemia 2010, 24, 521–535. [Google Scholar] [CrossRef] [PubMed]
- Corces-Zimmerman, M.R.; Hong, W.-J.; Weissman, I.L.; Medeiros, B.C.; Majeti, R. Preleukemic Mutations in Human Acute Myeloid Leukemia Affect Epigenetic Regulators and Persist in Remission. Proc. Natl. Acad. Sci. USA 2014, 111, 2548–2553. [Google Scholar] [CrossRef] [PubMed]
- Dillon, R.; Potter, N.; Freeman, S.; Russell, N. How We Use Molecular Minimal Residual Disease (MRD) Testing in Acute Myeloid Leukaemia (AML). Br. J. Haematol. 2021, 193, 231–244. [Google Scholar] [CrossRef]
- Schuurhuis, G.J.; Heuser, M.; Freeman, S.; Béné, M.-C.; Buccisano, F.; Cloos, J.; Grimwade, D.; Haferlach, T.; Hills, R.K.; Hourigan, C.S.; et al. Minimal/Measurable Residual Disease in AML: A Consensus Document from the European LeukemiaNet MRD Working Party. Blood 2018, 131, 1275–1291. [Google Scholar] [CrossRef]
- Pfaffl, M.W. A New Mathematical Model for Relative Quantification in Real-Time RT-PCR. Nucleic Acids Res. 2001, 29, e45. [Google Scholar] [CrossRef]
- Li, Y.; Solis-Ruiz, J.; Yang, F.; Long, N.; Tong, C.H.; Lacbawan, F.L.; Racke, F.K.; Press, R.D. NGS-Defined Measurable Residual Disease (MRD) after Initial Chemotherapy as a Prognostic Biomarker for Acute Myeloid Leukemia. Blood Cancer J. 2023, 13, 59. [Google Scholar] [CrossRef]
- Patkar, N.; Kakirde, C.; Shaikh, A.F.; Salve, R.; Bhanshe, P.; Chatterjee, G.; Rajpal, S.; Joshi, S.; Chaudhary, S.; Kodgule, R.; et al. Clinical Impact of Panel-Based Error-Corrected next Generation Sequencing versus Flow Cytometry to Detect Measurable Residual Disease (MRD) in Acute Myeloid Leukemia (AML). Leukemia 2021, 35, 1392–1404. [Google Scholar] [CrossRef]
- Guijarro, F.; Garrote, M.; Villamor, N.; Colomer, D.; Esteve, J.; López-Guerra, M. Novel Tools for Diagnosis and Monitoring of AML. Curr. Oncol. Tor. Ont. 2023, 30, 5201–5213. [Google Scholar] [CrossRef]
- Jongen-Lavrencic, M.; Grob, T.; Hanekamp, D.; Kavelaars, F.G.; Al Hinai, A.; Zeilemaker, A.; Erpelinck-Verschueren, C.A.J.; Gradowska, P.L.; Meijer, R.; Cloos, J.; et al. Molecular Minimal Residual Disease in Acute Myeloid Leukemia. N. Engl. J. Med. 2018, 378, 1189–1199. [Google Scholar] [CrossRef] [PubMed]
- Christen, F.; Hoyer, K.; Yoshida, K.; Hou, H.-A.; Waldhueter, N.; Heuser, M.; Hills, R.K.; Chan, W.; Hablesreiter, R.; Blau, O.; et al. Genomic Landscape and Clonal Evolution of Acute Myeloid Leukemia with t(8;21): An International Study on 331 Patients. Blood 2019, 133, 1140–1151. [Google Scholar] [CrossRef] [PubMed]

| # | Sex | ECOG | Age | BM Blasts % | WBC Dx | Karyo-Type | Co-Mutations | DN/Sec | Plasmid Mutation | Induction | Salvage/ Consolidation | BMT | Death Cause | FU |
|---|---|---|---|---|---|---|---|---|---|---|---|---|---|---|
| 1 | M | 1 | 61 | 1.7 | 1.5 | −7Q | TET2 DNMT3 FLT3 | Sec-TR | Runx1 | azacitidine | pevonidestat | no | MM | 30 m |
| 2 | M | 2 | 72 | 22 | 4.30 | Nk | TET2 SRSF2 SF3B1 | DN | Runx1 | Aza + ven | gilteritinib | MUD | 12 m | |
| 3 | M | 1 | 66 | 8 | 1.50 | Nk | BCORL1 SRSF2 | Sec-MDS | Runx1 | Aza + ven | MRF | 3 m | ||
| 4 | F | 0 | 59 | 40 | 3.5 | t3:3 | ASXL1 SF3B1 | DN | Runx1 | 7 + 3 | HAM | MUD | 36 m | |
| 5 | F | 1 | 91 | 22 | 65 | Nk | ASXL1 SRSF2 FLT3 | DN | Runx1 | Aza + ven | no | 13 m | ||
| 6 | M | 1 | 74 | 70 | 2.5 | Tetra- ploid | FLT3 IDH1 PHF6 SRSF2 | DN | Runx1 | Aza + ven | no | 10 m | ||
| 7 | F | 0 | 39 | 20 | 7.1 | Nk | BCOR WT1 DNMT3A KIT | DN | Runx1 | 7 + 3 + mido | flag + ida + ven | MRM | 9 m | |
| 8 | M | 2 | 76 | 50 | 0.9 | iso14 | BCOR SRSF2 TET2 | DN | Runx1 | Decitabine (trial)r | Aza + ven | no | 82 m | |
| 9 | F | 0 | 55 | 65 | 77 | Nk | CEBPA TET2 MYC | DN | NPM1 | 7 + 3 | HIDAC | HAP | acute GVHD | 19 m |
| 10 | F | 0 | 48 | 30 | 9.9 | t3:11 | FLT3 | DN | NPM1 | 7 + 3 + mido | HIDAC | MUD | 16 m | |
| 11 | F | 2 | 42 | 30 | 1.90 | Nk | PTPN11 TET2 | Sec-TR | NPM1 | Aza + ven | MUD | 24 m | ||
| 12 | F | 0 | 19 | 80 | 1.30 | Nk | None | DN | NPM1 | 7 + 3 | HIDAC | MUD | 58 m | |
| 13 | M | 0 | 24 | 60 | 1.5 | Nk | None | DN | NPM1 | 7 + 3 + mido | HIDAC | no | 35 m | |
| 14 | M | 2 | 81 | 45 | 1.9 | Nk | ASXL1 STAT3 STAG2 SRSF2 | Sec-MDS | IDH2 | Aza + ven | no | Re-AML | 15 m | |
| 15 | M | 0 | 60 | 45 | 9 | tri11 | U2AF1 DMNT3A | DN | IDH2 | 7 + 3 | flag + ida + ven | MUD | 10 m | |
| 16 | F | 2 | 62 | 70 | 3.7 | mon7 | BCOR DNMT3A EZH2 | DN | IDH2 | Aza + ven | MRM | 17 m | ||
| 17 | M | 2 | 69 | 50 | 1.4 | Nk | RUNX1 | DN | IDH2 | Aza + ven | no | 22 m | ||
| 18 | F | 1 | 57 | 10 | 1.6 | Nk | JAK2 MPL DMNT3A | Sec-ET | IDH2 | Aza + ven | MUD | 15 m | ||
| 19 | M | 1 | 77 | 85 | 2.4 | tri8 | SRSF2 BCOR RUNX1 | DN | IDH1 | Aza + ven +/− magro (trial) | no | 4 m |
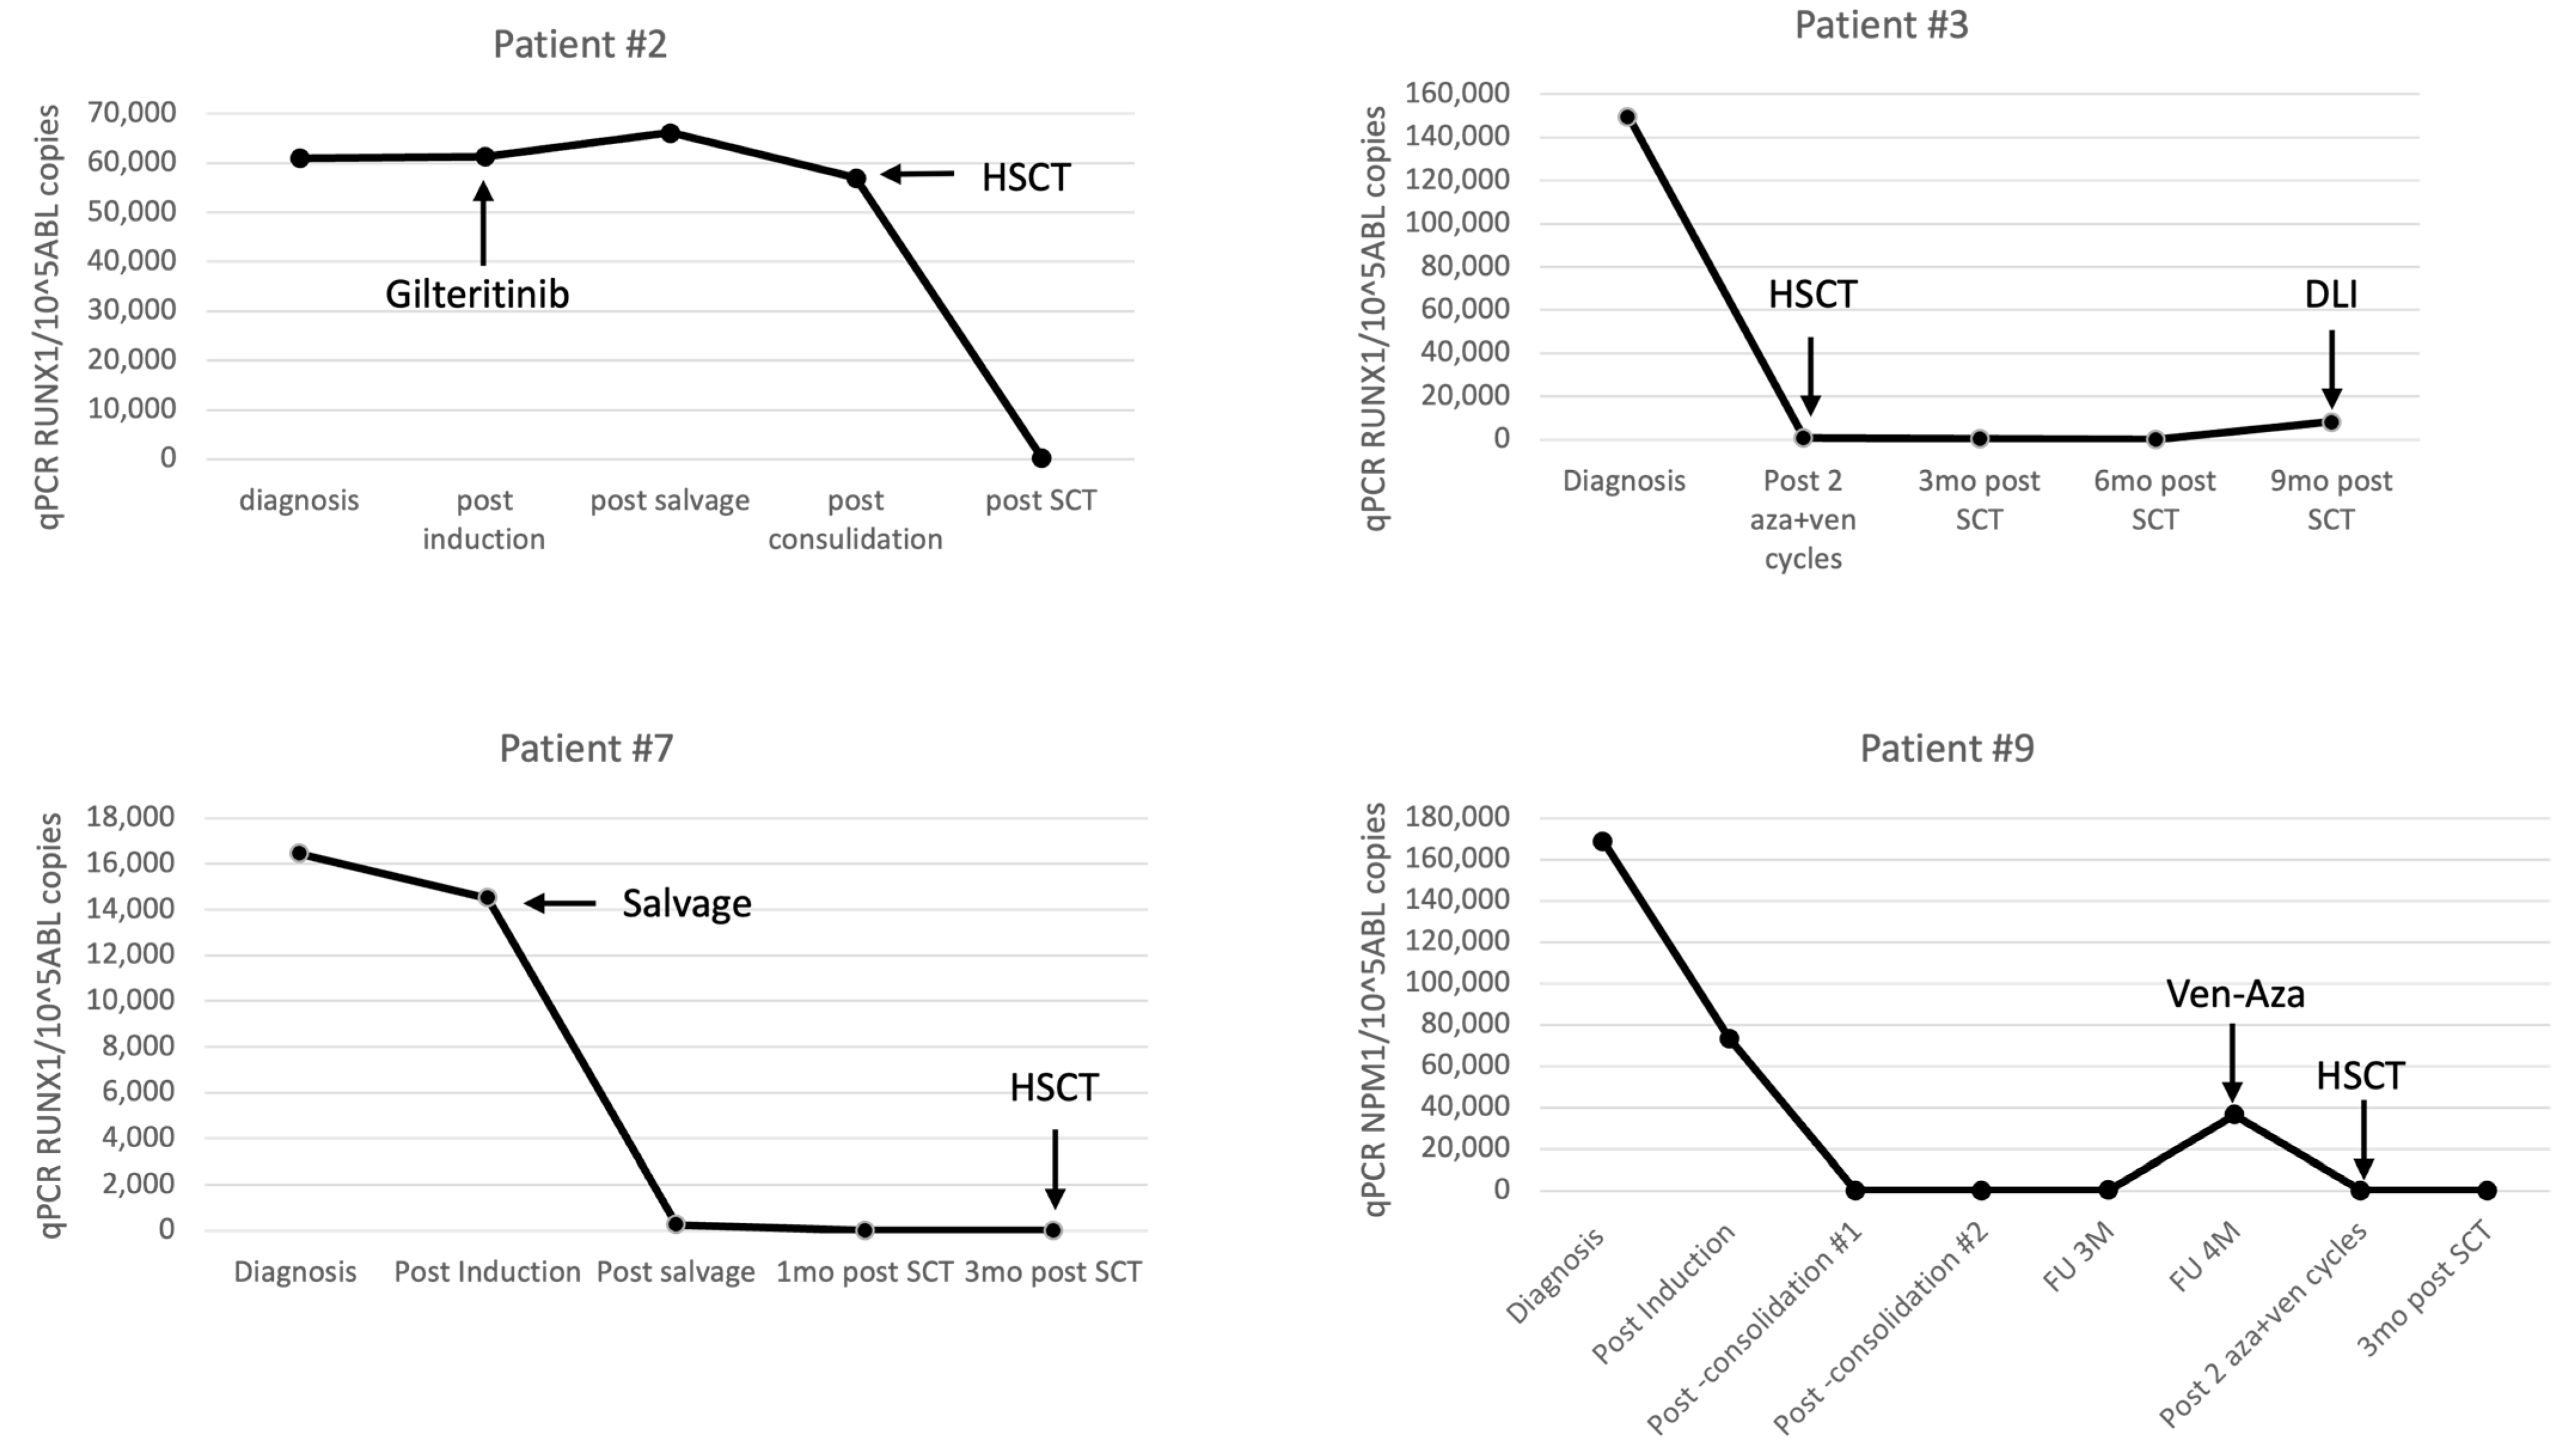
| RUNX1 Patient | Diagnosis | Post Induction | Post Salvage | Post Consolidation | Post-Transplant 1 m | FU 3 M | FU 6 M | FU 12 M | |||
|---|---|---|---|---|---|---|---|---|---|---|---|
| 2 | IP | 40% | 10% | 4% | 3.1% | 1% | 1.5% | ||||
| STR | BM 100% | BM 100% | |||||||||
| RUNX1 qPCR CN/105ABL | 61,023 | 61,369 | 66,152 | 56,979 | 315 | ||||||
| 4 | IP | 40% | 40% | 2.6% | 2.2% | 2.6% | 1.6% | 1.4% | 1.5% | ||
| STR | BM 100% | BM 100% | BM 97% | BM 100% | |||||||
| RUNX1 qPCR CN/105ABL | 436,945 | neg | neg | neg | neg | ||||||
| 7 | IP | 20% | 15% | 1.4% | 1.4% | 1.4% | |||||
| STR | BM 100% | BM 100% | |||||||||
| RUNX1 qPCR CN/105ABL | 16,459 | 14,505 | 260 | neg | neg | ||||||
| NPM1 Patient | Diagnosis | Post Induction | Post Consol. | Post Consol. | FU 3 M | FU 4 M | Post MRD Eraser cy 1 | Post MRD Eraser cy 2 | Post-Transplant 1 m | FU 3M | |
| 9 | IP | 65% | 1.7% | 1.8% | 2.4% | 1.5% | 2% | 2% | 0.8% | 2.7% | |
| STR | BM 58% | ||||||||||
| NPM1 qPCR CN/105ABL | 168,717 | 73,274 | 68 | 45 | 258 | 36,362 | 39 | neg | |||
| 10 | IP | 30% | 3% | 0.6% | 1.8% | 1.2% | 1% | ||||
| STR | BM 100% | BM 100% | |||||||||
| NPM1 qPCR CN/105ABL | 1,038,889 | 15,557 | 239 | 79 | neg | neg | |||||
| IDH Patient | Diagnosis | Post Induction | Post Consol./Salvage | Post-Transplant 3 m | FU 6 M | FU 9 M | FU 12 M | ||||
| 15 | IP | 45% | 10% | 1.5% | 2% | ||||||
| STR | BM 100% | ||||||||||
| IDH2 qPCR CN/105ABL | 96,964 | 967 | neg | ||||||||
| 16 | IP | 35% | 3.3% | 5% | 1.8% | 1.4% | |||||
| STR | BM 100% | BM100% | |||||||||
| IDH2 qPCR CN/105ABL | 45,308 | neg | 106 | neg | neg | ||||||
| 18 | IP | 10% | 2.5% | 2.2% | 0.8% | 1.8% | 1.2% | ||||
| STR | BM 98% | BM 100% | BM 100% | ||||||||
| IDH2 qPCR CN/105ABL | 8911 | 50,659 | neg | neg | 70 | neg | |||||
| Patient | Diagnosis | Post Induction/ 1st Aza + Ven Cyc | Post Consol. | Post Consol. | FU 3 M/ Post 3 Aza + Ven Cycles | FU 6 M/ Post 6 Aza + Ven Cycles | FU 8 M/ Post 8 Aza + Ven Cycles | FU 12 M/ Post 12 Aza + Ven Cycles | FU 24 M/ Post 24 Aza + Ven Cycles | |
|---|---|---|---|---|---|---|---|---|---|---|
| 13 | IP | 60% | 4% | 1.9% | 2.3% | 2.1% | 2% | 1.3% | 1.5% | |
| NPM1 qPCR CN/105ABL | 1,414,578 | 216 | 45 | 40 | 3.2 | 0.76 | ||||
| 17 | IP | 50% | 2.5% | 2.6% | 1.1% | 1.5% | 0.5% | |||
| IDH2 qPCR CN/105ABL | 115,521 | 57,677 | 4681 | 2149 | 2243 | 403 |
| Patient | Diagnosis | Post Induction | Post Consol. | FU 12 M | FU 24 M | FU 30 M | FU 33 M | FU 36 M | FU 37 M | Post Salvage | FU 6 M | |
|---|---|---|---|---|---|---|---|---|---|---|---|---|
| 12 | IP | 63% | 3.5% | 1.6% | 2.5% | 2.6% | 3% | 10% | 18% | 26% | 1% | 2% |
| STR | BM 100% | |||||||||||
| NPM1 qPCR CN/105ABL | 3,221,400 | 49 | neg | neg | 314 | 98,700 | 463,417 | 529,710 | 828,789 | neg | neg |
Disclaimer/Publisher’s Note: The statements, opinions and data contained in all publications are solely those of the individual author(s) and contributor(s) and not of MDPI and/or the editor(s). MDPI and/or the editor(s) disclaim responsibility for any injury to people or property resulting from any ideas, methods, instructions or products referred to in the content. |
© 2023 by the authors. Licensee MDPI, Basel, Switzerland. This article is an open access article distributed under the terms and conditions of the Creative Commons Attribution (CC BY) license (https://creativecommons.org/licenses/by/4.0/).
Share and Cite
Nachmias, B.; Krichevsky, S.; Gatt, M.E.; Gross Even-Zohar, N.; Shaulov, A.; Haran, A.; Aumann, S.; Vainstein, V. Standardization of Molecular MRD Levels in AML Using an Integral Vector Bearing ABL and the Mutation of Interest. Cancers 2023, 15, 5360. https://doi.org/10.3390/cancers15225360
Nachmias B, Krichevsky S, Gatt ME, Gross Even-Zohar N, Shaulov A, Haran A, Aumann S, Vainstein V. Standardization of Molecular MRD Levels in AML Using an Integral Vector Bearing ABL and the Mutation of Interest. Cancers. 2023; 15(22):5360. https://doi.org/10.3390/cancers15225360
Chicago/Turabian StyleNachmias, Boaz, Svetlana Krichevsky, Moshe E. Gatt, Noa Gross Even-Zohar, Adir Shaulov, Arnon Haran, Shlomzion Aumann, and Vladimir Vainstein. 2023. "Standardization of Molecular MRD Levels in AML Using an Integral Vector Bearing ABL and the Mutation of Interest" Cancers 15, no. 22: 5360. https://doi.org/10.3390/cancers15225360
APA StyleNachmias, B., Krichevsky, S., Gatt, M. E., Gross Even-Zohar, N., Shaulov, A., Haran, A., Aumann, S., & Vainstein, V. (2023). Standardization of Molecular MRD Levels in AML Using an Integral Vector Bearing ABL and the Mutation of Interest. Cancers, 15(22), 5360. https://doi.org/10.3390/cancers15225360