Simple Summary
The progression of colorectal cancer is promoted by changes in the genetic makeup of tumour cells giving them potential to leave the site of their origin to seed new metastatic tumours in other tissue; inflammation at the tumour site is a driver of these changes. Tumour necrosis factor-alpha is a pro-inflammatory molecule that is associated with the progression of metastatic cancer. Small biologically active RNAs, microRNAs, target the production of specific proteins and are proposed as agents of tumour change. One agent, microRNA-21, shown to be present in colorectal cancer, is known to target the formation of proteins involved in metastatic changes in cells. We investigated the relationship between TNF-α and microRNA-21 in colorectal cancer cells and show their involvement in promoting cell changes indicative of the metastatic state. In summary, we provide mechanistic support for a role of microRNA-21 in tumour necrosis factor-alpha promotion of cancer cell metastatic change.
Abstract
Colorectal cancer is driven by genetic and epigenetic changes in cells to confer phenotypes that promote metastatic transformation and development. Tumour necrosis factor-alpha (TNF-α), a pro-inflammatory mediator, regulates cellular communication within the tumour microenvironment and is associated with the progression of the metastatic phenotype. Oncogenic miR-21 has been shown to be overexpressed in most solid tumours, including colorectal cancer, and is known to target proteins involved in metastatic transformation. In this study, we investigated the relationship between TNF-α and miR-21 regulation in colorectal cancer epithelial cells (SW480 and HCT116). We observed that TNF-α, at concentrations reported to be present in serum and tumour tissue from colorectal cancer patients, upregulated miR-21 expression in both cell lines. TNF-α treatment also promoted cell migration, downregulation of the expression of E-cadherin, a marker of epithelial to mesenchymal transition, and anti-apoptotic BCL-2 (a validated target for miR-21). Knockdown of miR-21 had the opposite effect on each of these TNF-a induced phenotypic changes. Additionally, in the SW480 cell line, although TNF-α treatment selectively induced expression of a marker of metastatic progression VEGF-A, it failed to affect MMP2 expression or invasion activity. Our data indicate that exposing colorectal cancer epithelial cells to TNF-α, at concentrations occurring in the serum and tumour microenvironment of colorectal cancer patients, upregulated miR-21 expression and promoted the metastatic phenotype.
1. Introduction
Colorectal cancer (CRC), the second leading cause of cancer-related mortality [1], is the third most common cancer in men and second in women [2,3]. Whilst age is a factor of the disease, recently the incidence of CRC has increased in those younger than 50 years old [4]. Despite the fact that early detection and advances in treatment have reduced mortality of CRC [5], survival rates have not significantly improved [4]. Thus, there is a need for deeper understanding of the underlying molecular mechanisms involved in CRC to facilitate the development of new diagnostic and therapeutic strategies.
Chronic inflammation is a known risk factor for CRC development, progression, metastasis, and resistance to cancer therapy [6,7,8]. We have previously shown that the expression of several inflammatory mediators are upregulated in CRC tissue [9,10,11]. Tumour necrosis factor-alpha (TNF-α) is an inflammatory mediator, one of several present at high levels in solid tumours and the serum of CRC patients [12,13,14] that have been implicated in metastatic development. TNF-α concentrations in excess of 36 pg/mL have been reported in the circulation of patients with CRC [13] and levels of up to 25 pg/mL have been reported in CRC tumour tissues [15]. Metastatic changes range from the migration of primary tumour cells to adjacent normal tissues, to migration and invasion to distant organs to create secondary tumours [16]. The specific mechanisms by which cancerous cells acquire the metastatic phenotype are complex and not fully understood, but involve epithelial to mesenchymal transition (EMT). The loss of cellular E-cadherin expression is considered as a hallmark in the transition of non-invasive tumour to invasive carcinoma and constitutes a fundamental step of the EMT [17,18]. It has been shown that TNF-α stimulates EMT by reducing E-cadherin expression in hepatic cancer cells [19] and melanoma cells [20] and to increase cell motility, migration, and invasion in colonic epithelial cells [21,22].
MicroRNAs (miRs) are powerful post-transcriptional mediators of gene-expression, the dysregulation of which has been strongly linked to the development of numerous cancers [23,24,25,26,27]. MiRs can regulate the expression of numerous proteins involved with every stage of tumour development including the enhanced expression of proto-oncogenes, inhibition of tumour suppressor genes, and the expression of key proteins involved with cancer-associated pathways and metastases [23,28,29]. Whilst the mechanisms of miR control of gene expression is primarily intracellular, it is now apparent that cell-to-cell crosstalk can be achieved via secretion, transport, and delivery of protein and miR packaged exosomes [30,31]. Within the tumour microenvironment (TME) cell-to-cell communication via micro-vesicles is recognized to be an important factor in tumour cell development and progression to the metastatic phenotype [32], and miR cargos have been proposed as contributors to these phenotypic changes [31]. Patel et al. [31] determined the expression of multiple miRs in HCT116 and SW480 cells in response to treatment with IL-6 and report that the expression of miRs-21 and -29b were particularly affected. Of these two miRs, miR-21 is known to be oncogenic and strongly associated with tumour progression; it is a potential mediator of metastatic potential [25,27] and its expression is upregulated in many tumours [33,34,35,36,37,38,39,40].
Collectively, these observations implicate inflammatory mediators and miRs as agents of tumour progression. In particular, our previous studies have identified the strong association of inflammatory mediators with the progression of colorectal cancer [9,10,11,26] and the ability of TNF-α to promote DNA damage in colorectal cancer cells [41]. Additionally, co-localisation of TNF-α and miR-21 expression, particularly at the tumour leading edge, of colorectal cancer has been reported [42]. However, the driver of the increased expression of miR-21 and its role in the pathogenesis of CRC are not well understood.
The role of TNF-α in the development of cancer and the associated elevated miR-21 expression has prompted us to investigate potential mechanisms whereby these mediators influence the progression of the metastatic phenotype in colorectal cancer epithelial cells. The SW480 and HCT116 colon cancer epithelial cells were chosen since they represent different metastatic stages, being isolated from a colorectal cancer patient at Duke’s B stage and from a patient at Duke’s D stage, respectively. Here, we report mechanistic evidence that supports a relationship between the pro-inflammatory cytokine TNF-α and miR-21 in the progression of colorectal cancer epithelial cells towards a metastatic phenotype.
2. Materials and Methods
2.1. Cell Culture and Treatment
Human colorectal adenocarcinoma cell lines HCT116 and SW480 were purchased from the American Tissue Culture Collection ATCC (LGC Prochem, Middx, UK). Cells were routinely cultured in RPM1640 medium (GIBCO, Life technologies, Paisley, UK) supplemented with 10% fetal bovine serum (FBS), penicillin (100 units/mL), streptomycin (100 μg/mL), and 2 mM L-glutamine all purchased from GIBCO, Life technologies, Paisley, UK. Cells were cultured at 37 °C in a humidified atmosphere with 5% CO2 and incubated for various times (up to 5 days) in the absence or presence of TNF-α (0.01, 0.1, 1, 10, and 100 pg/mL) as indicated in the text and figure legends. In some experiments, an NF-kB inhibitor, bortezomib (BZ, 0.13 mM) (LC laboratories), was included in incubations 4.5 h prior to the TNF-α treatments, as indicated in the text and figure legends [41].
2.2. Wound Healing Assay
Cells (105) were plated in a 24-well plate in 1 mL of RPM1640 medium with 5% dextran-coated charcoal-stripped FBS (GIBCO, Life technologies, Paisley, UK) per well for 72 h until confluent. Cells were then wounded in the monolayer using small sterile 10 µL tips to create a channel (at time 0). Cells were washed with PBS (GIBCO, Life technologies, Paisley, UK) and 1 mL of culture medium supplemented with 5% dextran-coated charcoal-stripped FBS was added. TNF-α treatments (0.01 to 100 pg/mL) were added to cells and incubated for up to 72 h; physiological concentrations of TNF-α in tissue has been reported to be ~10 pg/mL [43] and up to 25 pg/mL in colorectal cancer tissue [15]. The distance between the two sides of the wound (channel) was captured at multiple points (at least 4 determinations per data point) with an inverted optical microscope and analysed by Image J software.
Wound closure at time t was calculated as a fraction of the distance between the two sides of the wound at time zero. For graphical presentation, the fraction was converted to a % of the distance at time zero (%migration).
The percentage migration was calculated as follows:
%migration = (average of wound width at 0 h − average of wound width at t h)/average of wound width at 0 h × 100%.
2.3. Transwell Migration and Invasion
For migration assay, a 24-transwell insert system (BD Falcon, Oxford, UK) with 8 μm pore size was used. Each well comprised an upper chamber and a lower chamber separated by the 8 mm pore size membrane; both chambers were immersed in culture media. Cells (3 × 10⁴ per well) were plated in 100 µL of culture medium RPM1640 supplemented with 1% dextran-coated charcoal-stripped FBS (GIBCO, Life technologies, Paisley, UK) in the upper chamber of the insert system containing TNF-α (0 to 100 pg/mL). Culture medium containing 10% FBS (100 μL) was added to each of the lower chambers as a chemoattractant and cells were incubated for 72 h. The number of cells that had migrated through the 8 mm pore membrane to the lower chamber was determined by incubation with alamarBlue reagent (10% final volume) (Invitrogen, Life technologies, Carlsbad, CA, USA) according to manufacturer’s protocol (4 h at 37 °C). Under these conditions, alamarBlue is enzymically converted to fluorescent resorufin by viable cells, which can be measured in a spectrofluorometer. The enzymic formation of resorufin is proportional to cell number. Results are expressed as a percentage compared with vehicle control.
For the invasion assay, Matrigel invasion inserts (USA, catalogue number: 354480) were used. Each Matrigel insert contained a Matrigel coating on an 8 µm pore size PET membrane. The Matrigel matrix-coated inserts were initially hydrated with warm RPMI medium for 2 h at 37 °C. After hydration, the hydrating media was removed and the insert was placed in each well of a 24-well plate. RPMI culture medium (100 μL) supplemented with 5% dextran-coated charcoal-stripped FBS including TNF-α (0 to 100 pg/mL) was added in the Matrigel chambers, and 100 µL of culture medium with 10% FBS were added to the bottom well to act as a chemo attractant. Each well, therefore, comprised an upper chamber and a lower chamber separated by the Matrigel-coated 8 mm pore size membrane; both chambers were immersed in culture media. The number of cells that had migrated through the membrane to the lower chamber compared to the vehicle control was determined using alamarBlue reagent as described above.
2.4. Cell Proliferation
Cell proliferation was determined using alamarBlue (Invitrogen, Life technologies) according to the manufacturer’s protocol. Cells were cultured in 24-well plates at a density of 5 × 10⁴ cells per well. Healthy viable cells maintain a reducing potential within their cytosol to convert alamarBlue reagent into fluorescent resorufin. AlamarBlue was added at a final concentration of 10% for each well and incubated for 4 h at 37 °C for each treatment time point. The resorufin fluorescent intensity was measured in a FLUOstar plate reader (BMG, Labtech, Ortenberg, Germany) at excitation 560 nm/emission 590 nm. The fluorescence intensity is proportional to the cell number.
2.5. RNA and MiRNA Extraction
Total RNA and miRNA were extracted from cells using an RNeasy Micro Kit (QIAGENE, Hilden, Germany) according to the manufacturer’s protocol. Briefly, cell pellets (106 cells) were disrupted with QIAzol Lysis Reagent (700 μL) and homogenised with vortex mixing for 1 min. The homogenate was left at room temperature for 5 min to dissociate the nucleoprotein complexes. Chloroform (140 μL) was added with vigorous shaking for 15 s, left at ambient for 2–3 min, then centrifuged (12,000× g for 15 min). The upper colourless aqueous phase was transferred to a collection tube and 1.5 volumes of ethanol (100%) was added with mixing, and then, the whole was transferred to an RNEasy MinElute spin column in a collection tube. The tube (spin column) was centrifuged (8000× g, 15 s) at room temperature and the flow through was discarded. Buffer RPE (500 μL) was added onto the RNEasy MinElute spin column and the tube centrifuged (800× g, 15 s); the flow through was discarded. Ethanol (80%, 500 μL) was added to the RNEasy MinElute spin column, centrifuged (8000× g, 15 s), and the flow through discarded. The RNEasy MinElute spin column was then centrifuged at high speed (5 min) to dry the membrane. RNase-free water (14 μL) was added to the spin column membrane and centrifuged at high speed to elute the RNA (total RNA including miRNA). RNA concentrations were measured by nano-spectrophotometer (Implen, Essex, UK) and the purity of the extracted RNA was assessed using the ratio of absorbance at 260/280 nM and 260/230 nm. Extracted RNA samples were stored at −80 °C until required.
2.6. Reverse Transcription and RT-qPCR
The reverse transcription of messenger RNA and micro-RNA was performed as previously described [41] using superscript II (Invitrogen, life Technologies) and TaqMan micro-RNA reverse transcription kits (Applied biosystems, Thermo Fisher Scientific, Oxford, UK), respectively. Quantitative real time PCR was performed using TaqMan predesigned expression assay for E-cadherin (Hs01023895_m1) selected as a biomarker of EMT transition, BCL-2 (Hs04986394_s1) a predicted mRNA target of miR-21 obtained using TargetScan version 7.0 [44], GAPDH (Hs99999905_m1), MMP2 (Hs00234422_m1), VEGF-A (Hs00900054_m1), U6 (TM&RT:001973), and hsa-miR-21-5p (TM&RT:000397). Fast PCR master mix (TaqMan, applied biosystem, life technologies) was used according to the manufacturer’s protocol. The results of the RT-qPCR were normalized to internal control genes GAPDH and U6.
2.7. MiRNA Inhibitor Transfection
miRNA mimics and inhibitors were obtained from MirVana (Thermo Fisher Scientific). Cells were cultured in a 24-well plate at 5 × 10⁴ cell/well and incubated with antibiotics-free RPMI 1640 medium (GIBCO, Life technologies, Paisley, UK) overnight. The medium was then replaced with Opti-MEM medium (400 μL/well) (GIBCO, GRAND Island, NY, USA) and cells were transfected with Lipofectamine RNAiMAX reagent (8 μL) (Invitrogen, Carlsbad, CA, USA) with final miRNA inhibitor concentrations of 20 μΜ. Cells were divided into 4 groups: control group (cells only), Lipofectamine-treated cells (reagents only), miR inhibitor control-treated (scrambled miRNA), and miRNA-21 inhibitor-treated. Transfection efficiency was assessed by FAM™ dye, labelled synthetic miRNA (scrambled), where the fluorescent label enables direct assessment of cellular uptake. The fluorescent intensity was measured in a FLUOstar plate reader (BMG, Labtech) at excitation 494 nm/emission 520 nm (POLARstar Galaxy, BMG Lab Technologies).
2.8. Statistical Analysis
All experiments were performed in triplicate for each single treatment and, unless stated in the text or figures, with three independent biological replicates. Data are reported as a mean and standard error of the mean (SEM) unless otherwise stated. GraphPad Prism software (GraphPad Prism 8, GraphPad Software Inc, La Jolla, CA, USA) was used for statistical analyses. Significant differences between independent means were determined using one-way analysis of variance (ANOVA) followed by a Dunnett’s post-test. p values < 0.05 were considered statistically significant.
3. Results
3.1. TNF-α Promotes Cell Proliferation
We evaluated cell proliferation in HCT116 and SW480 cells treated with physiologically relevant doses of TNF-α (0.01–100 pg/mL) over 5 days, assessed using alamarBlue assay. We found that TNF-α enhanced cell proliferation in SW480 cells at doses of 1, 10, and 100 pg/mL by day 5, but not with HCT116 (Figure 1A,B).
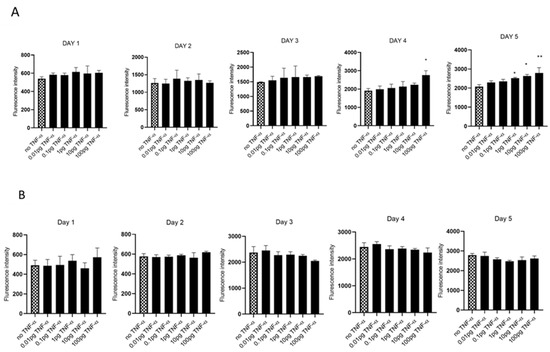
Figure 1.
Cell proliferation in response to TNF-α treatment. (A) SW480 and (B) HCT116 cells were treated with doses of TNF-α (0.01–100 pg/mL) over 5 days. Cell proliferation was determined using alamarBlue assay. Data are expressed as fluorescence intensities compared to vehicle control (no TNF-α treatment). Significant difference was calculated using one-way ANOVA followed by Dunnett’s test (GraphPad Prism 8, ** p < 0.01, * p < 0.05). Error bars represent the SEM for six replicates and two independent cultures.
MiR-21 has been shown to be upregulated and co-associated with TNF-α expression in colorectal cancer [42] and is positively associated with the progression of a metastatic phenotype [45]. We hypothesised that TNF-α treatment may promote the metastatic phenotype via the expression of miR-21. We, therefore, measured the expression level of miR-21 in response to TNF-α treatment and found it was significantly increased in both cell lines (p < 0.05), but with differing dose responses, being elevated at doses ≥ 0.1 pg/mL in SW480 and maximally induced at 1 pg/mL in HCT116 cells (Figure 2). This non-linear dose response is not easy to explain, but optimal effective concentrations of inflammatory mediators invariably peak at physiologically relevant levels, often in the pg/mL range, emphasizing the extreme potency of these biologically active molecules. To evaluate the potential involvement of miR-21 in CRC cell proliferation ability, we transfected mirVana miR-21 inhibitor, to bind and inhibit (knockdown) endogenous miR-21 expression. In preliminary experiments, transfection efficiency was determined by florescence quantification of FAM-labelled miRNA (scrambled) and was optimized for both cell lines at 24 h after transfection (Figure 3). Using a 24-hr transfection protocol, mirVana miR-21 inhibitor significantly reduced miR-21 expression and cell proliferation in SW480 cells (Figure 4A,B).
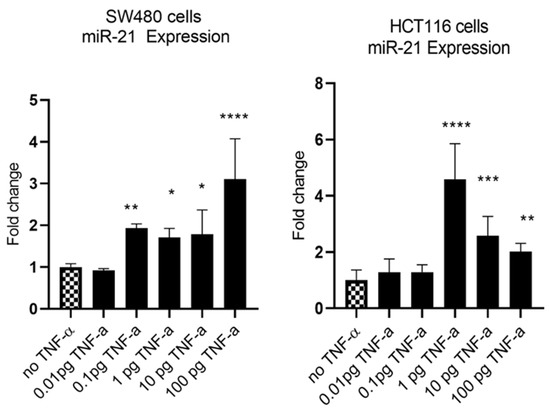
Figure 2.
TNF-α effects on miR-21 expression. SW480 and HCT116 cells were treated with 0 to 100 pg/mL of TNF-α for 24 h. MiR-21 expression was measured by RT-qPCR. Data were normalised to expression of U6 RNA and are shown relative to vehicle control (no TNF-α). Significant difference was calculated using one-way ANOVA with Dunnett’s test (GraphPad Prism 8, * p < 0.05, ** p < 0.01, *** p < 0.001, **** p < 0.0001). Data are presented as fold changes of three biological replicates relative to control. Error bars represent the SEM for independent cultures.
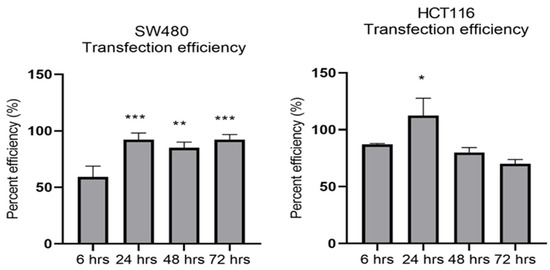
Figure 3.
Optimal time for transfection efficiency (TE). FAM dye-labelled synthetic scrambled miRNA control transfected with Lipofectamine RNAiMAX in SW480 and HCT116 cells. Transfected FAM dye-labelled miRNAs was measured by a plate reader at emission 520 nm and excitation 495 nm. Significant difference was calculated using one-way ANOVA with Dunnett’s test comparing to 6 h (the earliest time point) (GraphPad Prism 8, * p < 0.05, ** p < 0.01, *** p < 0.001). Data are presented as a mean percentage of efficiency. Error bars represent the SEM for six replicates and two independent cultures.
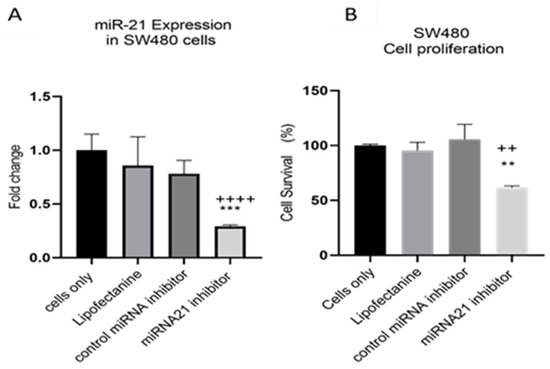
Figure 4.
SW480 cells transfected with miR-21 inhibitor. (A) miR-21 expression. Data were normalised to expression of U6; (B) cell proliferation determined using alamarBlue assay after transfection. Cell proliferation assay was performed over 5 days. Significant differences were calculated using one-way ANOVA followed by Dunnett’s test (GraphPad Prism 8). Data are presented as fold changes or percentages of cell survival of treatment groups relative to untreated group (cells only). Statistical comparisons between cells only vs. miR-21 inhibitor (++++ p < 0.001, ++ p < 0.01) and control miRNA inhibitor vs. miR-21 inhibitor (** p < 0.01, *** p < 0.001). Error bars represent the SEM for six replicates and two independent cultures.
3.2. TNF-a Promotes Cell Migration
To evaluate the proliferation and migratory potential of cells treated with TNF-α, a wound healing assay was performed. In both cell lines TNF-α treatment rapidly closed the wound compared with the controls (p < 0.0001) (Figure 5).
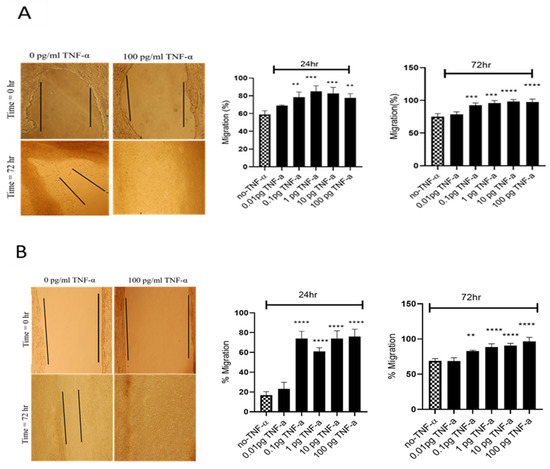
Figure 5.
Effects of TNF-α on wound healing in SW480 and HCT116 cells. Wound assays were performed over 72 h using (A) HCT116 and (B) SW480 cells treated with TNF-α (0.01–100 pg/mL). Pictures of wounded cells taken at 0 and 72 h with or without TNF-α treatment (10× magnification). Data are expressed as % compared to vehicle control (no-TNF-α). Significant difference was calculated using one-way ANOVA with Dunnett’s test comparing treated groups to vehicle control (GraphPad Prism 8, ** p < 0.01, *** p < 0.001, **** p < 0.0001). Error bars represent the SEM for three independent cultures.
The results of the wound assay were confirmed with a transwell migration assay that showed a dose-dependent statistically significant increase in cell migration in both cell lines treated with TNF-α (Figure 6A). To investigate whether miR-21 was involved in this induced migratory response, we performed a miR-21 knockdown. In SW480, and particularly in HCT116 cells, miR-21 knockdown resulted in a significant decrease in cell migration (Figure 6B).
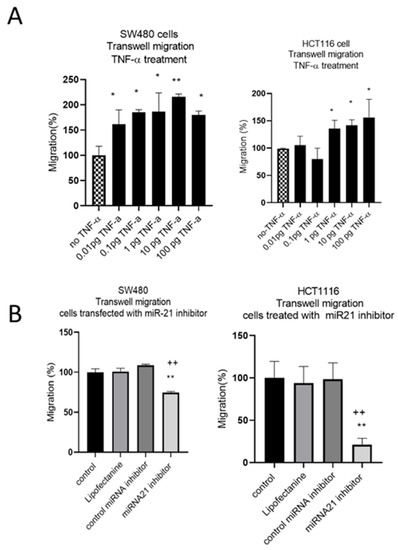
Figure 6.
SW480 and HCT116 transwell cell migration (A) cells treated with TNF-α. Error bars represent the SEM for three independent cultures; (B) cells transfected with miR-21 inhibitor. Error bars represent the SEM for six replicates and two independent cultures. Significant differences were calculated using one-way ANOVA followed by Dunnett’s test (GraphPad Prism 8). Statistical comparisons of TNF-α treatment vs. no TNF-α control, control vs. miR-21 inhibitor (* p < 0.05, ** p < 0.01), and control miRNA inhibitor vs. miR-21 inhibitor (++ p < 0.01).
Having established that TNF-α promoted migration in SW480 and HCT116 cells, we examined the ability of TNF-α treatment to promote an invasive phenotype using a transwell invasion assay. Irrespective of the TNF-α dose employed, the invasive phenotype was not observed in either cell type (Figure 7).
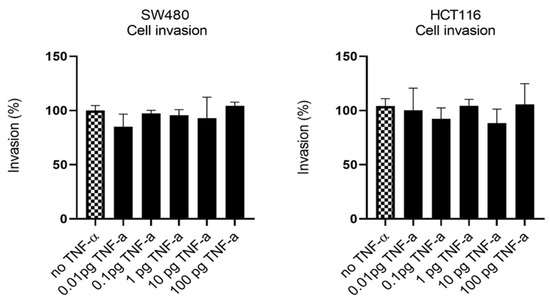
Figure 7.
Cell invasion in response to TNF-α treatment in SW480 and HCT116 cells. Cells were treated with a dose range of TNF-α (0.01–100 pg/mL). Cell invasions were determined using transwell Matrigel inserts and alamarBlue assay to assess invading cell numbers. Data are expressed as (%) compared to vehicle control (no TNF-α). Significant difference was calculated using one-way ANOVA followed by Dunnett’s test (GraphPad Prism 8). Error bars represent the SEM for three independent cultures.
3.3. TNF-α Alters E-Cadherin Expression
EMT is an evolutionary program that confers metastatic properties to cells through transformation from the nonmotile epithelial state to a motile mesenchymal state. Thus, we assessed the effect of TNF-α treatment and miR-21 expression on the loss of the epithelial biomarker E-cadherin. In both SW480 and HCT116 cells, treatment with TNF-α (≥1 pg/mL) reduced the expression of E-cadherin (Figure 8A), consistent with the acquisition of a more mesenchymal phenotype. Interestingly, at the very low dose of TNF-α (0.01 pg/mL) in HCT116 cells, E-cadherin, was significantly induced. Furthermore, knockdown of miR-21 resulted in a significant elevation of E-cadherin in both cell types (Figure 8B).
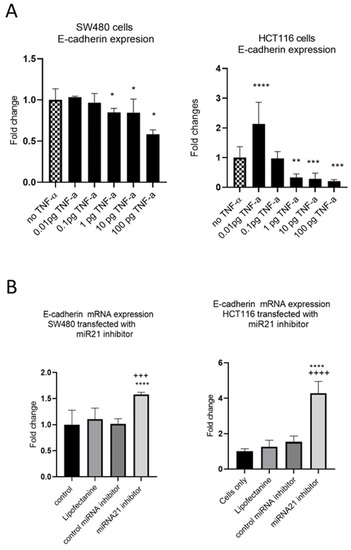
Figure 8.
E-cadherin mRNA expression in SW480 and HCT116. (A) E-cadherin expression in cells treated with TNF-α. Error bars represent the SEM for three independent cultures; Statistical comparisons of TNF-α treatment vs. no TNF-α control (* p < 0.05, ** p < 0.01, *** p < 0.001, **** p <0.0001). (B) E-cadherin expression in cells transfected with miR-21 inhibitor. E-cadherin expression was assessed by RT-qPCR. Error bars represent the SEM for six replicates and two independent cultures. Statistical comparisons of control vs. miR-21 inhibitor (**** p < 0.0001), and control miRNA inhibitor vs. miR-21 inhibitor (+++ p < 0.001, ++++ p <0.0001). Significant differences were calculated using one-way ANOVA followed by a Dunnett’s post-test (GraphPad Prism 8).
3.4. TNF-a Downregulates BCL-2 Expression
In our previous study we showed that TNF-α treatment activated the JNK signalling pathway [41]. A downstream target of JNK signalling is the anti-apoptotic protein BCL-2 and, coincidentally, the mRNA of BCL-2 is a predicted target for miR-21 with complementarity at the 3’ UTR (Figure 9A) (Targetscan; [46]). We, therefore, investigated the effect of TNF-α treatment on BCL-2 mRNA expression. TNF-α induced a biphasic response on BCL-2 mRNA expression in both cell lines. At low doses of TNF-α (≤0.1 pg/mL), BCL-2 was elevated in both cell lines, but this was statistically significant only in HCT116. At a higher dose of TNF-α (≥1 pg/mL), BCL-2 expression was significantly reduced (Figure 10). We then transfected cells with a miR-21 inhibitor to knockdown miR-21 expression and found that BCL-2 mRNA expression level was significantly increased in both cell lines (Figure 9), supporting the role of miR-21 in controlling the expression of BCL-2 mRNA.
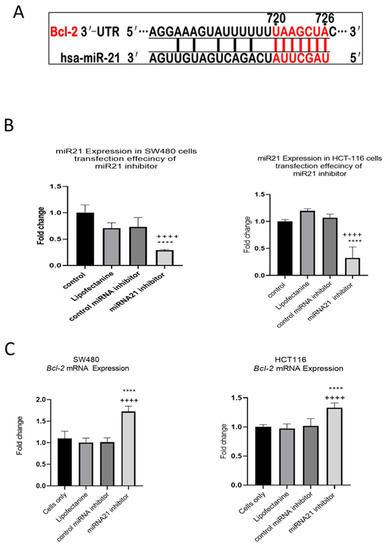
Figure 9.
Expression of miR-21 target gene BCL-2 in SW480 and HCT116 cells. (A) The 3′-UTR of BCL-2-mRNA is a target for miR-21 and the matching sequence is marked in red. The miRNA targets were predicted by Target Scan Human Release 6.2 (http://www.targetscan.org) (accessed on 15 September 2022); (B) effect of miR-21 inhibitor on miR-21 expression; (C) effect of miR-21 inhibitor on BCL-2 expression assessed by RT-qPCR. Significant differences were calculated using one-way ANOVA followed by Dunnett’s test (GraphPad Prism 8). Statistical comparisons between cells only vs. miR-21 inhibitor (++++ p < 0.0001) and control miRNA inhibitor vs. miR-21 inhibitor (**** p < 0.0001). Error bars represent the SEM for six replicates and two independent cultures.
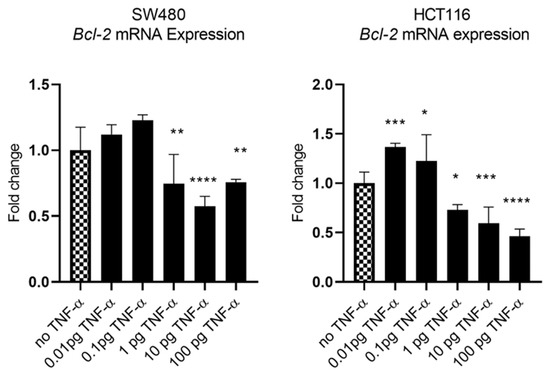
Figure 10.
BCL-2 mRNA expression in SW480 and HCT116 cells treated with TNF-α for 24 h. BCL-2 mRNA expression was measured by RT-qPCR. Data were normalised to expression of GAPDH and are shown relative to control (no TNF-α). Statistically significant differences were calculated using one-way ANOVA with Dunnett’s test (GraphPad Prism 8, * p < 0.05, ** p < 0.01, *** p < 0.001 **** p < 0.0001). Error bars represent the SEM for six replicates and two independent cultures.
3.5. TNF-α Alters VEGF-A Expression, but Not MMP2
The oncoprotein vascular endothelial growth factor A (VEGF-A) is pro-metastatic and is implicated in cell migration and invasion. Involved in angiogenesis, elevated levels of VEGF-A are a marker of metastasis and tends to be expressed at higher levels in cells with a more aggressive metastatic phenotype [47]. We treatedSW480 cells with TNF-αand found induced VEGF-A mRNA expression, in a dose-dependent manner, with induction being statistically significant at ≥1 pg/mL of TNF-α. In contrast, the treatment of HCT116 cells with TNF-α failed to affect the expression of VEGF-A at any of the doses employed (Figure 11A).
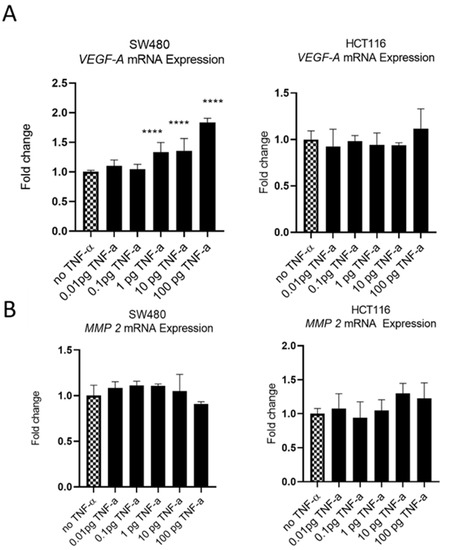
Figure 11.
VEGF-A (panel (A)) and MMP 2 (panel (B)) mRNA expression in response to TNF-α treatment in SW480 and HCT116 cells. Cells were treated with a dose range of TNF-α (0.01–100 pg/mL). Data are expressed as a fold change compared to vehicle control (no TNF-α). Significant difference was calculated using one-way ANOVA followed by Dunnett’s test (GraphPad Prism 8, ****p < 0.0001). Error bars represent the SEM for six replicates and two independent cultures.
Matrix metalloproteinase 2 (MMP2) is another protein that is involved in progressive metastatic transformation of cancer cells, where its protease activity is involved in the digestion of basement membrane proteins, thereby facilitating cellular movement from the primary site [48]. Elevated expression of MMP family proteins is, therefore, characteristic of metastatic cells. However, treatment of SW480 and HCT116 cells with TNF-a failed to alter the mRNA expression of MMP2 in either cell line (Figure 11B).
Constitutively active NF-kB is associated with aggressive features of tumour cells [9,10,11]. We previously reported that TNF-α activated the NF-kB pathway in SW480 cells [41]; therefore, we investigated the effect of NF-kB inhibition on VEGF-A expression in SW480 cells. Co-treatment of cells with TNF-α and NF-kB inhibitor bortezomib (BZ) decreased the expression of VEGF-A back to control levels compared to TNF-α treatment alone (Figure 12), supporting a role for NF-kB in regulating the expression of VEGF-A in CRC cells.
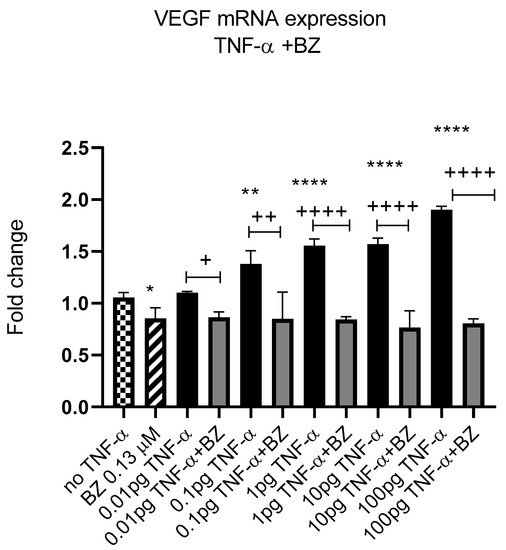
Figure 12.
NF-kB involvement in TNF-α-induced VEGF in SW480. Cells were treated with 0.13 μM of Bortezomib (BZ) with TNF-α dose range of (0.01–100 pg/mL) for 24 h. Significant differences are shown for comparisons between inhibitor treated cells vs. untreated cells (+ p < 0.05, ++ p < 0.01, ++++ p < 0.0001) and compared with vehicle control (no TNF-α) (* p < 0.05, ** p < 0.01, **** p < 0.0001). Significance was assessed using one-way ANOVA (GraphPad Prism 8). Data are presented as a mean and error bars represent the SEM for six replicates and two independent cultures.
4. Discussion
Metastatic transformation of cells is commonly associated with the presence of inflammatory mediators, such as TNF-α in the TME [49]. Whilst the inflammatory effects of these mediators are well studied and understood, the relationship between TNF-α and the metastatic transformation of cells within a TME is not yet clear. Metastatic transformation is a multifactorial process and the mechanisms involved in TNF-α-mediated phenotypic changes are complex. We have previously reported that miRs are present in the TME and are involved in signalling between cells [31] and, therefore, we hypothesised that inflammatory cytokines, such as TNF-α, may promote the metastatic phenotype via miRs. MiRNAs regulate gene expression by binding to their target mRNA leading to mRNA instability and degradation and stalling of translation; many miRs are dysregulated in the TME [50]. Therefore, understanding the role of miRs in TME is crucial. Pertinent to this, the oncogenic miR-21 has been found to be upregulated in tumours and is strongly associated with TNF-α expression and tumour progression and is a potential key mediator of metastatic potential [25,27,42] and also, therefore, a strong candidate as a TNF-α responsive mediator.
TNF-α concentrations in excess of 36 pg/mL have been reported in the circulation of patients with CRC [13] and our laboratory has reported TNF-α concentrations ranging from 5 to 25 pg/mL present in the TME of CRC patients [15]. Even at these low physiological concentrations, TNF-α remains a potent biological molecule. To the best of our knowledge, we, for the first time, show that at these physiologically relevant concentrations, the inflammatory mediator TNF-α induced miR-21 expression levels in human colonic epithelial cancer HCT116 and SW480 cells in a dose-dependent manner. Previous studies from our laboratory have shown that agents that affect miRNA expression can result in multiple diverse phenotypic alterations [26,31,51,52,53,54]. MiR-21 is reported to affect cell motility and stimulation of EMT [38,55], including the downregulation of genes such as E-cadherin, required to maintain the epithelial phenotype [55]. Having showed that TNF-α treatment enhanced miR-21 expression in both cell lines, we investigated the potential role of miR-21 in metastatic progression and downstream effects on miR-21 targets.
TNF-α is known to enhance cell migration and invasion, but the underlying mechanisms are still to be defined [56]. Here, treatment with TNF-α encouraged proliferation in SW480 cells, but failed to do so in HCT116 cells. This differential cellular response is likely to be attributable to the differing metastatic phenotype origins of the two cell types (Dukes stage B versus stage D). Interestingly, both cell types harbour RAS mutations; the SW480 cell line carries a mutation at codon 13 and HCT116 includes a mutation at codon 12. It is reported that, in terms of colorectal cancer, RAS mutation is a frequent event and carries a poorer prognosis compared to wild type RAS, but the influence of mutation at codon 12 versus codon 13 on prognosis is unresolved [57]. Additionally, it should be noted that SW480 carries a mutated p53 gene, whereas HCT116 cells are wild type p53, which is likely to impinge on the overall phenotypic characteristics of the two cell lines. On the other hand, the doubling time of both cell lines under similar conditions is comparable (~20 h); therefore, the differential (yet marginal) proliferative response of the two cell lines to TNF-α treatment is difficult to attribute beyond their phenotypic origins. We reported that the knockdown of miR-21, via transfection of a miR-21 inhibitor, led to a significant decrease in SW480 cell proliferation. Consistent with this, Zhong et al. [58] showed that the upregulation of miR-21 revealed a higher proportion of cells at S phase and significantly promoted cell proliferation in human lung cancer cell lines. In addition, the knockdown of miR-21 expression resulted in cell cycle arrest at G2/M phase and inhibited cell proliferation [58]. Others have confirmed an association between miR-21 expression and upregulation of the MAP-Kinase pathway leading to enhanced proliferation, migration, and inhibition of apoptosis [59]. We also used a wound assay, which assesses both cell proliferation and migration; TNF-α treatment induced wound closure in a dose-dependent manner in both cell lines. We then explored the treatment of cells with TNF-α in a transwell migration assay and showed that TNF-α strongly promoted the migration of both HCT116 and SW480 cells. These results are in keeping with studies reporting the promigratory activities of TNF-α in bladder, cervical, and melanoma cancer cells [60,61]. Furthermore, the oncomir miR-21 has been shown to promote cell migration and proliferation in breast cancer cells [38]. Consistent with this latter report, we showed that the knockdown of miR-21 prevented cell migration in SW480 and HCT116 cells, thereby linking TNF-α induction of miR-21 with promotion of cell migration. Interestingly, TNF-α treatment of both SW480 and HCT116 failed to induce a response in our in vitro invasion assay.
Having established that TNF-α treatment influenced cell proliferation (SW480 cells) and migration (SW480 and HCT116 cells) and that proliferation and migration could be inhibited with a miR-21 inhibitor, we considered the possibility that other proteins strongly associated with metastatic progression may also be affected. Another key process in metastatic progression is EMT. Of note here is that E-cadherin, a biomarker for the epithelial phenotype, was reported to be inversely correlated with miR-21 expression in cervical cancer cells [62]. We show here that the treatment of colon cancer epithelial cells with TNF-α decreased the expression of E-cadherin in SW480 cells in a dose-dependent manner. In contrast, in HCT116 cells, a very low dose TNF-α (0.01 pg/mL) induced E-cadherin expression, but doses ≥1 pg/mL significantly reduced expression in a dose-dependent manner. We also observed that the knockdown of miR-21 increased the expression of E-cadherin. This is consistent with reports from others that miR-21-deficient breast cancer cells exhibited a diminished N-cadherin, snail, and vimentin expression profile [38], supporting the notion that miR-21 plays a mechanistic role in EMT progression.
Additional characteristics of the metastatic phenotype include sustained proliferation, evasion of apoptosis, and resistance to DNA damage and chromosomal instability. Alotaibi et al. showed that TNF-α treatment enhanced DNA damage and chromosomal instability via activation of the c-Jun N-terminal Kinase (JNK) signalling pathway in colonic epithelial cancer cells [41]. Co-incidentally, a downstream target of JNK signalling is the anti-apoptotic protein B-cell lymphoma 2 (BCL-2) [46]. BCL-2 mRNA is a predicted and experimentally validated target for miR-21 in several cancers, including breast, lung, and glioblastoma [39,46]. We report here that TNF-α treatment downregulated the expression of the miR-21 target BCL-2 in both SW480 and HCT116. Conversely, the knockdown of miR-21 via the transfection of the miR-21 inhibitor elevated the expression of BCL-2. Thus, our results are consistent with our previous report [41], in which TNF-α enhanced DNA damage via the activation of the JNK pathway, and we extend this finding to the JNK downstream target BCL-2, the inhibition of which, by TNF-α-induced miR-21, might be expected to promote mitochondrial apoptosis dysfunction.
The ability of cancer cells to migrate and invade adjacent normal tissues is an important step in the development of the metastatic phenotype. An influential family of proteins involved in cell migration and invasion is the matrix metalloproteinases. For example, matrix metalloproteinase 2 (MMP2) is involved in the progressive metastatic transformation of cancer cells [48], including colorectal cancers [63]. The protease activity of the MMP family digests basement membrane proteins, thereby facilitating cellular progression from the primary site [48]. However, the treatment of SW480 and HCT116 cells with TNF-α failed to alter MMP2 expression in either cell line, consistent with the lack of activity of both cell lines in the invasion assay.
VEGF-A is involved in angiogenesis and cell migration and is known to be upregulated in most solid tumours, including CRC [64]. VEGF-A can be secreted by numerous cell types, including epithelial-derived cancer cells, and a high expression of VEGF proteins is a poor prognostic marker [64]. Here, we report that VEGF-A is upregulated in SW480 cells treated with TNF-α in a dose-dependent manner, but not in HCT116 cells. The reasons for this differential expression of VEGF-A in the two cell lines in response to TNF-α is not obvious from our data, but is again likely to be attributable to the differing phenotype origins of the two cell types (Dukes stage B versus stage D). The current data also showed that inhibition of NF-kB with bortezomib reduced the expression of VEGF-A, in line with similar findings in macrophage cells [65] and glioblastoma [66].
5. Conclusions
In summary, our findings are in agreement with reports of the strong correlation between inflammation and tumour development [8,9,10,11,26] and extends our understanding of these associations. Collectively, our data confirm a role for physiological levels of TNF-α present in the TME in driving the metastatic development of colorectal cancer epithelial cells, and offers mechanistic support for a role of TNF-α-mediated induction of miR-21 in facilitating the progression to the metastatic phenotype. We suggest that a confirmation of these TNF-α-mediated events in appropriate translational studies would support the strategy that targeting miR-21 in cancers such as CRC could offer novel therapeutic opportunities.
Author Contributions
A.G.A. conducted all the experiments, analysed and interpreted the data, and wrote the original draft of the manuscript. N.J.G. and J.V.L. reviewed and edited the manuscript. All authors have read and agreed to the published version of the manuscript.
Funding
This work was funded by King Abdulaziz City for Science and Technology (KACST). J.V.L. was supported by the European Research Council Starting Grant (715662) and MRC New Investigator Grant (MR/P002536/1).
Institutional Review Board Statement
Not applicable. For studies not involving humans or animals.
Informed Consent Statement
Not applicable for studies not involving humans.
Data Availability Statement
The data presented in this study are available on request from the corresponding author.
Conflicts of Interest
The authors declare that they have no known competing financial interest or personal relationship that could have appeared to influence the work reported in this paper.
References
- Ferlay, J.; Colombet, M.; Soerjomataram, I.; Parkin, D.M.; Pineros, M.; Znaor, A.; Bray, F. Cancer statistics for the year 2020: An overview. Int. J. Cancer 2021, 149, 778–789. [Google Scholar] [CrossRef]
- Dekker, E.; Tanis, P.J.; Vleugels, J.L.A.; Kasi, P.M.; Wallace, M.B. Colorectal cancer. Lancet 2019, 394, 1467–1480. [Google Scholar] [CrossRef]
- Bray, F.; Ferlay, J.; Soerjomataram, I.; Siegel, R.L.; Torre, L.A.; Jemal, A. Global cancer statistics 2018: GLOBOCAN estimates of incidence and mortality worldwide for 36 cancers in 185 countries. CA Cancer J. Clin. 2018, 68, 394–424. [Google Scholar] [CrossRef]
- Siegel, R.L.; Miller, K.D.; Fedewa, S.A.; Ahnen, D.J.; Meester, R.G.S.; Barzi, A.; Jemal, A. Colorectal cancer statistics, 2017. CA Cancer J. Clin. 2017, 67, 177–193. [Google Scholar] [CrossRef]
- Wolf, A.M.D.; Fontham, E.T.H.; Church, T.R.; Flowers, C.R.; Guerra, C.E.; LaMonte, S.J.; Etzioni, R.; McKenna, M.T.; Oeffinger, K.C.; Shih, Y.T.; et al. Colorectal cancer screening for average-risk adults: 2018 guideline update from the American Cancer Society. CA Cancer J. Clin. 2018, 68, 250–281. [Google Scholar] [CrossRef]
- Balkwill, F.; Charles, K.A.; Mantovani, A. Smoldering and polarized inflammation in the initiation and promotion of malignant disease. Cancer Cell 2005, 7, 211–217. [Google Scholar] [CrossRef]
- Schwager, S.C.; Taufalele, P.V.; Reinhart-King, C.A. Cell-Cell Mechanical Communication in Cancer. Cell. Mol. Bioeng. 2019, 12, 1–14. [Google Scholar] [CrossRef]
- Coussens, L.M.; Werb, Z. Inflammation and cancer. Nature 2002, 420, 860–867. [Google Scholar] [CrossRef]
- Maihofner, C.; Charalambous, M.P.; Bhambra, U.; Lightfoot, T.; Geisslinger, G.; Gooderham, N.J.; Colorectal Cancer, G. Expression of cyclooxygenase-2 parallels expression of interleukin-1beta, interleukin-6 and NF-kappaB in human colorectal cancer. Carcinogenesis 2003, 24, 665–671. [Google Scholar] [CrossRef]
- Charalambous, M.P.; Lightfoot, T.; Speirs, V.; Horgan, K.; Gooderham, N.J. Expression of COX-2, NF-kappaB-p65, NF-kappaB-p50 and IKKalpha in malignant and adjacent normal human colorectal tissue. Br. J. Cancer 2009, 101, 106–115. [Google Scholar] [CrossRef]
- Charalambous, M.P.; Maihofner, C.; Bhambra, U.; Lightfoot, T.; Gooderham, N.J.; Colorectal Cancer Study, G. Upregulation of cyclooxygenase-2 is accompanied by increased expression of nuclear factor-kappa B and I kappa B kinase-alpha in human colorectal cancer epithelial cells. Br. J. Cancer 2003, 88, 1598–1604. [Google Scholar] [CrossRef]
- Al Obeed, O.A.; Alkhayal, K.A.; Al Sheikh, A.; Zubaidi, A.M.; Vaali-Mohammed, M.A.; Boushey, R.; McKerrow, J.H.; Abdulla, M.H. Increased expression of tumor necrosis factor-alpha is associated with advanced colorectal cancer stages. World J. Gastroenterol. 2014, 20, 18390–18396. [Google Scholar] [CrossRef]
- Stanilov, N.; Miteva, L.; Dobreva, Z.; Stanilova, S. Colorectal cancer severity and survival in correlation with tumour necrosis factor-alpha. Biotechnol. Biotechnol. Equip. 2014, 28, 911–917. [Google Scholar] [CrossRef]
- Li, W.; Xu, J.; Zhao, J.; Zhang, R. Oxaliplatin and Infliximab Combination Synergizes in Inducing Colon Cancer Regression. Med. Sci. Monit. 2017, 23, 780–789. [Google Scholar] [CrossRef]
- Patel, S.A. Can Interleukin-6 Promote Human Colorectal Cancer Progression through Changes in microRNA Expression? Imperial College London: London, UK, 2015. [Google Scholar]
- Arneth, B. Tumor Microenvironment. Medicina 2019, 56, 15. [Google Scholar] [CrossRef]
- Thiery, J.P. Epithelial-mesenchymal transitions in tumour progression. Nat. Rev. Cancer 2002, 2, 442–454. [Google Scholar] [CrossRef]
- Voulgari, A.; Pintzas, A. Epithelial-mesenchymal transition in cancer metastasis: Mechanisms, markers and strategies to overcome drug resistance in the clinic. Biochim. Biophys. Acta (BBA)-Rev. Cancer 2009, 1796, 75–90. [Google Scholar] [CrossRef]
- Zhu, Y.; Cheng, Y.; Guo, Y.; Chen, J.; Chen, F.; Luo, R.; Li, A. Protein kinase D2 contributes to TNF-alpha-induced epithelial mesenchymal transition and invasion via the PI3K/GSK-3beta/beta-catenin pathway in hepatocellular carcinoma. Oncotarget 2016, 7, 5327–5341. [Google Scholar] [CrossRef]
- Mikesh, L.M.; Kumar, M.; Erdag, G.; Hogan, K.T.; Molhoek, K.R.; Mayo, M.W.; Slingluff, C.L., Jr. Evaluation of molecular markers of mesenchymal phenotype in melanoma. Melanoma Res. 2010, 20, 485–495. [Google Scholar] [CrossRef]
- Zhao, P.; Zhang, Z. TNF-alpha promotes colon cancer cell migration and invasion by upregulating TROP-2. Oncol. Lett. 2018, 15, 3820–3827. [Google Scholar]
- Bates, R.C.; Mercurio, A.M. Tumor necrosis factor-alpha stimulates the epithelial-to-mesenchymal transition of human colonic organoids. Mol. Biol. Cell 2003, 14, 1790–1800. [Google Scholar] [CrossRef]
- Bartel, D.P. MicroRNAs: Genomics, biogenesis, mechanism, and function. Cell 2004, 116, 281–297. [Google Scholar] [CrossRef]
- Gao, J.; Li, L.; Wu, M.; Liu, M.; Xie, X.; Guo, J.; Tang, H.; Xie, X. MiR-26a inhibits proliferation and migration of breast cancer through repression of MCL-1. PLoS ONE 2013, 8, e65138. [Google Scholar] [CrossRef]
- Gao, W.; Xu, J.; Liu, L.; Shen, H.; Zeng, H.; Shu, Y. A systematic-analysis of predicted miR-21 targets identifies a signature for lung cancer. Biomed. Pharmacother. 2012, 66, 21–28. [Google Scholar] [CrossRef]
- Patel, S.A.; Bhambra, U.; Charalambous, M.P.; David, R.M.; Edwards, R.J.; Lightfoot, T.; Boobis, A.R.; Gooderham, N.J. Interleukin-6 mediated upregulation of CYP1B1 and CYP2E1 in colorectal cancer involves DNA methylation, miR27b and STAT3. Br. J. Cancer 2014, 111, 2287–2296. [Google Scholar] [CrossRef]
- Volinia, S.; Calin, G.A.; Liu, C.G.; Ambs, S.; Cimmino, A.; Petrocca, F.; Visone, R.; Iorio, M.; Roldo, C.; Ferracin, M.; et al. A microRNA expression signature of human solid tumors defines cancer gene targets. Proc. Natl. Acad. Sci. USA 2006, 103, 2257–2261. [Google Scholar] [CrossRef]
- Calin, G.A.; Croce, C.M. MicroRNA signatures in human cancers. Nat. Rev. Cancer 2006, 6, 857–866. [Google Scholar] [CrossRef]
- Gooderham, N.J.; Koufaris, C. Using microRNA profiles to predict and evaluate hepatic carcinogenic potential. Toxicol. Lett. 2014, 228, 127–132. [Google Scholar] [CrossRef]
- Valadi, H.; Ekstrom, K.; Bossios, A.; Sjostrand, M.; Lee, J.J.; Lotvall, J.O. Exosome-mediated transfer of mRNAs and microRNAs is a novel mechanism of genetic exchange between cells. Nat. Cell Biol. 2007, 9, 654–659. [Google Scholar] [CrossRef]
- Patel, S.A.; Gooderham, N.J. IL6 Mediates Immune and Colorectal Cancer Cell Cross-talk via miR-21 and miR-29b. Mol. Cancer Res. 2015, 13, 1502–1508. [Google Scholar] [CrossRef]
- Wu, Q.; Liu, W.; Wang, J.; Zhu, L.; Wang, Z.; Peng, Y. Exosomal noncoding RNAs in colorectal cancer. Cancer Lett. 2020, 493, 228–235. [Google Scholar] [CrossRef] [PubMed]
- Schetter, A.J.; Leung, S.Y.; Sohn, J.J.; Zanetti, K.A.; Bowman, E.D.; Yanaihara, N.; Yuen, S.T.; Chan, T.L.; Kwong, D.L.; Au, G.K.; et al. MicroRNA expression profiles associated with prognosis and therapeutic outcome in colon adenocarcinoma. JAMA 2008, 299, 425–436. [Google Scholar] [CrossRef] [PubMed]
- Kjaer-Frifeldt, S.; Hansen, T.F.; Nielsen, B.S.; Joergensen, S.; Lindebjerg, J.; Soerensen, F.B.; dePont Christensen, R.; Jakobsen, A. The prognostic importance of miR-21 in stage II colon cancer: A population-based study. Br. J. Cancer 2012, 107, 1169–1174. [Google Scholar] [CrossRef] [PubMed]
- Iorio, M.V.; Ferracin, M.; Liu, C.G.; Veronese, A.; Spizzo, R.; Sabbioni, S.; Magri, E.; Pedriali, M.; Fabbri, M.; Campiglio, M.; et al. MicroRNA gene expression deregulation in human breast cancer. Cancer Res. 2005, 65, 7065–7070. [Google Scholar] [CrossRef] [PubMed]
- Ribas, J.; Ni, X.; Haffner, M.; Wentzel, E.A.; Salmasi, A.H.; Chowdhury, W.H.; Kudrolli, T.A.; Yegnasubramanian, S.; Luo, J.; Rodriguez, R.; et al. miR-21: An androgen receptor-regulated microRNA that promotes hormone-dependent and hormone-independent prostate cancer growth. Cancer Res. 2009, 69, 7165–7169. [Google Scholar] [CrossRef]
- Markou, A.; Tsaroucha, E.G.; Kaklamanis, L.; Fotinou, M.; Georgoulias, V.; Lianidou, E.S. Prognostic value of mature microRNA-21 and microRNA-205 overexpression in non-small cell lung cancer by quantitative real-time RT-PCR. Clin. Chem. 2008, 54, 1696–1704. [Google Scholar] [CrossRef]
- Arisan, E.D.; Rencuzogullari, O.; Cieza-Borrella, C.; Miralles Arenas, F.; Dwek, M.; Lange, S.; Uysal-Onganer, P. MiR-21 Is Required for the Epithelial-Mesenchymal Transition in MDA-MB-231 Breast Cancer Cells. Int. J. Mol. Sci. 2021, 22, 1557. [Google Scholar] [CrossRef]
- Xu, L.F.; Wu, Z.P.; Chen, Y.; Zhu, Q.S.; Hamidi, S.; Navab, R. MicroRNA-21 (miR-21) regulates cellular proliferation, invasion, migration, and apoptosis by targeting PTEN, RECK and Bcl-2 in lung squamous carcinoma, Gejiu City, China. PLoS ONE 2014, 9, e103698. [Google Scholar] [CrossRef]
- Ambros, V. The functions of animal microRNAs. Nature 2004, 431, 350–355. [Google Scholar] [CrossRef]
- Alotaibi, A.G.; Li, J.V.; Gooderham, N.J. Tumour necrosis factor-alpha (TNF-alpha) enhances dietary carcinogen-induced DNA damage in colorectal cancer epithelial cells through activation of JNK signaling pathway. Toxicology 2021, 457, 152806. [Google Scholar] [CrossRef]
- Moller, T.; James, J.P.; Holmstrom, K.; Sorensen, F.B.; Lindebjerg, J.; Nielsen, B.S. Co-Detection of miR-21 and TNF-alpha mRNA in Budding Cancer Cells in Colorectal Cancer. Int. J. Mol. Sci. 2019, 20, 1907. [Google Scholar] [CrossRef] [PubMed]
- Wyble, C.W.; Desai, T.R.; Clark, E.T.; Hynes, K.L.; Gewertz, B.L. Physiologic concentrations of TNFalpha and IL-1beta released from reperfused human intestine upregulate E-selectin and ICAM-1. J. Surg. Res. 1996, 63, 333–338. [Google Scholar] [CrossRef] [PubMed]
- Riffo-Campos, A.L.; Riquelme, I.; Brebi-Mieville, P. Tools for Sequence-Based miRNA Target Prediction: What to Choose? Int. J. Mol. Sci. 2016, 17, 1987. [Google Scholar] [CrossRef] [PubMed]
- Lai, C.Y.; Yeh, K.Y.; Liu, B.F.; Chang, T.M.; Chang, C.H.; Liao, Y.F.; Liu, Y.W.; Her, G.M. MicroRNA-21 Plays Multiple Oncometabolic Roles in Colitis-Associated Carcinoma and Colorectal Cancer via the PI3K/AKT, STAT3, and PDCD4/TNF-alpha Signaling Pathways in Zebrafish. Cancers 2021, 13, 5565. [Google Scholar] [CrossRef] [PubMed]
- Buscaglia, L.E.; Li, Y. Apoptosis and the target genes of microRNA-21. Chin. J. Cancer 2011, 30, 371–380. [Google Scholar] [CrossRef]
- Herzog, B.; Pellet-Many, C.; Britton, G.; Hartzoulakis, B.; Zachary, I.C. VEGF binding to NRP1 is essential for VEGF stimulation of endothelial cell migration, complex formation between NRP1 and VEGFR2, and signaling via FAK Tyr407 phosphorylation. Mol. Biol. Cell 2011, 22, 2766–2776. [Google Scholar] [CrossRef]
- Bodey, B.; Bodey, B., Jr.; Siegel, S.E.; Kaiser, H.E. Matrix metalloproteinase expression in malignant melanomas: Tumor-extracellular matrix interactions in invasion and metastasis. Vivo 2001, 15, 57–64. [Google Scholar]
- Laha, D.; Grant, R.; Mishra, P.; Nilubol, N. The Role of Tumor Necrosis Factor in Manipulating the Immunological Response of Tumor Microenvironment. Front. Immunol. 2021, 12, 656908. [Google Scholar] [CrossRef]
- Pan, Z.; Tian, Y.; Niu, G.; Cao, C. Role of microRNAs in remodeling the tumor microenvironment (Review). Int. J. Oncol. 2020, 56, 407–416. [Google Scholar] [CrossRef]
- Malik, D.E.; David, R.M.; Gooderham, N.J. Interleukin-6 selectively induces drug metabolism to potentiate the genotoxicity of dietary carcinogens in mammary cells. Arch. Toxicol. 2019, 93, 3005–3020. [Google Scholar] [CrossRef]
- Koufaris, C.; Wright, J.; Osborne, M.; Currie, R.A.; Gooderham, N.J. Time and dose-dependent effects of phenobarbital on the rat liver miRNAome. Toxicology 2013, 314, 247–253. [Google Scholar] [CrossRef] [PubMed]
- Papaioannou, M.D.; Koufaris, C.; Gooderham, N.J. The cooked meat-derived mammary carcinogen 2-amino-1-methyl-6-phenylimidazo[4,5-b]pyridine (PhIP) elicits estrogenic-like microRNA responses in breast cancer cells. Toxicol. Lett. 2014, 229, 9–16. [Google Scholar] [CrossRef] [PubMed]
- Segal, C.V.; Koufaris, C.; Powell, C.; Gooderham, N.J. Effects of treatment with androgen receptor ligands on microRNA expression of prostate cancer cells. Toxicology 2015, 333, 45–52. [Google Scholar] [CrossRef] [PubMed]
- Malik, D.E.; David, R.M.; Gooderham, N.J. Mechanistic evidence that benzo[a]pyrene promotes an inflammatory microenvironment that drives the metastatic potential of human mammary cells. Arch. Toxicol. 2018, 92, 3223–3239. [Google Scholar] [CrossRef]
- Wang, X.; Lin, Y. Tumor necrosis factor and cancer, buddies or foes? Acta Pharmacol. Sin. 2008, 29, 1275–1288. [Google Scholar] [CrossRef]
- Yoshino, T.; Van Cutsem, E.; Li, J.; Shen, L.; Kim, T.W.; Sriuranpong, V.; Xuereb, L.; Aubel, P.; Fougeray, R.; Cattan, V.; et al. Effect of KRAS codon 12 or 13 mutations on survival with trifluridine/tipiracil in pretreated metastatic colorectal cancer: A meta-analysis. ESMO Open 2022, 7, 100511. [Google Scholar] [CrossRef]
- Zhong, Z.; Dong, Z.; Yang, L.; Gong, Z. miR-21 induces cell cycle at S phase and modulates cell proliferation by down-regulating hMSH2 in lung cancer. J. Cancer Res. Clin. Oncol. 2012, 138, 1781–1788. [Google Scholar] [CrossRef]
- Liu, F.; Zheng, S.; Liu, T.; Liu, Q.; Liang, M.; Li, X.; Sheyhidin, I.; Lu, X.; Liu, W. MicroRNA-21 promotes the proliferation and inhibits apoptosis in Eca109 via activating ERK1/2/MAPK pathway. Mol. Cell. Biochem. 2013, 381, 115–125. [Google Scholar] [CrossRef]
- Szlosarek, P.W.; Grimshaw, M.J.; Kulbe, H.; Wilson, J.L.; Wilbanks, G.D.; Burke, F.; Balkwill, F.R. Expression and regulation of tumor necrosis factor alpha in normal and malignant ovarian epithelium. Mol. Cancer Ther. 2006, 5, 382–390. [Google Scholar] [CrossRef]
- Michalaki, V.; Syrigos, K.; Charles, P.; Waxman, J. Serum levels of IL-6 and TNF-alpha correlate with clinicopathological features and patient survival in patients with prostate cancer. Br. J. Cancer 2004, 90, 2312–2316. [Google Scholar] [CrossRef]
- Tang, Y.; Zhao, Y.; Ran, J.; Wang, Y. MicroRNA-21 promotes cell metastasis in cervical cancer through modulating epithelial-mesenchymal transition. Oncol. Lett. 2020, 19, 3289–3295. [Google Scholar] [CrossRef]
- Dong, W.; Li, H.; Zhang, Y.; Yang, H.; Guo, M.; Li, L.; Liu, T. Matrix metalloproteinase 2 promotes cell growth and invasion in colorectal cancer. Acta Biochim. Biophys. Sin. 2011, 43, 840–848. [Google Scholar] [CrossRef] [PubMed]
- Dallas, N.A.; Fan, F.; Gray, M.J.; Van Buren, G., 2nd; Lim, S.J.; Xia, L.; Ellis, L.M. Functional significance of vascular endothelial growth factor receptors on gastrointestinal cancer cells. Cancer Metastasis Rev. 2007, 26, 433–441. [Google Scholar] [CrossRef] [PubMed]
- Kiriakidis, S.; Andreakos, E.; Monaco, C.; Foxwell, B.; Feldmann, M.; Paleolog, E. VEGF expression in human macrophages is NF-kappaB-dependent: Studies using adenoviruses expressing the endogenous NF-kappaB inhibitor IkappaBalpha and a kinase-defective form of the IkappaB kinase 2. J. Cell Sci. 2003, 116 Pt 4, 665–674. [Google Scholar] [CrossRef] [PubMed]
- Xie, T.X.; Xia, Z.; Zhang, N.; Gong, W.; Huang, S. Constitutive NF-kappaB activity regulates the expression of VEGF and IL-8 and tumor angiogenesis of human glioblastoma. Oncol. Rep. 2010, 23, 725–732. [Google Scholar]


Disclaimer/Publisher’s Note: The statements, opinions and data contained in all publications are solely those of the individual author(s) and contributor(s) and not of MDPI and/or the editor(s). MDPI and/or the editor(s) disclaim responsibility for any injury to people or property resulting from any ideas, methods, instructions or products referred to in the content. |
© 2023 by the authors. Licensee MDPI, Basel, Switzerland. This article is an open access article distributed under the terms and conditions of the Creative Commons Attribution (CC BY) license (https://creativecommons.org/licenses/by/4.0/).