Simple Summary
The incidence of endocrine cancers (e.g., thyroid, pancreas, and adrenal) has been increasing; these cancers have a high premature mortality rate. Traditional medical imaging methods (e.g., MRI and CT) might not be sufficient for accurate cancer screening. Elastography complements conventional medical imaging modalities by identifying abnormal tissue stiffness of the tumor, in which machine learning techniques can further improve accuracy and reliability. This review focuses on the applications and performance of machine-learning-based elastography in classifying endocrine tumors.
Abstract
Elastography complements traditional medical imaging modalities by mapping tissue stiffness to identify tumors in the endocrine system, and machine learning models can further improve diagnostic accuracy and reliability. Our objective in this review was to summarize the applications and performance of machine-learning-based elastography on the classification of endocrine tumors. Two authors independently searched electronic databases, including PubMed, Scopus, Web of Science, IEEEXpress, CINAHL, and EMBASE. Eleven (n = 11) articles were eligible for the review, of which eight (n = 8) focused on thyroid tumors and three (n = 3) considered pancreatic tumors. In all thyroid studies, the researchers used shear-wave ultrasound elastography, whereas the pancreas researchers applied strain elastography with endoscopy. Traditional machine learning approaches or the deep feature extractors were used to extract the predetermined features, followed by classifiers. The applied deep learning approaches included the convolutional neural network (CNN) and multilayer perceptron (MLP). Some researchers considered the mixed or sequential training of B-mode and elastographic ultrasound data or fusing data from different image segmentation techniques in machine learning models. All reviewed methods achieved an accuracy of ≥80%, but only three were ≥90% accurate. The most accurate thyroid classification (94.70%) was achieved by applying sequential training CNN; the most accurate pancreas classification (98.26%) was achieved using a CNN–long short-term memory (LSTM) model integrating elastography with B-mode and Doppler images.
1. Introduction
The endocrine system plays an essential role in regulating metabolism by synthesizing and releasing hormones into the body and transporting hormones to target cells [1]. The cellular processes of the target cells are directly or indirectly modulated when the hormones bind to the receptor molecules [1]. In addition, the endocrine system works together with other systems to maintain normal physiological activities of the human body. The abnormal growth of nodules or tumors in the endocrine system affects normal hormone production and can result in various diseases [2]. The global burden of endocrine-related cancers is increasing because of aging and exposure to alcohol, high-fat diets, and tobacco [3]. For example, thyroid cancer has been the most common endocrine malignancy over the past few decades, accounting for approximately 2% of all cancers [4,5]. Additionally, pancreatic cancer has a poor prognosis, with a 5-year survival rate of approximately 2.5% [6]. The incidence of the most common endocrine tumor, thyroid cancer, has dramatically increased in the United States, with approximately 53,990 cases [7]. Additionally, more than half of the new tumor cases in China are metastatic [8]. The initial diagnosis and treatment of thyroid cancers cost USD 1425 to 17,000 [9]. A total of 9.3 per 1000 person-years of patients experience financial catastrophe one year postdiagnosis, which is a substantially higher rate than for other cancers [9]. Survivors bear additional psychological and financial burdens and experience monetary hardship [10,11]. Approaching the highest mortality rate among all cancers, the global burden of pancreatic cancer has doubled in the past decades [12,13]. Early and accurate diagnosis of pancreatic cancer can facilitate more efficacious treatments [14], whereas identifying thyroid cancer at earlier stages can improve prognosis and reduce patient mortality [15].
Medical imaging modalities, such as magnetic resonance imaging (MRI), computed tomography (CT), and ultrasonography, are vital assessment and diagnostic tools. Ultrasonography is mainly used to screen and evaluate the characteristics of thyroid nodules [16,17], and real-time ultrasonography supports other assessment modalities, such as fine-need aspiration, biopsy, cytology, etc. [17,18]. Additionally, magnetic resonance imaging (MRI) is the mainstay imaging modality in staging pancreatic cancer [19,20] and evaluating the neuroanatomy for pituitary adenomas [21,22]. Locating and measuring the size of adrenal tumors is more challenging and requires the use of contrast-enhanced computed tomography (CT) [16].
These medical imaging modalities have several drawbacks. CT exposes patients to radiation and may not be appropriate for the frequency tracking of tumor progression [23]. Functional MRI is susceptible to noise and articles and has insufficient temporal and spatial resolution and a low signal-to-noise ratio [24] and is contraindicated for patients with metallic implants or pacemakers. Additionally, ultrasound might be limited by the penetration depth and spatial resolution [25]. Therefore, an accurate and accessible tumor assessment imaging modality that reduces radiation risk is required.
Elastography is an emerging imaging technology that measures and maps tissue stiffness/elasticity, inspired by the manual palpation technique [26]. Despite sharing the same limitations in terms of penetration depth and spatial resolution as B-mode ultrasound, it provides complementary mechanical information of tissues. With this method, tissue abnormality (malignancy) affects its ability to resist load deformation (i.e., stiffness) [27]. Ultrasound elastography has been widely used in different medical applications, such as for the spine [28,29], breast [30], liver [31], brain [32,33,34], and lymph nodules [35]. The two types of elastography are shear-wave and strain imaging. In the strain imaging technique, a force is applied to the tissue and the strain is measured for calculating Young’s modulus. In contrast, in shear-wave imaging, tissue stiffness is estimated by measuring the propagation velocity of shear waves [27]. Furthermore, MRI elastography has also been adopted for elastography in the assessment of chronic disease, such as lung disease [36], hepatic fibrosis [37], breast cancer [38], etc.
Recently, computer-aided diagnosis was found to improve the diagnostic performance and reliability of medical imaging [39]; this method is also less operator-dependent and less prone to observer variability [40,41,42]. Machine learning (and deep learning) models play an important role in computer-aided diagnosis. Using mathematics and statistics tools, machine learning models extract and segment relevant features, interpret the output, and formulate a predictive model by correlating the data with the diagnosis of the patients [43]. For example, machine learning was applied to contrast-enhanced CT to distinguish large adrenocortical carcinomas from other cortical lesions [44]. However, in addition to requiring a large dataset, some models may not have sufficient power to produce a satisfactory performance in the image segmentation of a specific modality [45]. With the advancement of machine learning techniques, especially deep learning models, we anticipate that the technique will also be applied in elastography for endocrine tumor classification [46].
The aim of this study was to provide a contemporary and comprehensive literature review on the application of machine-learning-based elastography to classify endocrine tumors, including thyroid, pancreas, adrenal, and pituitary tumors.
2. Materials and Methods
2.1. Search Strategy
In our systematic literature search, we followed the guidance of the Preferred Reporting Items for Systematic Review and Meta-Analysis Protocols Extension for Scoping Reviews (PRISMA-ScR) guidelines [47], which we conducted on: PubMed (title/abstract, journal articles, English), SCOPUS (title/abstract/keywords), Web of Science (topic field, articles, English), IEEEXpress (title/abstract/indexing terms), CINAHL via EBSCOhost (title/abstract/keywords), and EMBASE via OVID (title/abstract/author keywords, English).
Two authors (Y.-J.M. and L.-W.Z.) conducted independent searches in August 2022. The first author (Y.-J.M.) screened abstracts and full texts, which were checked by another author (L.-W.Z.) Any disagreement was resolved by seeking consensus with the corresponding authors.
We searched the literature with a combination of keywords related to the areas of endocrine tumors, elastography, and machine learning. For endocrine tumors, the searching terms were “thyroid”, “pancrea*”, “adrenal”, or “endocrine” and those with “nodule*”, “tumo*r*”, “cancer”, “carcinoma*”, “malignan*”, “neoplas*”, or “mass*”. For elastography, the search terms were “elastograph*”, or “sonoelastograph*”. For machine learning, the searching terms were “machine learning”, “deep learning”, “neural network”, “CNN”, “RNN”, “ANN”, and “cascade network*”. The raw search and operations are included in Table S1.
The search was limited to original journal research articles published in English. The inclusion criteria included (1) application elastography (in any modality) to classify endocrine tumors; (2) deep learning or machine learning technique involving image segmentation, feature extraction, and classification; (3) classifying benign and malignancy; (4) studies conducted on human subject or existing human subject data; and (5) with at least one classification-related performance measure. Studies were excluded if they (1) had insufficient details on the machine learning model; (2) were modeled or evaluated by purely simulated data; or (3) classified metastasis.
2.2. Screening and Data Extraction
The PRISMA flowchart shown in Figure 1 illustrates the search and screening process for this systematic review. The review context included the basic information (Table 1), the configuration of the elastography system, image preprocessing and segmentation (Table 2), feature extraction and classification (Table 3), evaluation metrics, and performance (Table 4).
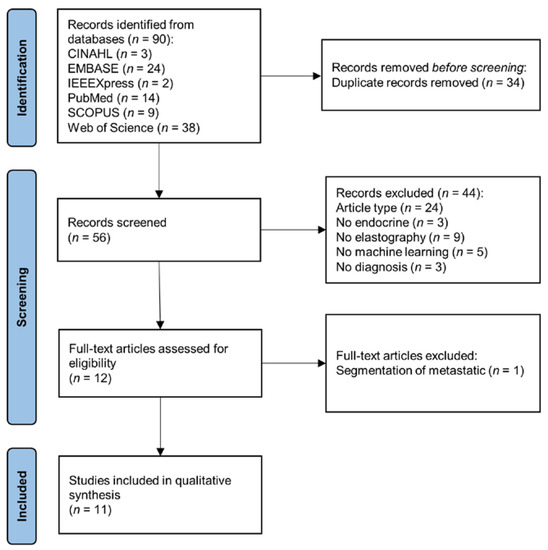
Figure 1.
PRISMA flowchart of systematic search and screening.

Table 1.
Subject and dataset information.
Table 2.
Configuration of elastography system and image segmentation.
Table 3.
Configuration of machine learning and classification models.
Table 4.
Evaluation metric and outcome performance of the method with either the best or featured model.
3. Results
3.1. Search Results
As shown in Figure 1, the initial search yielded 90 articles. After the exclusion of duplicates, 56 articles remained. A preliminary screening of the title and abstract led to the removal of 44 articles, for the following reasons: article type, n = 24; not related to endocrine, n = 3; no elastography, n = 9; no machine learning, n = 5; unrelated to tumor classification, n = 3. One article about the segmentation of metastatic was excluded during full-text screening. In the end, 11 articles were eligible for data synthesis [48,49,50,51,52,53,54,55,56,57,58].
3.2. Basic Information and Dataset
The 11 articles involved a total of 5612 participants with sample sizes ranging from 65 to 2032 and patient age ranging from 15 to 90 year, as shown in Table 1. All except two studies were published in or after 2018. Though we covered thyroid, pancreas, adrenal, and pituitary tumors in the literature search, only those on the pancreas and thyroid were found, accounting for three (n = 3) and eight (n = 8) studies, respectively. One study further classified tumors into pseudotumoral pancreatitis, neuroendocrine tumor, and ductal adenocarcinoma [54].
Women were generally more prevalent in thyroid research, whereas men were more prevalent in pancreas studies. Most of the studies (8/11) confirmed the diagnosis (i.e., ground truth) by biopsy, whereas the others did not specify how they determined malignancy. Furthermore, the lesion size of the tumors was not available in five articles, which can be an important factor in image processing and classification.
As shown in Table 2, in all reviewed studies, researchers used ultrasound elastography and no researchers applied the magnetic resonance elastography. Of the 11 articles, shear-wave ultrasound elastography was used in 6, all of which targeted thyroid tumors. In the contrast, in four articles, the authors used strain elastography and all of them targeted pancreas tumors. Two studies did not provide sufficient information on the type of ultrasound elastography, and four articles did not provide the name/brand of the system.
4. Review Theme and Context
4.1. Data Processing and Segmentation
As shown in Table 2, for data processing, one study [53] mentioned the application of a median filter for denoising, whereas two studies highlighted the process of contrast enhancement of the acquired images [54,58]. However, other studies did not address any image processing or conditioning (excluding segmentation).
For data segmentation, delineating the region of interest (ROI) is one of the essential steps in image processing to focus the center of attention on the clinically relevant regions and to avoid irrelevant image area information from degrading the efficiency and accuracy of model training. The procedures were often conducted by manually contouring the tumor boundary by radiologists with the assistance of software [42,53,54,59]. Alternatively, Pereira et al. [49] applied a threshold-based method to segment the regions with elastographic stress higher than 70% of the maximum stress, but this threshold level was not justified. Qin et al. [50] pre-extracted the ROI using a color transformation technique before the manual work by the radiologists.
Elastographic images can be segmented by overlaying segmented B-mode ultrasound images. Hu et al. [48] trained a real-time semantic segmentation model, PP-LiteSeg [60], on B-mode ultrasound images for segmentation. Then, they copied the segmented outline from B-mode images to the elastographic images with different offsets. The accuracy of the PP-LiteSeg model was verified by radiologists using the dice similarity coefficient, Cohen’s kappa, and 95% symmetric Hausdorff distance.
Data augmentation was implemented by a few authors. The traditional data augmentation involves random transformation, flipping, and scaling [48,50,54]; Hu et al. [48] also considered augmentation of the brightness, contrast, and saturation of the images. In addition, some researchers considered integrating different segmentation methods or combining lower- and higher-dimensional semantic features as a form of data augmentation [48,50].
4.2. Feature Extraction and Data Fusion
Using predetermined statistical-based features is one of the common strategies applied in feature extraction. In addition, some researchers extracted features from B-mode ultrasound [49,53,54,55,57] and Doppler ultrasound [54] for tumor classification, as shown in Table 3.
The statistical features of elastographic images include the mean, standard deviation, range, and highest stress value [49,57]. Pereira et al. [49] also considered the number of pixels with a stress level greater than 80 kPa but without justification. In addition, they applied the circular Hough transform to obtain additional features, including the largest radius detected, the largest value of the accumulator array, and the radius corresponding to the largest value on the accumulator array [49]. Additionally, Zhou et al. [58] extracted features based on the gray-level co-occurrence matrix and gray-level run-length matrix (GLCOM-GLRLM), as well as the multiple subgraph co-occurrence matrix based on multilevel wavelet (MSCOM). GLCOM-GLRLM represented the length of the highest highlight run continuously distributed in the image, whereas MSCOM was used to mark the image area with stripe-like textures [58].
Radiomics features were also considered in these studies, which are different from statistical features in that they are generally ordinal or categorical data classified by radiologists. For example, researchers [56] identified the shape and smoothness of a nodule, the nature of the calcification, and the vascularity (in the four-grade Alder classification scheme). The authors continued by automating the radiomics feature extraction process using IFoundry software (Intelligence Foundry 1.2, GE Healthcare), which considered 6940 radiomics features in six classes [53]. Similarly, Sun et al. [53] automatically extracted features using the Python package, Pyradiomics [61].
Zhao et al. [57] applied machine-learning-assisted feature extraction to filter predetermined statistical features based on their levels of importance (i.e., a feature reduction process) using the random forest algorithm. Additionally, Sun et al. [53] used the VGGNet-16 model [62] to serve as a deep feature extractor on elastographic images; notably, the team adopted a predetermined feature extraction approach on the B-mode images. Lastly, in six studies, researchers used a deep learning approach [48,49,50,51,52,54] in which the feature extraction and classification were nested and streamlined in an unsupervised manner.
4.3. Classification and Modeling
For traditional machine learning studies with separate feature extraction and classification processes, a broad spectrum of classifiers or statistical models have been explored, such as logistic regression, decision tree, naïve Bayes, etc. (Table 3). Notably, some researchers adopted a traditional machine learning approach (with separated feature extraction and classification processes) but used deep learning models as either deep feature extractors or classifiers, such as using convolutional neural network (CNN) as deep feature extractor and then connected to k-nearest neighbor (KNN) or extreme gradient boosting (XGBoost) that served as classifier.
As deep learning approaches, CNN and MLP were the typical methods considered. CNN receives input from image data, whereas MLP takes the flattened hue histogram matrix from the elastographic images [51,52]. Hu et al. [48] attempted to construct a series of CNN models using data from different segmentation settings. They applied a stochastic gradient descent of 0.9 momentum and 1 × 10⁻⁴ weight decays while assigning the cross-entropy loss as the loss function. The models were trained with a 128 batch size and 0.01 learning rate. Deep learning models were often pretrained using large datasets in the public domain, in which the ImageNet database [63] was commonly used. The pretraining process relieves the sample size demand in the actual training and can speed up convergence, especially during the early training stages [64].
Some compelling model architectures are worth discussing, particularly data fusion techniques in machine learning models. Sun et al. [53] separately trained the machine learning models on elastography and B-mode data and joined the two models by an uncertainty decision-theory-based voting system consisting of a pessimistic, optimistic, and compromise approach [65]. Pereira et al. [49] averaged the class probabilities of the B-mode- and elastography-data-trained models, which resembled the compromise approach of the voting system. Moreover, they applied a grid search approach on the weighted cross-entropy loss to determine the drop-out probability and learning rate.
Udriștoiu et al. [54] constructed a CNN and LSTM model using sequential ultrasound B-mode, elastographic, and Doppler images trained at 50 epochs. Then, they were merged by a concatenation layer. Qin et al. [50] investigated the differences in fusion methods, including mixed training fine-tuning, fusion followed by feature re-extraction, and feature extraction followed by refusion. In addition, they compared the fully connected layers, spatial pyramid pooling, and global average pooling for the classification layers [50].
To evaluate the model, in six studies, researchers divided the data into training and testing sets, whereas in one study, an external testing set was also used to improve generalizability [57]. In three studies, the authors adopted a cross-validation approach; in one study, both cross-validation and data-slicing approaches were implemented. In two studies, the validation method was not addressed.
4.4. Classification Performance
In the majority of the reviewed articles, the authors explored and compared the classification performance between different models or model architectures; Table 4 presents the best-performing or -featuring (in the abstract) model for each study. Accuracy and area under the receiver operating characteristics curve (AUC) were the primary outcomes and were presented in all but one article. AUC evaluates the model performance across different thresholds for a binary classifier, which represents the discriminatory power of a predictive model to distinguish between events and nonevents. Of the 10 articles reporting the accuracy measure, all methods attained an accuracy higher than 80% but only three exceeded 90% [50,54,57]. Methods for the pancreas appeared to be more accurate than those for the thyroid. The accuracy of methods in thyroid studies ranged from 83% to 94.7%, whereas that for methods in pancreas studies ranged from 84.27% to 98.26%. Additionally, all methods obtained a discriminatory power (via AUC) of more than 90%, except one.
Qin et al. [50] and Udriștoiu et al. [54] created the two models with the highest accuracy and discriminatory power: these models accounted for data fusion inside the deep learning model training process.
5. Discussion
In this contemporary review, we explored the applications of machine learning models of elastography for identifying tumors in the endocrine system. However, we only found mentions of ultrasound elastography in this review. Magnetic resonance elastography was available to facilitate the diagnosis of thyroid and pancreas cancer but might not be ready to incorporate with computer-aided diagnoses, such as in machine learning models [66,67,68]. In addition, only thyroid and pancreas tumors were captured by our review, which were assessed in B-mode with shear-wave ultrasound elastography and endoscopic ultrasound strain elastography, respectively. The difference was due to the organ location: the thyroid is superficially located. The use of elastography was not reported for other endocrine organs, such as the adrenal gland and pituitary, because they are not accessible or are beyond the detection depth of the elastography probe [69,70].
Traditional machine learning and deep learning models were common approaches in computer-aided diagnosis: in several studies, researchers combined different approaches to innovatively create unique model architectures, especially via data fusion. Ultrasound elastography often comes with B-mode ultrasound images with spatial information. Hu et al. [48] segmented elastography images by overlaying segmented B-mode images and compiling images with different segmentation approaches in a machine learning model. We also found different feature extraction strategies for B-mode and elastography images with a mixture of predetermined statistical or radiomics features and deep feature extractors. Pereira et al. [49] and Sun et al. [53] developed separate machine learning models for B-mode and elastography images and estimated the outcomes by averaging the probability output of the models. Moreover, Qin et al. [50] and Udriștoiu et al. [54] adopted a data fusion approach by integrating the data using mixed/sequential training and a concatenation layer, respectively, which yielded superior classification performance compared with the other methods in this review.
Reporting quality is an important attribute of publications, with studies of machine learning models being no exception [71]. Some reviewed articles did not present adequate details on the participants and protocols, which hinders the replication and interpretation of findings. Two of the eleven studies did not specify the ground truth reference of the diagnosis. Four studies did not present the demographic information of the patients. Five studies did not report the size of the tumor, which may affect the accuracy of segmentation. Furthermore, two studies reported neither the training–testing data division nor cross-validation of the model performance evaluation. The methodological quality of machine learning studies was also of particular concern, especially those with small sample sizes [72]. Some journals may target on the innovation of the modeling or architecture and may impose less stringent requirements on small dataset studies [73,74]. In this review, we found studies with dataset sizes of 60 to 70 subjects over 2 to 3 classes, which would be deemed insufficient. Data augmentation, transfer learning, and cross-validation are acceptable measures to accommodate the limitations of sample size and to handle over-fitting and convergence problems [50,73,75,76]. Additionally, imbalanced dataset classification is one of the pervasive challenges in machine learning. All studies in this review suffered from unbalanced class sizes, which might distort the validity of performance evaluation. Only one study accounted for the unbalanced class size using the bootstrapping approach [44]. Hyperparameters (or model parameters) are sets of parameters that must be configured for the model learning process [77]; the performance metrics of the model may be overly dependent on the tuning of hyperparameters [78]. The number of trees and nodes in the random forest classifier, the number of clusters (k) in the KNN models, and the number of layers in MLP models are typical model parameters. For deep learning, grid and random searches were common approaches to select the optimal combination of multiple hyperparameters, which are less time-consuming and require less computational resources [79]. We decided not to conduct a thematic and qualitative analysis on the selection of hyperparameters and optimization strategy (e.g., loss functions and cross-entropy), which deserves another standalone in-depth review in an engineering paper. However, three studies did not address the hyperparameter tuning strategies. Other studies mentioned their optimization strategies without the confirmed values of the hyperparameters or vice versa.
This review has some limitations. Due to language bias, some relevant research published in languages other than English could have been missed. Moreover, we only included journal articles indexed from the mentioned electronic databases, which we considered as higher quality but might constitute selection bias. In addition, we did not conduct a formal methodological quality assessment for the eligible articles because the focus of the studies was heterogeneous, which would have affected their efforts and focus on the direction of reporting. For example, some studies were more based on clinical applications, whereas others targeted on the innovations of the system development. Furthermore, our search results included articles with terms related to machine learning models. However, some boundaries between machine learning, advanced signal processing, and statistical techniques were ambiguous. Some studies may have been missed or their eligibility was difficult to determine, such as those using logistic regression [80].
Machine-learning-based ultrasound elastography is a recent technological advancement of the field because most of the articles were published after 2018. In addition to statistical models, progress can be observed in the direction of using deep learning models, mixed and sequential training, etc. Image processing or denoising plays an important role in the subsequent medical image analysis [81] but was less discussed in the reviewed studies. Machine learning or deep learning can also be applied in image denoising, segmentation, and augmentation. For example, generative adversarial network (GAN) was proven effective in semantic segmentation and generative image modeling for medical imaging [82,83], whereas linear combinations of datasets can be applied for data augmentation [84]. Additionally, we anticipate that integrating 3D B-mode ultrasound and 3D elastography will be the future trend in improving visualization and, thus, decision-making, as well as providing a complete profile of feature information.
Several core challenges are facing this field. Our review showed that the application of machine learning model technology remains at the initial stage. Despite most reviewed articles being contemporary, cutting-edge models were not used; researchers are still using non-deep-learning approaches. Features were mainly predetermined and relied on manual harvesting. Moreover, due to the size of the probe, penetration power, and constraints of shear-wave generation, elastography had not been applied for organs, such as adrenal and pituitary glands, as demonstrated in our review. Existing modalities also tend to reach the physical limits on resolution. Combining measurements with other physical properties may enhance our understanding of the features of tumors.
6. Conclusions
In this review, we summarized the applications and protocols of machine learning models on elastography to identify tumors in the endocrine system. Shear-wave ultrasound elastography has been applied to assess thyroid tumors, whereas strain elastography with endoscopy has been used for diagnosing pancreatic tumors. Machine learning approaches achieved an accuracy of >80%, whereas three studies reported an accuracy of >90%.
Supplementary Materials
The following supporting information can be downloaded at: https://www.mdpi.com/article/10.3390/cancers15030837/s1, Table S1: Search terms and operations.
Author Contributions
Conceptualization, M.N. and J.C.-W.C.; methodology, D.W.-C.W. and J.C.-W.C.; validation, Y.-Q.Z., D.W.-C.W. and A.K.-Y.C.; formal analysis, Y.-J.M. and L.-W.Z.; investigation, Y.-J.M., L.-W.Z. and A.Y.-C.T.; data curation, Y.-J.M., L.-W.Z., A.Y.-C.T. and H.-J.L.; writing—original draft preparation, Y.-J.M. and L.-W.Z.; writing—review and editing, M.N., D.W.-C.W. and J.C.-W.C.; supervision, M.N., D.W.-C.W. and J.C.-W.C.; project administration, J.C.-W.C.; funding acquisition, M.N. and J.C.-W.C. All authors have read and agreed to the published version of the manuscript.
Funding
The study was funded by the Science and Technology Commission of Shanghai Municipality, China, under the Science and Technology Planning Project (grant number: 21410760200), the Project of Novel Interdisciplinary of Health System in Pudong New Area, Shanghai (grant number: PWXx2020-08) and Projects of Research Institute of Smart Ageing from the Hong Kong Polytechnic University (P0039001).
Institutional Review Board Statement
Not applicable.
Informed Consent Statement
Not applicable.
Data Availability Statement
The data can be shared up on request.
Conflicts of Interest
The authors declare no conflict of interest.
References
- Laycock, J.; Meeran, K. Integrated Endocrinology; Laycock, J., Meeran, K., Eds.; John Wiley & Sons: West Sussex, UK, 2012. [Google Scholar]
- Jolly, E.; Fry, A.; Chaudhry, A. Training in Medicine; Jolly, E., Fry, A., Chaudhry, A., Eds.; Oxford University Press: Oxford, UK, 2016. [Google Scholar]
- Leoncini, E.; Carioli, G.; La Vecchia, C.; Boccia, S.; Rindi, G. Risk factors for neuroendocrine neoplasms: A systematic review and meta-analysis. Ann. Oncol. 2016, 27, 68–81. [Google Scholar] [CrossRef] [PubMed]
- Kitahara, C.M.; Sosa, J.A. The changing incidence of thyroid cancer. Nat. Rev. Endocrinol. 2016, 12, 646–653. [Google Scholar] [CrossRef] [PubMed]
- Ferlay, J.; Soerjomataram, I.; Ervik, M.; Dikshit, R.; Eser, S.; Mathers, C.; Rebelo, M.; Parkin, D.; Forman, D.; Bray, F. Cancer incidence and mortality worldwide: Sources, methods and major patterns in GLOBOCAN 2012. Int. J. Cancer 2015, 136, E359–E386. [Google Scholar] [CrossRef] [PubMed]
- Kardosh, A.; Lichtensztajn, D.Y.; Gubens, M.A.; Kunz, P.L.; Fisher, G.A.; Clarke, C.A. Long-term survivors of pancreatic cancer: A California population-based study. Pancreas 2018, 47, 958. [Google Scholar] [CrossRef]
- Bikas, A.; Burman, K.D. Epidemiology of thyroid cancer. In The Thyroid and Its Diseases; Luster, M., Duntas, L.H., Wartofsky, L., Eds.; Springer: New York, NY, USA, 2019; pp. 541–547. [Google Scholar]
- Han, L.; Wu, Z.; Li, W.; Li, Y.; Ma, J.; Wu, X.; Wen, W.; Li, R.; Yao, Y.; Wang, Y. The real world and thinking of thyroid cancer in China. IJS Oncol. 2019, 4, e81. [Google Scholar] [CrossRef]
- Uppal, N.; Cunningham, C.; James, B. The Cost and Financial Burden of Thyroid Cancer on Patients in the US: A Review and Directions for Future Research. JAMA Otolaryngol.–Head Neck Surg. 2022, 148, 568–575. [Google Scholar] [CrossRef]
- Barrows, C.E.; Belle, J.M.; Fleishman, A.; Lubitz, C.C.; James, B.C. Financial burden of thyroid cancer in the United States: An estimate of economic and psychological hardship among thyroid cancer survivors. Surgery 2020, 167, 378–384. [Google Scholar] [CrossRef]
- Mongelli, M.N.; Giri, S.; Peipert, B.J.; Helenowski, I.B.; Yount, S.E.; Sturgeon, C. Financial burden and quality of life among thyroid cancer survivors. Surgery 2020, 167, 631–637. [Google Scholar] [CrossRef]
- Klein, A.P. Pancreatic cancer epidemiology: Understanding the role of lifestyle and inherited risk factors. Nat. Rev. Gastroenterol. Hepatol. 2021, 18, 493–502. [Google Scholar] [CrossRef]
- Strobel, O.; Neoptolemos, J.; Jäger, D.; Büchler, M.W. Optimizing the outcomes of pancreatic cancer surgery. Nat. Rev. Clin. Oncol. 2019, 16, 11–26. [Google Scholar] [CrossRef]
- Zhang, L.; Sanagapalli, S.; Stoita, A. Challenges in diagnosis of pancreatic cancer. World J. Gastroenterol. 2018, 24, 2047. [Google Scholar] [CrossRef] [PubMed]
- Nguyen, Q.T.; Lee, E.J.; Huang, M.G.; Park, Y.I.; Khullar, A.; Plodkowski, R.A. Diagnosis and treatment of patients with thyroid cancer. Am. Health Drug Benefits 2015, 8, 30. [Google Scholar] [PubMed]
- Thomasian, N.M.; Kamel, I.R.; Bai, H.X. Machine intelligence in non-invasive endocrine cancer diagnostics. Nat. Rev. Endocrinol. 2022, 18, 81–95. [Google Scholar] [CrossRef]
- Baig, F.; Liu, S.; Yip, S.; Law, H.; Ying, M. Update on ultrasound diagnosis for thyroid cancer. Hong Kong J. Radiol. 2018, 21, 82–93. [Google Scholar] [CrossRef]
- Abu-Ghanem, S.; Cohen, O.; Lazutkin, A.; Abu-Ghanem, Y.; Fliss, D.M.; Yehuda, M. Evaluation of clinical presentation and referral indications for ultrasound-guided fine-needle aspiration biopsy of the thyroid as possible predictors of thyroid cancer. Head Neck 2016, 38, E991–E995. [Google Scholar] [CrossRef]
- Bowman, A.W.; Bolan, C.W. MRI evaluation of pancreatic ductal adenocarcinoma: Diagnosis, mimics, and staging. Abdom. Radiol. 2019, 44, 936–949. [Google Scholar] [CrossRef]
- Siddiqi, A.J.; Miller, F. Chronic pancreatitis: Ultrasound, computed tomography, and magnetic resonance imaging features. Semin. Ultrasound CT MRI 2007, 28, 384–394. [Google Scholar] [CrossRef]
- Zamora, C.; Castillo, M. Sellar and parasellar imaging. Neurosurgery 2017, 80, 17–38. [Google Scholar] [CrossRef]
- Connor, S.; Penney, C. MRI in the differential diagnosis of a sellar mass. Clin. Radiol. 2003, 58, 20–31. [Google Scholar] [CrossRef]
- Beregi, J.P.; Greffier, J. Low and ultra-low dose radiation in CT: Opportunities and limitations. Diagn. Interv. Imaging 2019, 100, 63–64. [Google Scholar] [CrossRef]
- Pilmeyer, J.; Huijbers, W.; Lamerichs, R.; Jansen, J.F.; Breeuwer, M.; Zinger, S. Functional MRI in major depressive disorder: A review of findings, limitations, and future prospects. J. Neuroimaging 2022, 32, 582–595. [Google Scholar] [CrossRef] [PubMed]
- Wallyn, J.; Anton, N.; Akram, S.; Vandamme, T.F. Biomedical Imaging: Principles, Technologies, Clinical Aspects, Contrast Agents, Limitations and Future Trends in Nanomedicines. Pharm. Res. 2019, 36, 78. [Google Scholar] [CrossRef] [PubMed]
- Garra, B.S. Elastography: History, principles, and technique comparison. Abdom. Imaging 2015, 40, 680–697. [Google Scholar] [CrossRef] [PubMed]
- Sigrist, R.M.S.; Liau, J.; Kaffas, A.E.; Chammas, M.C.; Willmann, J.K. Ultrasound Elastography: Review of Techniques and Clinical Applications. Theranostics 2017, 7, 1303–1329. [Google Scholar] [CrossRef]
- Lee, T.T.-Y.; Cheung, J.C.-W.; Law, S.-Y.; To, M.K.T.; Cheung, J.P.Y.; Zheng, Y.-P. Analysis of sagittal profile of spine using 3D ultrasound imaging: A phantom study and preliminary subject test. Comput. Methods Biomech. Biomed. Eng. Imaging Vis. 2020, 8, 232–244. [Google Scholar] [CrossRef]
- Cheung, C.-W.J.; Zhou, G.-Q.; Law, S.-Y.; Lai, K.-L.; Jiang, W.-W.; Zheng, Y.-P. Freehand three-dimensional ultrasound system for assessment of scoliosis. J. Orthop. Transl. 2015, 3, 123–133. [Google Scholar] [CrossRef]
- Mao, Y.-J.; Lim, H.-J.; Ni, M.; Yan, W.-H.; Wong, D.W.-C.; Cheung, J.C.-W. Breast tumor classification using ultrasound elastography with machine learning: A systematic scoping review. Cancers 2022, 14, 367. [Google Scholar] [CrossRef]
- Zheng, Y.-P.; Mak, T.-M.; Huang, Z.-M.; Cheung, C.-W.J.; Zhou, Y.-J.; He, J.-F. Liver fibrosis assessment using transient elastography guided with real-time B-mode ultrasound imaging. In Proceedings of the 6th World Congress of Biomechanics (WCB 2010), Singapore, 1–6 August 2010; pp. 1036–1039. [Google Scholar]
- Liao, J.; Yang, H.; Yu, J.; Liang, X.; Chen, Z. Progress in the application of ultrasound elastography for brain diseases. J. Ultrasound Med. 2020, 39, 2093–2104. [Google Scholar] [CrossRef]
- Ullah, Z.; Farooq, M.U.; Lee, S.-H.; An, D. A hybrid image enhancement based brain MRI images classification technique. Med. Hypotheses 2020, 143, 109922. [Google Scholar] [CrossRef]
- Ullah, Z.; Usman, M.; Jeon, M.; Gwak, J. Cascade multiscale residual attention cnns with adaptive roi for automatic brain tumor segmentation. Inf. Sci. 2022, 608, 1541–1556. [Google Scholar] [CrossRef]
- Yuen, Q.W.-H.; Zheng, Y.-P.; Huang, Y.-P.; He, J.-F.; Cheung, J.C.-W.; Ying, M. In-vitro strain and modulus measurements in porcine cervical lymph nodes. Open Biomed. Eng. J. 2011, 5, 39. [Google Scholar] [CrossRef] [PubMed]
- Goss, B.; McGee, K.P.; Ehman, E.; Manduca, A.; Ehman, R. Magnetic resonance elastography of the lung: Technical feasibility. Magn. Reson. Med. Off. J. Int. Soc. Magn. Reson. Med. 2006, 56, 1060–1066. [Google Scholar] [CrossRef] [PubMed]
- Yin, M.; Talwalkar, J.A.; Glaser, K.J.; Manduca, A.; Grimm, R.C.; Rossman, P.J.; Fidler, J.L.; Ehman, R.L. Assessment of hepatic fibrosis with magnetic resonance elastography. Clin. Gastroenterol. Hepatol. 2007, 5, 1207–1213.e1202. [Google Scholar] [CrossRef] [PubMed]
- Lawrence, A.; Mahowald, J.; Manduca, A.; Rossman, P.; Hartmann, L.; Ehman, R. Magnetic resonance elastography of breast cancer. Radiology 2000, 214, 612–613. [Google Scholar]
- Yoo, Y.J.; Ha, E.J.; Cho, Y.J.; Kim, H.L.; Han, M.; Kang, S.Y. Computer-aided diagnosis of thyroid nodules via ultrasonography: Initial clinical experience. Korean J. Radiol. 2018, 19, 665–672. [Google Scholar] [CrossRef]
- Chambara, N.; Ying, M. The diagnostic efficiency of ultrasound computer–aided diagnosis in differentiating thyroid nodules: A systematic review and narrative synthesis. Cancers 2019, 11, 1759. [Google Scholar] [CrossRef]
- Blanco-Montenegro, I.; De Ritis, R.; Chiappini, M. Imaging and modelling the subsurface structure of volcanic calderas with high-resolution aeromagnetic data at Vulcano (Aeolian Islands, Italy). Bull. Volcanol. 2007, 69, 643–659. [Google Scholar] [CrossRef]
- Zhang, X.; Lee, V.C.; Rong, J.; Lee, J.C.; Liu, F. Deep convolutional neural networks in thyroid disease detection: A multi-classification comparison by ultrasonography and computed tomography. Comput. Methods Programs Biomed. 2022, 220, 106823. [Google Scholar] [CrossRef]
- Chan, H.P.; Hadjiiski, L.M.; Samala, R.K. Computer-aided diagnosis in the era of deep learning. Med. Phys. 2020, 47, e218–e227. [Google Scholar] [CrossRef]
- Elmohr, M.; Fuentes, D.; Habra, M.; Bhosale, P.; Qayyum, A.; Gates, E.; Morshid, A.; Hazle, J.; Elsayes, K. Machine learning-based texture analysis for differentiation of large adrenal cortical tumors on CT. Clin. Radiol. 2019, 74, 818, e811–818.e817. [Google Scholar] [CrossRef]
- Barat, M.; Chassagnon, G.; Dohan, A.; Gaujoux, S.; Coriat, R.; Hoeffel, C.; Cassinotto, C.; Soyer, P. Artificial intelligence: A critical review of current applications in pancreatic imaging. Jpn. J. Radiol. 2021, 39, 514–523. [Google Scholar] [CrossRef] [PubMed]
- Wang, Y.; Zhang, L.; Qi, L.; Yi, X.; Li, M.; Zhou, M.; Chen, D.; Xiao, Q.; Wang, C.; Pang, Y.; et al. Machine Learning: Applications and Advanced Progresses of Radiomics in Endocrine Neoplasms. J. Oncol. 2021, 2021, 8615450. [Google Scholar] [CrossRef] [PubMed]
- Tricco, A.C.; Lillie, E.; Zarin, W.; O’Brien, K.K.; Colquhoun, H.; Levac, D.; Moher, D.; Peters, M.D.; Horsley, T.; Weeks, L. PRISMA extension for scoping reviews (PRISMA-ScR): Checklist and explanation. Ann. Intern. Med. 2018, 169, 467–473. [Google Scholar] [CrossRef] [PubMed]
- Hu, L.; Pei, C.; Xie, L.; Liu, Z.; He, N.; Lv, W. Convolutional Neural Network for predicting thyroid cancer based on ultrasound elastography image of perinodular region. Endocrinology 2022, 163, bqac135. [Google Scholar] [CrossRef] [PubMed]
- Pereira, C.; Dighe, M.; Alessio, A.M. Comparison of machine learned approaches for thyroid nodule characterization from shear wave elastography images. Med. Imaging 2018 Comput.-Aided Diagn. 2018, 10575, 437–443. [Google Scholar]
- Qin, P.; Wu, K.; Hu, Y.; Zeng, J.; Chai, X. Diagnosis of benign and malignant thyroid nodules using combined conventional ultrasound and ultrasound elasticity imaging. IEEE J. Biomed. Health Inform. 2019, 24, 1028–1036. [Google Scholar] [CrossRef]
- Săftoiu, A.; Vilmann, P.; Gorunescu, F.; Gheonea, D.I.; Gorunescu, M.; Ciurea, T.; Popescu, G.L.; Iordache, A.; Hassan, H.; Iordache, S. Neural network analysis of dynamic sequences of EUS elastography used for the differential diagnosis of chronic pancreatitis and pancreatic cancer. Gastrointest. Endosc. 2008, 68, 1086–1094. [Google Scholar] [CrossRef]
- Săftoiu, A.; Vilmann, P.; Gorunescu, F.; Janssen, J.; Hocke, M.; Larsen, M.; Iglesias–Garcia, J.; Arcidiacono, P.; Will, U.; Giovannini, M. Efficacy of an artificial neural network–based approach to endoscopic ultrasound elastography in diagnosis of focal pancreatic masses. Clin. Gastroenterol. Hepatol. 2012, 10, 84–90.e81. [Google Scholar] [CrossRef]
- Sun, H.; Yu, F.; Xu, H. Discriminating the nature of thyroid nodules using the hybrid method. Math. Probl. Eng. 2020, 2020, 6147037. [Google Scholar] [CrossRef]
- Udriștoiu, A.L.; Cazacu, I.M.; Gruionu, L.G.; Gruionu, G.; Iacob, A.V.; Burtea, D.E.; Ungureanu, B.S.; Costache, M.I.; Constantin, A.; Popescu, C.F. Real-time computer-aided diagnosis of focal pancreatic masses from endoscopic ultrasound imaging based on a hybrid convolutional and long short-term memory neural network model. PLoS ONE 2021, 16, e0251701. [Google Scholar] [CrossRef]
- Zhang, B.; Tian, J.; Pei, S.; Chen, Y.; He, X.; Dong, Y.; Zhang, L.; Mo, X.; Huang, W.; Cong, S. Machine learning–assisted system for thyroid nodule diagnosis. Thyroid 2019, 29, 858–867. [Google Scholar] [CrossRef] [PubMed]
- Zhao, H.-N.; Liu, J.-Y.; Lin, Q.-Z.; He, Y.-S.; Luo, H.-H.; Peng, Y.-L.; Ma, B.-Y. Partially cystic thyroid cancer on conventional and elastographic ultrasound: A retrospective study and a machine learning–assisted system. Ann. Transl. Med. 2020, 8, 495. [Google Scholar] [CrossRef] [PubMed]
- Zhao, C.-K.; Ren, T.-T.; Yin, Y.-F.; Shi, H.; Wang, H.-X.; Zhou, B.-Y.; Wang, X.-R.; Li, X.; Zhang, Y.-F.; Liu, C. A comparative analysis of two machine learning-based diagnostic patterns with thyroid imaging reporting and data system for thyroid nodules: Diagnostic performance and unnecessary biopsy rate. Thyroid 2021, 31, 470–481. [Google Scholar] [CrossRef] [PubMed]
- Zhou, H.; Liu, B.; Liu, Y.; Huang, Q.; Yan, W. Ultrasonic Intelligent Diagnosis of Papillary Thyroid Carcinoma Based on Machine Learning. J. Healthc. Eng. 2022, 2022, 8. [Google Scholar] [CrossRef] [PubMed]
- Zhou, Z.; Huang, H.; Fang, B. Application of weighted cross-entropy loss function in intrusion detection. J. Comput. Commun. 2021, 9, 1–21. [Google Scholar] [CrossRef]
- Peng, J.; Liu, Y.; Tang, S.; Hao, Y.; Chu, L.; Chen, G.; Wu, Z.; Chen, Z.; Yu, Z.; Du, Y. PP-LiteSeg: A Superior Real-Time Semantic Segmentation Model. arXiv 2022, arXiv:2204.02681. [Google Scholar]
- Van Griethuysen, J.J.; Fedorov, A.; Parmar, C.; Hosny, A.; Aucoin, N.; Narayan, V.; Beets-Tan, R.G.; Fillion-Robin, J.-C.; Pieper, S.; Aerts, H.J. Computational radiomics system to decode the radiographic phenotype. Cancer Res. 2017, 77, e104–e107. [Google Scholar] [CrossRef]
- Muhammad, U.; Wang, W.; Chattha, S.P.; Ali, S. Pre-trained VGGNet architecture for remote-sensing image scene classification. In Proceedings of the 2018 24th International Conference on Pattern Recognition (ICPR), Beijing, China, 20–24 August 2018; pp. 1622–1627. [Google Scholar]
- Deng, J.; Dong, W.; Socher, R.; Li, L.-J.; Li, K.; Fei-Fei, L. Imagenet: A large-scale hierarchical image database. In Proceedings of the 2009 IEEE conference on computer vision and pattern recognition, Miami, FL, USA, 20–25 June 2009; pp. 248–255. [Google Scholar]
- He, K.; Girshick, R.; Dollár, P. Rethinking imagenet pre-training. In Proceedings of the Proceedings of the IEEE/CVF International Conference on Computer Vision, Seoul, Korea, 27 October–2 November 2019; pp. 4918–4927. [Google Scholar]
- Branke, J.; Chick, S.E.; Schmidt, C. Selecting a selection procedure. Manag. Sci. 2007, 53, 1916–1932. [Google Scholar] [CrossRef]
- Bahn, M.M.; Brennan, M.D.; Bahn, R.S.; Dean, D.S.; Kugel, J.L.; Ehman, R.L. Development and application of magnetic resonance elastography of the normal and pathological thyroid gland in vivo. J. Magn. Reson. Imaging 2009, 30, 1151–1154. [Google Scholar] [CrossRef]
- Menzo, E.L.; Szomstein, S.; Rosenthal, R.J. Pancreas, Liver, and Adrenal Glands in Obesity. In The Globesity Challenge to General Surgery; Foletto, M., Rosenthal, R.J., Eds.; Springer: New York, NY, USA, 2014; pp. 155–170. [Google Scholar]
- Shi, Y.; Glaser, K.J.; Venkatesh, S.K.; Ben-Abraham, E.I.; Ehman, R.L. Feasibility of using 3D MR elastography to determine pancreatic stiffness in healthy volunteers. J. Magn. Reson. Imaging 2015, 41, 369–375. [Google Scholar] [CrossRef]
- Qian, X.; Ma, T.; Yu, M.; Chen, X.; Shung, K.K.; Zhou, Q. Multi-functional ultrasonic micro-elastography imaging system. Sci. Rep. 2017, 7, 1230. [Google Scholar] [CrossRef] [PubMed]
- Suh, C.H.; Yoon, H.M.; Jung, S.C.; Choi, Y.J. Accuracy and precision of ultrasound shear wave elasticity measurements according to target elasticity and acquisition depth: A phantom study. PLoS ONE 2019, 14, e0219621. [Google Scholar] [CrossRef] [PubMed]
- Yusuf, M.; Atal, I.; Li, J.; Smith, P.; Ravaud, P.; Fergie, M.; Callaghan, M.; Selfe, J. Reporting quality of studies using machine learning models for medical diagnosis: A systematic review. BMJ Open 2020, 10, e034568. [Google Scholar] [CrossRef]
- Pastor-López, I.; Sanz, B.; Tellaeche, A.; Psaila, G.; de la Puerta, J.G.; Bringas, P.G. Quality assessment methodology based on machine learning with small datasets: Industrial castings defects. Neurocomputing 2021, 456, 622–628. [Google Scholar] [CrossRef]
- Lai, D.K.-H.; Zha, L.-W.; Leung, T.Y.-N.; Tam, A.Y.-C.; So, B.P.-H.; Lim, H.J.; Cheung, D.S.-K.; Wong, D.W.-C.; Cheung, J.C.-W. Dual ultra-wideband (UWB) radar-based sleep posture recognition system: Towards ubiquitous sleep monitoring. Eng. Regen. 2022, 4, 36–43. [Google Scholar] [CrossRef]
- Wang, K. An Overview of Deep Learning Based Small Sample Medical Imaging Classification. In Proceedings of the 2021 International Conference on Signal Processing and Machine Learning (CONF-SPML), Beijing, China, 18–20 August 2021; pp. 278–281. [Google Scholar]
- Yosinski, J.; Clune, J.; Bengio, Y.; Lipson, H. How transferable are features in deep neural networks? Adv. Neural Inf. Process. Syst. 2014, 27, 3320–3328. [Google Scholar]
- Vabalas, A.; Gowen, E.; Poliakoff, E.; Casson, A.J. Machine learning algorithm validation with a limited sample size. PLoS ONE 2019, 14, e0224365. [Google Scholar] [CrossRef]
- Probst, P.; Boulesteix, A.-L.; Bischl, B. Tunability: Importance of hyperparameters of machine learning algorithms. J. Mach. Learn. Res. 2019, 20, 1934–1965. [Google Scholar]
- Larracy, R.; Phinyomark, A.; Scheme, E. Machine learning model validation for early stage studies with small sample sizes. In Proceedings of the 2021 43rd Annual International Conference of the IEEE Engineering in Medicine & Biology Society (EMBC), Online, 1–5 November 2021; pp. 2314–2319. [Google Scholar]
- Liashchynskyi, P.; Liashchynskyi, P. Grid search, random search, genetic algorithm: A big comparison for NAS. arXiv 2019, arXiv:1905.12787. [Google Scholar]
- Bhatia, K.S.S.; Lam, A.C.L.; Pang, S.W.A.; Wang, D.; Ahuja, A.T. Feasibility study of texture analysis using ultrasound shear wave elastography to predict malignancy in thyroid nodules. Ultrasound Med. Biol. 2016, 42, 1671–1680. [Google Scholar] [CrossRef]
- Sagheer, S.V.M.; George, S.N. A review on medical image denoising algorithms. Biomed. Signal Process. Control 2020, 61, 102036. [Google Scholar] [CrossRef]
- Jeong, J.J.; Tariq, A.; Adejumo, T.; Trivedi, H.; Gichoya, J.W.; Banerjee, I. Systematic review of generative adversarial networks (gans) for medical image classification and segmentation. J. Digit. Imaging 2022, 35, 137–152. [Google Scholar] [CrossRef] [PubMed]
- Yi, X.; Walia, E.; Babyn, P. Generative adversarial network in medical imaging: A review. Med. Image Anal. 2019, 58, 101552. [Google Scholar] [CrossRef] [PubMed]
- Tam, A.Y.-C.; So, B.P.-H.; Chan, T.T.-C.; Cheung, A.K.-Y.; Wong, D.W.-C.; Cheung, J.C.-W. A Blanket Accommodative Sleep Posture Classification System Using an Infrared Depth Camera: A Deep Learning Approach with Synthetic Augmentation of Blanket Conditions. Sensors 2021, 21, 5553. [Google Scholar] [CrossRef] [PubMed]

Disclaimer/Publisher’s Note: The statements, opinions and data contained in all publications are solely those of the individual author(s) and contributor(s) and not of MDPI and/or the editor(s). MDPI and/or the editor(s) disclaim responsibility for any injury to people or property resulting from any ideas, methods, instructions or products referred to in the content. |
© 2023 by the authors. Licensee MDPI, Basel, Switzerland. This article is an open access article distributed under the terms and conditions of the Creative Commons Attribution (CC BY) license (https://creativecommons.org/licenses/by/4.0/).