Simple Summary
Pancreatic cancer (PC) incidence is increasing at a greater rate in young women compared to young men. We aimed to understand the association of race and ethnicity with these trends by performing race, ethnicity and age-specific analysis using the SEER 21 database. We organized race and ethnicity groups by Non-Hispanic White (White), Non-Hispanic Black (Black) and Hispanic, and age groups as older adults (age ≥ 55 years) and younger adults (age < 55 years). We found a greater rate of increase in PC incidence among young women compared to young men among all race and ethnicity groups, although young Hispanic and Black women experienced a disproportionately greater increase. When comparing trends among women from all race and ethnicity groups, young Hispanic women experienced a greater rate of increase in PC incidence compared to young White and Black women. Our study demonstrates the association of race and ethnicity with PC incidence trends and highlights the disproportionate burden of disease on young women of color.
Abstract
Background and aims: Pancreatic cancer (PC) incidence is increasing at a greater rate in young women compared to young men. We performed a race- and ethnicity-specific evaluation of incidence trends in subgroups stratified by age and sex to investigate the association of race and ethnicity with these trends. Methods: Age-adjusted PC incidence rates (IR) from the years 2000 to 2018 were obtained from the SEER 21 database. Non-Hispanic White (White), Non-Hispanic Black (Black) and Hispanic patients were included. Age categories included older (ages ≥ 55) and younger (ages < 55) adults. Time-trends were described as annual percentage change (APC) and average APC (AAPC). Results: Younger White [AAPC difference = 0.73, p = 0.01)], Black [AAPC difference = 1.96, p = 0.01)] and Hispanic [AAPC difference = 1.55, p = 0.011)] women experienced a greater rate of increase in IR compared to their counterpart men. Younger Hispanic women experienced a greater rate of increase in IR compared to younger Black women [AAPC difference = −1.28, p = 0.028)] and younger White women [AAPC difference = −1.35, p = 0.011)]. Conclusion: Younger women of all races and ethnicities experienced a greater rate of increase in PC IR compared to their counterpart men; however, younger Hispanic and Black women experienced a disproportionately greater increase. Hispanic women experienced a greater rate of increase in IR compared to younger Black and White women.
1. Introduction
Despite substantial diagnostic and therapeutic medical advancements in recent decades, pancreatic cancer (PC) remains a deadly disease with an estimated 5-year survival rate of 10.8% [1]. Patients are often diagnosed after regional or distant metastasis, with only 11.3% diagnosed at an early stage [1]. Patients with PC accrue more than 15 times the healthcare costs of patients without PC [2]. Furthermore, these patients suffer decreases in quality in all domains of life and worse psychological quality of life when compared to patients with other cancers [3]. In the year 2021, PC will be the 11th and 3rd overall leading cause of cancer incidence and mortality in the United States (US), respectively [1].
Our recent study examining national time trends in PC incidence using the Surveillance, Epidemiology and End Result (SEER) database revealed sex disparity in PC incidence trends over the past two decades [4]. When stratified by age and sex, younger women (ages < 55) were found to have a significantly higher relative rate of increase in PC incidence compared to younger men. Interestingly, this sex disparity trend was not observed in the older population (ages ≥ 55), posing the possibility of a distinct driver(s) in incidence that may be unique to younger women. However, this study does not give information on whether racial differences accounted for the sharp rise in incidence in younger women.
Racial disparities in the incidence and outcomes of multiple gastrointestinal malignancies have been previously demonstrated, including higher PC incidence and mortality rates among Black compared to White persons [5,6]. Therefore, the aim of the current study was to perform race- and ethnicity-specific evaluations of incidence trends in subgroups stratified by age and sex using a large population-based SEER database.
2. Materials and Methods
2.1. Data Source
The SEER program is a cancer incidence and survival database compiled from population-based cancer registries across the US and provided by the National Cancer Institute (NCI). We used the SEER 21, which covers 36.4% of the US population and reports cancer cases from the year 2000 to 2018 [7,8]. The SEER 21 database is the most comprehensive compared to the remaining available databases, providing data from more geographical regions and including a larger proportion of the US population. Further, this database provides information on reporting delays. Given this data is publicly available and is de-identified, according to Cedars-Sinai institutional policy, this study was considered exempt from the institutional review board’s (IRB) full or expedited review protocol. This is in accordance with the recommendations of the National Human Research Protections Advisory Committee.
2.2. Definitions
Incidence rates are reported as the number of cases per 100,000 population. The percent change in PC incidence between two consecutive years was defined as the annual percent change (APC), which describes magnitude as well as directionality. The average APC (AAPC) was calculated using the overall change in incidence divided by the total number of years in the study period. We organized race and ethnicity groups into the following: Non-Hispanic White (White), Non-Hispanic Black (Black) and Hispanic, which includes White Hispanic and Black Hispanic patients [9]. Due to the small sample size, the patient groups Asian/Pacific Islander, American Indian/Alaskan Native and Native Hawaiian were not included in our analysis. Age stratification was performed by using an age cut-off of 55 years: Older adults (age ≥ 55 years) and younger adults (age < 55 years). This cutoff was determined based on precedent from previous publications as well as the examination of the distribution of cases by age groups as shown in Figure S1 [4,10].
2.3. Data Retrieval and Study Period
PC incidence data from 1 January 2000–31 December 2018 were retrieved using the software SEER*Stat (NCI), version 8.3.9.2. PC cases were identified using the International Classification of Diseases for Oncology, third edition, “Site Recode ICD-O-3/WHO 2008 classification”.
2.4. Statistical Analysis
The number of cancer cases is presented as frequencies and percentages, while incidence rates are presented as cases per 100,000 population. The software SEER*Stat (NCI), version 8.3.9.2, was used to calculate the annual PC incidence. Incidence rates were age-adjusted for the 2000 US population and for reporting delays. Joinpoint Regression Program v4.9.0.0 was used to generate best-fit models on a logarithmic scale [11]. Parametric estimations were used to calculate APC and AAPC for the study period [12,13]. The statistical difference from zero was assessed using a two-sided t-test for the APC and AAPC, while the tests of parallelism and coincidence were used to assess if trends were parallel or identical, respectively, between the AAPCs of segmented-linear trends [14]. The test of parallelism determines if two trends are parallel to each other by evaluating if the trends have a statistically significant difference in slope. The test of coincidence, sometimes referred to as the test of identicalness, assesses if the rates of one trend are identical or statistically different from the rates of the other trend. The two p-values generated from these two tests are comparative in nature between trends in subgroups. The concepts of parallelism and coincidence are illustrated in Figure S2.
The test of parallelism was conducted using log-linear models on the log-transformed scale of the APCs. Subsequently, the Joinpoint Regression Program back-transforms the results to the original scale and provides a report [14,15]. To estimate the statistical significance of the difference between AAPCs, Taylor Series expansion was used [16]. These methods were used to examine sex disparity in PC incidence trends when stratified by age, race and ethnicity, and further analysis examined race and ethnic disparity in cancer incidence among women stratified by age, race and ethnicity. A 2-sided p-value of less than 0.05 was considered statistically significant.
3. Results
3.1. Demographics
A total of 283,817 PC cases were reported during the study period. The majority occurred in women (50.1%) and White patients (72.7%). A total of 88.6% of patients were diagnosed at an age greater than or equal to 55, with a median age of 71 years old. The SEER 21 database reports cancer data on 36.4% of the US population, including 33.6%, 44.7%, and 46.7% of the White, Black and Hispanic populations in the US, respectively [8]. A summary of PC incidence rates stratified by age, sex, race and ethnicity is shown in Table 1.

Table 1.
Summary of age-adjusted pancreatic cancer incidence rates per 100,000 people stratified by age, sex, race and ethnicity.
3.2. Older Adults (Age ≥ 55)
A total of 251,360 cases of PC were reported during the study period. Sex-specific incidence rates per 100,000 were 46.49 (95% CI: 46.23–46.75) in women and 58.97 (95% CI: 58.63–59.30) in men.
Incidence rates were relatively increasing at a lower rate in White women (AAPC = 0.80, 95% CI: 0.64–0.96, p < 0.01) compared to White men (AAPC = 1.12, 95% CI: 1.00–1.24, p < 0.01), with a statistically significant AAPC difference of −0.32 (95% CI: −0.52–−0.13, p < 0.01) (Table 2, Figure 1). These trends were neither identical (p < 0.01) nor parallel (p < 0.01). No sex differences in incidence rates were found in the Black and Hispanic groups.
Table 2.
Pancreatic cancer incidence time trends for White, Black and Hispanic patients from 2000 to 2018 stratified by age and sex.
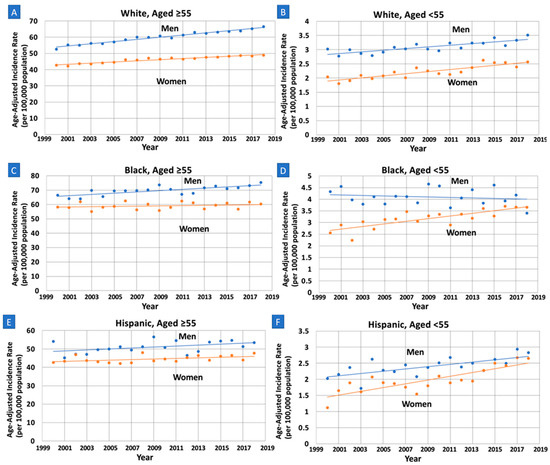
Figure 1.
Sex-specific trends and age-adjusted pancreatic cancer incidence rates per 100,000 people among older (Age ≥ 55) and younger (Age < 55) White, Black and Hispanic adults. APC: annual percent change. (A): Older White: APC increasing at a lower rate in women compared to men (0.80 vs. 1.12, p = 0.001), with trends that are non-parallel (p < 0.01) and non-identical (p < 0.01). (B): Younger White: APC increasing at a greater rate in women compared to men (1.68 vs. 0.94, p = 0.010), with trends that are non-parallel (p < 0.01) and non-identical (p < 0.01). (C): Older Black: APC increasing at a lower rate in women compared to men (0.17 vs. 0.63, p = 0.026), with trends that are parallel (p = 0.071) and non-identical (p < 0.01). (D): Younger Black: APC increasing at a greater rate in women compared to men (1.74 vs. −0.22, p < 0.001), with trends that are non-parallel (p < 0.01) and non-identical (p < 0.01). (E): Older Hispanic: APC neither increasing or decreasing in women and men, no significant difference (0.38 vs. 0.51, p = 0.65). (F): Younger Hispanic: APC increasing at a greater rate in women compared to men (3.03 vs. 1.48, p = 0.011); trends are non-parallel (p < 0.01) and non-identical (p < 0.01).
Incidence rates were also relatively higher in White women (AAPC = 0.80, 95% CI: 0.64–0.96, p < 0.01) compared to Hispanic women (AAPC = 0.38, 95% CI: 0.05–0.72, p = 0.027), with a difference in AAPC of 0.41 (95% CI: 0.06–0.76, p = 0.021) (Table 3, Figure 2). These trends were also neither identical (p < 0.01) or parallel (p = 0.016). Furthermore, incidence rates were relatively higher in White women (AAPC = 0.80, 95% CI: 0.64–0.96, p < 0.01) compared to Black women (AAPC = 0.17, 95% CI: −0.18–0.51, p = 0.32), with a difference in AAPC of 0.63 (95% CI: 0.27–0.99, p < 0.01). These trends were neither identical (p < 0.01) nor parallel (p < 0.01).
Table 3.
Pancreatic cancer incidence time trends for women from 2000 to 2018 stratified by age, race and ethnicity as well as comparison of time trends between White, Black and Hispanic Women.
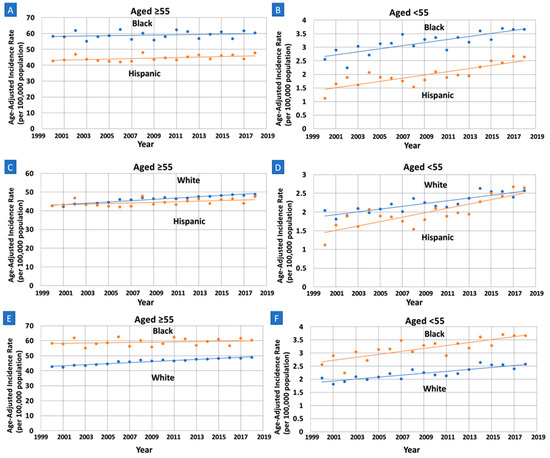
Figure 2.
Race and ethnicity specific trends and age-adjusted pancreatic cancer incidence rates per 100,000 people among older (Age ≥ 55) and younger women (Age < 55). APC: annual percent change. (A): APC increasing in Hispanics and unchanged in Black older women; there is no significant difference (0.38 vs. 0.17, p = 0.34). (B): APC increasing at a greater rate in Hispanic compared to Black younger women (3.03 vs. 1.74, p = 0.028), with trends that are parallel (p = 0.074) and non-identical (p < 0.01). (C): APC increasing at a greater rate in White compared to Hispanic older women (0.80 vs. 0.38, p = 0.021), with trends that are non-parallel (p = 0.016) and non-identical (p < 0.01). (D): APC increasing at a greater rate in Hispanic compared to White younger women (3.03 vs. 1.68, p < 0.001), with trends that are parallel (p = 0.070) and non-identical (p < 0.01). (E): APC increasing at a greater rate in White compared to Black older women (0.80 vs. 0.17, p = 0.001), with trends that are non-parallel (p < 0.01) and non-identical (p < 0.01). (F): APC increasing in Black and White younger women, with no significant difference (1.74 vs. 1.68, p = 0.87).
4. Younger Adults (Ages < 55)
A total of 32,369 cases of PC were reported during the study period. Most cases occurred among men (6.5% of all cases), and the sex-specific incidence rates per 100,000 were 2.25 (95% CI: 2.21–2.28) in women and 3.01 (95% CI: 2.96–3.05) in men.
Incidence rates were relatively increasing at a greater rate in women compared to men in all three race and ethnic groups. White women (AAPC = 1.68, 95% CI: 1.18–2.17, p < 0.01) experienced a greater rate of increase in incidence rates compared to White men (AAPC = 0.94, 95% CI: 0.61–1.28, p < 0.01) with a statistically significant AAPC difference of 0.73 (95% CI: 0.18–1.29, p = 0.01). These trends were neither identical (p < 0.01) nor parallel (p < 0.01). Black women (AAPC = 1.74, 95% CI: 1.04–2.46, p < 0.01) experienced an increase in incidence rate compared to Black men (AAPC = −0.22, 95% CI: −1.01–0.48, p = 0.57), with a statistically significant AAPC difference of 1.96 (95% CI: 0.98–2.95, p < 0.01). These trends were neither identical (p < 0.01) nor parallel (p = 0.02). Hispanic women (AAPC = 3.03, 95% CI: 2.03–4.04, p < 0.01) experienced a greater rate of increase in incidence rates compared to Hispanic men (AAPC = 1.48, 95% CI: 0.68–2.82, p < 0.01), with a statistically significant AAPC difference of 1.55 (95% CI: 0.36–2.75, p = 0.011). These trends were neither identical (p < 0.01) nor parallel (p < 0.01).
Incidence rates were relatively higher in Hispanic women (AAPC = 3.03, 95% CI: 2.03–4.04, p < 0.01) compared to Black women (AAPC = 1.74, 95% CI: 1.04–2.46, p < 0.01), with a difference in AAPC of −1.28 (95% CI: −2.42–−0.14, p = 0.03). These trends were non-identical (p < 0.01) and parallel (p = 0.07). Furthermore, incidence rates were relatively higher in Hispanic women (AAPC = 3.03, 95% CI: 2.03–4.04, p < 0.01) compared to White women (AAPC = 1.68, 95% CI: 1.18–2.17, p < 0.01), with a difference in AAPC of −1.35 (95% CI: − 2.39–−0.31, p = 0.01). These trends were non-identical (p < 0.01) and parallel (p = 0.07).
5. Discussion
We investigated our recent finding of an alarming increase in PC incidence rates in young women compared to young men by examining the association of race and ethnicity with these trends [4]. Initially, we examined sex disparity in PC incidence time trends stratified by age, race and ethnicity. While younger women (age < 55) showed a greater relative rate of increase in PC incidence compared to young men in all races and ethnic groups, rates disproportionately increased in younger Hispanic and Black women. Further analysis revealed that younger Hispanic women experienced significantly higher rates of increase in incidence compared to younger Black and White women. The present analysis builds on our previous findings by identifying racial and ethnic disparities in PC incidence, specifically in younger women. Given PC is expected to become the second leading cause of cancer death by the year 2030 in the US [17], we hope our findings aid in designing future studies and public health strategies to combat these alarming trends.
A racial gap in PC incidence has existed in the US since the 1970s with a greater incidence in Black compared to White patients, although known risk factors such as socioeconomic status (SES), lifestyle and biological variables do not alone independently explain these trends [18]. While our analysis did not investigate causative factors, the trends found in our analysis are likely due to changes in trends of modifiable as well as non-modifiable risk factors. SES has been shown to be associated with cancer incidence and outcomes, with the directionality of the relationship varying by cancer type [19]. A systematic review of European studies found variable effects of SES on PC incidence, varying by country of origin and, interestingly, patient sex [20]. Diabetes mellitus (DM), obesity and smoking have also been associated with PC incidence [21].
Obesity and DM have both been shown to disproportionately affect minority communities, although their impact on racial differences in PC incidence remains unclear [22,23]. An analysis of the NHANES surveys examined trends in the prevalence of diagnosed and undiagnosed DM in the United States from 1988 to 2012 and showed an increase in DM rates across all demographics, although interestingly only among those with a BMI of 30 or greater [24]. Furthermore, rates of undiagnosed DM only increased among Mexican American participants, with undiagnosed DM rates decreasing among all demographics except for Mexican Americans and the youngest age group, highlighting a possible disparity in access to care. A more recent study that examined trends in DM rates from 1999 to 2016 using the NHANES showed a significantly more dramatic increase in DM rates among Mexican Americans during the study period compared to the Non-Hispanic Black and Non-Hispanic White groups [25]. Interestingly, men experienced a greater increase in DM rates overall compared to women. Obesity trends have also been explored through the NHANES, with recent studies finding an overall increase in obesity rates over the past few decades, with higher rates in younger cohorts compared to older [26,27]. While similar trend patterns of severe obesity were found on subgroup analysis by demographics, males were less likely to have severe obesity compared to females in all birth cohorts [27]. Lastly, a recent review shows smoking rates have decreased among all racial and ethnic groups in both men and women in recent decades, with Asian and Hispanic/Latino individuals demonstrating the lowest prevalence [28]. The review also highlights significant racial, ethnic and socioeconomic disparities in exposure to secondhand smoke, which may further drive disparities in risk. The literature is limited by a lack of simultaneous stratification of risk factors by race, ethnicity, sex and age. Furthermore, the relationship between the trends found in our analysis and these risk factors, along with other known and unknown risk factors, is complex and warrants further investigation.
The association of sex-specific factors with PC has also been investigated. A meta-analysis of 22 studies found higher parity was borderline 0.86 (95% CI: 0.73–1.02; Q = 50.49, p < 0.001, I2 = 58.4%) associated with a dose response decreased risk of PC when controlling for possible confounders such as smoking and diabetes mellitus rates [29]. It is proposed that the protective effect of pregnancy is likely sex hormone mediated. Estrogen has been shown in in vitro and in vivo studies to inhibit transplanted pancreatic carcinoma and the effects of early pancreatic carcinogenesis in rat models [30,31]. Furthermore, census data shows a decline in the overall birth rate in the US from 1980 to 2007 [32]. When stratified by race, birth rates significantly declined among Black women (84.9 to 72.7 births/1000 women) while birth rates mildly increased in White women (65.6 to 68.8 births/1000 women), although comparative analysis was not conducted between the races [32]. Unfortunately, birth rates for the Hispanic population were not available in this report.
The average age of diagnosis of PC is 71 years old, with up to 8% of patients diagnosed before the age of 50 [1,33]. Early-onset PC is relatively understudied, with an increasing incidence in recent years [33,34]. A recent analysis of 124,442 patients examined early and later age-onset PC incidence rates and found a higher percentage of men (58.3% vs. 49.8%), Black (16.8 vs. 12.2) and Hispanic (8.3 vs. 4.9) patients in the early group. Another study of 16,282 cases of PC also showed higher rates of Black (46%) and Hispanic (42%) patients diagnosed under the age of 65 compared to White (33%) and Asian (32%) patients (p < 0.0001) [35]. While early-onset PC has similar risk factors to late-onset PC, familial and genetic factors have been implicated as additional risk factors given that early-onset cases are more likely to have a family history of cancer and hereditary genetic syndromes [36]. Genetic factors are less likely to have had an impact on the change in trends revealed by our analysis due to the low likelihood of significant changes in the prevalence of genetic syndromes and hereditary diseases during our study period. Alternatively, we believe the disparity in incidence trends is likely due to changes in risk factor trends, both known and potentially unknown.
Limitations and Future Directions
The SEER database has certain limitations, including possible loss of records and coding reliability. Underreporting of cases as well as changes in testing rates may impact incidence rates across our study period. Furthermore, demographic data, including race and ethnicity, are often obtained from multiple sources, such as patient intake, provider notes, and administrative databases, allowing for misclassification bias and an impact on our findings. Given the self-reported nature of race and ethnicity, this may not correspond to genetic ancestry, which is an important consideration when drawing conclusions from our analysis. Migration of patients in and out of SEER registry areas and selection bias are also possible limitations that have been previously described [37]. Furthermore, due to the small sample size, the patient groups Asian/Pacific Islander, American Indian/Alaskan Native and Native Hawaiian were not included in our analysis. Our analysis is also limited by the lack of availabile data on risk factors that may explain these trends, making definitive conclusions regarding causal factors not possible. The relatively low 5-year survival rate of PC makes prevention through risk modification and effective screening guidelines crucial. Examining national trends in cancer incidence, such as in our study, highlights alarming trends warranting further investigation, ultimately leading to public health policy actions. We highly encourage future studies examining factors associated with the alarming disproportionate increase in incidence rates in young Black and Hispanic women compared to their male counterparts, as well as the disproportionate increase in younger Hispanic women compared to younger Black and White women. Given that race is a social construct, examination of trends stratified by race and ethnicity provides important insight into the impact of psychosocial, societal, and systemic factors on PC incidence and outcomes. To further improve screening and therapeutics, we encourage future investigation of genomic profiles as objective tools for improving screening, prevention, and therapeutics given the expected rise in incidence in the coming decade.
6. Conclusions
Younger women of all races and ethnicities experienced a greater rate of increase in pancreatic cancer incidence compared to their male counterparts; however, younger Hispanic and Black women experienced a disproportionately greater increase. Comparison between younger women revealed that younger Hispanic women experienced significantly higher rates of increase in incidence compared to younger Black and White women. Further studies are needed to better understand the factors associated with these disparities.
Supplementary Materials
The following supporting information can be downloaded at: https://www.mdpi.com/article/10.3390/cancers15030870/s1, Figure S1: Number of Pancreatic Cancer Cases During the Study Period (2000–2018) by Age Groups. Figure S2: Visual illustration of the test of Parallelism (Parallel Lines) and test of Coincidence (Identical Lines).
Author Contributions
J.S.S.: Substantial contributions to the conception or design of the work, interpretation of data for the work and drafting of the work, final approval of the version to be published; and agreement to be accountable for all aspects of the work in ensuring that questions related to the accuracy or integrity of any part of the work are appropriately investigated and resolved. Y.A.: acquisition, analysis, and interpretation of data for the work; and critical revision of the manuscript for important intellectual input. J.O.: Critical revision of the manuscript for important intellectual input. Y.J.: Critical revision of the manuscript for important intellectual input. S.J.P.: Critical revision of the manuscript for important intellectual input. R.W.: Critical revision of the manuscript for important intellectual input. K.P.: Critical revision of the manuscript for important intellectual input. Q.L.: Critical revision of the manuscript for important intellectual input. K.A.: Critical revision of the manuscript for important intellectual input. A.H.: Critical revision of the manuscript for important intellectual input. J.G.: Critical revision of the manuscript for important intellectual input. A.O.: Critical revision of the manuscript for important intellectual input. D.L.: Critical revision of the manuscript for important intellectual input. N.N.N.: Critical revision of the manuscript for important intellectual input. S.K.L.: Critical revision of the manuscript for important intellectual input. S.G.: Substantial contributions to the conception or design of the work, the acquisition, analysis and interpretation of data for the work; drafting of the work, critical revision of the work for important intellectual input; final approval of the version to be published; and agreement to be accountable for all aspects of the work in ensuring that questions related to the accuracy or integrity of any part of the work are appropriately investigated and resolved. All authors have read and agreed to the published version of the manuscript.
Funding
This project was supported in part by a philanthropic grant from The Widjaja Family Fund for Pancreatic Cancer Research. The funding agency did not have any role in the design and conduct of the study; the collection, management, analysis, and interpretation of the data; the preparation, review, or approval of the manuscript; and the decision to submit the manuscript for publication.
Institutional Review Board Statement
Given this data is publicly available and is de-identified, according to Cedars-Sinai institutional policy, this study was considered exempt from the institutional review board’s (IRB) full or expedited review protocol. This is in accordance with the recommendations of the National Human Research Protections Advisory Committee.
Informed Consent Statement
Given that this data is publicly available and is de-identified, informed consent from study participants was not obtained.
Data Availability Statement
The data presented in this study are openly available at https://seer.cancer.gov/data-software/ (accessed on 22 January 2022).
Acknowledgments
The authors would like to thank Shelly Lu (Karsh Division of Gastroenterology and Hepatology, Cedars-Sinai Medical Center, Los Angeles, California, USA) for her mentorship, guidance, and support in all stages of this study.
Conflicts of Interest
The authors declare no conflict of interest.
References
- Cancer Stat Facts: Pancreatic Cancer. Available online: https://seer.cancer.gov/statfacts/html/pancreas.html (accessed on 22 January 2022).
- Soefje, S.A. Managing the economic impact of advanced pancreatic cancer. Am. J. Manag. Care 2019, 25 (Suppl. S1), S11–S16. [Google Scholar] [PubMed]
- Bauer, M.R.; Bright, E.E.; MacDonald, J.J.; Cleary, E.H.; Hines, O.J.; Stanton, A.L. Quality of Life in Patients with Pancreatic Cancer and Their Caregivers: A Systematic Review. Pancreas. Pancreas 2018, 47, 368–375. [Google Scholar] [CrossRef] [PubMed]
- Gaddam, S.; Abboud, Y.; Oh, J.; Samaan, J.S.; Nissen, N.N.; Lu, S.C.; Lo, S.K. Incidence of Pancreatic Cancer by Age and Sex in the US, 2000-2018. JAMA 2021, 326, 2075. [Google Scholar] [CrossRef] [PubMed]
- Ashktorab, H.; Kupfer, S.S.; Brim, H.; Carethers, J.M. Racial Disparity in Gastrointestinal Cancer Risk. Gastroenterology 2017, 153, 910–923. [Google Scholar] [CrossRef] [PubMed]
- Tavakkoli, A.; Singal, A.G.; Waljee, A.K.; Elmunzer, B.J.; Pruitt, S.L.; McKey, T.; Rubenstein, J.H.; Scheiman, J.M.; Murphy, C.C. Racial Disparities and Trends in Pancreatic Cancer Incidence and Mortality in the United States. Clin. Gastroenterol. Hepatol. 2020, 18, 171–178.e10. [Google Scholar] [CrossRef]
- Surveillance, Epidemiology, and End Results (SEER) Program. SEER*Stat Database: Incidence—SEER Research Limited-Field Data with Delay-Adjustment, 21 Registries, Malignant Only, Nov 2020 Sub (2000–2018)—Linked to County Attributes—Time Dependent (1990-2018) Income/Rurality, 1969–2019 Counties, National Cancer Institute, DCCPS, Surveillance Research Program, Released April 2021, Based on the November 2020 Submission. Available online: www.seer.cancer.gov (accessed on 22 January 2022).
- Number of Persons by Race and Hispanic Ethnicity for SEER Participants (2020 Census Data). Available online: https://seer.cancer.gov/registries/data.html#a1 (accessed on 23 January 2022).
- da Costa, W.L.; Oluyomi, A.O.; Thrift, A.P. Trends in the Incidence of Pancreatic Adenocarcinoma in All 50 United States Examined Through an Age-Period-Cohort Analysis. JNCI Cancer Spectr. 2020, 4, pkaa033. [Google Scholar] [CrossRef]
- Siegel, R.L.; Miller, K.D.; Jemal, A. Colorectal Cancer Mortality Rates in Adults Aged 20 to 54 Years in the United States, 1970-2014. JAMA 2017, 318, 572. [Google Scholar] [CrossRef]
- Joinpoint Regression Program, Version 4.9.0.0. March 2021. Available online: https://surveillance.cancer.gov/joinpoint/ (accessed on 22 January 2022).
- Clegg, L.X.; Hankey, B.F.; Tiwari, R.; Feuer, E.J.; Edwards, B.K. Estimating average annual per cent change in trend analysis. Stat. Med. 2009, 28, 3670–3682. [Google Scholar] [CrossRef]
- Number of Joinpoints. Joinpoint Help System. Available online: https://surveillance.cancer.gov/help/joinpoint/setting-parameters/method-and-parameters-tab/number-of-joinpoints (accessed on 9 November 2021).
- Kim, H.-J.; Fay, M.P.; Yu, B.; Barrett, M.J.; Feuer, E.J. Comparability of Segmented Line Regression Models. Biometrics 2004, 60, 1005–1014. [Google Scholar] [CrossRef]
- Kim, H.-J.; Fay, M.P.; Feuer, E.J.; Midthune, D.N. Permutation tests for joinpoint regression with applications to cancer rates. Stat. Med. 2000, 19, 335–351. [Google Scholar] [CrossRef]
- Joinpoint Regression Program VM; Statistical Research and Applications Branch NCI: Bethesda, MD, USA, 2021.
- Rahib, L.; Smith, B.D.; Aizenberg, R.; Rosenzweig, A.B.; Fleshman, J.M.; Matrisian, L.M. Projecting cancer incidence and deaths to 2030: The unexpected burden of thyroid, liver, and pancreas cancers in the United States. Cancer Res. 2014, 74, 2913–2921. [Google Scholar] [CrossRef] [PubMed]
- Scarton, L.; Yoon, S.; Oh, S.; Agyare, E.; Trevino, J.; Han, B.; Lee, E.; Setiawan, V.W.; Permuth, J.B.; Schmittgen, T.D.; et al. Pancreatic Cancer Related Health Disparities: A Commentary. Cancers 2018, 10, 235. [Google Scholar] [CrossRef] [PubMed]
- Singh, G.K.; Jemal, A. Socioeconomic and Racial/Ethnic Disparities in Cancer Mortality, Incidence, and Survival in the United States, 1950–2014: Over Six Decades of Changing Patterns and Widening Inequalities. J. Environ. Public Health 2017, 2017, 2819372. [Google Scholar] [CrossRef] [PubMed]
- Mihor, A.; Tomsic, S.; Zagar, T.; Lokar, K.; Zadnik, V. Socioeconomic inequalities in cancer incidence in Europe: A comprehensive review of population-based epidemiological studies. Radiol. Oncol. 2020, 54, 1–13. [Google Scholar] [CrossRef] [PubMed]
- Midha, S.; Chawla, S.; Garg, P.K. Modifiable and non-modifiable risk factors for pancreatic cancer: A review. Cancer Lett. 2016, 381, 269–277. [Google Scholar] [CrossRef] [PubMed]
- Ogden, C.L.; Carroll, M.D.; Kit, B.K.; Flegal, K.M. Prevalence of Childhood and Adult Obesity in the United States, 2011–2012. JAMA 2014, 311, 806–814. [Google Scholar] [CrossRef] [PubMed]
- Statistics about Diabetes. Available online: https://www.diabetes.org/resources/statistics/statistics-about-diabetes (accessed on 24 January 2022).
- Menke, A.; Casagrande, S.S.; Geiss, L.S.; Cowie, C.C. Prevalence of and Trends in Diabetes among Adults in the United States, 1988–2012. JAMA 2015, 314, 1021. [Google Scholar] [CrossRef]
- Fang, M. Trends in the Prevalence of Diabetes among U.S. Adults: 1999–2016. Am. J. Prev. Med. 2018, 55, 497–505. [Google Scholar] [CrossRef]
- Li, M.; Gong, W.; Wang, S.; Li, Z. Trends in body mass index, overweight and obesity among adults in the USA, the NHANES from 2003 to 2018: A repeat cross-sectional survey. BMJ Open 2022, 12, e065425. [Google Scholar] [CrossRef] [PubMed]
- Fan, K.; Lv, F.; Li, H.; Meng, F.; Wang, T.; Zhou, Y. Trends in obesity and severe obesity prevalence in the United States from 1999 to 2018. Am. J. Hum. Biol. 2022, e23855. [Google Scholar] [CrossRef] [PubMed]
- Drope, J.; Liber, A.C.; Cahn, Z.; Stoklosa, M.; Kennedy, R.; Douglas, C.E.; Henson, R.; Drope, J. Who’s still smoking? Disparities in adult cigarette smoking prevalence in the United States: Disparities in Adult Smoking Prevalence in the US. CA A Cancer J. Clin. 2018, 68, 106–115. [Google Scholar] [CrossRef] [PubMed]
- Guan, H.-B.; Wu, L.; Wu, Q.-J.; Zhu, J.; Gong, T. Parity and Pancreatic Cancer Risk: A Dose-Response Meta-Analysis of Epidemiologic Studies. PLoS ONE 2014, 9, e92738. [Google Scholar] [CrossRef] [PubMed]
- Sumi, C.; Longnecker, D.S.; Roebuck, B.D.; Brinck-Johnsen, T. Inhibitory effects of estrogen and castration on the early stage of pancreatic carcinogenesis in Fischer rats treated with azaserine. Cancer Res. 1989, 49, 2332–2336. [Google Scholar]
- Sumi, C.; Brinck-Johnsen, T.; Longnecker, D.S. Inhibition of a transplantable pancreatic carcinoma by castration and estradiol administration in rats. Cancer Res. 1989, 49, 6687–6692. [Google Scholar]
- Table 80. Births, Birth Rates, and Fertility Rates by Race, Sex, and Age: 1980 to 2007. Available online: https://www2.census.gov/library/publications/2010/compendia/statab/130ed/tables/11s0080.pdf (accessed on 24 January 2022).
- Alese, O.B.; Jiang, R.; Shaib, W.; Wu, C.; Akce, M.; Gaines, T.; Ni, L.; Behera, M.; El-Rayes, B.F. Young Adults with Pancreatic Cancer: National Trends in Treatment and Outcomes. Pancreas 2020, 49, 341–354. [Google Scholar] [CrossRef] [PubMed]
- Sung, H.; Siegel, R.L.; Rosenberg, P.S.; Jemal, A. Emerging cancer trends among young adults in the USA: Analysis of a population-based cancer registry. Lancet Public Health 2019, 4, e137–e147. [Google Scholar] [CrossRef] [PubMed]
- Singal, V.; Singal, A.K.; Kuo, Y.-F. Racial disparities in treatment for pancreatic cancer and impact on survival: A population-based analysis. J. Cancer Res. Clin. Oncol. 2012, 138, 715–722. [Google Scholar] [CrossRef]
- Primavesi, F.; Stättner, S.; Schlick, K.; Kiesslich, T.; Mayr, C.; Klieser, E.; Urbas, R.; Neureiter, D. Pancreatic cancer in young adults: Changes, challenges, and solutions. OncoTargets Ther. 2019, 12, 3387–3400. [Google Scholar] [CrossRef]
- Yu, J.B.; Gross, C.P.; Wilson, L.D.; Smith, B.D. NCI SEER public-use data: Applications and limitations in oncology research. Oncology 2009, 23, 288–295. [Google Scholar]


Disclaimer/Publisher’s Note: The statements, opinions and data contained in all publications are solely those of the individual author(s) and contributor(s) and not of MDPI and/or the editor(s). MDPI and/or the editor(s) disclaim responsibility for any injury to people or property resulting from any ideas, methods, instructions or products referred to in the content. |
© 2023 by the authors. Licensee MDPI, Basel, Switzerland. This article is an open access article distributed under the terms and conditions of the Creative Commons Attribution (CC BY) license (https://creativecommons.org/licenses/by/4.0/).