Molecular Identification and In Silico Protein Analysis of a Novel BCOR-CLGN Gene Fusion in Intrathoracic BCOR-Rearranged Sarcoma


 ,
,  ,
,
Abstract
:Simple Summary
Abstract
1. Introduction
2. Materials and Methods
2.1. Case Selection Criteria
2.2. Histology and Immunohistochemistry
2.3. Fluorescence and In Situ Hybridization
2.4. RNA Isolation
2.5. Next-Generation Sequencing
2.6. Sanger Sequencing
2.7. In Silico Protein Analysis
2.8. Statistical Analysis
3. Results
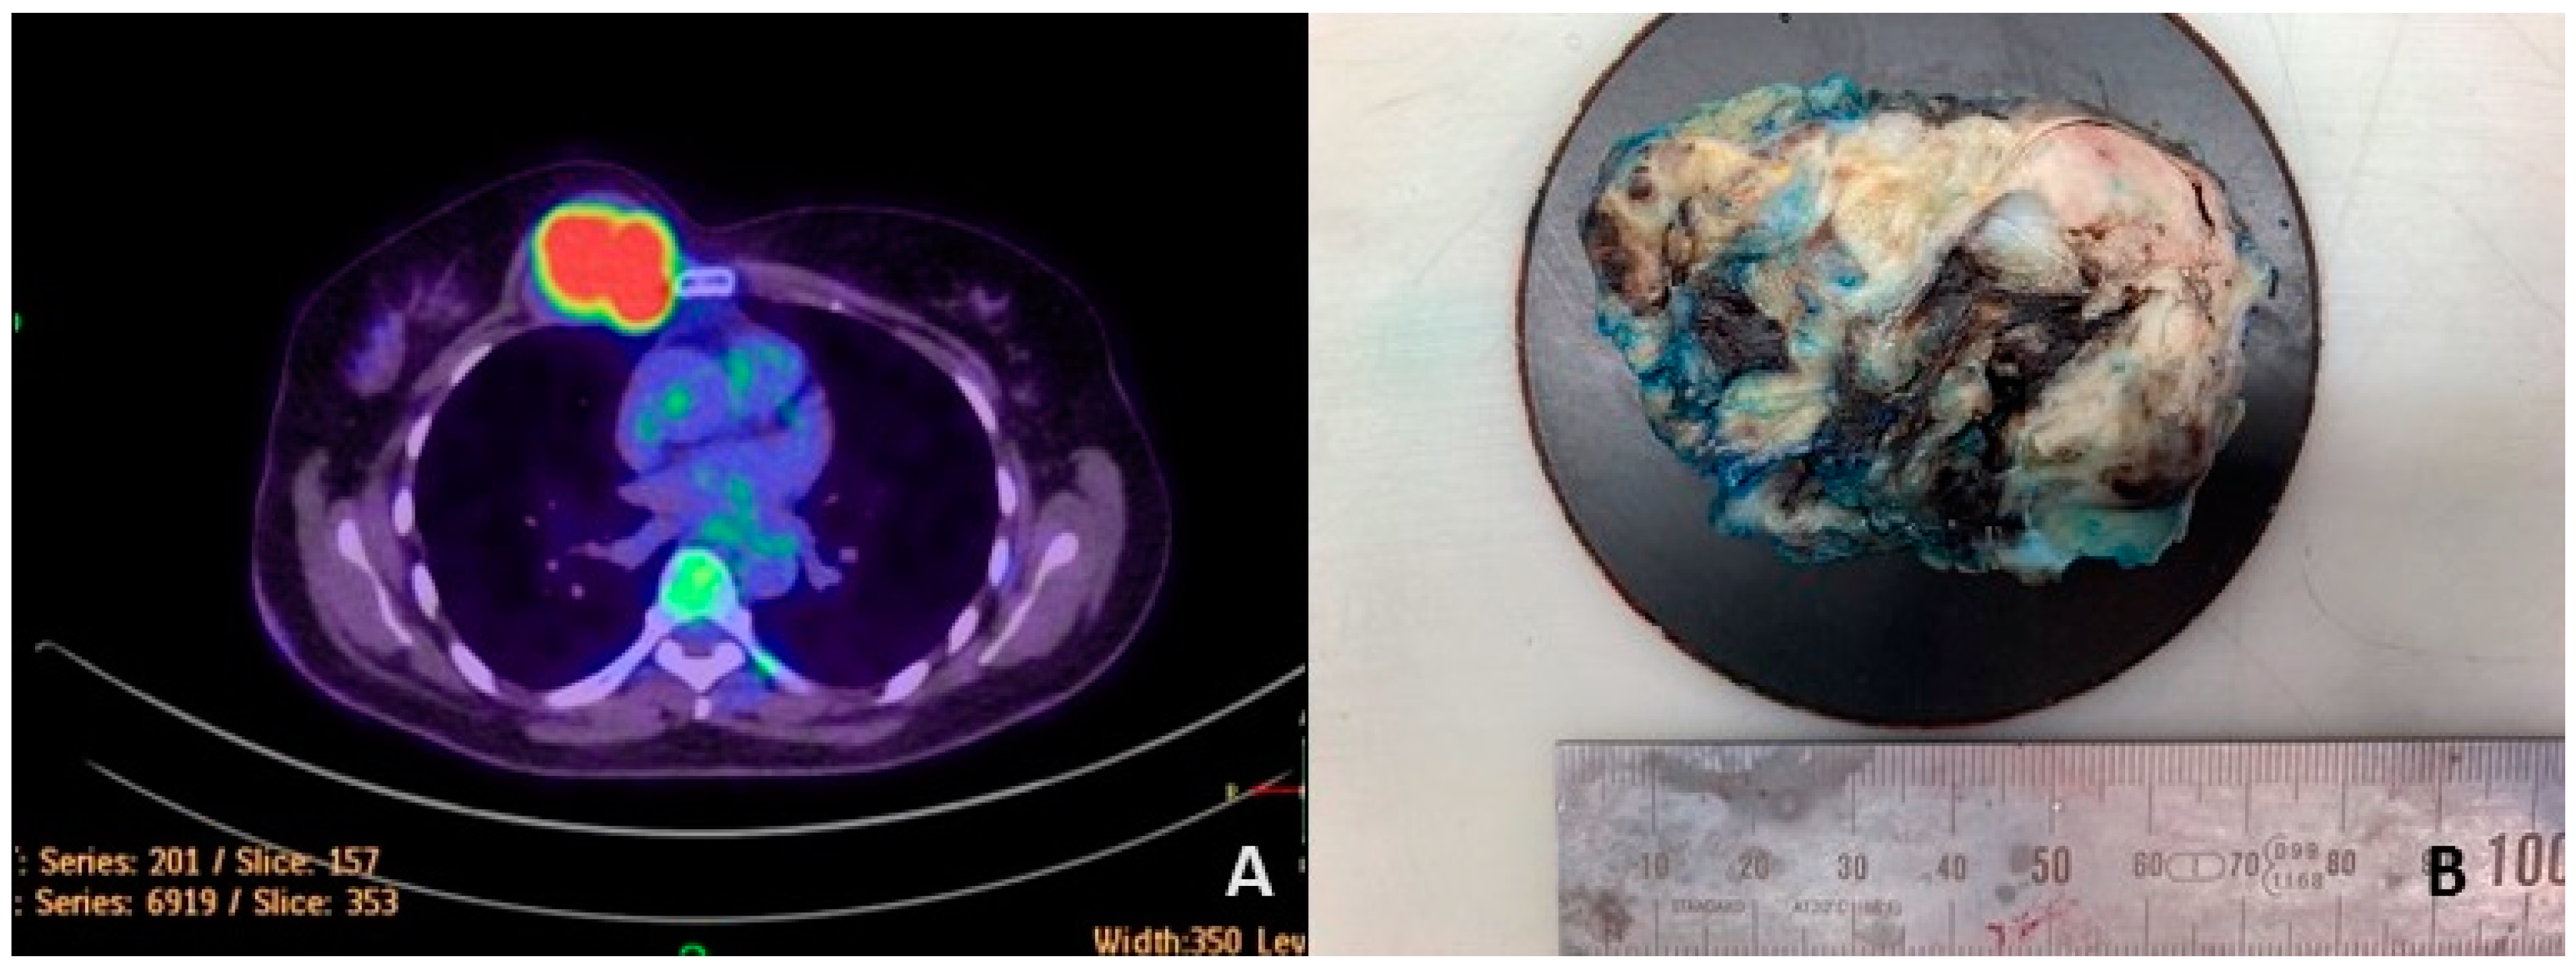
3.1. Case Report
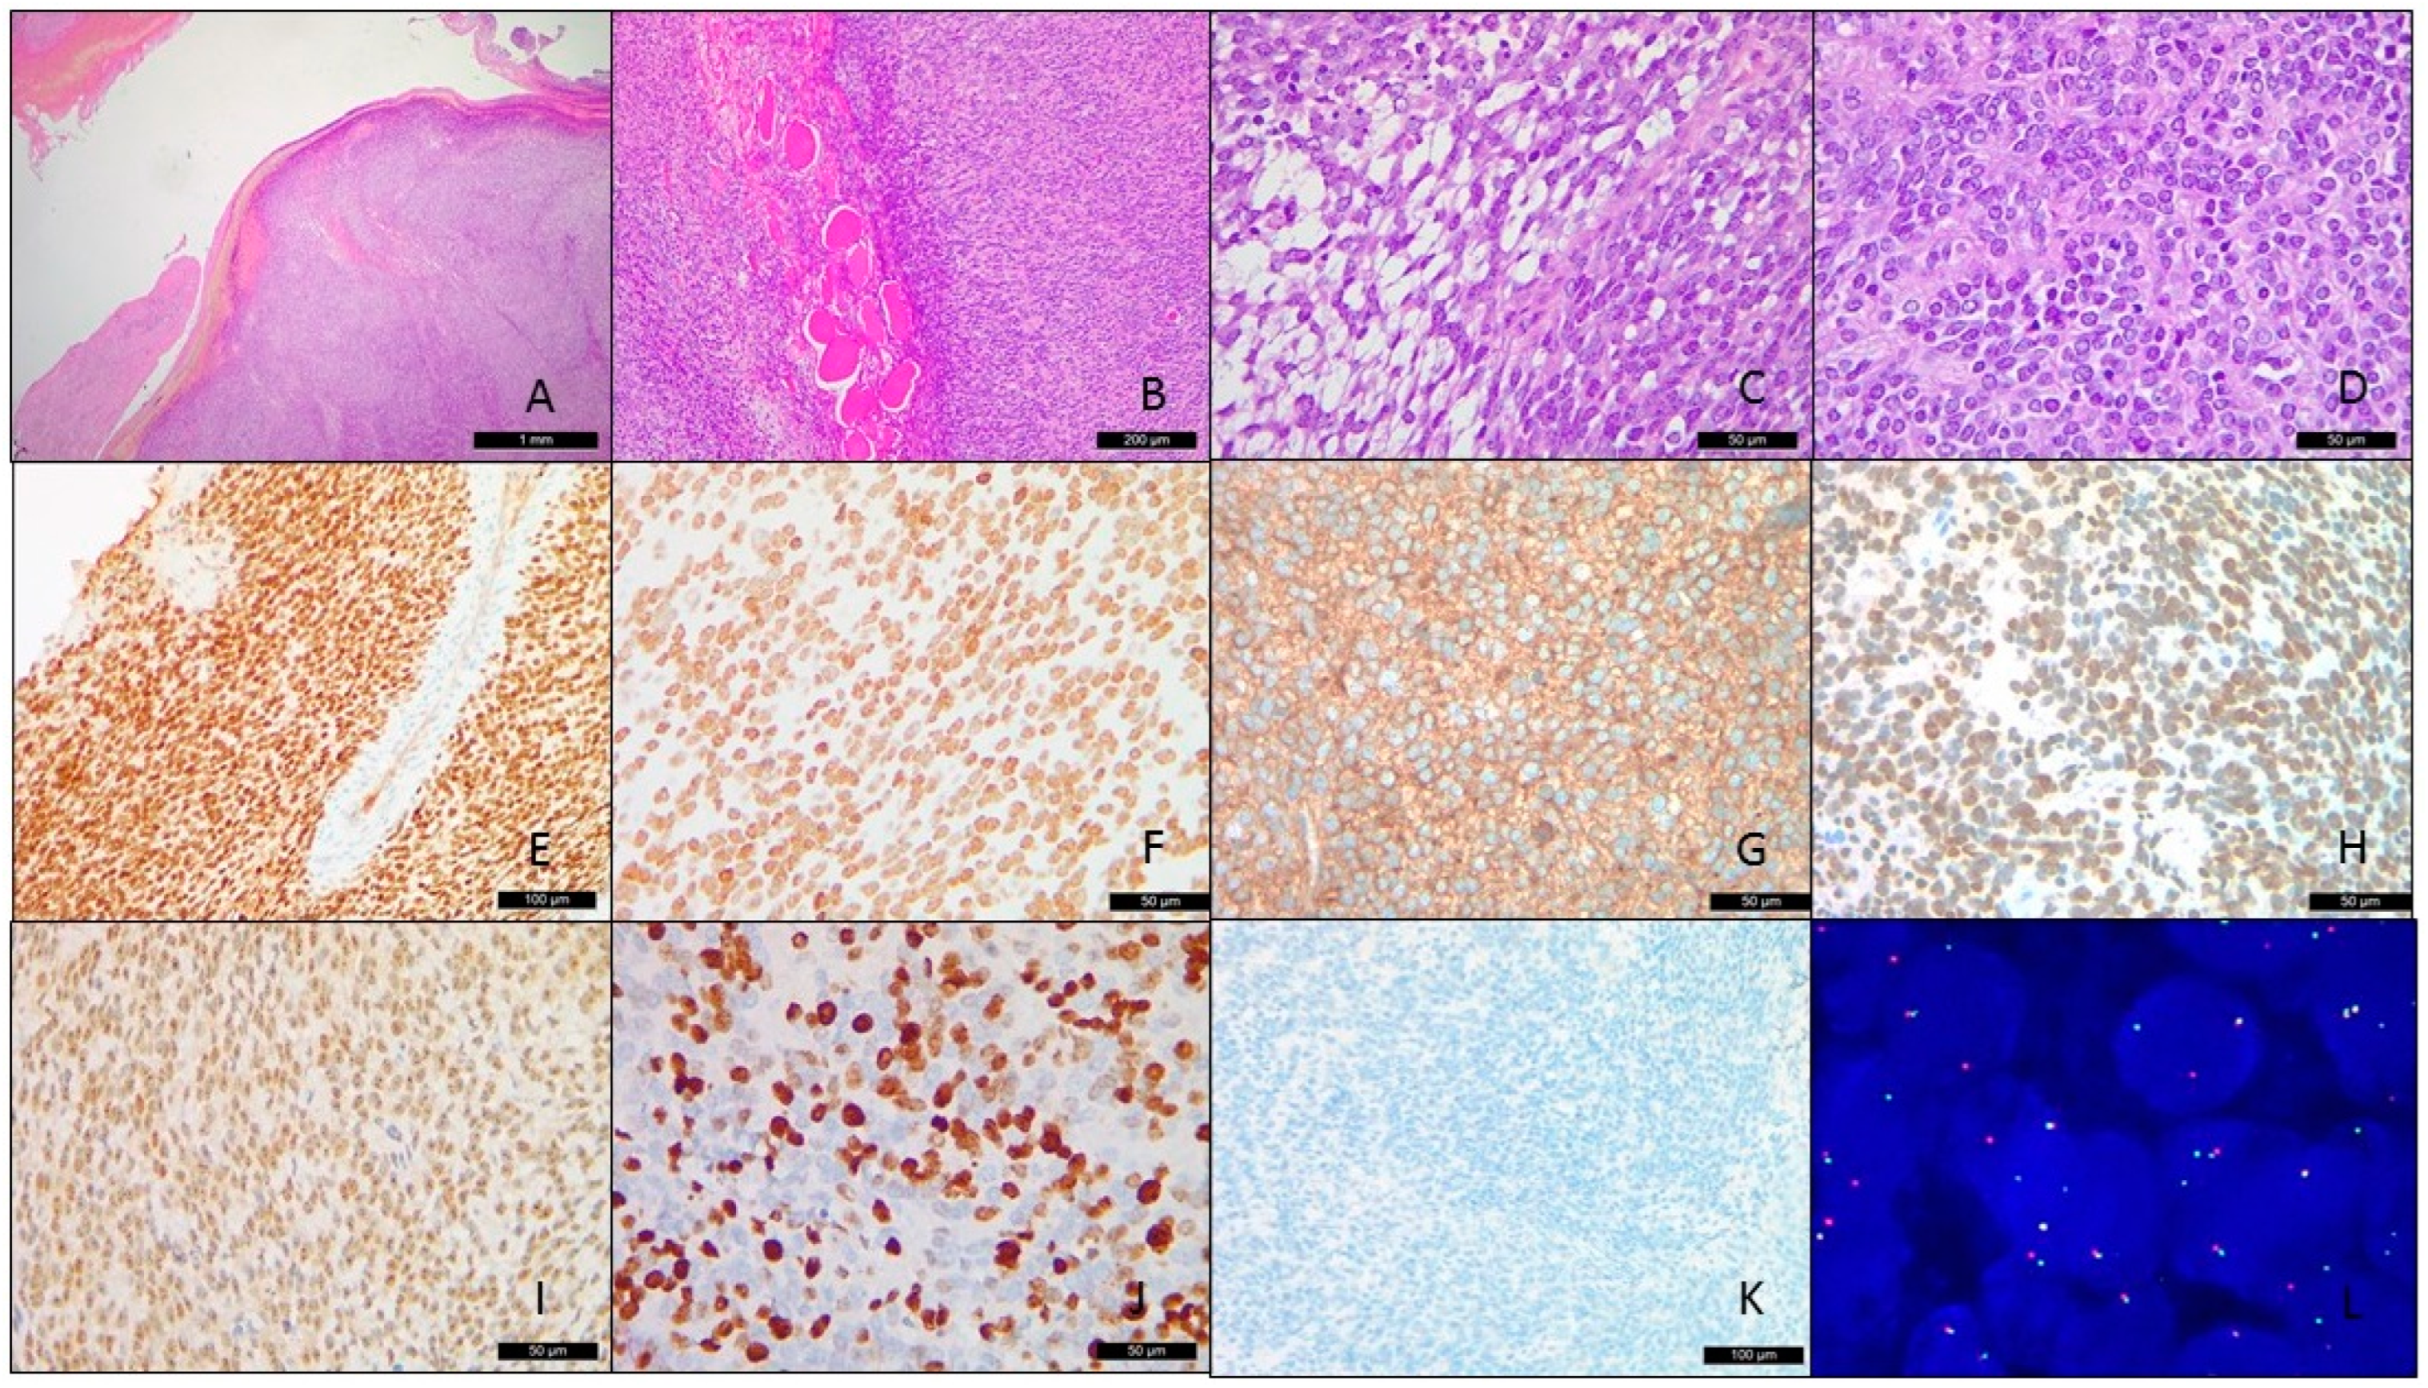
3.2. Pathological Findings
3.3. Fluorescence In Situ Hybridization
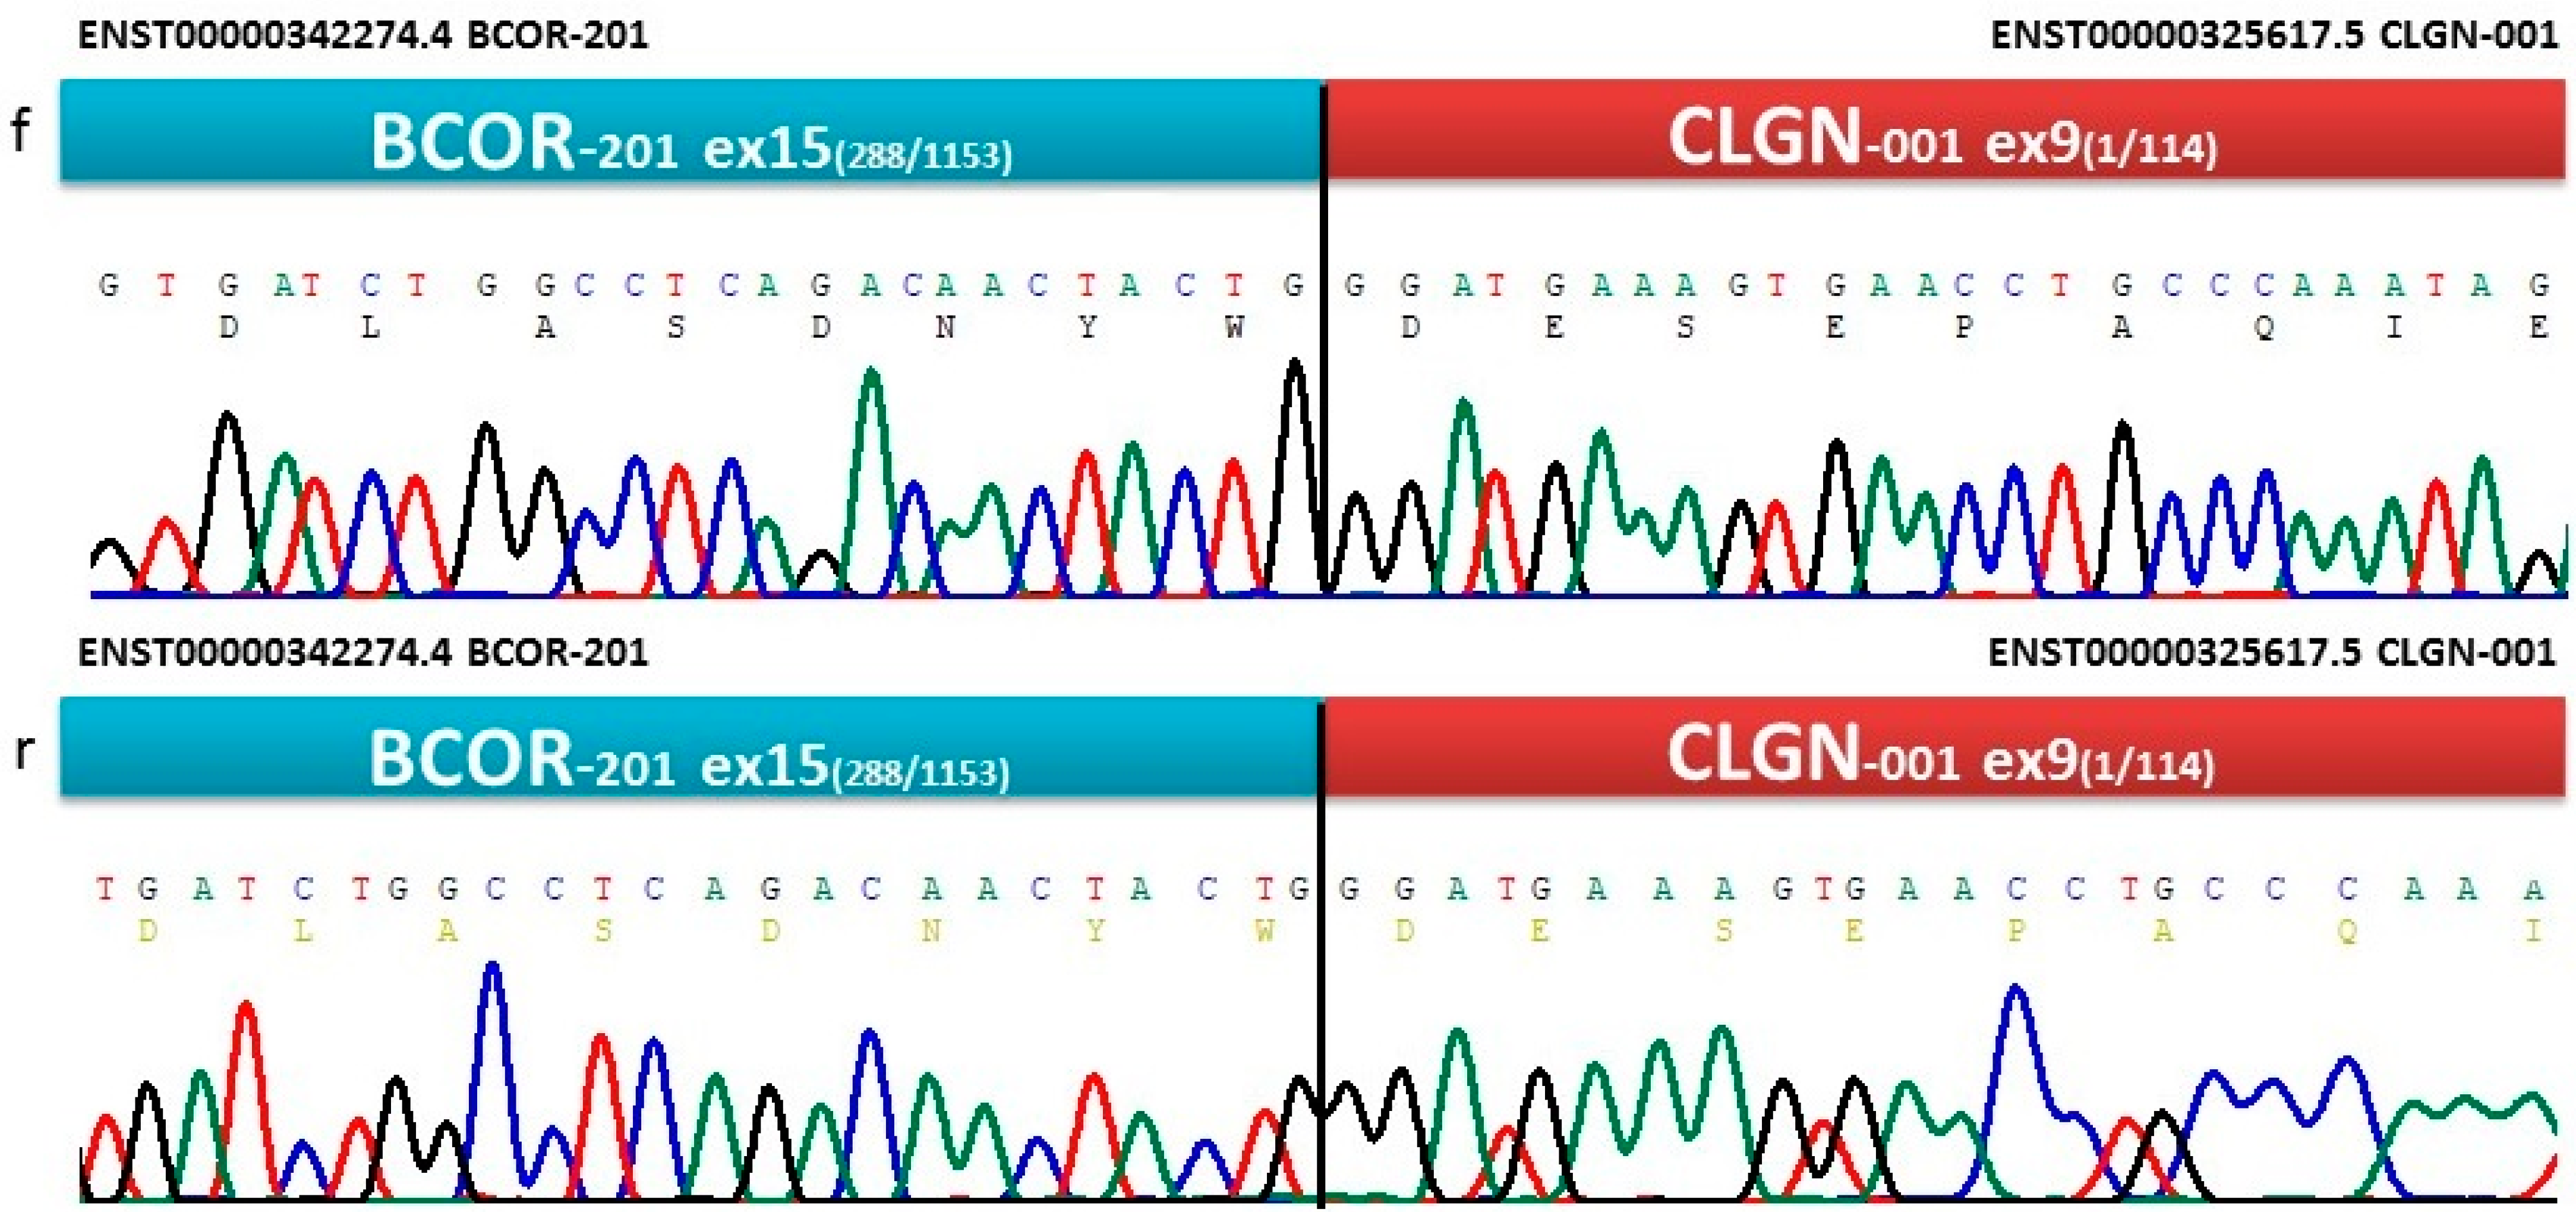
3.4. NGS and Sanger Sequencing
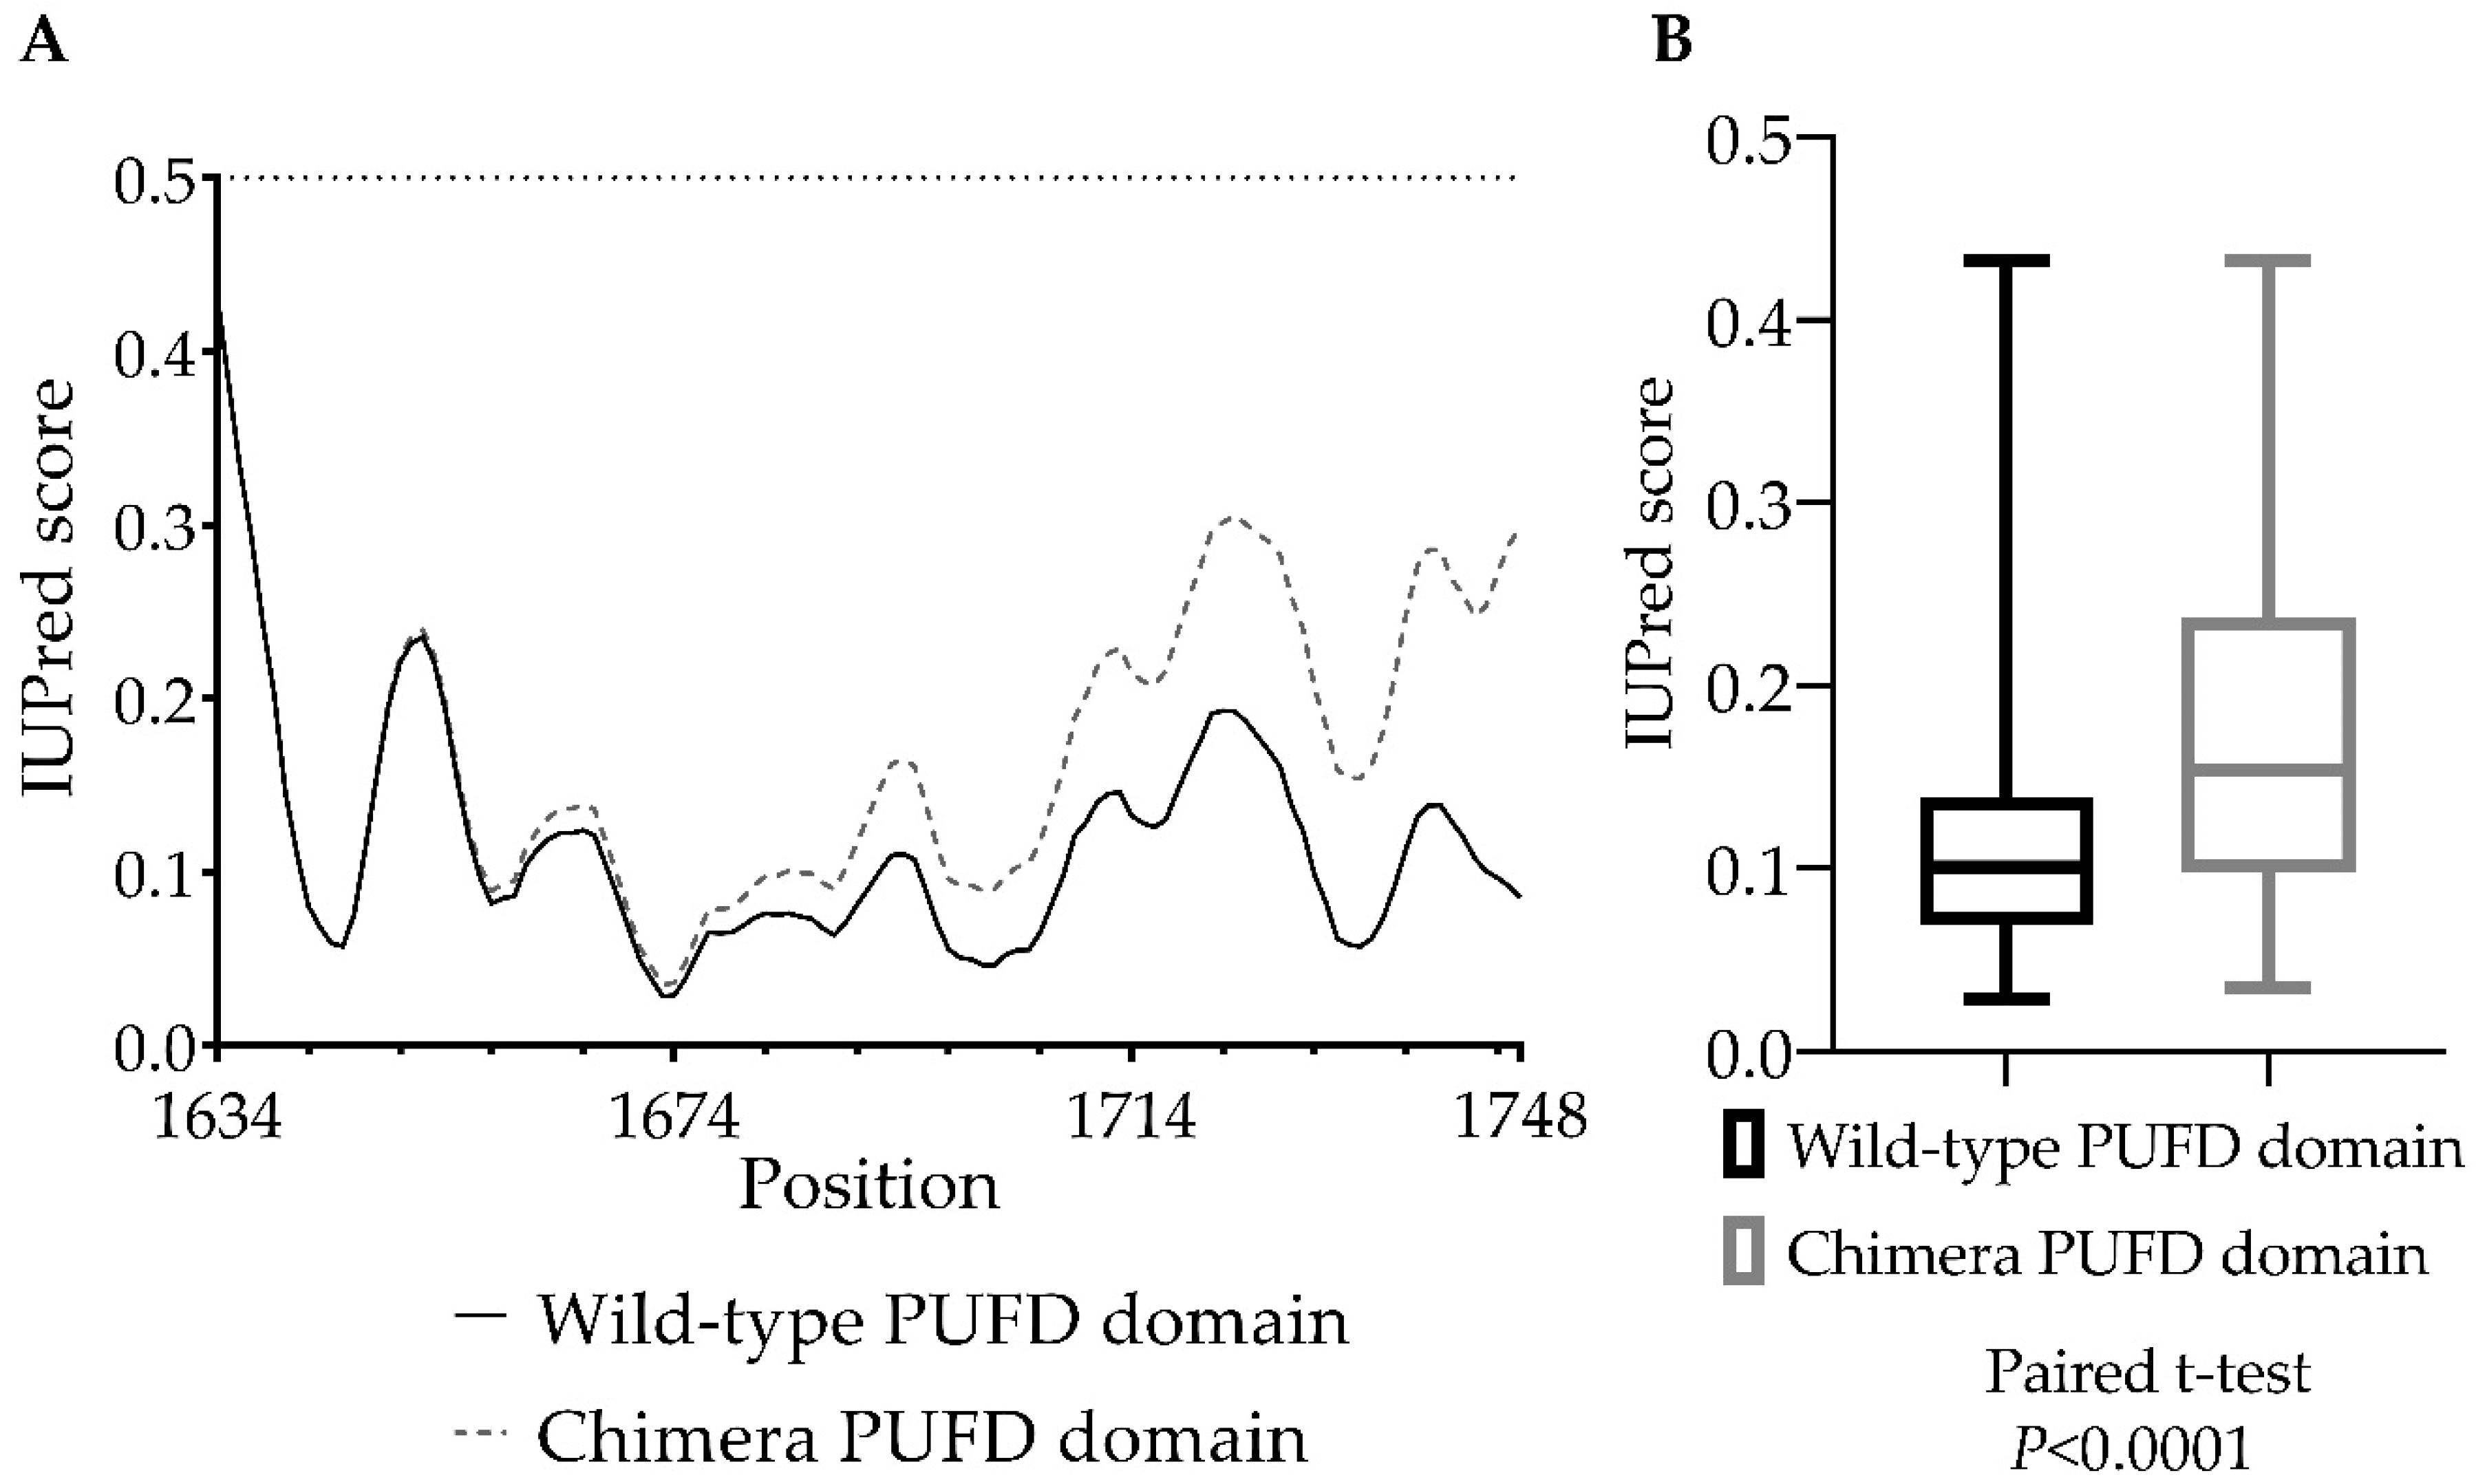
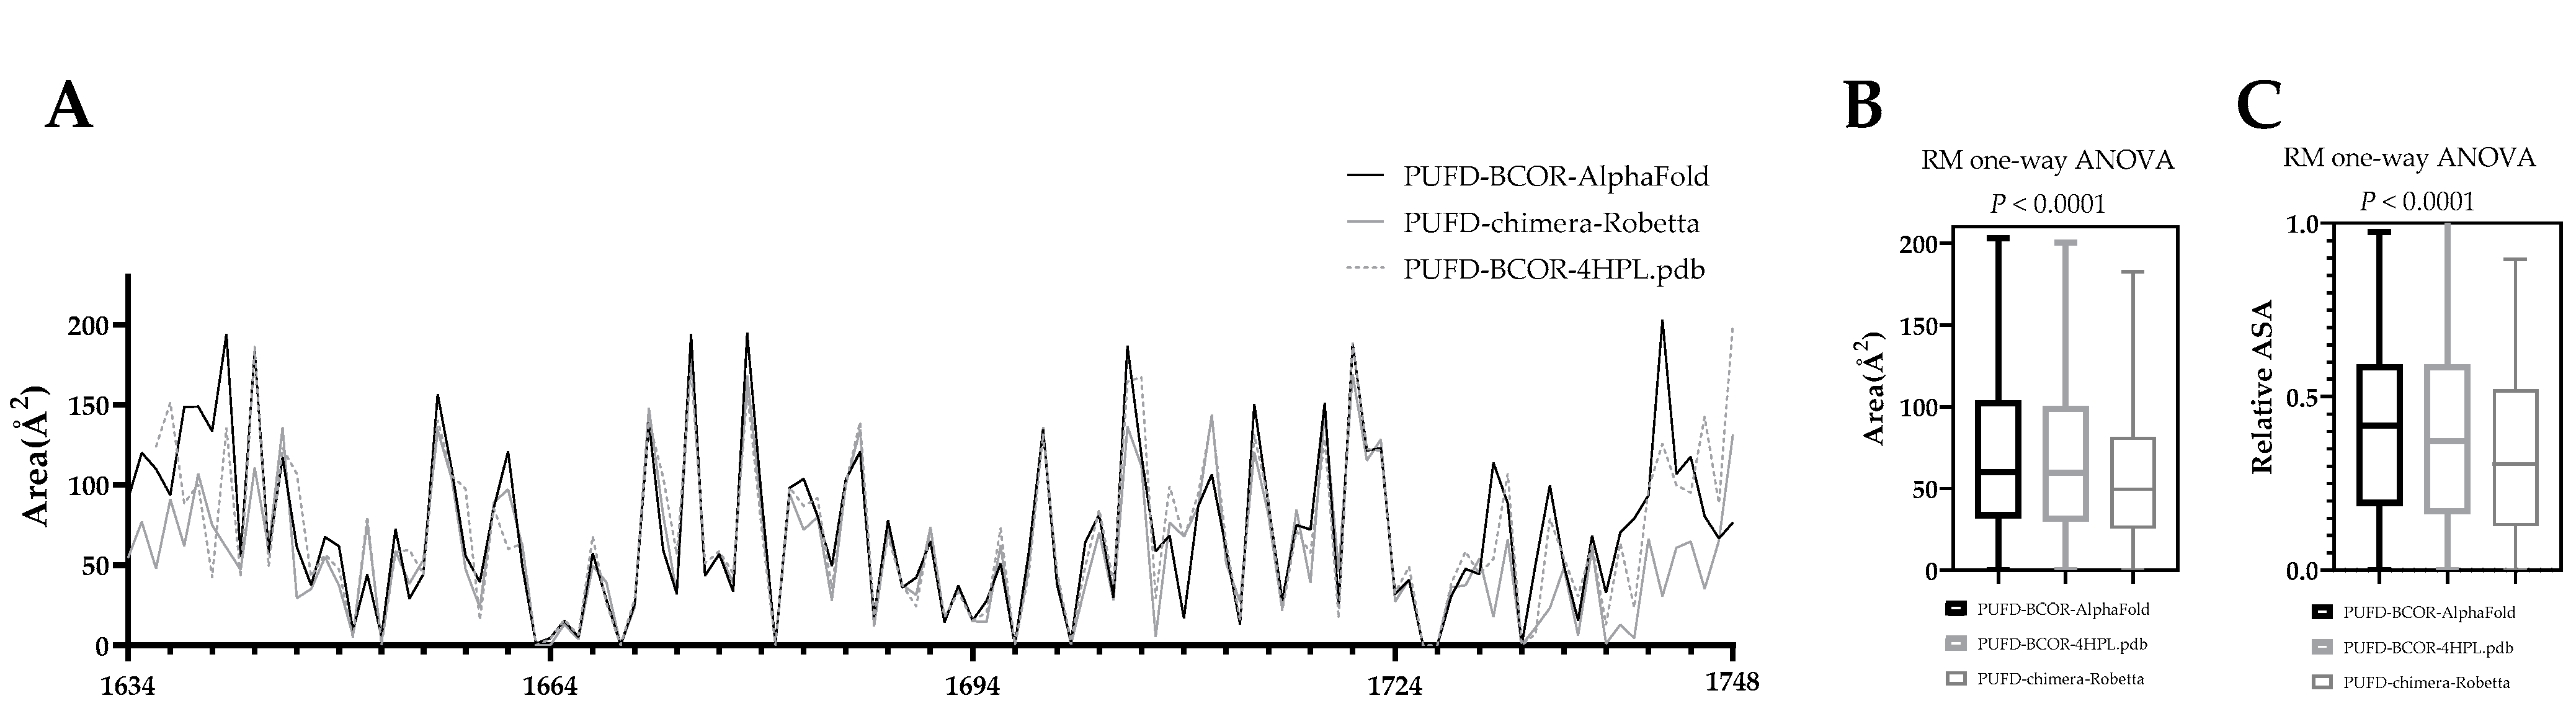
3.5. In Silico Protein Analysis
4. Discussion
5. Conclusions
Author Contributions
Funding
Institutional Review Board Statement
Informed Consent Statement
Data Availability Statement
Conflicts of Interest
References
- Astolfi, A.; Melchionda, F.; Perotti, D.; Fois, M.; Indio, V.; Urbini, M.; Genovese, C.G.; Collini, P.; Salfi, N.; Nantron, M.; et al. Whole transcriptome sequencing identifies BCOR internal tandem duplication as a common feature of clear cell sarcoma of the kidney. Oncotarget 2015, 6, 40934–40939. [Google Scholar] [CrossRef] [Green Version]
- Panagopoulos, I.; Gorunova, L.; Lund-Iversen, M.; Bassarova, A.; Heim, S. Fusion of the Genes. Cancer Genom. Proteom. 2019, 16, 345–351. [Google Scholar] [CrossRef] [Green Version]
- Haferlach, T.; Nagata, Y.; Grossmann, V.; Okuno, Y.; Bacher, U.; Nagae, G.; Schnittger, S.; Sanada, M.; Kon, A.; Alpermann, T.; et al. Landscape of genetic lesions in 944 patients with myelodysplastic syndromes. Leukemia 2014, 28, 241–247. [Google Scholar] [CrossRef] [PubMed] [Green Version]
- Pierron, G.; Tirode, F.; Lucchesi, C.; Reynaud, S.; Ballet, S.; Cohen-Gogo, S.; Perrin, V.; Coindre, J.M.; Delattre, O. A new subtype of bone sarcoma defined by BCOR-CCNB3 gene fusion. Nat. Genet. 2012, 44, 461–466. [Google Scholar] [CrossRef] [PubMed] [Green Version]
- Pagan, J.K.; Arnold, J.; Hanchard, K.J.; Kumar, R.; Bruno, T.; Jones, M.J.; Richard, D.J.; Forrest, A.; Spurdle, A.; Verdin, E.; et al. A novel corepressor, BCoR-L1, represses transcription through an interaction with CtBP. J. Biol. Chem. 2007, 282, 15248–15257. [Google Scholar] [CrossRef] [PubMed] [Green Version]
- Huynh, K.D.; Fischle, W.; Verdin, E.; Bardwell, V.J. BCoR, a novel corepressor involved in BCL-6 repression. Genes Dev. 2000, 14, 1810–1823. [Google Scholar] [CrossRef]
- Albagli, O.; Lantoine, D.; Quief, S.; Quignon, F.; Englert, C.; Kerckaert, J.P.; Montarras, D.; Pinset, C.; Lindon, C. Overexpressed BCL6 (LAZ3) oncoprotein triggers apoptosis, delays S phase progression and associates with replication foci. Oncogene 1999, 18, 5063–5075. [Google Scholar] [CrossRef] [PubMed] [Green Version]
- Blackledge, N.P.; Rose, N.R.; Klose, R.J. Targeting Polycomb systems to regulate gene expression: Modifications to a complex story. Nat. Rev. Mol. Cell Biol. 2015, 16, 643–649. [Google Scholar] [CrossRef] [Green Version]
- Junco, S.E.; Wang, R.; Gaipa, J.C.; Taylor, A.B.; Schirf, V.; Gearhart, M.D.; Bardwell, V.J.; Demeler, B.; Hart, P.J.; Kim, C.A. Structure of the polycomb group protein PCGF1 in complex with BCOR reveals basis for binding selectivity of PCGF homologs. Structure 2013, 21, 665–671. [Google Scholar] [CrossRef] [Green Version]
- Chittock, E.C.; Latwiel, S.; Miller, T.C.; Müller, C.W. Molecular architecture of polycomb repressive complexes. Biochem. Soc. Trans. 2017, 45, 193–205. [Google Scholar] [CrossRef] [Green Version]
- Blackledge, N.P.; Farcas, A.M.; Kondo, T.; King, H.W.; McGouran, J.F.; Hanssen, L.L.P.; Ito, S.; Cooper, S.; Kondo, K.; Koseki, Y.; et al. Variant PRC1 complex-dependent H2A ubiquitylation drives PRC2 recruitment and polycomb domain formation. Cell 2014, 157, 1445–1459. [Google Scholar] [CrossRef] [PubMed] [Green Version]
- Wang, Z.; Gearhart, M.D.; Lee, Y.W.; Kumar, I.; Ramazanov, B.; Zhang, Y.; Hernandez, C.; Lu, A.Y.; Neuenkirchen, N.; Deng, J.; et al. A Non-canonical BCOR-PRC1.1 Complex Represses Differentiation Programs in Human ESCs. Cell Stem Cell 2018, 22, 235–251.e239. [Google Scholar] [CrossRef] [PubMed] [Green Version]
- Ueno-Yokohata, H.; Okita, H.; Nakasato, K.; Akimoto, S.; Hata, J.; Koshinaga, T.; Fukuzawa, M.; Kiyokawa, N. Consistent in-frame internal tandem duplications of BCOR characterize clear cell sarcoma of the kidney. Nat. Genet. 2015, 47, 861–863. [Google Scholar] [CrossRef] [PubMed]
- Roy, A.; Kumar, V.; Zorman, B.; Fang, E.; Haines, K.M.; Doddapaneni, H.; Hampton, O.A.; White, S.; Bavle, A.A.; Patel, N.R.; et al. Recurrent internal tandem duplications of BCOR in clear cell sarcoma of the kidney. Nat. Commun. 2015, 6, 8891. [Google Scholar] [CrossRef] [PubMed] [Green Version]
- Kenny, C.; Bausenwein, S.; Lazaro, A.; Furtwängler, R.; Gooskens, S.L.; van den Heuvel Eibrink, M.; Vokuhl, C.; Leuschner, I.; Graf, N.; Gessler, M.; et al. Mutually exclusive BCOR internal tandem duplications and YWHAE-NUTM2 fusions in clear cell sarcoma of kidney: Not the full story. J. Pathol. 2016, 238, 617–620. [Google Scholar] [CrossRef] [PubMed]
- Astolfi, A.; Fiore, M.; Melchionda, F.; Indio, V.; Bertuccio, S.N.; Pession, A. BCOR involvement in cancer. Epigenomics 2019, 11, 835–855. [Google Scholar] [CrossRef] [Green Version]
- Specht, K.; Zhang, L.; Sung, Y.S.; Nucci, M.; Dry, S.; Vaiyapuri, S.; Richter, G.H.; Fletcher, C.D.; Antonescu, C.R. Novel BCOR-MAML3 and ZC3H7B-BCOR Gene Fusions in Undifferentiated Small Blue Round Cell Sarcomas. Am. J. Surg. Pathol. 2016, 40, 433–442. [Google Scholar] [CrossRef] [Green Version]
- Vasella, M.; Wagner, U.; Fritz, C.; Seidl, K.; Giudici, L.; Exner, G.U.; Moch, H.; Wild, P.J.; Bode-Lesniewska, B. Novel RGAG1-BCOR gene fusion revealed in a somatic soft tissue sarcoma with a long follow-up. Virchows Arch. 2022, 480, 1107–1114. [Google Scholar] [CrossRef]
- Kao, Y.C.; Owosho, A.A.; Sung, Y.S.; Zhang, L.; Fujisawa, Y.; Lee, J.C.; Wexler, L.; Argani, P.; Swanson, D.; Dickson, B.C.; et al. BCOR-CCNB3 Fusion Positive Sarcomas: A Clinicopathologic and Molecular Analysis of 36 Cases With Comparison to Morphologic Spectrum and Clinical Behavior of Other Round Cell Sarcomas. Am. J. Surg. Pathol. 2018, 42, 604–615. [Google Scholar] [CrossRef]
- Altschul, S.F.; Gish, W.; Miller, W.; Myers, E.W.; Lipman, D.J. Basic local alignment search tool. J. Mol. Biol. 1990, 215, 403–410. [Google Scholar] [CrossRef]
- States, D.J.; Gish, W. Combined use of sequence similarity and codon bias for coding region identification. J. Comput. Biol. 1994, 1, 39–50. [Google Scholar] [CrossRef] [PubMed] [Green Version]
- Madden, T.L.; Tatusov, R.L.; Zhang, J. Applications of network BLAST server. Methods Enzymol. 1996, 266, 131–141. [Google Scholar] [CrossRef]
- Altschul, S.F.; Madden, T.L.; Schäffer, A.A.; Zhang, J.; Zhang, Z.; Miller, W.; Lipman, D.J. Gapped BLAST and PSI-BLAST: A new generation of protein database search programs. Nucleic Acids Res. 1997, 25, 3389–3402. [Google Scholar] [CrossRef] [Green Version]
- Zhang, L.; Ma, B.; Wang, L.; Xu, Y. Greedy method for inferring tandem duplication history. Bioinformatics 2003, 19, 1497–1504. [Google Scholar] [CrossRef] [PubMed] [Green Version]
- Zhang, J.; Madden, T.L. PowerBLAST: A new network BLAST application for interactive or automated sequence analysis and annotation. Genome Res. 1997, 7, 649–656. [Google Scholar] [CrossRef] [PubMed] [Green Version]
- Morgulis, A.; Coulouris, G.; Raytselis, Y.; Madden, T.L.; Agarwala, R.; Schäffer, A.A. Database indexing for production MegaBLAST searches. Bioinformatics 2008, 24, 1757–1764. [Google Scholar] [CrossRef] [Green Version]
- Camacho, C.; Coulouris, G.; Avagyan, V.; Ma, N.; Papadopoulos, J.; Bealer, K.; Madden, T.L. BLAST+: Architecture and applications. BMC Bioinform. 2009, 10, 421. [Google Scholar] [CrossRef] [Green Version]
- Boratyn, G.M.; Schäffer, A.A.; Agarwala, R.; Altschul, S.F.; Lipman, D.J.; Madden, T.L. Domain enhanced lookup time accelerated BLAST. Biol. Direct. 2012, 7, 12. [Google Scholar] [CrossRef] [PubMed] [Green Version]
- Boratyn, G.M.; Thierry-Mieg, J.; Thierry-Mieg, D.; Busby, B.; Madden, T.L. Magic-BLAST, an accurate RNA-seq aligner for long and short reads. BMC Bioinform. 2019, 20, 405. [Google Scholar] [CrossRef]
- Hornbeck, P.V.; Zhang, B.; Murray, B.; Kornhauser, J.M.; Latham, V.; Skrzypek, E. PhosphoSitePlus, 2014: Mutations, PTMs and recalibrations. Nucleic Acids Res. 2015, 43, D512–D520. [Google Scholar] [CrossRef] [Green Version]
- Wang, L.; Zhang, J.; Wang, D.; Song, C. Membrane contact probability: An essential and predictive character for the structural and functional studies of membrane proteins. PLoS Comput. Biol. 2022, 18, e1009972. [Google Scholar] [CrossRef] [PubMed]
- Gasteiger, E.H.C.; Gattiker, A.; Duvaud, S.; Wilkins, M.R.; Appel, R.D.; Bairoch, A. Protein Identification and Analysis Tools on the ExPASy Server; Walker, J.M., Ed.; Humana Press: Totowa, NJ, USA, 2005; pp. 571–607. [Google Scholar]
- Guruprasad, K.; Reddy, B.V.; Pandit, M.W. Correlation between stability of a protein and its dipeptide composition: A novel approach for predicting in vivo stability of a protein from its primary sequence. Protein Eng. 1990, 4, 155–161. [Google Scholar] [CrossRef] [PubMed]
- Ikai, A. Thermostability and aliphatic index of globular proteins. J. Biochem. 1980, 88, 1895–1898. [Google Scholar] [PubMed]
- Kyte, J.; Doolittle, R.F. A simple method for displaying the hydropathic character of a protein. J. Mol. Biol. 1982, 157, 105–132. [Google Scholar] [CrossRef] [PubMed] [Green Version]
- Baek, M.; DiMaio, F.; Anishchenko, I.; Dauparas, J.; Ovchinnikov, S.; Lee, G.R.; Wang, J.; Cong, Q.; Kinch, L.N.; Schaeffer, R.D.; et al. Accurate prediction of protein structures and interactions using a three-track neural network. Science 2021, 373, 871–876. [Google Scholar] [CrossRef]
- Erdős, G.; Pajkos, M.; Dosztányi, Z. IUPred3: Prediction of protein disorder enhanced with unambiguous experimental annotation and visualization of evolutionary conservation. Nucleic Acids Res. 2021, 49, W297–W303. [Google Scholar] [CrossRef]
- Garnier, J.; Gibrat, J.F.; Robson, B. GOR method for predicting protein secondary structure from amino acid sequence. Methods Enzymol. 1996, 266, 540–553. [Google Scholar] [CrossRef]
- Accessible Surface Area and Accessibility Calculation for Protein. Available online: http://cib.cf.ocha.ac.jp/bitool/ASA/ (accessed on 22 December 2022).
- Jumper, J.; Evans, R.; Pritzel, A.; Green, T.; Figurnov, M.; Ronneberger, O.; Tunyasuvunakool, K.; Bates, R.; Žídek, A.; Potapenko, A.; et al. Applying and improving AlphaFold at CASP14. Proteins 2021, 89, 1711–1721. [Google Scholar] [CrossRef] [PubMed]
- Varadi, M.; Velankar, S. The impact of AlphaFold Protein Structure Database on the fields of life sciences. Proteomics 2022, e2200128. [Google Scholar] [CrossRef]
- Watson, S.; Perrin, V.; Guillemot, D.; Reynaud, S.; Coindre, J.M.; Karanian, M.; Guinebretière, J.M.; Freneaux, P.; Le Loarer, F.; Bouvet, M.; et al. Transcriptomic definition of molecular subgroups of small round cell sarcomas. J. Pathol. 2018, 245, 29–40. [Google Scholar] [CrossRef] [Green Version]
- Fan, Z.; Yamaza, T.; Lee, J.S.; Yu, J.; Wang, S.; Fan, G.; Shi, S.; Wang, C.Y. BCOR regulates mesenchymal stem cell function by epigenetic mechanisms. Nat. Cell Biol. 2009, 11, 1002–1009. [Google Scholar] [CrossRef] [PubMed]
- Schaefer, E.J.; Wang, H.C.; Karp, H.Q.; Meyer, C.A.; Cejas, P.; Gearhart, M.D.; Adelman, E.R.; Fares, I.; Apffel, A.; Lim, K.; et al. BCOR and BCORL1 Mutations Drive Epigenetic Reprogramming and Oncogenic Signaling by Unlinking PRC1.1 from Target Genes. Blood Cancer Discov. 2022, 3, 116–135. [Google Scholar] [CrossRef]
- Gearhart, M.D.; Corcoran, C.M.; Wamstad, J.A.; Bardwell, V.J. Polycomb group and SCF ubiquitin ligases are found in a novel BCOR complex that is recruited to BCL6 targets. Mol. Cell Biol. 2006, 26, 6880–6889. [Google Scholar] [CrossRef] [PubMed] [Green Version]
- Kim, D.H.; Shim, J.S.; Kwon, H.J. Coordinated transcriptional regulation of calmegin, a testis-specific molecular chaperon, by histone deacetylase and CpG methyltransferase. Exp. Mol. Med. 2005, 37, 492–496. [Google Scholar] [CrossRef] [PubMed] [Green Version]
- Itcho, K.; Oki, K.; Gomez-Sanchez, C.E.; Gomez-Sanchez, E.P.; Ohno, H.; Kobuke, K.; Nagano, G.; Yoshii, Y.; Baba, R.; Hattori, N.; et al. Endoplasmic Reticulum Chaperone Calmegin Is Upregulated in Aldosterone-Producing Adenoma and Associates With Aldosterone Production. Hypertension 2020, 75, 492–499. [Google Scholar] [CrossRef] [PubMed]
- Chen, L.; Huang, Z.; Yao, G.; Lyu, X.; Li, J.; Hu, X.; Cai, Y.; Li, W.; Li, X.; Ye, C. The expression of CXCL13 and its relation to unfavorable clinical characteristics in young breast cancer. J. Transl. Med. 2015, 13, 168. [Google Scholar] [CrossRef] [PubMed] [Green Version]
- Ohsako, S.; Janulis, L.; Hayashi, Y.; Bunick, D. Characterization of domains in mice of calnexin-t, a putative molecular chaperone required in sperm fertility, with use of glutathione S-transferase-fusion proteins. Biol. Reprod. 1998, 59, 1214–1223. [Google Scholar] [CrossRef] [PubMed] [Green Version]
- Ikawa, M.; Wada, I.; Kominami, K.; Watanabe, D.; Toshimori, K.; Nishimune, Y.; Okabe, M. The putative chaperone calmegin is required for sperm fertility. Nature 1997, 387, 607–611. [Google Scholar] [CrossRef]
- Dugué, P.A.; Dowty, J.G.; Joo, J.E.; Wong, E.M.; Makalic, E.; Schmidt, D.F.; English, D.R.; Hopper, J.L.; Pedersen, J.; Severi, G.; et al. Heritable methylation marks associated with breast and prostate cancer risk. Prostate 2018, 78, 962–969. [Google Scholar] [CrossRef]


| GRAVY | AI | II | EC | +R | −R | TpI | Mw (Da) | Sequence Length (AA) | |
|---|---|---|---|---|---|---|---|---|---|
| BCOR-CLGN chimera | −0.706 | 67.92 | 54.94 | 240,930 | 243 | 295 | 5.51 | 228,230.90 | 2070 |
| BCOR | −0.668 | 68.38 | 55.26 | 160,115 | 203 | 226 | 6.06 | 192,188.64 | 1755 |
| Calmegin | −0.734 | 72.74 | 44.52 | 121,850 | 75 | 132 | 4.57 | 70,038.60 | 610 |
Disclaimer/Publisher’s Note: The statements, opinions and data contained in all publications are solely those of the individual author(s) and contributor(s) and not of MDPI and/or the editor(s). MDPI and/or the editor(s) disclaim responsibility for any injury to people or property resulting from any ideas, methods, instructions or products referred to in the content. |
© 2023 by the authors. Licensee MDPI, Basel, Switzerland. This article is an open access article distributed under the terms and conditions of the Creative Commons Attribution (CC BY) license (https://creativecommons.org/licenses/by/4.0/).
Share and Cite
Chang Chien, Y.-C.; Madarász, K.; Csoma, S.L.; Mótyán, J.A.; Huang, H.-Y.; Méhes, G.; Mokánszki, A. Molecular Identification and In Silico Protein Analysis of a Novel BCOR-CLGN Gene Fusion in Intrathoracic BCOR-Rearranged Sarcoma. Cancers 2023, 15, 898. https://doi.org/10.3390/cancers15030898
Chang Chien Y-C, Madarász K, Csoma SL, Mótyán JA, Huang H-Y, Méhes G, Mokánszki A. Molecular Identification and In Silico Protein Analysis of a Novel BCOR-CLGN Gene Fusion in Intrathoracic BCOR-Rearranged Sarcoma. Cancers. 2023; 15(3):898. https://doi.org/10.3390/cancers15030898
Chicago/Turabian StyleChang Chien, Yi-Che, Kristóf Madarász, Szilvia Lilla Csoma, János András Mótyán, Hsuan-Ying Huang, Gábor Méhes, and Attila Mokánszki. 2023. "Molecular Identification and In Silico Protein Analysis of a Novel BCOR-CLGN Gene Fusion in Intrathoracic BCOR-Rearranged Sarcoma" Cancers 15, no. 3: 898. https://doi.org/10.3390/cancers15030898
APA StyleChang Chien, Y.-C., Madarász, K., Csoma, S. L., Mótyán, J. A., Huang, H.-Y., Méhes, G., & Mokánszki, A. (2023). Molecular Identification and In Silico Protein Analysis of a Novel BCOR-CLGN Gene Fusion in Intrathoracic BCOR-Rearranged Sarcoma. Cancers, 15(3), 898. https://doi.org/10.3390/cancers15030898