
Factors Associated with the Decision to Decline Chemotherapy in Metastatic Non-Small Cell Lung Cancer

 , , , ,
Abstract
:Simple Summary
Abstract
1. Introduction
2. Materials and Methods
2.1. Patient Data
2.2. Statistical Analysis
3. Results
4. Discussion
5. Conclusions
Supplementary Materials
Author Contributions
Funding
Institutional Review Board Statement
Informed Consent Statement
Data Availability Statement
Acknowledgments
Conflicts of Interest
References
- Siegel, R.L.; Miller, K.D.; Fuchs, H.E.; Jemal, A. Cancer statistics, 2022. CA Cancer J. Clin. 2022, 72, 7–33. [Google Scholar] [CrossRef] [PubMed]
- Duma, N.; Santana-Davila, R.; Molina, J.R. Non-Small Cell Lung Cancer: Epidemiology, Screening, Diagnosis, and Treatment. Mayo. Clin. Proc. 2019, 94, 1623–1640. [Google Scholar] [CrossRef] [PubMed]
- Lu, T.; Yang, X.; Huang, Y.; Zhao, M.; Li, M.; Ma, K.; Yin, J.; Zhan, C.; Wang, Q. Trends in the incidence, treatment, and survival of patients with lung cancer in the last four decades. Cancer Manag. Res. 2019, 11, 943–953. [Google Scholar] [CrossRef] [Green Version]
- Goldstraw, P.; Chansky, K.; Crowley, J.; Rami-Porta, R.; Asamura, H.; Eberhardt, W.E.; Nicholson, A.G.; Groome, P.; Mitchell, A.; Bolejack, V.; et al. The IASLC Lung Cancer Staging Project: Proposals for Revision of the TNM Stage Groupings in the Forthcoming (Eighth) Edition of the TNM Classification for Lung Cancer. J. Thorac. Oncol. 2016, 11, 39–51. [Google Scholar] [CrossRef] [Green Version]
- Oncology ASoC. Lung Cancer—Non Small Cell: Statistics 2021. Available online: https://www.cancer.net/cancer-types/lung-cancer-non-small-cell/statistics#:~:text=For%20people%20with%20localized%20NSCLC,survival%20rate%20is%20about%2035%25 (accessed on 4 February 2023).
- Alexander, M.; Kim, S.Y.; Cheng, H. Update 2020: Management of Non-Small Cell Lung Cancer. Lung 2020, 198, 897–907. [Google Scholar] [CrossRef] [PubMed]
- Rossi, A.; Di Maio, M. Platinum-based chemotherapy in advanced non-small-cell lung cancer: Optimal number of treatment cycles. Expert Rev. Anticancer. Ther. 2016, 16, 653–660. [Google Scholar] [CrossRef]
- Coughlin, S.S.; Blumenthal, D.S.; Seay, S.J.; Smith, S.A. Toward the Elimination of Colorectal Cancer Disparities among African Americans. J. Racial Ethn. Health Disparities 2015, 3, 555–564. [Google Scholar] [CrossRef] [Green Version]
- Robb, K.A.; Miles, A.; Wardle, J. Demographic and psychosocial factors associated with perceived risk for colorectal cancer. Cancer Epidemiol. Biomark. Prev. 2004, 13, 366–372. [Google Scholar] [CrossRef]
- Skalla, K.A.; Bakitas, M.; Furstenberg, C.T.; Ahles, T.; Henderson, J.V. Patients’ Need for Information About Cancer Therapy. Oncol. Nurs. Forum 2004, 31, 313–319. [Google Scholar] [CrossRef]
- Knight, T.G.; Deal, A.M.; Dusetzina, S.B.; Muss, H.B.; Choi, S.K.; Bensen, J.T.; Williams, G.R. Financial Toxicity in Adults with Cancer: Adverse Outcomes and Noncompliance. J. Oncol. Pract. 2018, 14, e665–e673. [Google Scholar] [CrossRef]
- Oh, K.M.; Taylor, K.L.; Jacobsen, K.H. Breast Cancer Screening Among Korean Americans: A Systematic Review. J. Community Health 2017, 42, 324–332. [Google Scholar] [CrossRef]
- Jabbal, I.S.; Bilani, N.; Yaghi, M.; Elson, L.; Liang, H.; Nahleh, Z.A. Geographical Disparities and Factors Associated with the Decision to Decline Chemotherapy in Breast Cancer. JCO Oncol. Pract. 2022, 18, e1417–e1426. [Google Scholar] [CrossRef] [PubMed]
- Wallace, S.K.; Lin, J.F.; Cliby, W.A.; Leiserowitz, G.S.; Tergas, A.I.; Bristow, R.E. Refusal of Recommended Chemotherapy for Ovarian Cancer: Risk Factors and Outcomes; a National Cancer Data Base Study. J. Natl. Compr. Cancer Netw. 2016, 14, 539–550. [Google Scholar] [CrossRef] [PubMed] [Green Version]
- Gopal, N.; Kozikowski, A.; Barginear, M.F.; Fishbein, J.; Pekmezaris, R.; Wolf-Klein, G. Reasons for Chemotherapy Refusal or Acceptance in Older Adults with Cancer. South. Med. J. 2017, 110, 47–53. [Google Scholar] [CrossRef]
- Kaltenmeier, C.; Malik, J.; Yazdani, H.; Geller, D.A.; Medich, D.; Zureikat, A.; Tohme, S. Refusal of cancer-directed treatment by colon cancer patients: Risk factors and survival outcomes. Am. J. Surg. 2020, 220, 1605–1612. [Google Scholar] [CrossRef]
- Du, X.L.; Lin, C.C.; Johnson, N.J.; Altekruse, S. Effects of individual-level socioeconomic factors on racial disparities in cancer treatment and survival: Findings from the National Longitudinal Mortality Study, 1979–2003. Cancer 2011, 117, 3242–3251. [Google Scholar] [CrossRef] [Green Version]
- Repetto, L. Greater risks of chemotherapy toxicity in elderly patients with cancer. J. Support. Oncol. 2004, 1, 18–24. [Google Scholar]
- Ganti, A.K.; Klein, A.B.; Cotarla, I.; Seal, B.; Chou, E. Update of Incidence, Prevalence, Survival, and Initial Treatment in Pa-tients with Non-Small Cell Lung Cancer in the US. JAMA Oncol. 2021, 7, 1824–1832. [Google Scholar] [CrossRef]
- Puts, M.T.; Tapscott, B.; Fitch, M.; Howell, D.; Monette, J.; Wan-Chow-Wah, D.; Krzyzanowska, M.; Leighl, N.B.; Springall, E.; Alibhai, S.M. A systematic review of factors influencing older adults’ decision to accept or decline cancer treatment. Cancer Treat. Rev. 2014, 41, 197–215. [Google Scholar] [CrossRef] [Green Version]
- Amalraj, S.; Starkweather, C.; Nguyen, C.; Naeim, A. Health literacy, communication, and treatment decision-making in older cancer patients. Oncology 2009, 23, 369–375. [Google Scholar]
- Duma, N.; Idossa, D.W.; Durani, U.; Frank, R.D.; Paludo, J.; Westin, G.; Lou, Y.; Mansfield, A.S.; Adjei, A.A.; Go, R.S.; et al. Influence of Sociodemographic Factors on Treatment Decisions in Non-Small-Cell Lung Cancer. Clin. Lung Cancer 2020, 21, e115–e219. [Google Scholar] [CrossRef] [PubMed]
- Suh, W.N.; Kong, K.A.; Han, Y.; Kim, S.J.; Lee, S.H.; Ryu, Y.J.; Lee, J.H.; Shim, S.S.; Kim, Y.; Chang, J.H. Risk factors associated with treatment refusal in lung cancer. Thorac. Cancer 2017, 8, 443–450. [Google Scholar] [CrossRef] [PubMed]
- Bradley, C.J.; Yabroff, K.R.; Warren, J.L.; Zeruto, C.; Chawla, N.; Lamont, E.B. Trends in the Treatment of Metastatic Colon and Rectal Cancer in Elderly Patients. Med. Care 2016, 54, 490–497. [Google Scholar] [CrossRef] [PubMed]
- Grant, S.R.; Walker, G.V.; Guadagnolo, B.A.; Koshy, M.; Allen, P.K.; Mahmood, U. Variation in insurance status by patient de-mographics and tumor site among nonelderly adult patients with cancer. Cancer 2015, 121, 2020–2028. [Google Scholar] [CrossRef] [PubMed]
- Halpern, M.T.; Ward, E.M.; Pavluck, A.L.; Schrag, N.M.; Bian, J.; Chen, A.Y. Association of insurance status and ethnicity with cancer stage at diagnosis for 12 cancer sites: A retrospective analysis. Lancet Oncol. 2008, 9, 222–231. [Google Scholar] [CrossRef]
- Zafar, S.Y. Financial Toxicity of Cancer Care: It’s Time to Intervene. J. Natl. Cancer Inst. 2016, 108, djv370. [Google Scholar] [CrossRef] [Green Version]
- Pisu, M.; Henrikson, N.B.; Banegas, M.P.; Yabroff, K.R. Costs of cancer along the care continuum: What we can expect based on recent literature. Cancer 2018, 124, 4181–4191. [Google Scholar] [CrossRef] [Green Version]
- Gilligan, A.M.; Alberts, D.S.; Roe, D.J.; Skrepnek, G.H. Death or Debt? National Estimates of Financial Toxicity in Persons with Newly-Diagnosed Cancer. Am. J. Med. 2018, 131, 1187–1199.e5. [Google Scholar] [CrossRef]
- Oncology ASoC. The state of cancer care in America, 2015: A report by the american society of clinical oncology. J. Oncol. Pract. 2015, 11, 79–113. [Google Scholar] [CrossRef] [Green Version]
- Altice, C.K.; Banegas, M.P.; Tucker-Seeley, R.D.; Yabroff, K.R. Financial Hardships Experienced by Cancer Survivors: A Systematic Review. J. Natl. Cancer Inst. 2017, 109, djw205. [Google Scholar] [CrossRef]
- Huang, I.C.; Bhakta, N.; Brinkman, T.M.; Klosky, J.L.; Krull, K.R.; Srivastava, D.; Hudson, M.M.; Robison, L.L. Determinants and Consequences of Financial Hardship among Adult Survivors of Childhood Cancer: A Report from the St. Jude Lifetime Cohort Study. J. Natl. Cancer Inst. 2019, 111, 189–200. [Google Scholar] [CrossRef]
- Ekwueme, D.U.; Robin Yabroff, K.; Guy, G.P., Jr.; Banegas, M.P.; de Moor, J.S.; Li, C.; Han, X.; Zheng, M.P.; Soni, A.; Davidoff, A.; et al. Medical costs and productivity losses of cancer survivors—United States, 2008–2011. Morb. Mortal. Wkly. Rep. 2014, 63, 505–510. [Google Scholar]
- Guy, G.P., Jr.; Yabroff, K.R.; Ekwueme, D.U.; Virgo, K.S.; Han, X.; Banegas, M.P.; Soni, A.; Zheng, Z.; Chawla, N.; Geiger, A.M. Healthcare Expenditure Burden among Non-elderly Cancer Survivors, 2008–2012. Am. J. Prev. Med. 2015, 49 (Suppl. S5), S489–S497. [Google Scholar] [CrossRef] [Green Version]
- Kodrzycki, Y.K. New England’s Educational Advantage: Past Successes and Future Prospects. New Engl. Econ. Rev. 2000, 25–40. [Google Scholar]
- Budkaew, J.; Chumworathayi, B. Knowledge and Attitudes toward Palliative Terminal Cancer Care among Thai Generalists. Asian Pac. J. Cancer Prev. 2013, 14, 6173–6180. [Google Scholar] [CrossRef] [PubMed] [Green Version]
- Brown, J.S.; Eraut, D.; Trask, C.; Davison, A.G. Age and the treatment of lung cancer. Thorax 1996, 51, 564–568. [Google Scholar] [CrossRef] [Green Version]
- Walsh-Buhi, E.R. Social Media and Cancer Misinformation: Additional Platforms to Explore. Am. J. Public Health 2020, 110, S292–S293. [Google Scholar] [CrossRef]
- Singer, S.; Blettner, M.; Kreienberg, R.; Janni, W.; Wöckel, A.; Kühn, T.; Felberbaum, R.; Flock, F.; Schwentner, L. Breast Cancer Patients’ Fear of Treatment: Results from the Multicenter Longitudinal Study BRENDA II. Breast Care 2015, 10, 95–100. [Google Scholar] [CrossRef] [Green Version]
- Hirose, T.; Yamaoka, T.; Ohnishi, T.; Sugiyama, T.; Kusumoto, S.; Shirai, T.; Okuda, K.; Ohmori, T.; Adachi, M. Patient willingness to undergo chemotherapy and thoracic radiotherapy for locally advanced non-small cell lung cancer. Psycho-Oncol. 2008, 18, 483–489. [Google Scholar] [CrossRef]
- Temel, J.S.; Greer, J.A.; Admane, S.; Gallagher, E.R.; Jackson, V.A.; Lynch, T.J.; Lennes, I.T.; Dahlin, C.M.; Pirl, W.F. Longitudinal Perceptions of Prognosis and Goals of Therapy in Patients with Metastatic Non–Small-Cell Lung Cancer: Results of a Randomized Study of Early Palliative Care. J. Clin. Oncol. 2011, 29, 2319–2326. [Google Scholar] [CrossRef] [Green Version]
- Brundage, M.D.; Davidson, J.R.; Mackillop, W.J. Trading treatment toxicity for survival in locally advanced non-small cell lung cancer. J. Clin. Oncol. 1997, 15, 330–340. [Google Scholar] [CrossRef] [PubMed]
- Steinhauser, K.E.; Christakis, N.A.; Clipp, E.C.; McNeilly, M.; Grambow, S.; Parker, J.; Tulsky, J.A. Preparing for the End of Life: Preferences of Patients, Families, Physicians, and Other Care Providers. J. Pain Symptom Manag. 2001, 22, 727–737. [Google Scholar] [CrossRef] [PubMed]
- Fried, T.R.; Bradley, E.H.; Towle, V.R.; Allore, H. Understanding the Treatment Preferences of Seriously Ill Patients. N. Engl. J. Med. 2002, 346, 1061–1066. [Google Scholar] [CrossRef] [PubMed]


| Refusal of Chemotherapy | p-Value | Multivariate Logistic Regression | p-Value | ||
|---|---|---|---|---|---|
| No N (%) | Yes N (%) | Odds Ratio (95% CI) | |||
| Age (years) | <0.0001 | ||||
| ≤70 | 188,430 (67.0) | 15,176 (42.7) | 1 | - | |
| >70 | 92,881 (33.0) | 20,339 (57.3) | 2.328 (2.266–2.391) | <0.0001 | |
| Sex | |||||
| Male | 153,455 (54.5) | 18,488 (52.1) | 1 | - | |
| Female | 127,856 (45.5) | 17,027 (47.9) | 1.164 (1.138–1.191) | <0.001 | |
| Race | <0.0001 | ||||
| White | 235,976 (83.9) | 30,460 (85.8) | 1 | - | |
| Black | 33,085 (11.8) | 3691 (10.4) | 0.897 (0.862–0.933) | <0.001 | |
| Asian | 6496 (2.3) | 657 (1.8) | 0.808 (0.742–0.880) | <0.001 | |
| Others | 5754 (2.0) | 707 (2.0) | 1.048 (0.965–1.137) | 0.263 | |
| Ethnicity | <0.001 | ||||
| Non-Hispanic | 256,834 (91.3) | 32,449 (91.4) | 1 | - | |
| Hispanic | 8431 (3.0) | 892 (2.5) | 0.805 (0.748–0.866) | <0.001 | |
| Others | 16,046 (5.7) | 2174 (6.1) | 1.114 (1.061–1.170) | <0.001 | |
| Years of Diagnosis | <0.001 | ||||
| 2004–2007 | 64,954 (23.1) | 6985 (19.7) | 1 | - | |
| 2008–2011 | 89,065 (31.7) | 10,698 (30.1) | 1.112 (1.076–1.149) | <0.001 | |
| 2012–2015 | 102,595 (36.5) | 14,219 (40.0) | 1.291 (1.251–1.333) | <0.001 | |
| 2016–2017 | 24,697 (8.8) | 3613 (10.2) | 1.350 (1.291–1.412) | <0.001 | |
| Median Income | <0.001 | ||||
| <$30,000 | 40,154 (14.3) | 5671 (16.0) | 1 | - | |
| $30,000–$34,999 | 52,940 (18.8) | 7349 (20.7) | 0.934 (0.897–0.973) | 0.001 | |
| $35,000–$45,999 | 80,814 (28.7) | 10,538 (29.7) | 0.874 (0.837–0.912) | <0.001 | |
| ≥$46,000 | 107,403 (38.2) | 11,957 (33.7) | 0.781 (0.744–0.820) | <0.001 | |
| Education | <0.001 | ||||
| 29% or more | 49,226 (17.5) | 6514 (18.3) | 1 | - | |
| 20–28.9% | 70,074 (24.9) | 9251 (26.0) | 0.996 (0.959–1.035) | 0.839 | |
| 14–19.9% | 69,531 (24.7) | 8937 (25.2) | 0.958 (0.918–1.000) | 0.047 | |
| <14% | 92,480 (32.9) | 10,813 (30.4) | 0.906 (0.864–0.949) | <0.001 | |
| Insurance status | <0.0001 | ||||
| Uninsured | 11,255 (4.0) | 1442 (4.1) | 1 | - | |
| Private | 97,795 (34.8) | 6194 (17.4) | 0.455 (0.428–0.484) | <0.001 | |
| Medicaid | 21,499 (7.6) | 2574 (7.2) | 0.831 (0.775–0.890) | <0.001 | |
| Medicare | 142,635 (50.7) | 24,278 (68.4) | 0.718 (0.676–0.763) | <0.001 | |
| Other Government | 3466 (1.2) | 472 (1.3) | 0.816 (0.728–0.913) | <0.001 | |
| Unknown | 4661 (1.7) | 555 (1.6) | 0.759 (0.682–0.843) | <0.001 | |
| Facility type | <0.001 | ||||
| Community CP * | 31,448 (11.2) | 4397 (12.3) | 1 | - | |
| Comprehensive Community CP * | 122,998 (43.7) | 17,425 (49.1) | 1.084 (1.044–1.125) | <0.001 | |
| Academic CP * | 88,590 (31.5) | 8487 (23.9) | 0.837 (0.802–0.872) | <0.001 | |
| Integrated Network CP * | 38,275 (13.6) | 5206 (14.7) | 1.072 (1.025–1.122) | 0.002 | |
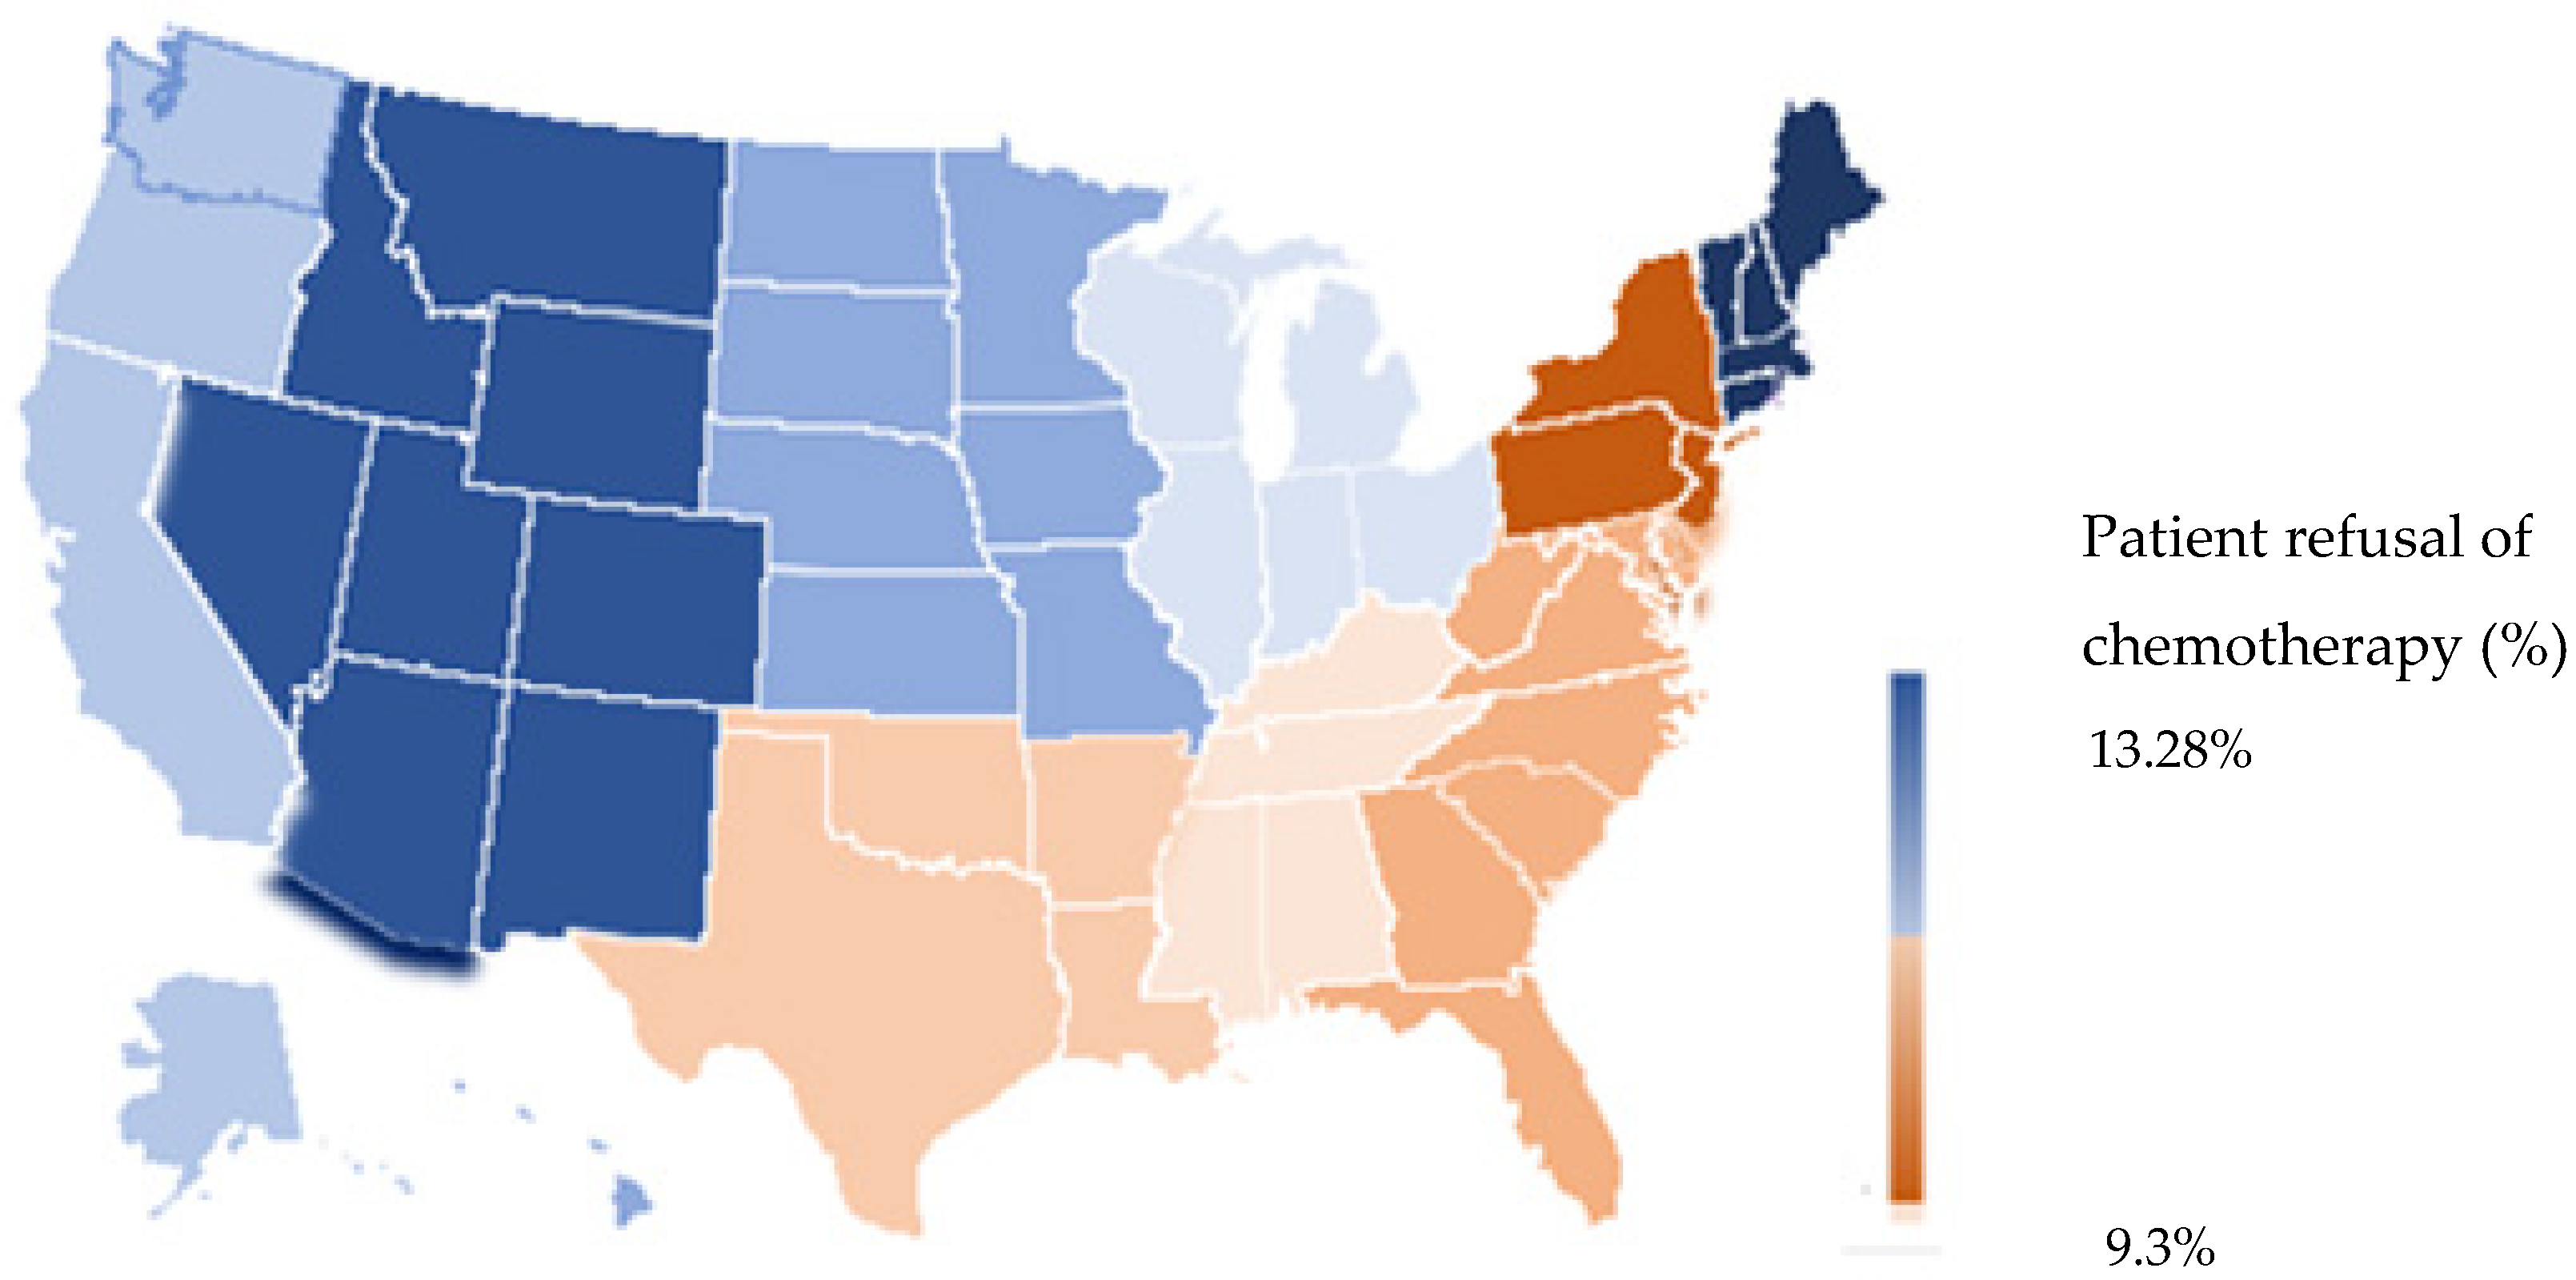
| Facility location | <0.0001 | <0.001 | |||
| New England | 16,611 (5.9) | 2545 (7.2) | 1 | - | |
| Middle Atlantic | 43,659 (15.5) | 4491 (12.6) | 0.693 (0.657–0.732) | <0.001 | |
| South Atlantic | 61,448 (21.8) | 7064 (19.9) | 0.702 (0.667–0.739) | <0.001 | |
| East North Central | 57,207 (20.3) | 7678 (21.6) | 0.834 (0.794–0.877) | <0.001 | |
| East South Central | 23,246 (8.3) | 2912 (8.2) | 0.711 (0.669–0.755) | <0.001 | |
| West North Central | 24,079 (8.6) | 3472 (9.8) | 0.910 (0.858–0.964) | <0.001 | |
| West South Central | 19,583 (7.0) | 2235 (6.3) | 0.706 (0.663–0.753) | <0.001 | |
| Mountain | 9197 (3.3) | 1336 (3.8) | 0.901 (0.837–0.970) | <0.001 | |
| Pacific | 26,281 (9.3) | 3782 (10.6) | 0.942 (0.890–0.997) | 0.008 | |
| Patient Residence | <0.001 | ||||
| Metro | 227,510 (80.9) | 28,106 (79.1) | 1 | - | |
| Urban | 42,018 (14.9) | 5825 (16.4) | 1.072 (1.032–1.115) | <0.001 | |
| Rural | 6022 (2.1) | 858 (2.4) | 1.067 (0.983–1.157) | 0.120 | |
| Unknown | 5761 (2.0) | 726 (2.0) | 0.939 (0.866–1.018) | 0.127 | |
| Distance (miles) | |||||
| <5 | 89,901 (32.0) | 13,233 (37.3) | 1 | - | |
| 5 < distance < 10 | 61,768 (22.0) | 7612 (21.4) | 0.900 (0.873–0.929) | <0.001 | |
| 10 < distance < 25 | 71,736 (25.5) | 8086 (22.8) | 0.845 (0.819–0.872) | <0.001 | |
| >25 | 57,906 (20.6) | 6584 (18.5) | 0.778 (0.748–0.809) | <0.001 | |
| Charlson/Deyo score | <0.0001 | ||||
| 0 | 186,858 (66.4) | 19,203 (54.1) | 1 | - | |
| 1 | 66,112 (23.5) | 10,169 (28.6) | 1.369 (1.334–1.406) | <0.001 | |
| 2 | 20,258 (7.2) | 4095 (11.5) | 1.677 (1.615–1.741) | <0.001 | |
| >3 | 8083 (2.9) | 2048 (5.8) | 2.046 (1.942–2.156) | <0.001 | |
| Histology | <0.001 | ||||
| Squamous | 50,129 (17.8) | 8026 (22.6) | 1 | - | |
| Adenocarcinoma | 162,924 (57.9) | 18,723 (52.7) | 0.778 (0.755–0.801) | <0.001 | |
| NOS | 68,258 (24.3) | 8766 (24.7) | 0.899 (0.869–0.931) | <0.001 | |
| Grade | <0.001 | ||||
| Well-differentiated | 6793 (2.4) | 789 (2.2) | 1 | - | |
| Moderately differentiated | 29,514 (10.5) | 3530 (9.9) | 1.036 (0.953–1.126) | 0.406 | |
| Poorly differentiated | 77,956 (27.7) | 9190 (25.9) | 1.085 (1.002–1.174) | 0.044 | |
| Undifferentiated | 4503 (1.6) | 532 (1.5) | 1.068 (0.947–1.205) | 0.282 | |
| Unknown | 162,545 (57.8) | 21,474 (60.5) | 1.232 (1.141–1.331) | <0.001 | |
| Hazard Ratio (95% CI) | p-Value | |
|---|---|---|
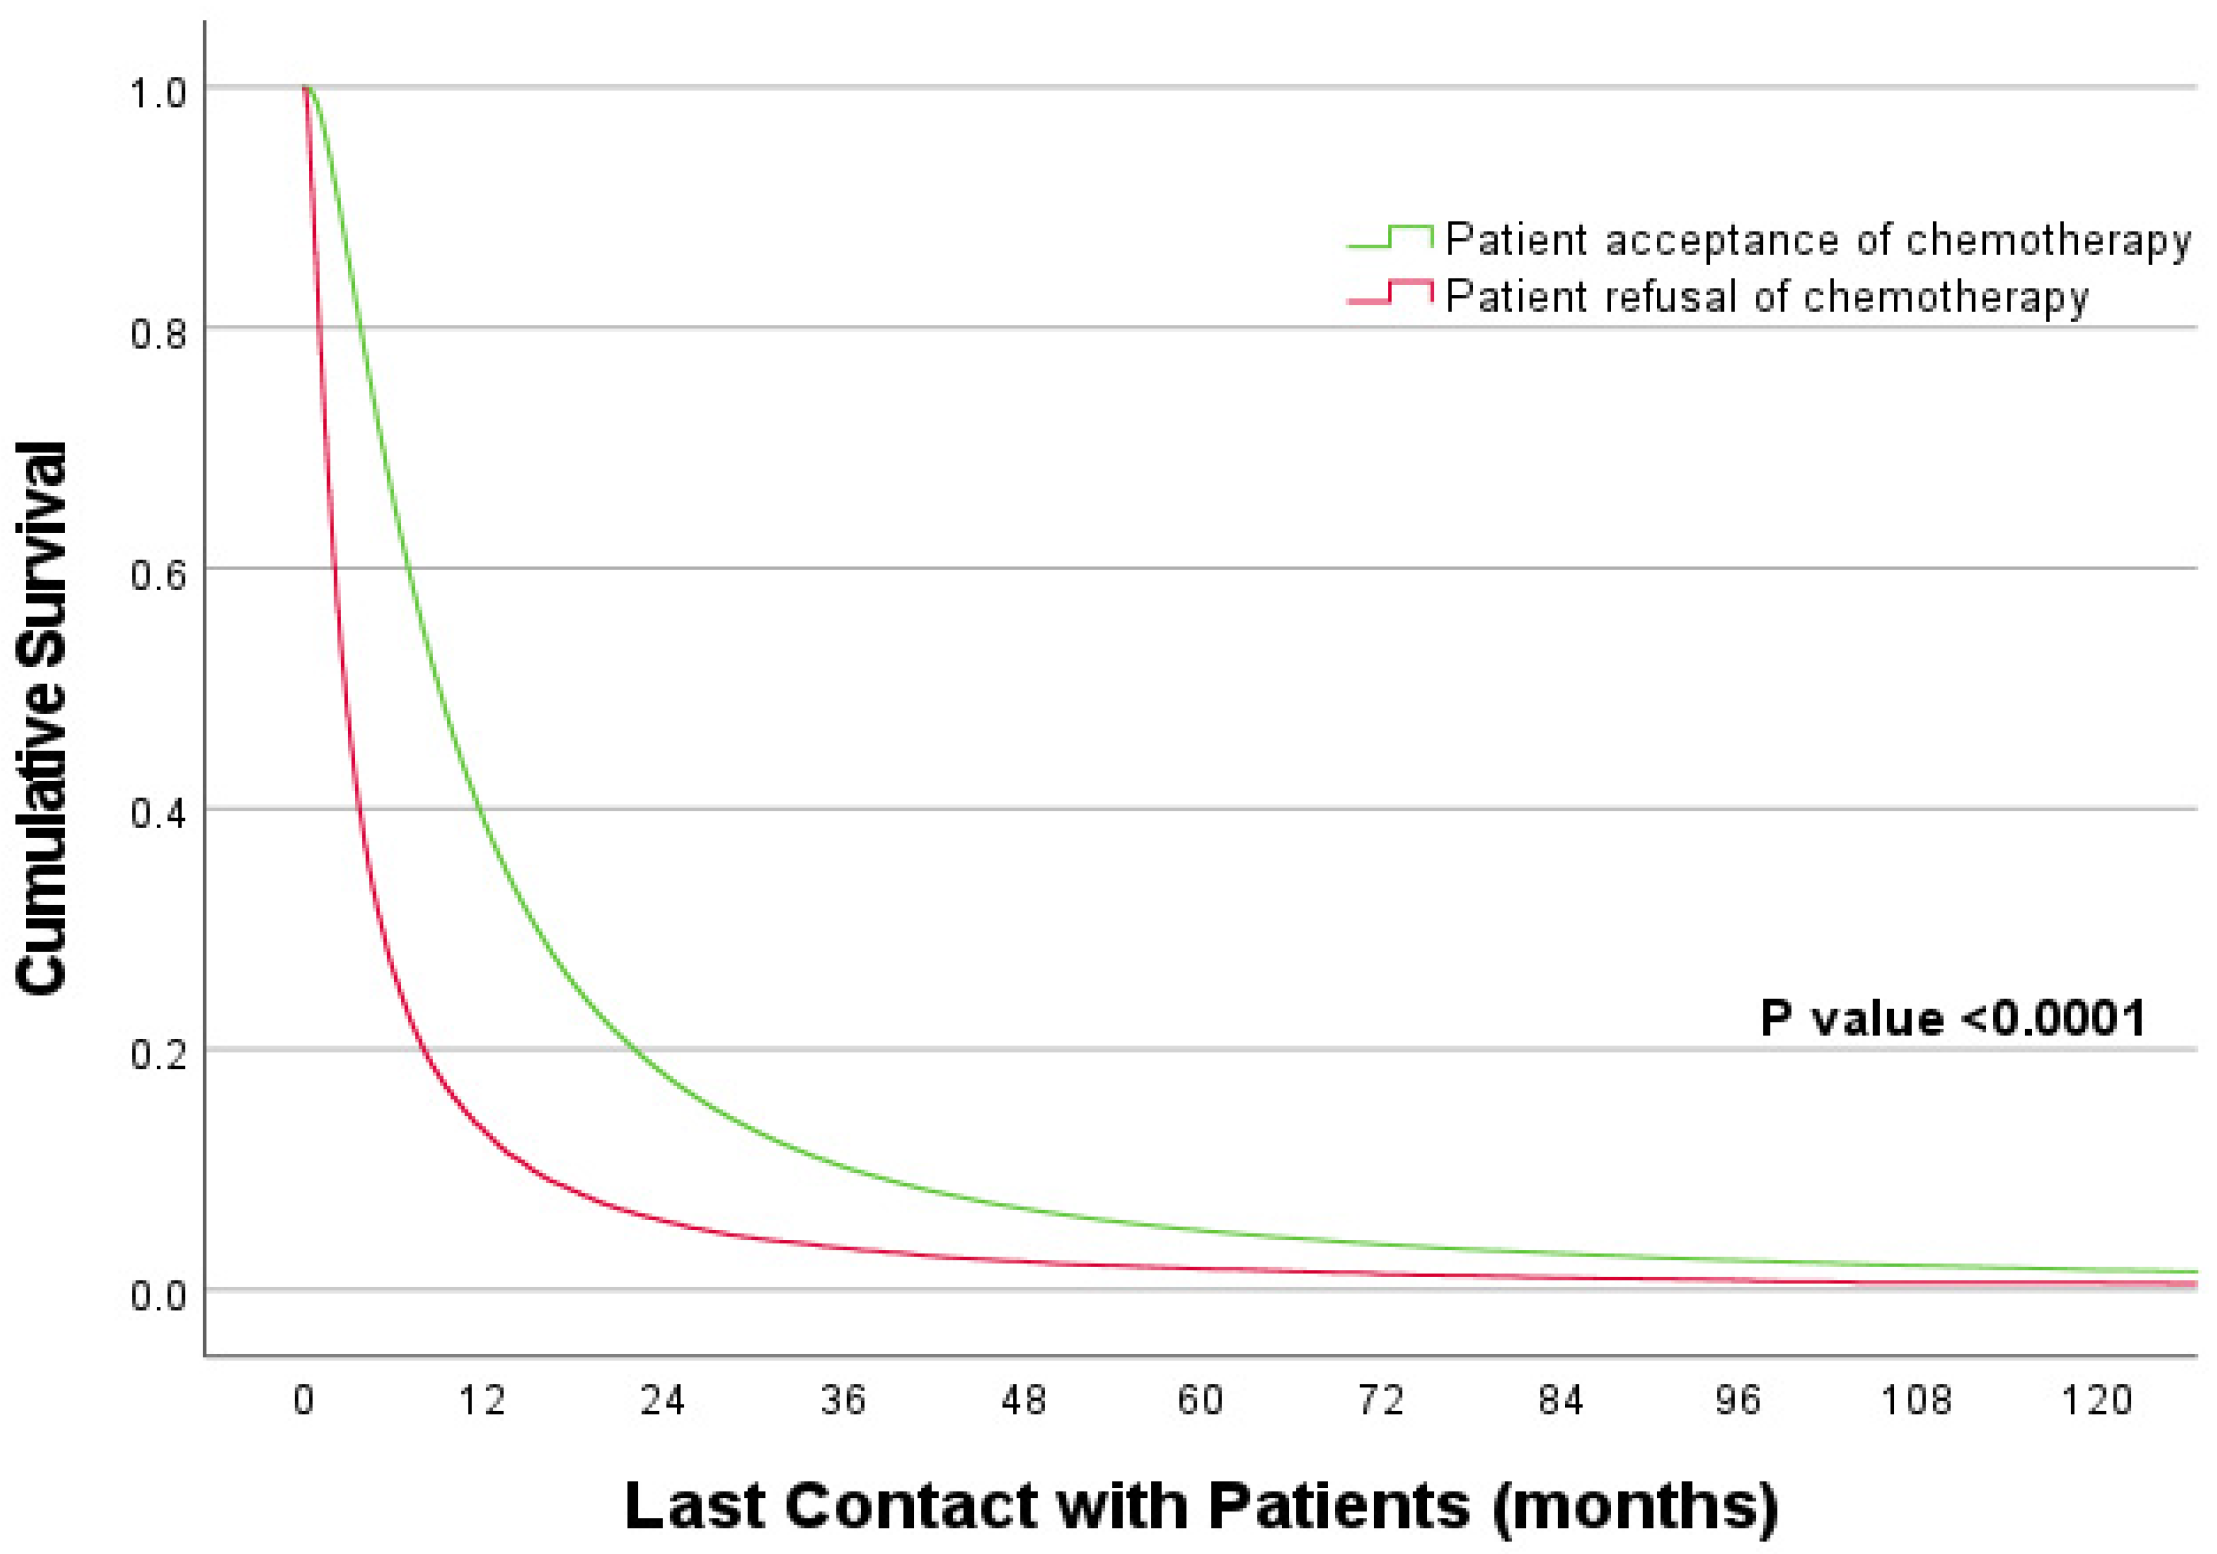
| Patient’s decision on recommended chemotherapy | ||
| Acceptance of treatment | 1 | - |
| Refusal of treatment | 2.312 (2.284–2.341) | <0.0001 |
| Age (years) | ||
| ≤70 | 1 | - |
| >70 | 1.081 (1.071–1.092) | <0.001 |
| Race | ||
| White | 1 | <0.001 |
| Black | 0.922 (0.910–0.934) | <0.001 |
| Asian | 0.725 (0.705–0.746) | <0.001 |
| Others | 0.854 (0.830–0.879) | <0.001 |
| Ethnicity | ||
| Non-Hispanic | 1 | - |
| Hispanic | 0.828 (0.808–0.849) | <0.001 |
| Others | 1.043 (1.027–1.060) | <0.001 |
| Years of Diagnosis | ||
| 2004–2007 | 1 | - |
| 2008–2011 | 0.945 (0.936–0.955) | <0.001 |
| 2012–2015 | 0.862 (0.853–0.870) | <0.001 |
| Median Income | ||
| <$30,000 | 1 | - |
| $30,000–$34,999 | 0.977 (0.963–0.991) | 0.001 |
| $35,000–$45,999 | 0.965 (0.951–0.979) | <0.001 |
| ≥$46,000 | 0.968 (0.952–0.983) | <0.001 |
| Education | ||
| 29% or more | 1 | - |
| 20–28.9% | 1.010 (0.997–1.022) | 0.133 |
| 14–19.9% | 0.998 (0.984–1.012) | 0.777 |
| <14% | 0.972 (0.957–0.988) | <0.001 |
| Insurance status | ||
| Uninsured | 1 | - |
| Private insurance | 0.867 (0.849–0.884) | <0.001 |
| Medicaid | 0.968 (0.945–0.991) | <0.001 |
| Medicare | 0.943 (0.924–0.963) | <0.001 |
| Other Government | 0.937 (0.900–0.975) | 0.001 |
| Unknown | 0.982 (0.948–1.017) | 0.302 |
| Facility type | ||
| Community CP * | 1 | - |
| Comprehensive Community CP * | 0.987 (0.975–1.000) | 0.055 |
| Academic CP * | 0.884 (0.872–0.897) | <0.001 |
| Integrated Network CP * | 0.968 (0.953–0.983) | <0.001 |
| Facility location | ||
| New England | 1 | - |
| Middle Atlantic | 0.937 (0.920–0.955) | <0.001 |
| South Atlantic | 1.013 (0.995–1.031) | 0.163 |
| East North Central | 1.024 (1.006–1.043) | 0.010 |
| East South Central | 1.037 (1.016–1.060) | <0.001 |
| West North Central | 1.070 (1.048–1.093) | <0.001 |
| West South Central | 0.963 (0.942–0.985) | 0.001 |
| Mountain | 0.978 (0.952–1.004) | 0.103 |
| Pacific | 1.004 (0.984–1.024) | 0.715 |
| Patient Residence | ||
| Metro | 1 | |
| Urban | 1.030 (1.017–1.044) | <0.001 |
| Rural | 1.029 (1.00–1.058) | 0.051 |
| Unknown | 1.013 (0.986–1.042) | 0.346 |
| Distance (miles) | ||
| <5 | 1 | - |
| 5 < distance < 10 | 0.995 (0.984–1.005) | 0.326 |
| 10 < distance < 25 | 0.977 (0.967–0.988) | <0.001 |
| >25 | 0.925 (0.913–0.937) | <0.001 |
| Other | 1.024 (0.627–1.672) | 0.925 |
| Charlson/Deyo score | ||
| 0 | 1 | - |
| 1 | 1.136 (1.125–1.146) | <0.001 |
| 2 | 1.223 (1.205–1.241) | <0.001 |
| >3 | 1.343 (1.313–1.374) | <0.001 |
| Histology | ||
| Squamous | 1 | - |
| Adenocarcinoma | 0.912 (0.903–0.922) | <0.001 |
| NOS | 1.060 (1.048–1.073) | <0.001 |
| Grade | ||
| Well-differentiated | 1 | - |
| Moderately differentiated | 1.195 (1.162–1.229) | <0.001 |
| Poorly differentiated | 1.485 (1.446–1.525) | <0.001 |
| Undifferentiated | 1.538 (1.479–1.600) | <0.001 |
| Unknown | 1.414 (1.378–1.451) | <0.001 |
Disclaimer/Publisher’s Note: The statements, opinions and data contained in all publications are solely those of the individual author(s) and contributor(s) and not of MDPI and/or the editor(s). MDPI and/or the editor(s) disclaim responsibility for any injury to people or property resulting from any ideas, methods, instructions or products referred to in the content. |
© 2023 by the authors. Licensee MDPI, Basel, Switzerland. This article is an open access article distributed under the terms and conditions of the Creative Commons Attribution (CC BY) license (https://creativecommons.org/licenses/by/4.0/).
Share and Cite
Jabbal, I.S.; Sabbagh, S.; Itani, M.; Dominguez, B.; Mohanna, M.; Henry, V.; Liang, H.; Saravia, D.; George, T.; Nahleh, Z.; et al. Factors Associated with the Decision to Decline Chemotherapy in Metastatic Non-Small Cell Lung Cancer. Cancers 2023, 15, 1686. https://doi.org/10.3390/cancers15061686
Jabbal IS, Sabbagh S, Itani M, Dominguez B, Mohanna M, Henry V, Liang H, Saravia D, George T, Nahleh Z, et al. Factors Associated with the Decision to Decline Chemotherapy in Metastatic Non-Small Cell Lung Cancer. Cancers. 2023; 15(6):1686. https://doi.org/10.3390/cancers15061686
Chicago/Turabian StyleJabbal, Iktej Singh, Saad Sabbagh, Mira Itani, Barbara Dominguez, Mohamed Mohanna, Valencia Henry, Hong Liang, Diana Saravia, Tiffany George, Zeina Nahleh, and et al. 2023. "Factors Associated with the Decision to Decline Chemotherapy in Metastatic Non-Small Cell Lung Cancer" Cancers 15, no. 6: 1686. https://doi.org/10.3390/cancers15061686