Article

miRNA Expression Profiling in G1 and G2 Pancreatic Neuroendocrine Tumors

1
Department of Endocrinology, Faculty of Medicine, Semmelweis University, Korányi Str. 2/a, 1083 Budapest, Hungary
2
Department of Internal Medicine and Oncology, Faculty of Medicine, Semmelweis University, Korányi Str. 2/a, 1083 Budapest, Hungary
3
Department of Laboratory Medicine, Faculty of Medicine, Semmelweis University, Nagyvárad sq. 4., 1089 Budapest, Hungary
4
Dr. László Vass Health Center, Municipality of District XV, 1152 Budapest, Hungary
5
Division of Oncology, Department of Internal Medicine and Oncology, Semmelweis University, Baross Str. 23-25, 1082 Budapest, Hungary
6
Department of Pathology, Forensic and Insurance Medicine, Faculty of Medicine, Semmelweis University, Üllői Str. 93, 1083 Budapest, Hungary
7
Department of Pathology and Experimental Cancer Research, Faculty of Medicine, Semmelweis University, Üllői Str. 26, 1085 Budapest, Hungary
*
Author to whom correspondence should be addressed.
These authors contributed equally to this work.
Cancers 2024, 16(14), 2528; https://doi.org/10.3390/cancers16142528
Submission received: 22 June 2024 / Revised: 9 July 2024 / Accepted: 10 July 2024 / Published: 13 July 2024
(This article belongs to the Special Issue Neuroendocrine Tumors: From Diagnosis to Therapy)

Abstract

:

Simple Summary

Pancreatic neuroendocrine tumors are rare, but their incidence is rising. Several grades exist, and distinguishing between these is pivotal for clinical management. Currently, the grades can only be differentiated by histological analysis requiring invasive sampling. MicroRNAs are short non-protein coding RNA molecules that were shown to be differentially expressed in a wide variety of tumors. Here, we examined whether microRNAs could be exploited to differentiate grade 1 and 2 pancreatic neuroendocrine tumors and established significantly differentially expressed microRNAs.

Abstract

Pancreatic neuroendocrine neoplasms pose a growing clinical challenge due to their rising incidence and variable prognosis. The current study aims to investigate microRNAs (miRNA; miR) as potential biomarkers for distinguishing between grade 1 (G1) and grade 2 (G2) pancreatic neuroendocrine tumors (PanNET). A total of 33 formalin-fixed, paraffin-embedded samples were analyzed, comprising 17 G1 and 16 G2 tumors. Initially, literature-based miRNAs were validated via real-time quantitative reverse transcription polymerase chain reaction (RT-qPCR), confirming significant downregulation of miR-130b-3p and miR-106b in G2 samples. Through next-generation sequencing, we have identified and selected the top six miRNAs showing the highest difference between G1 and G2 tumors, which were further validated. RT-qPCR validation confirmed the downregulation of miR-30d-5p in G2 tumors. miRNA combinations were created to distinguish between the two PanNET grades. The highest diagnostic performance in distinguishing between G1 and G2 PanNETs by a machine learning algorithm was achieved when using the combination miR-106b + miR-130b-3p + miR-127-3p + miR-129-5p + miR-30d-5p. The ROC analysis resulted in a sensitivity of 83.33% and a specificity of 87.5%. The findings underscore the potential use of miRNAs as biomarkers for stratifying PanNET grades, though further research is warranted to enhance diagnostic accuracy and clinical utility.

1. Introduction

Pancreatic neuroendocrine neoplasms (PanNENs) are among the most common neuroendocrine tumors and have shown an increasing incidence over the previous decades [1,2]. According to the most recent World Health Organization (WHO, 2022) classification system, pancreatic neuroendocrine tumors (PanNETs) and pancreatic neuroendocrine carcinomas (PanNECs) belong to the group of PanNENs. Well-differentiated PanNETs are grouped into grades 1 to 3 based on the Ki-67 index (<3%, 3–20%, and >20%, respectively), whereas poorly differentiated tumors are categorized as PanNECs [3]. PanNETs comprise functioning or hormonally active tumors, among others such as insulinoma, gastrinoma, glucagonoma, somatostatinoma, vasoactive intestinal peptide-secreting tumors (VIPomas), ACTH-producing tumors, and non-functioning, hormonally inactive tumors [4]. Hormone-producing tumors are associated with typical syndromes, whereas hormonally inactive tumors are often discovered incidentally.
Histologically, the differentiation between low/intermediate grade PanNETs (G1 and G2) and PanNECs is not specifically challenging, while distinguishing high-grade PanNETs (G3) from PanNECs can be rather difficult [5]. The differentiation of grade 1 from grade 2 PanNETs is also relevant. G1 tumors have a more favorable prognosis, with an approximately double median overall survival compared to G2 tumors [6]. Treatment strategies for G1 and G2 PanNETs are similar, but G2 tumors often require more aggressive treatment. However, the choice of treatment is influenced by the disease extent rather than by grade [7,8]. The primary treatment for non-metastatic tumors is usually surgical. Treatment options for differentiated metastatic PanNETs include somatostatin analogues, the mTOR inhibitor everolimus, the multikinase inhibitor sunitinib, peptide receptor radionuclide treatment, systemic chemotherapy, etc. [7,8,9]. Gallstone formation represents a potential long-term side effect of somatostatin analogue treatment [10] that could warrant cholecystectomy [11]. Moreover, the grade can change during the progression of the disease [12]. G1 and G2 PanNETs are distinguished histologically, requiring invasive sampling. There is no other reliable, accurate, minimally or non-invasive biomarker that could help in the differentiation, but such a biomarker would be clinically relevant.
Mature microRNAs (miRNA, miR) are small, non-coding, single-stranded RNA molecules, typically ranging from 19 to 25 nucleotides in length. They play a key role in regulating gene expression, primarily operating at the posttranscriptional level. MicroRNAs have tissue-specific expression and are secreted in body fluids as well [13]. Numerous studies have demonstrated the utility of miRNAs as valuable biomarkers across various diseases, encompassing a range of neoplastic conditions. As miRNAs can be found in the blood as well, they might be used as minimally invasive biomarkers. Recently, hsa-miR-21, hsa-miR-10a, and hsa-miR-106b were found to be upregulated in more proliferative PanNENs (G2 and G3) compared to grade 1 tumors by studying formalin-fixed, paraffin-embedded (FFPE) samples [14]. miR-96-5p and miR-130b-3p showed significantly lower expression in G1 compared to G2 to G3 gastroenteropancreatic NETs (GEP-NETs), and miR-194-5p showed a significant decrease through grades of GEP-NETs [15]. miR-30d-5p, miR-451a, and let-7i-5p showed decreasing trends of expression from G1 to G2 and G3 samples in a small cohort [16]. Significantly higher expression of circulating miRNA levels was also identified in PanNEN samples compared to healthy control samples (serum miR-193b) or chronic pancreatitis (miR-21) [17,18]. Significantly lower levels of serum miR-1290, miR-584, miR-1285, miR-1825, and miR-550-002410 were found in PanNET samples compared to pancreatic adenocarcinomas [19]. To the best of our knowledge, there have only been three articles describing miRNAs that can differentiate between G1 and G2 (or G3) PanNETs so far [14,15,16]. In other tumors, miRNA combinations have been found to be superior to individual miRNAs in differentiating between different tumor types [20].
Our aim was to investigate the expression of tissue miRNAs in G1 and G2 PanNETs. We have studied certain miRNAs described in the literature previously, but also performed miRNA profiling to identify novel miRNAs.

2. Materials and Methods

2.1. Tissue Collection

A total of 33 histologically confirmed formalin-fixed, paraffin-embedded (FFPE) samples were utilized, all sourced from human tumor blocks (Table 1). Specifically, 17 grade 1 (G1) and 16 grade 2 (G2) PanNET samples were procured from the Pathology Departments of Semmelweis University, Budapest, Hungary. To ascertain tumor grade and identify the Region of Interest within the block, which contained “pure” tumor tissue of the specified grade, hematoxylin–eosin slides were prepared, marked, and assessed by expert pathologists. For RNA isolation, 4 × 20 µm micro-dissected sections were prepared and placed into RNase-free tubes. All procedures were conducted in compliance with the applicable guidelines and regulations (Ethical permission by the Hungarian Health Council IV-2388/1/2022/EKU).

2.2. Sample Processing and RNA Isolation

For the extraction of total RNA, encompassing miRNAs, the RecoverAll™ Total Nucleic Acid Isolation Kit for FFPE (Thermo Fisher Scientific, Waltham, MA, USA) was employed. Following deparaffinization using xylene isomers, the samples underwent digestion and purification as per the manufacturer’s instructions. As a spike-in control for purification efficiency and for external control in the real-time quantitative reverse transcription polymerase chain reaction (RT-qPCR) process, 2 μL of 5 nM Syn-cel-miR-39 was added. The obtained total RNA was stored at −80 °C until further processing. RNA concentration was determined using the Qubit 4 Fluorimeter with the Qubit RNA Broad Range RNA Assay Kit (Thermo Fisher Scientific).

2.3. Real-Time Quantitative Reverse Transcription Polymerase Chain Reaction (RT-qPCR) for Quantification and NGS Validation

Initially, each miRNA was reverse-transcribed into cDNA individually using miRNA-specific primers (TaqMan miRNA assays; Thermo Fisher Scientific) in a ProFlex™ PCR machine (Thermo Fisher Scientific). Each RT sample included 10 ng of RNA as starting material. Subsequently, 1 µL of the synthesized cDNA was subjected to qPCR using miRNA-specific fluorescently labeled hydrolysis probes (TaqMan probes, Thermo Fisher Scientific). The Quantstudio 7 Flex Real-Time PCR System (Thermo Fisher Scientific) was used with a 96-well fast block, and Ct values were determined for each target. Relative quantification of miRNAs was performed utilizing RNU 48 (ID: 001006) as an internal control target and cel-miR-39 (ID: 000200) as an external control target, employing the ΔΔCt method as described by Livak and Schmittgen [21]. The internal and external control was unified into one measure by calculating the geometric mean of the two values. Specific primers for miRNAs selected based on literature research were [miR-130b-3p (ID: 000456); miR-194-5p (ID: 000493); miR-106b (ID: 000442); and miR-96-5p (ID: 000186)] and those identified via NGS were [miR-127-3p (ID: 000452); miR-129-5p (ID: 000590); miR-769-5p (ID: 001998), miR-671-5p (ID: 197646_mat); miR-375-3p (ID: 000564); and miR-30d-5p (ID: 000420)].

2.4. miRNA Expression Profiling from FFPE Samples by Next-Generation Sequencing (NGS)

For library preparation, 100 ng of total RNA served as the initial material, using the QIAseq miRNA Seq Kit (Qiagen GmbH, Hilden, Germany). Sequentially, adapters were ligated to both the 3′ and 5′ ends of miRNAs, followed by reverse transcription to create cDNA. The cDNA product was purified using magnetic bead separation. In the subsequent library amplification stage, cDNA was labeled with dual molecular indexes, each containing a unique sequence for individual samples. Following library amplification, further purification by magnetic beads was conducted. Each sample was then diluted to a concentration of 4 nM and equimolarly combined into a pooled cDNA library at a concentration of 4 nM. After chemically denaturing 5 µL of the pooled library and diluting it to 10 pM, sequencing was performed using the MiSeq v3 150 cycles sequencing kit on a MiSeq NGS sequencer (Illumina, San Diego, CA, USA). The acquired sequence data underwent demultiplexing and fastq files were analyzed using the Qiagen GeneGlobe system (QIAGEN RNA-seq Analysis Portal 5.0, (website: rnaportal.qiagen.com)). This software platform facilitates miRNA annotation, count determination, and gene expression analysis.

2.5. Statistical– and Machine Learning Analysis

GraphPad Prism version 6.01 (GraphPad Software, La Jolla, CA, USA) and R for Windows version 4.4.0 environment (R Core Team, 2024, R Foundation for Statistical Computing, Vienna, Austria) were used in the analysis of RT-qPCR data. As most of the RT-qPCR data were significantly skewed, outlier removal was performed prior to any statistical analysis. All the data that were over the upper quartile + 1.5 × interquartile range or were under the lower quartile − 1.5 × interquartile range were marked as NA. For differentiating between G1 and G2 PanNET groups, Welch’s t-test was used. p-Values of < 0.05 were considered significant. A 90–10% learner–tester cross-validation simulation with 100,000 iterations was run to differentiate G1 and G2 tumors utilizing a single hidden-layer neural network model (R package nnet, version 7.3-19). Each miRNA’s differentiation potential was tested as a standalone marker, as well as the potential of their combinations. The combination models included up to 6 miRNAs out of the 10 available, resulting in a total of 847 possible combinations to investigate. Following the simulation procedure, the original and predicted groups were compared, and the number of true negatives (TN), true positives (TP), false negatives (FN), and false positives (FP) were determined. As the last step, sensitivities (Se) and specificities (Sp) of the neural network models were calculated using the Se = TP/(TP + FN) and the Sp = TN/(TN + FP) equations, respectively. The best-performing model was selected for receiver operating characteristic (ROC) curve modeling, which was performed using the R package pROC (version 1.18.5).

3. Results

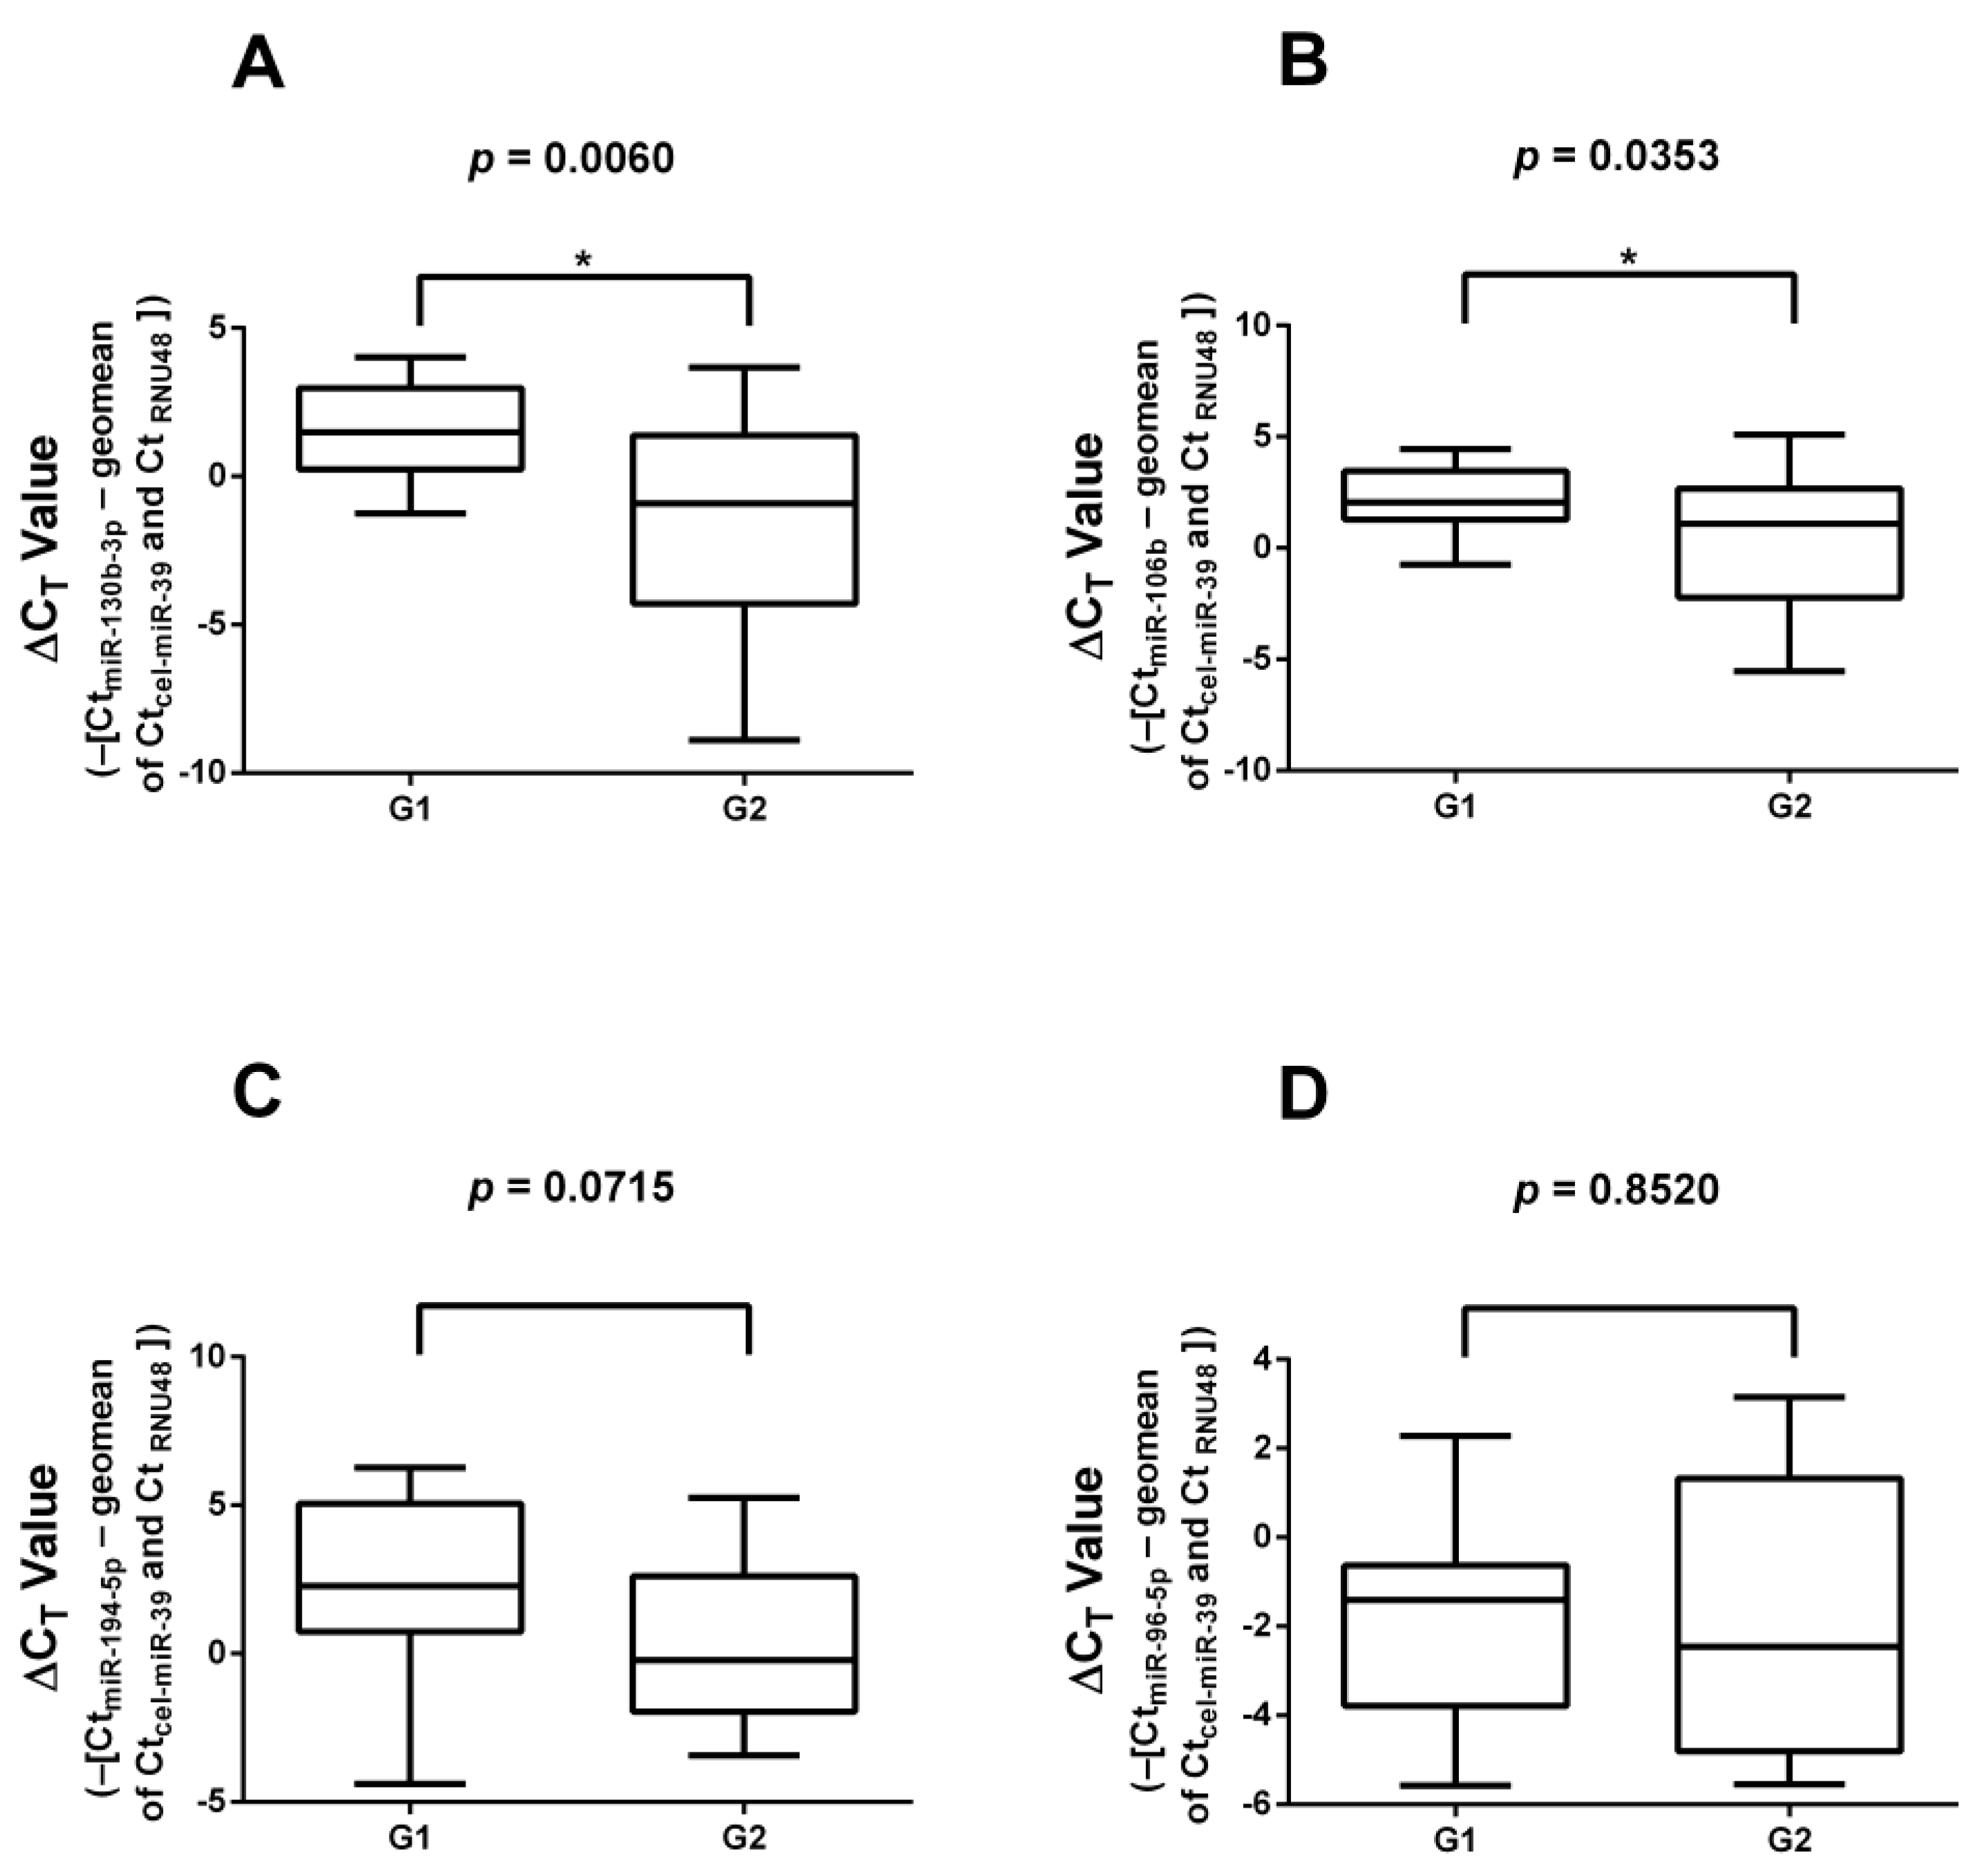
3.1. Real-Time Quantitative Reverse Transcription Polymerase Chain Reaction (RT-qPCR) Validation of miRNAs Found in Literature

Thirty-three FFPE samples (17 G1 and 16 G2) were subjected to RT-qPCR validation. The results of the validation of significantly differently expressed miRNAs found in the literature are presented in Figure 1. miR-130b-3p and miR-106b showed significantly lower expression in G2 samples compared to G1 tumors, while miR-194-5p and miR-96-5p showed no significant differences in expression between the two groups. No changes in the results were found when the insulinoma cases were removed.

3.2. miRNA Expression Profiling by Next-Generation Sequencing

Altogether, five G1 and five G2 FFPE samples were subjected to NGS profiling. miRNAs are listed in Table S1. From the sequenced miRNAs, we selected the six miRNAs showing the greatest difference between G1 and G2 samples (miR-127-3p, miR-129-5p, miR-769-5p, miR-671-5p, miR-375-3p, and miR-30d-5p). NGS data were uploaded to the openly accessible repository under the Gene Expression Omnibus accession identification number GSE265752.

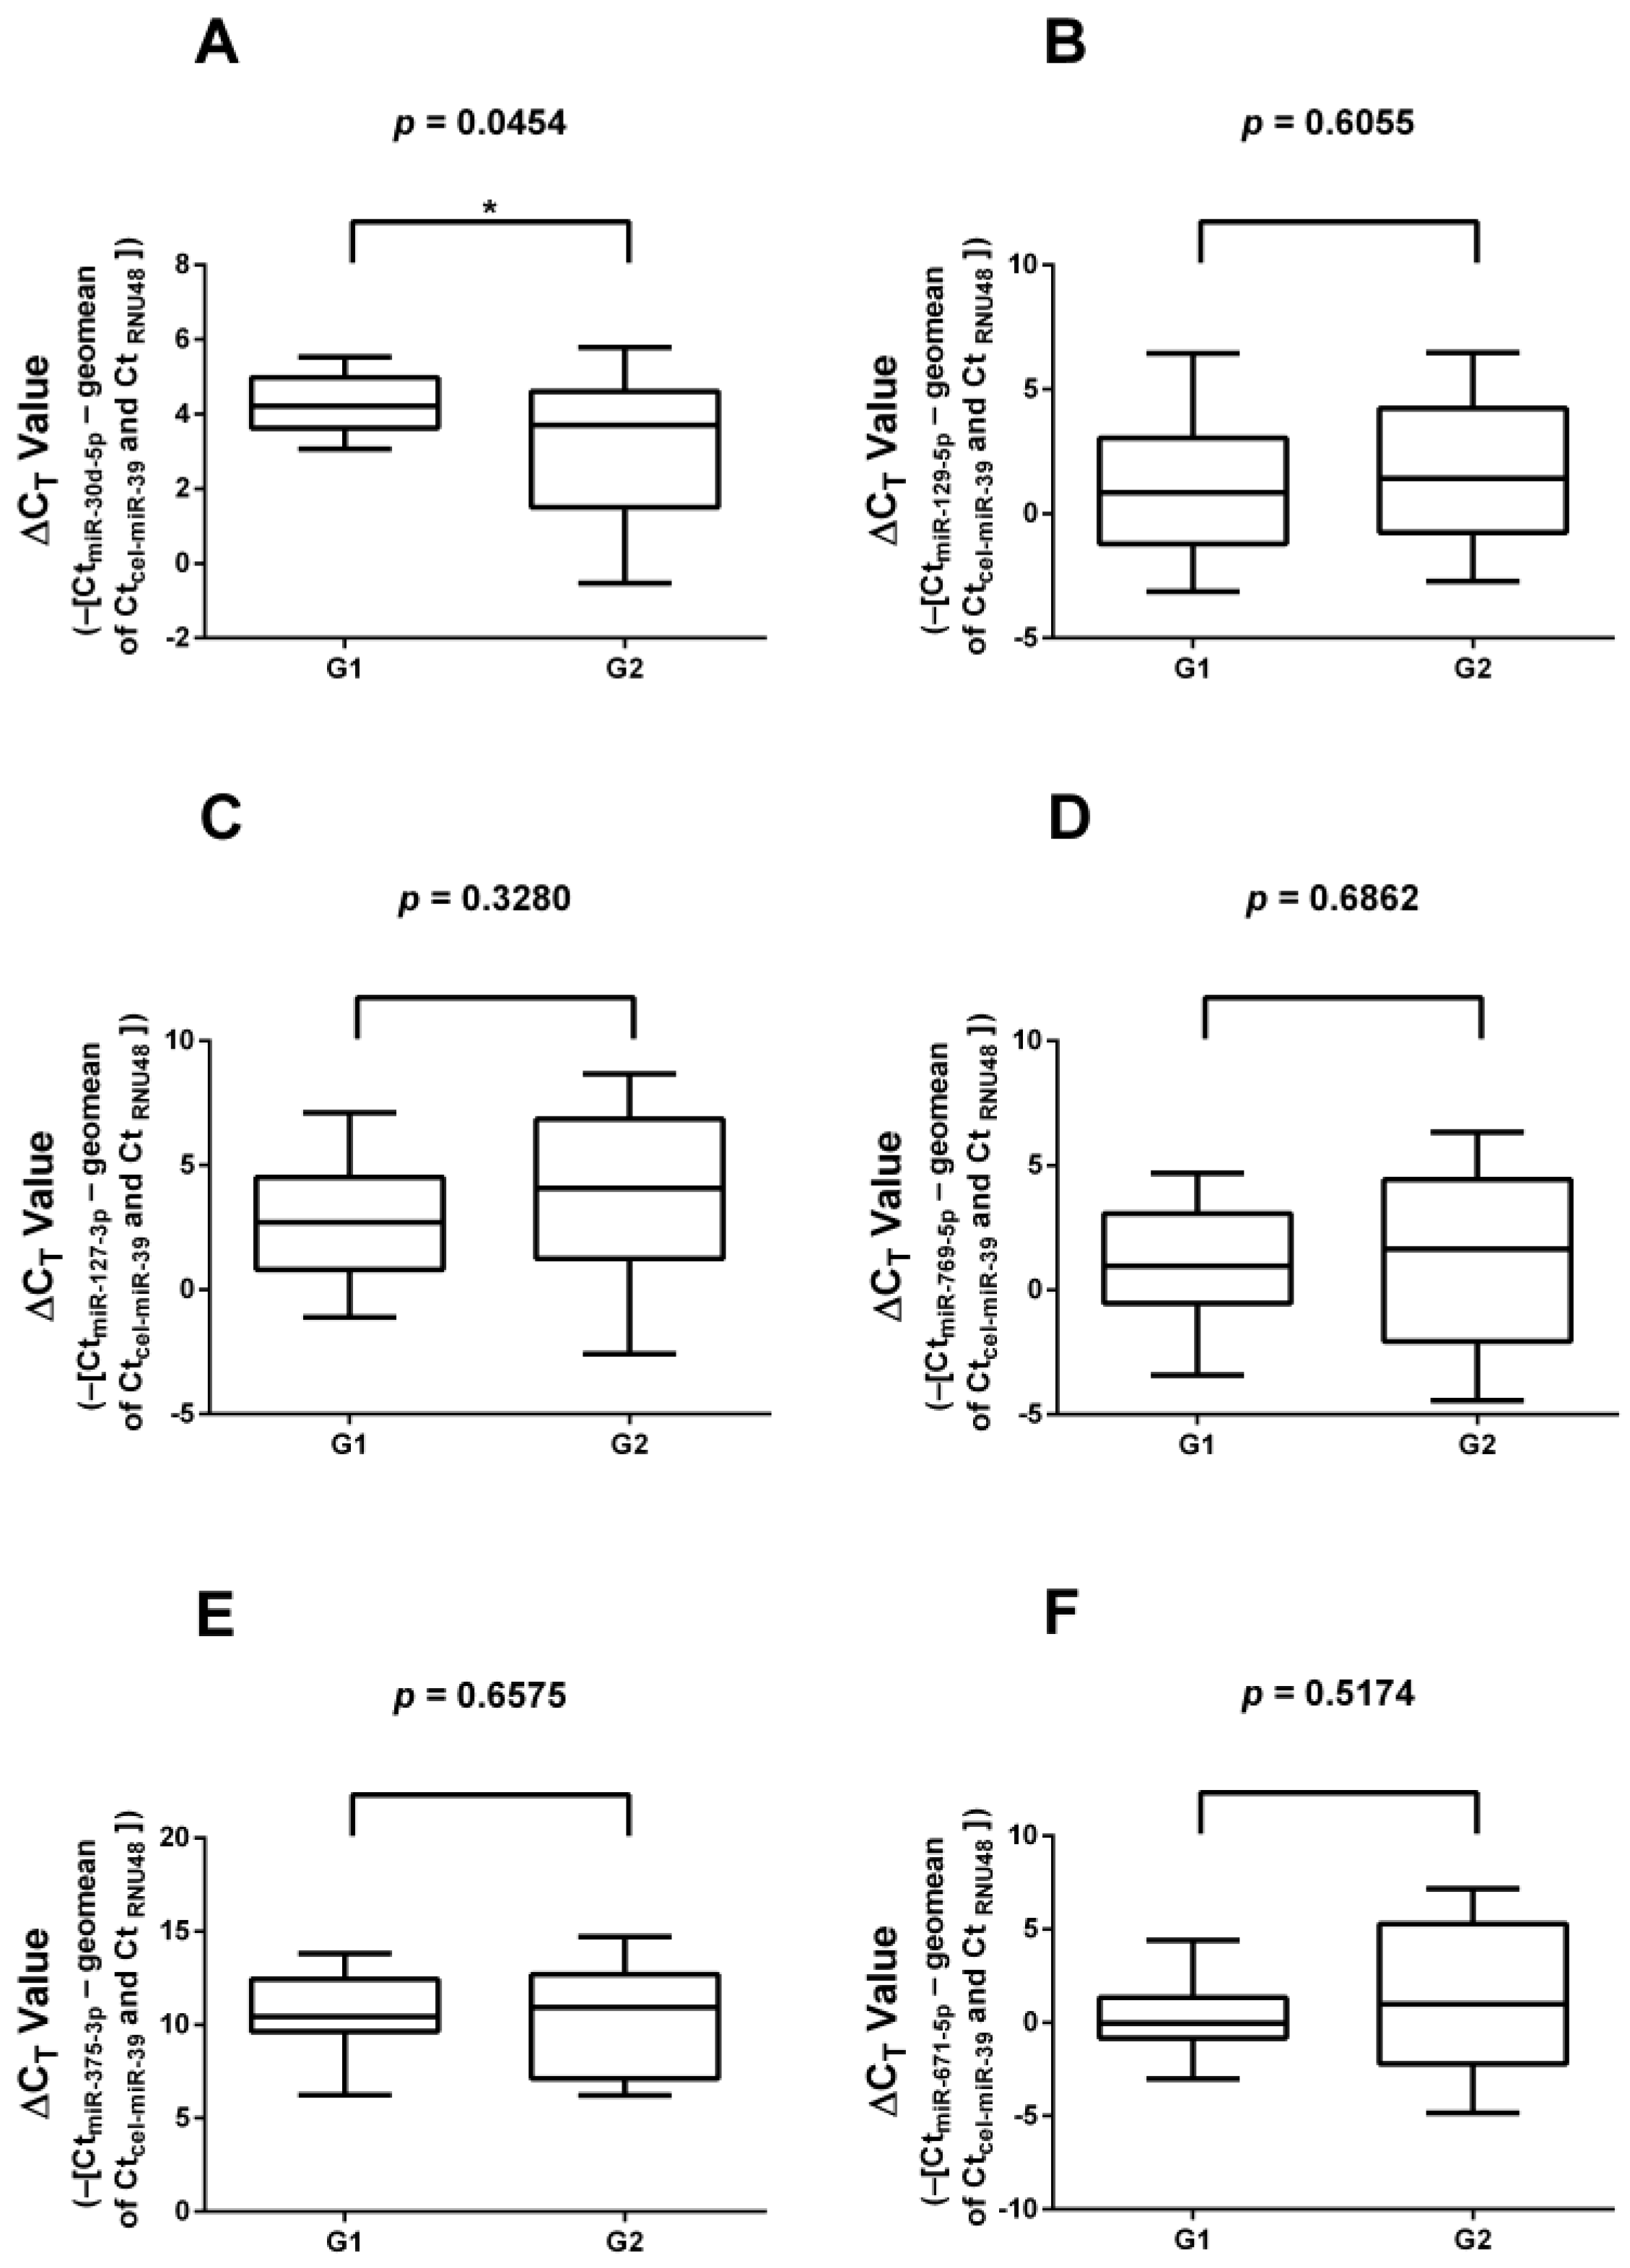
3.3. RT-qPCR Validation of Significantly Differentially Expressed miRNAs

The 6 differentially expressed miRNAs identified during NGS profiling were validated on all 33 G1 and G2 FFPE samples used for the validation of literature-based miRNAs (17 G1 and 16 G2 samples; Figure 2). Validation showed a significant downregulation of miR-30d-5p (p = 0.0454) in G2 samples relative to G1 samples. The other five selected miRNAs [miR-127-3p (p = 0.3280); miR-129-5p (p = 0.6055); miR-769-5p (p = 0.6862); miR-671-5p (p = 0.5174), and miR-375-3p (p = 0.6575)] displayed no difference in expression. When comparing insulinoma samples with non-insulinoma PanNET samples, no statistically different expression levels were found. Furthermore, no change in the results was found if all the insulinoma cases were removed.

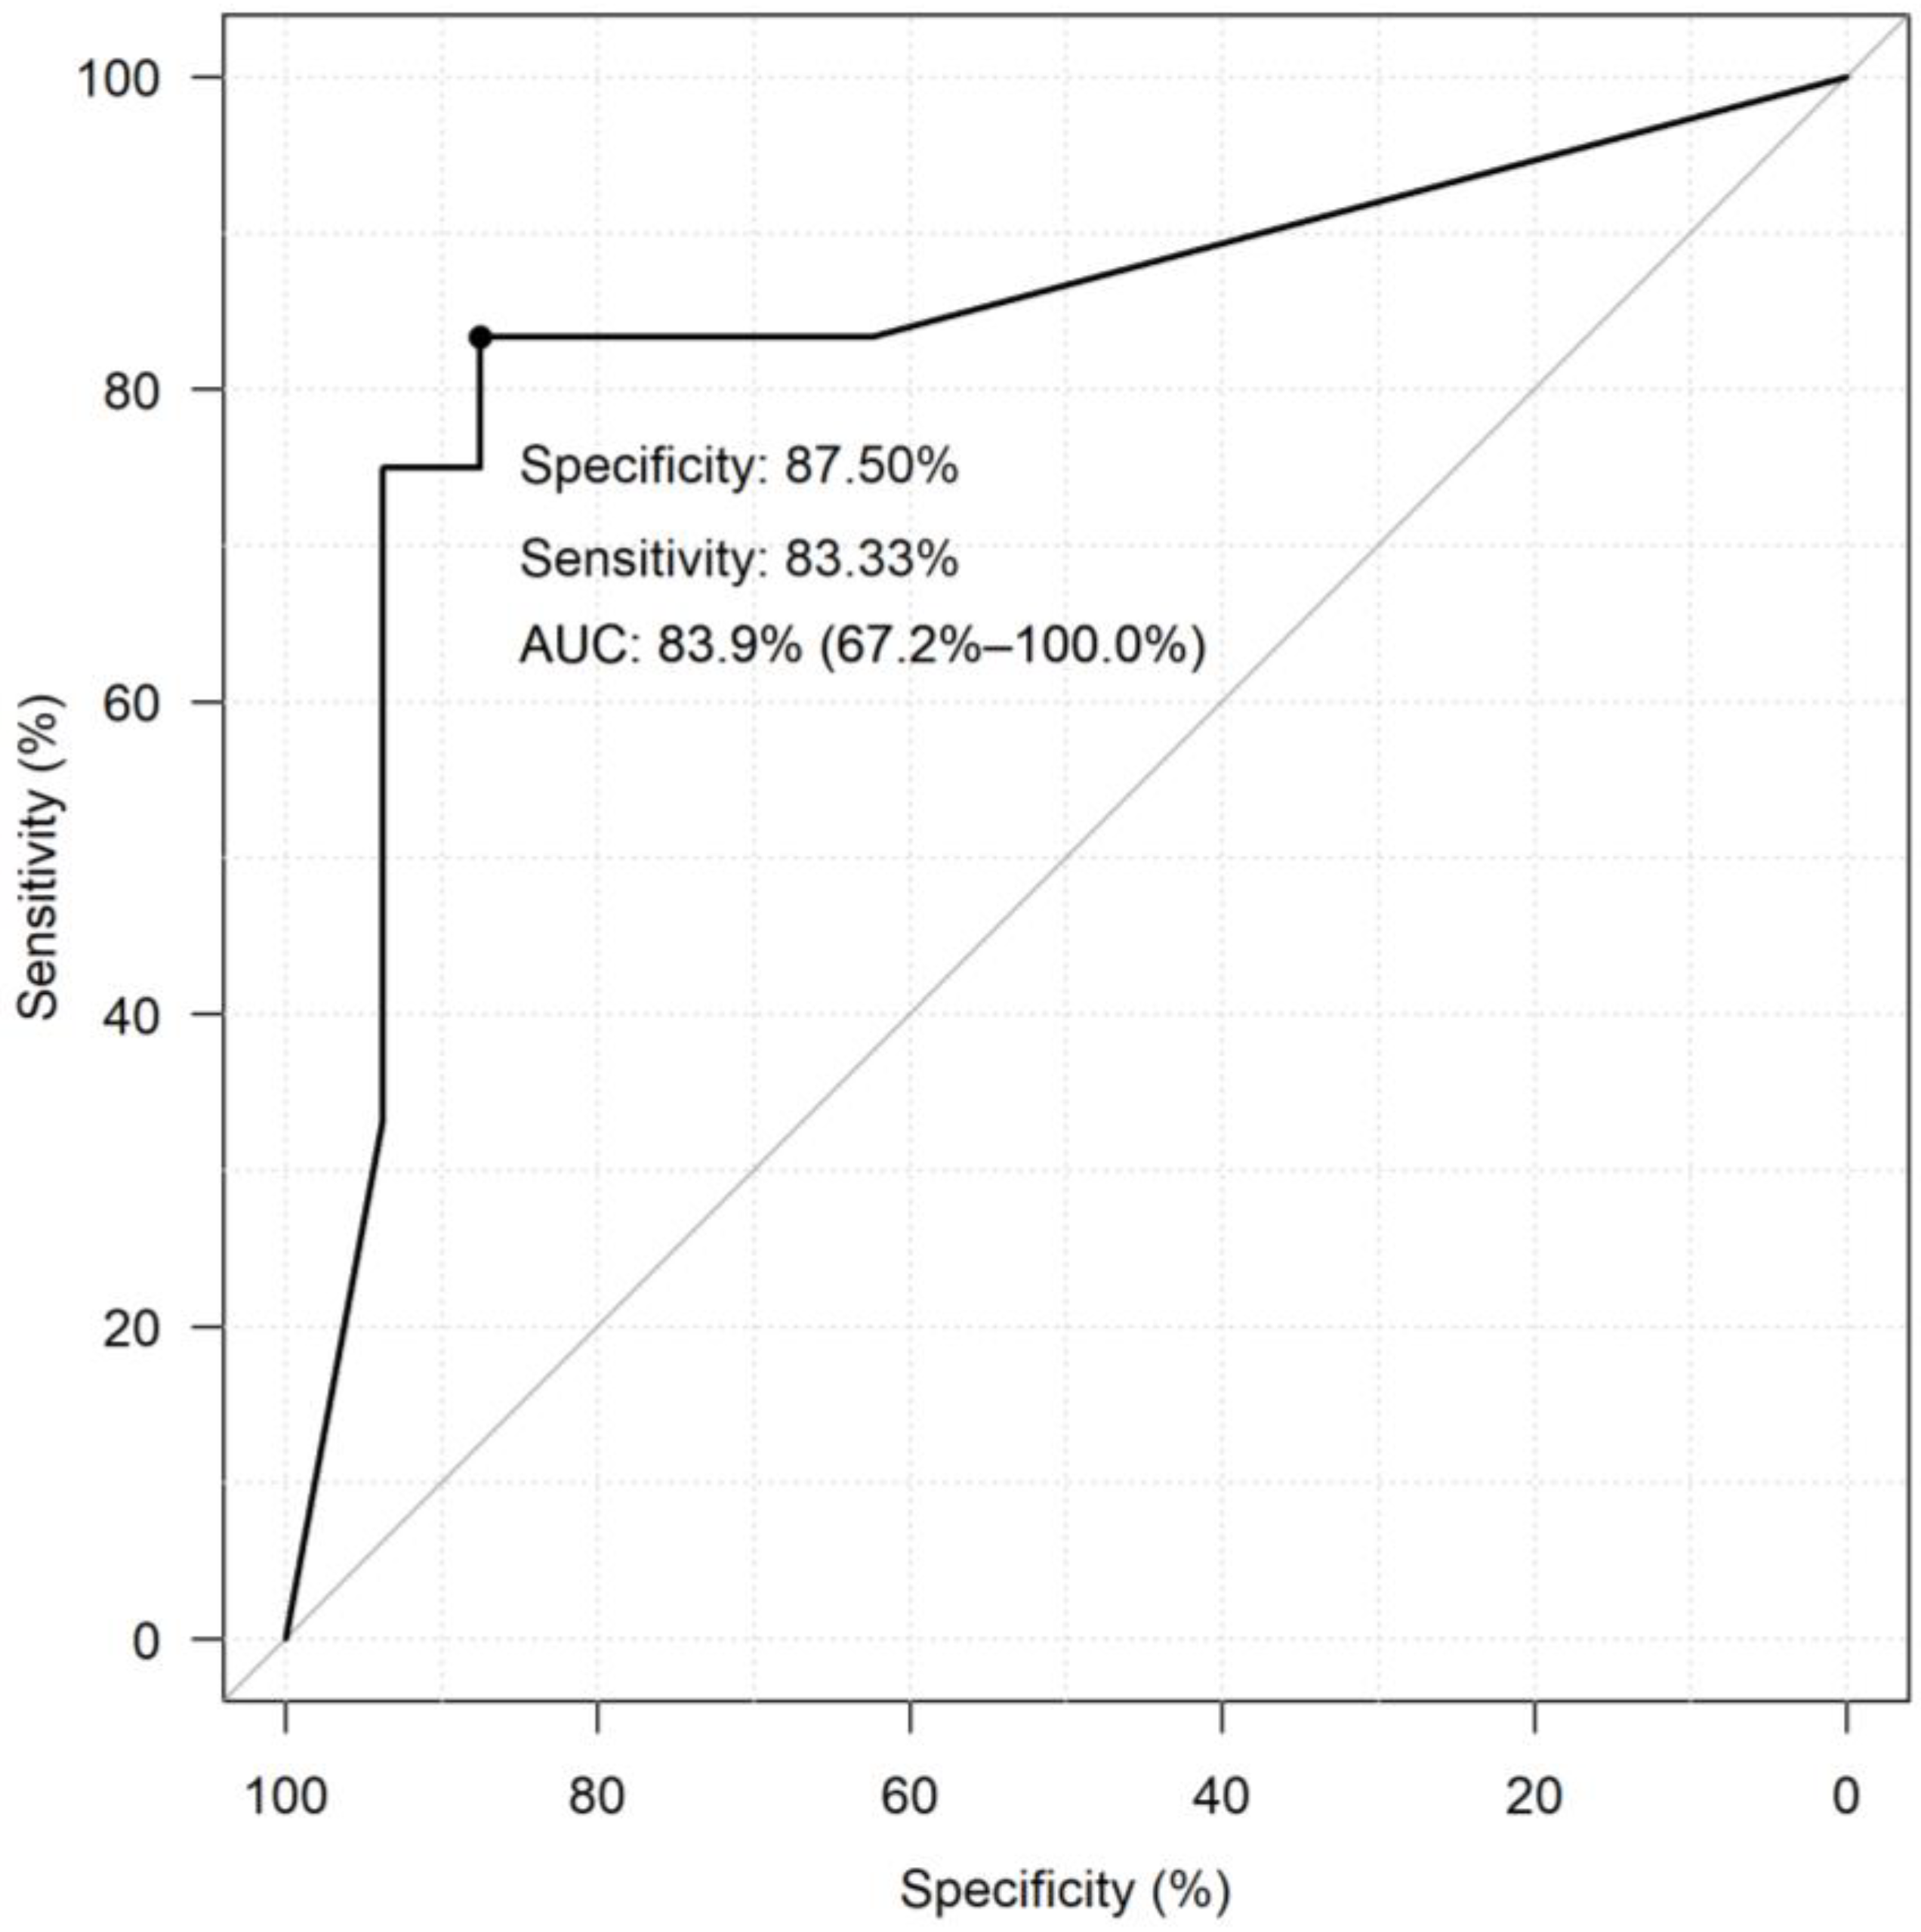
3.4. Diagnostic Performance of miRNAs

The diagnostic performance of selected and validated miRNAs was assessed using neural network models for all of the 847 miRNA combinations. The best-performing miRNA combination in differentiating G1 PanNETs from G2 PanNETs was miR-106b + miR-130b-3p + miR-127-3p + miR-129-5p + miR-30d-5p with a specificity of 77.44% and a sensitivity of 87.82% (Table 2). Only the ten best-performing combinations are shown here, while the complete dataset is included in Table S2. The diagnostic performance of the combination was better than that of individual miRNAs. The ROC curve of the best-performing miRNA combination resulting from the neural network model analyses is shown in Figure 3, where a sensitivity of 83.33 and specificity of 87.5% was achieved.

4. Discussion

We studied miRNAs showing differential expression between G1 and G2 PanNETs. First, we examined miRNAs already described to be differentially expressed between G1 and G2 GEP-NETs in the literature. From the selected four miRNAs, we were unable to demonstrate significant differences in the expression levels between the two tumor grade groups for miR-96-5p and miR-194-5p. miR-106b was confirmed to be decreased in G2 relative to G1 samples. However, the expression of miR-130b-3p showed an inverse change as reported previously, being underexpressed in G2 [15]. This incongruence might arise from the imparity of the original samples, namely that Cavalcanti et al. [15] used GEP-NETs, while we used only its subset, PanNETs. There are differences between pancreatic and other GEP-NETs, such as PanNENs being more likely to have a hereditary background (e.g., von Hippel–Lindau syndrome, multiple endocrine neoplasia syndrome type 1, tuberous sclerosis, and neurofibromatosis) or have distinct biological activity [3,22]. Moreover, the treatment protocols between PanNEN and small bowel NEN are also different [8,23].
We have discovered further significantly differentially expressed miRNAs between G1 and G2 PanNETs by NGS. From these miRNAs, we selected the top six miRNAs showing the largest differences. RT-qPCR validation of the selected miRNAs confirmed the significant downregulation of miR-30d-5p in G2 samples while for miR-127-3p, miR-129-5p, miR-769-5p, and miR-671-5p, no significant difference was detected. In the literature, miR-127-3p mainly functions as a tumor suppressor [24,25]; however, in our study, only non-significant changes in its expression in higher-graded PanNETs could be observed. It is not unusual for a miRNA to have tumor suppressor or oncogenic activity depending on the tissue [26]. miR-127-3p and miR-375 appear to be involved in insulin secretion, and they are highly abundant in pancreatic islet cells [27]. The expression of miR-127-3p was non-significantly higher in our few insulinoma samples compared to non-functional PanNETs. miR-127 was also found significantly overexpressed in PanNENs and their corresponding metastases compared to other GEP-NETs [28]. miR-671 has been shown to be underexpressed in pancreatic ductal carcinoma among other tumors and upregulated in colorectal, prostate, and hepatocellular cancer [29]. miRNA combinations showed higher diagnostic performance than individual miRNAs in concordance with the literature [20].

5. Conclusions

In conclusion, we have found a miRNA combination, namely miR-106b + miR-130b-3p + miR-127-3p + miR-129-5p + miR-30d-5p, that can possibly differentiate between G1 and G2 PanNETs. The diagnostic performance of these miRNAs is not perfect but is promising. Further, preferably multicentric studies on larger sample cohorts are warranted to validate and increase the diagnostic accuracy of the combined miRNA marker. If matching circulating miRNAs could be identified, this might open the way for minimally invasive blood-borne biomarkers and would have major clinical relevance in determining the grade of PanNETs.

Supplementary Materials

The following supporting information can be downloaded at: https://www.mdpi.com/article/10.3390/cancers16142528/s1, Table S1: NGS miRNA combined data; Table S2: Diagnostic performance of miRNA combinations derived from neural network models.

Author Contributions

Conceptualization: P.I.; methodology, G.N.; software, Z.H.; validation, B.K.S., B.V. and G.N.; FFPE sample resources and evaluation, K.B., K.D., A.Z. and I.K.; data curation, Á.D.; writing—original draft preparation, Z.H., G.N. and P.I.; writing—review and editing, P.I., B.K.S., Z.H. and G.N.; supervision, P.I. and G.N.; project administration, P.I.; funding acquisition, P.I. All authors have read and agreed to the published version of the manuscript.

Funding

The authors acknowledge funding by the Hungarian National Research, Development, and Innovation Office (NKFIH) (grants K134215 and K146906 to P.I.) and TKP2021-EGA-24 from the National Research, Development, and Innovation Fund by the Ministry of Innovation and Technology of Hungary financed under the [TKP2021-EGA] funding scheme. The work by Bálint Kende Szeredás was supported by the National Academy of Scientist Education Program of the National Biomedical Foundation under the sponsorship of the Hungarian Ministry of Culture and Innovation.

Institutional Review Board Statement

The study was conducted in accordance with the Declaration of Helsinki and approved by the Hungarian Health Council (Date of approval: 1 April 2022, protocol code: IV-2388/1/2022/EKU).

Informed Consent Statement

Informed consent was obtained from all subjects involved in the study.

Data Availability Statement

NGS data were uploaded to an openly accessible database under Gene Expression Omnibus accession number GSE265752.

Conflicts of Interest

The authors declare no conflicts of interest.

References

  1. Wyld, D.; Wan, M.H.; Moore, J.; Dunn, N.; Youl, P. Epidemiological trends of neuroendocrine tumours over three decades in Queensland, Australia. Cancer Epidemiol. 2019, 63, 101598. [Google Scholar] [CrossRef] [PubMed]
  2. Kulkarni, R.; Anand, A.; Parikh, S.; Panchal, H.; Patel, A.; Mehta, D.; Patel, P. Clinical and epidemiological profile of neuroendocrine tumors: An experience from a regional cancer center from Western India. South Asian J. Cancer 2019, 8, 198–207. [Google Scholar] [CrossRef] [PubMed]
  3. Rindi, G.; Mete, O.; Uccella, S.; Basturk, O.; La Rosa, S.; Brosens, L.A.A.; Ezzat, S.; de Herder, W.W.; Klimstra, D.S.; Papotti, M.; et al. Overview of the 2022 WHO Classification of Neuroendocrine Neoplasms. Endocr. Pathol. 2022, 33, 115–154. [Google Scholar] [CrossRef] [PubMed]
  4. Hofland, J.; Falconi, M.; Christ, E.; Castaño, J.P.; Faggiano, A.; Lamarca, A.; Perren, A.; Petrucci, S.; Prasad, V.; Ruszniewski, P.; et al. European Neuroendocrine Tumor Society 2023 guidance paper for functioning pancreatic neuroendocrine tumour syndromes. J. Neuroendocrinol. 2023, 35, e13318. [Google Scholar] [CrossRef] [PubMed]
  5. Uccella, S.; La Rosa, S.; Metovic, J.; Marchiori, D.; Scoazec, J.Y.; Volante, M.; Mete, O.; Papotti, M. Genomics of High-Grade Neuroendocrine Neoplasms: Well-Differentiated Neuroendocrine Tumor with High-Grade Features (G3 NET) and Neuroendocrine Carcinomas (NEC) of Various Anatomic Sites. Endocr. Pathol. 2021, 32, 192–210. [Google Scholar] [CrossRef]
  6. Dasari, A.; Shen, C.; Halperin, D.; Zhao, B.; Zhou, S.; Xu, Y.; Shih, T.; Yao, J.C. Trends in the incidence, prevalence, and survival outcomes in patients with neuroendocrine tumors in the United States. JAMA Oncol. 2017, 3, 1335–1342. [Google Scholar] [CrossRef]
  7. Falconi, M.; Eriksson, B.; Kaltsas, G.; Bartsch, D.K.; Capdevila, J.; Caplin, M.; Kos-Kudla, B.; Kwekkeboom, D.; Rindi, G.; Klöppel, G.; et al. ENETS consensus guidelines update for the management of patients with functional pancreatic neuroendocrine tumors and non-functional pancreatic neuroendocrine tumors. Neuroendocrinology 2016, 103, 153–171. [Google Scholar] [CrossRef] [PubMed]
  8. Kos-Kudła, B.; Castaño, J.P.; Denecke, T.; Grande, E.; Kjaer, A.; Koumarianou, A.; de Mestier, L.; Partelli, S.; Perren, A.; Stättner, S.; et al. European Neuroendocrine Tumour Society (ENETS) 2023 guidance paper for nonfunctioning pancreatic neuroendocrine tumours. J. Neuroendocrinol. 2023, 35, e13343. [Google Scholar] [CrossRef]
  9. Magi, L.; Marasco, M.; Rinzivillo, M.; Faggiano, A.; Panzuto, F. Management of Functional Pancreatic Neuroendocrine Neoplasms. Curr. Treat. Options Oncol. 2023, 24, 725–741. [Google Scholar] [CrossRef]
  10. Marasco, M.; Dell’Unto, E.; Laviano, A.; Campana, D.; Panzuto, F. Gastrointestinal side effects of somatostatin analogs in neuroendocrine tumors: A focused review. J. Gastroenterol. Hepatol. 2024. ahead of print. [Google Scholar] [CrossRef]
  11. Calomino, N.; Poto, G.E.; Carbone, L.; Bagnacci, G.; Piccioni, S.; Andreucci, E.; Nenci, L.; Marano, L.; Verre, L.; Petrioli, R.; et al. Neuroendocrine tumors’ patients treated with somatostatin analogue could complicate with emergency cholecystectomy. Ann. Ital. Chir. 2023, 94, 518–522. [Google Scholar]
  12. Botling, J.; Lamarca, A.; Bajic, D.; Norlén, O.; Lönngren, V.; Kjaer, J.; Eriksson, B.; Welin, S.; Hellman, P.; Rindi, G.; et al. High-Grade Progression Confers Poor Survival in Pancreatic Neuroendocrine Tumors. Neuroendocrinology 2020, 110, 891–898. [Google Scholar] [CrossRef] [PubMed]
  13. Malumbres, M. miRNAs and cancer: An epigenetics view. Mol. Asp. Med. 2013, 34, 863–874. [Google Scholar] [CrossRef] [PubMed]
  14. Grolmusz, V.K.; Kövesdi, A.; Borka, K.; Igaz, P.; Patócs, A. Prognostic relevance of proliferation-related miRNAs in pancreatic neuroendocrine neoplasms. Eur. J. Endocrinol. 2018, 179, 219–228. [Google Scholar] [CrossRef] [PubMed]
  15. Cavalcanti, E.; Galleggiante, V.; Coletta, S.; Stasi, E.; Chieppa, M.; Armentano, R.; Serino, G. Altered miRNAs Expression Correlates with Gastroenteropancreatic Neuroendocrine Tumors Grades. Front. Oncol. 2020, 10, 1187. [Google Scholar] [CrossRef] [PubMed]
  16. Kövesdi, A.; Kurucz, P.A.; Nyírő, G.; Darvasi, O.; Patócs, A.; Butz, H. Circulating miRNA increases the diagnostic accuracy of chromogranin a in metastatic pancreatic neuroendocrine tumors. Cancers 2020, 12, 2488. [Google Scholar] [CrossRef] [PubMed]
  17. Thorns, C.; Schurmann, C.; Gebauer, N.; Wallaschofski, H.; Kümpers, C.; Bernard, V.; Feller, A.C.; Keck, T.; Habermann, J.K.; Begum, N.; et al. Global MicroRNA profiling of pancreatic neuroendocrine Neoplasias. Anticancer Res. 2014, 34, 2249–2254. [Google Scholar] [PubMed]
  18. Vicentini, C.; Fassan, M.; D’Angelo, E.; Corbo, V.; Silvestris, N.; Nuovo, G.J.; Scarpa, A. Clinical application of microRNA testing in neuroendocrine tumors of the gastrointestinal tract. Molecules 2014, 19, 2458–2468. [Google Scholar] [CrossRef] [PubMed]
  19. Li, A.; Yu, J.; Kim, H.; Wolfgang, C.L.; Canto, M.I.; Hruban, R.H.; Goggins, M. MicroRNA array analysis finds elevated serum miR-1290 accurately distinguishes patients with low-stage pancreatic cancer from healthy and disease controls. Clin. Cancer Res. 2013, 19, 3600–3610. [Google Scholar] [CrossRef] [PubMed]
  20. Turai, P.I.; Herold, Z.; Nyirő, G.; Borka, K.; Micsik, T.; Tőke, J.; Szücs, N.; Tóth, M.; Patócs, A.; Igaz, P. Tissue miRNA Combinations for the Differential Diagnosis of Adrenocortical Carcinoma and Adenoma Established by Artificial Intelligence. Cancers 2022, 14, 895. [Google Scholar] [CrossRef]
  21. Schmittgen, T.D.; Livak, K.J. Analyzing real-time PCR data by the comparative CT method. Nat. Protoc. 2008, 3, 1101–1108. [Google Scholar] [CrossRef]
  22. Pavel, M.; Öberg, K.; Falconi, M.; Krenning, E.P.; Sundin, A.; Perren, A.; Berruti, A. Gastroenteropancreatic neuroendocrine neoplasms: ESMO Clinical Practice Guidelines for diagnosis, treatment and follow-up. Ann. Oncol. 2020, 31, 844–860. [Google Scholar] [CrossRef] [PubMed]
  23. Panzuto, F.; Ramage, J.; Pritchard, D.M.; van Velthuysen, M.L.F.; Schrader, J.; Begum, N.; Sundin, A.; Falconi, M.; O’Toole, D. European Neuroendocrine Tumor Society (ENETS) 2023 guidance paper for gastroduodenal neuroendocrine tumours (NETs) G1–G3. J. Neuroendocrinol. 2023, 35, e13306. [Google Scholar] [CrossRef] [PubMed]
  24. Du, S.Y.; Huang, X.X.; Li, N.M.; Lv, C.Y.; Lv, C.H.; Wei, M.L.; Gao, Z.; Zhang, Y.P. MiR-127-3p inhibits proliferation of ovarian cancer in rats through down-regulating MAPK4. Eur. Rev. Med. Pharmacol. Sci. 2020, 24, 10383–10390. [Google Scholar] [PubMed]
  25. Fellenberg, J.; Kunz, P.; Lehner, B.; Saehr, H.; Schenker, A. Tumor suppressor function of mir-127-3p and mir-376a-3p in osteosarcoma cells. Cancers 2019, 11, 2019. [Google Scholar] [CrossRef] [PubMed]
  26. Shenouda, S.K.; Alahari, S.K. MicroRNA function in cancer: Oncogene or a tumor suppressor? Cancer Metastasis Rev. 2009, 28, 369–378. [Google Scholar] [CrossRef]
  27. Bolmeson, C.; Esguerra, J.L.S.; Salehi, A.; Speidel, D.; Eliasson, L.; Cilio, C.M. Differences in islet-enriched miRNAs in healthy and glucose intolerant human subjects. Biochem. Biophys. Res. Commun. 2011, 404, 16–22. [Google Scholar] [CrossRef] [PubMed]
  28. Zimmermann, N.; Knief, J.; Kacprowski, T.; Lazar-Karsten, P.; Keck, T.; Billmann, F.; Schmid, S.; Luley, K.; Lehnert, H.; Brabant, G.; et al. MicroRNA analysis of gastroenteropancreatic neuroendocrine tumors and metastases. Oncotarget 2018, 9, 28379–28390. [Google Scholar] [CrossRef]
  29. Ghafouri-Fard, S.; Askari, A.; Hussen, B.M.; Rasul, M.F.; Hatamian, S.; Taheri, M.; Kiani, A. A review on the role of miR-671 in human disorders. Front. Mol. Biosci. 2022, 9, 1077968. [Google Scholar] [CrossRef]
Figure 1. Expression of miRNAs identified by literature search. (A) miR-130-3p; (B) miR-106b; (C) miR-194-5p; (D) miR-96-5p. miR-130b-3p and miR-106b showed significantly lower expression in G2 samples compared to G1 samples. *: significant difference (p < 0.05).
Cancers 16 02528 g001
Figure 2. RT-qPCR validation of significantly differentially expressed miRNAs selected based on NGS data. (A) miR-30d-5p; (B) miR-129-5p; (C) miR-127-3p; (D) miR-769-5p; (E) miR-375-3p; (F) miR-671-5p. miR-30d-5p showed significantly lower expression in G2 samples compared to G1 samples. *: significant difference (p < 0.05).
Cancers 16 02528 g002
Figure 3. The receiver operator characteristic (ROC) curve of the best-performing miRNA combination. In the ROC model, the predictor was the percentage value estimated by the selected neural network model. The following simulation procedure was used to estimate the percentages for each sample. The best-performing neural network model was re-run by training a new learning sample omitting the sample selected for testing. We then performed model prediction on whether the given sample was Grade I or II. All samples were tested using 10,000 iterations. The sensitivity and specificity values differ from that of the data in Table 2 as this is a recalculation by ROC.
Cancers 16 02528 g003
Table 1. Characteristics of tumor samples studied. NF: non-functioning. M: male, F: female.
Sample No.Tumor GradeKi-67 IndexSexAgeHormonal Activity
1.12%M60NF
2.12%F34NF
3.1<1%F46Insulinoma
4.11%F42NF
5.11%F49Insulinoma
6.13%F70NF
7.10%F65NF
8.11%M69NF
9.1<1%F67NF
10.12%F74NF
11.1<1%F40NF
12.1<1%F53NF
13.11%F44Insulinoma
14.1<2%M70NF
15.1<1%M71NF
16.1<1%F79NF
17.11%F56NF
18.220%F48NF
19.215%F42NF
20.210%M69NF
21.25%F60NF
22.21–3%F62NF
23.210%F65NF
24.25%M66NF
25.21–4%M49NF
26.25–8%M44NF
27.22.8–3.1%F76NF
28.25–10%M54NF
29.25%M47NF
30.25%M48NF
31.220%F49NF
32.25%F74NF
33.27%F41NF
M: male, F: female.
Table 2. Ten best-performing neural network models for diagnostic performance of miRNA combinations. Best-performing combination is indicated in bold.
Model CombinationTPFPTNFNSpecificitySensitivity
miR_106b + miR_130b_3p + miR_127_3p + miR_129_5p + miR_30d_5p14.924.3414.922.0777.4487.82
miR_106b + miR_130b_3p + miR_127_3p + miR_129_5p + miR_671_5p + miR_30d_5p14.866.0314.862.1371.1187.47
miR_106b + miR_130b_3p + miR_127_3p + miR_769_5p + miR_671_5p + miR_30d_5p14.545.5614.542.4572.3385.56
miR_769_5p + miR_375_3p + miR_30d_5p13.854.4413.853.1475.7081.52
miR_106b + miR_130b_3p + miR_127_3p + miR_769_5p + miR_30d_5p14.595.9714.592.4070.9685.88
miR_106b + mir_194_5p + miR_130b_3p + miR_127_3p + miR_129_5p + miR_30d_5p14.165.3914.162.8372.4283.33
miR_106b + miR_130b_3p + miR_127_3p + miR_769_5p + miR_671_5p14.005.2914.002.9972.56782.4
miR_106b + miR_130b_3p + miR_127_3p + miR_129_5p + miR_769_5p + miR_30d_5p14.656.8414.652.3468.1486.19
miR_106b + miR_130b_3p + miR_127_3p + miR_671_5p + miR_30d_5p14.206.1214.202.7969.8583.53
miR_106b + miR_130b_3p + miR_127_3p + miR_129_5p + miR_375_3p14.937.8514.932.0665.5287.84
FN: false negative; FP: false positive; TN: true negative; TP: true positive.
Disclaimer/Publisher’s Note: The statements, opinions and data contained in all publications are solely those of the individual author(s) and contributor(s) and not of MDPI and/or the editor(s). MDPI and/or the editor(s) disclaim responsibility for any injury to people or property resulting from any ideas, methods, instructions or products referred to in the content.

