
Anticancer Effect of PtIIPHENSS, PtII5MESS, PtII56MESS and Their Platinum(IV)-Dihydroxy Derivatives against Triple-Negative Breast Cancer and Cisplatin-Resistant Colorectal Cancer
 , , , and
Abstract
:Simple Summary
Abstract
1. Introduction
2. Materials and Methods
2.1. Chemicals and Reagents
2.2. Cell Line Maintenance and Complex Synthesis
2.3. Cytotoxicity of Platinum(II) and (IV) Complexes
2.4. Cytotoxicity Evaluation of Platinum(II) and (IV) Complexes in a Cancer Spheroid Model
2.5. Cellular Uptake of Platinum(II) and (IV) Complexes
2.6. Mode of Uptake of Platinum(II) and (IV) Complexes
2.7. Cellular Localisation of Platinum(II) and (IV) Complexes
2.8. Cell Death Analysis
2.9. Cell Cycle Arrest
2.10. Reactive Oxygen Species Detection Assay
2.11. Mitochondrial Membrane Potential
2.12. Immunofluorescence Morphological Changes in Microtubule Organisation Using Confocal Microscopy
2.13. Wound Healing Assay
2.14. Western Blot
2.15. Proteomics
2.16. Statistical Analysis
3. Results
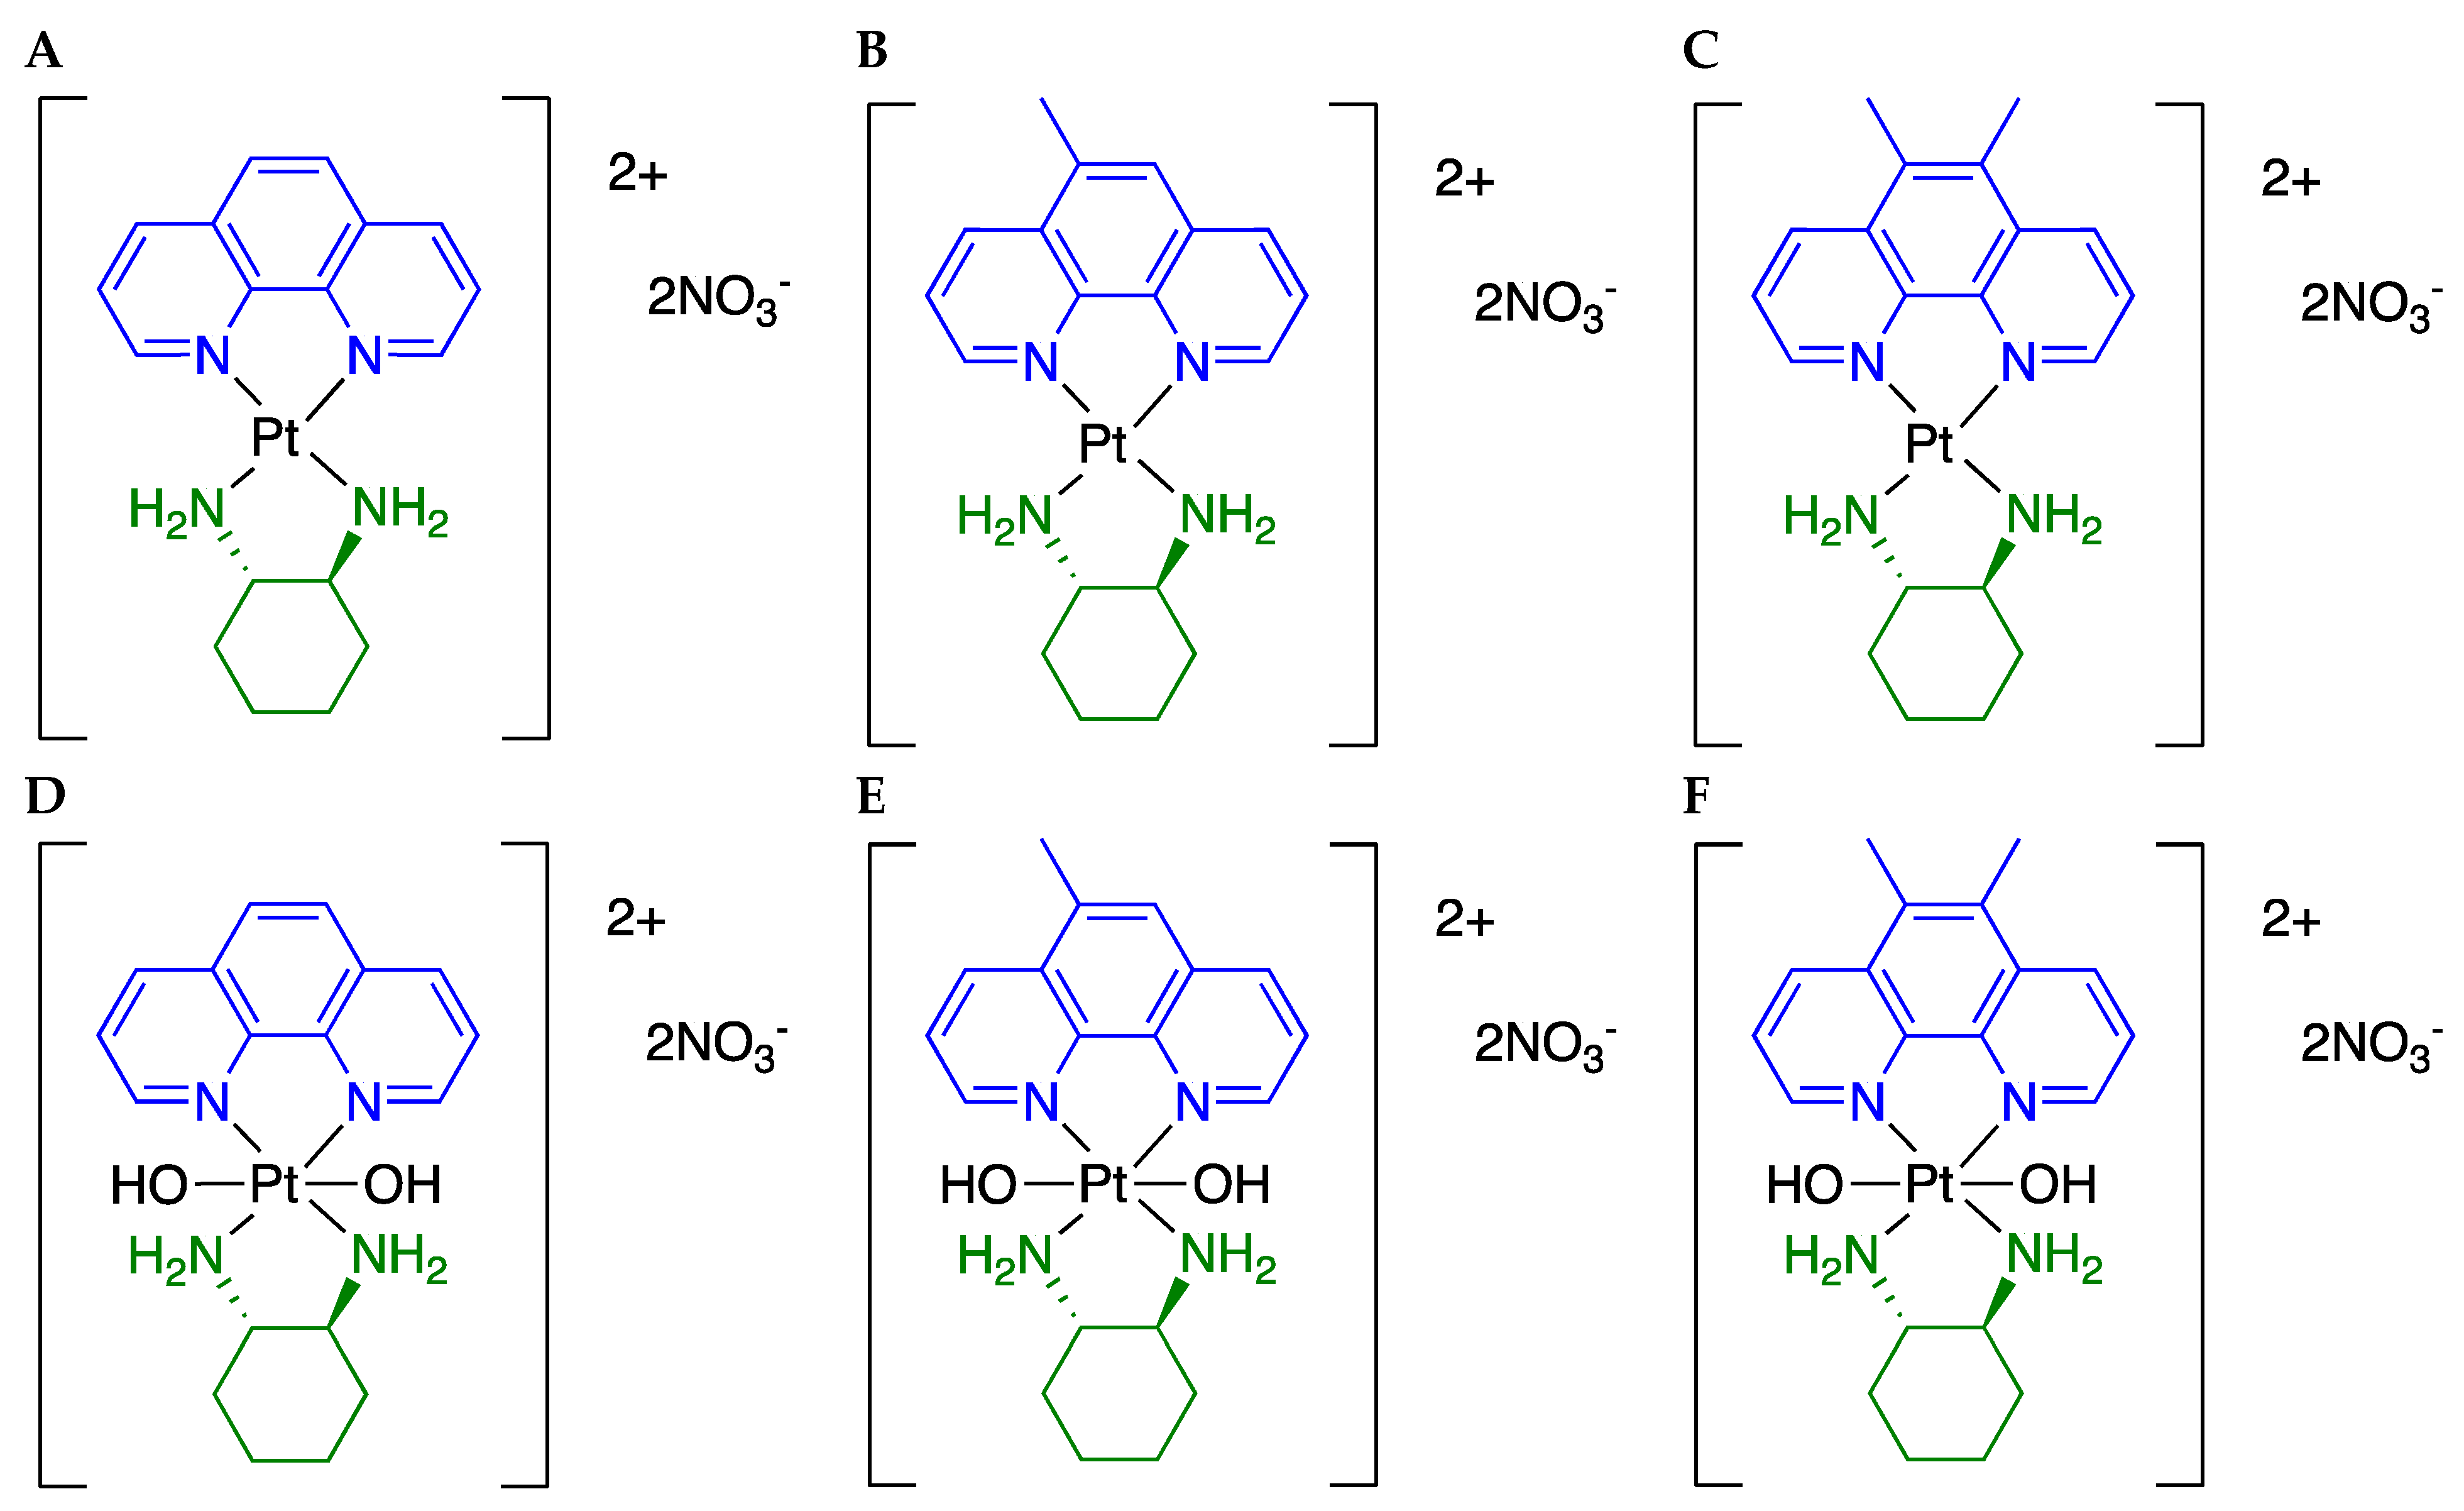
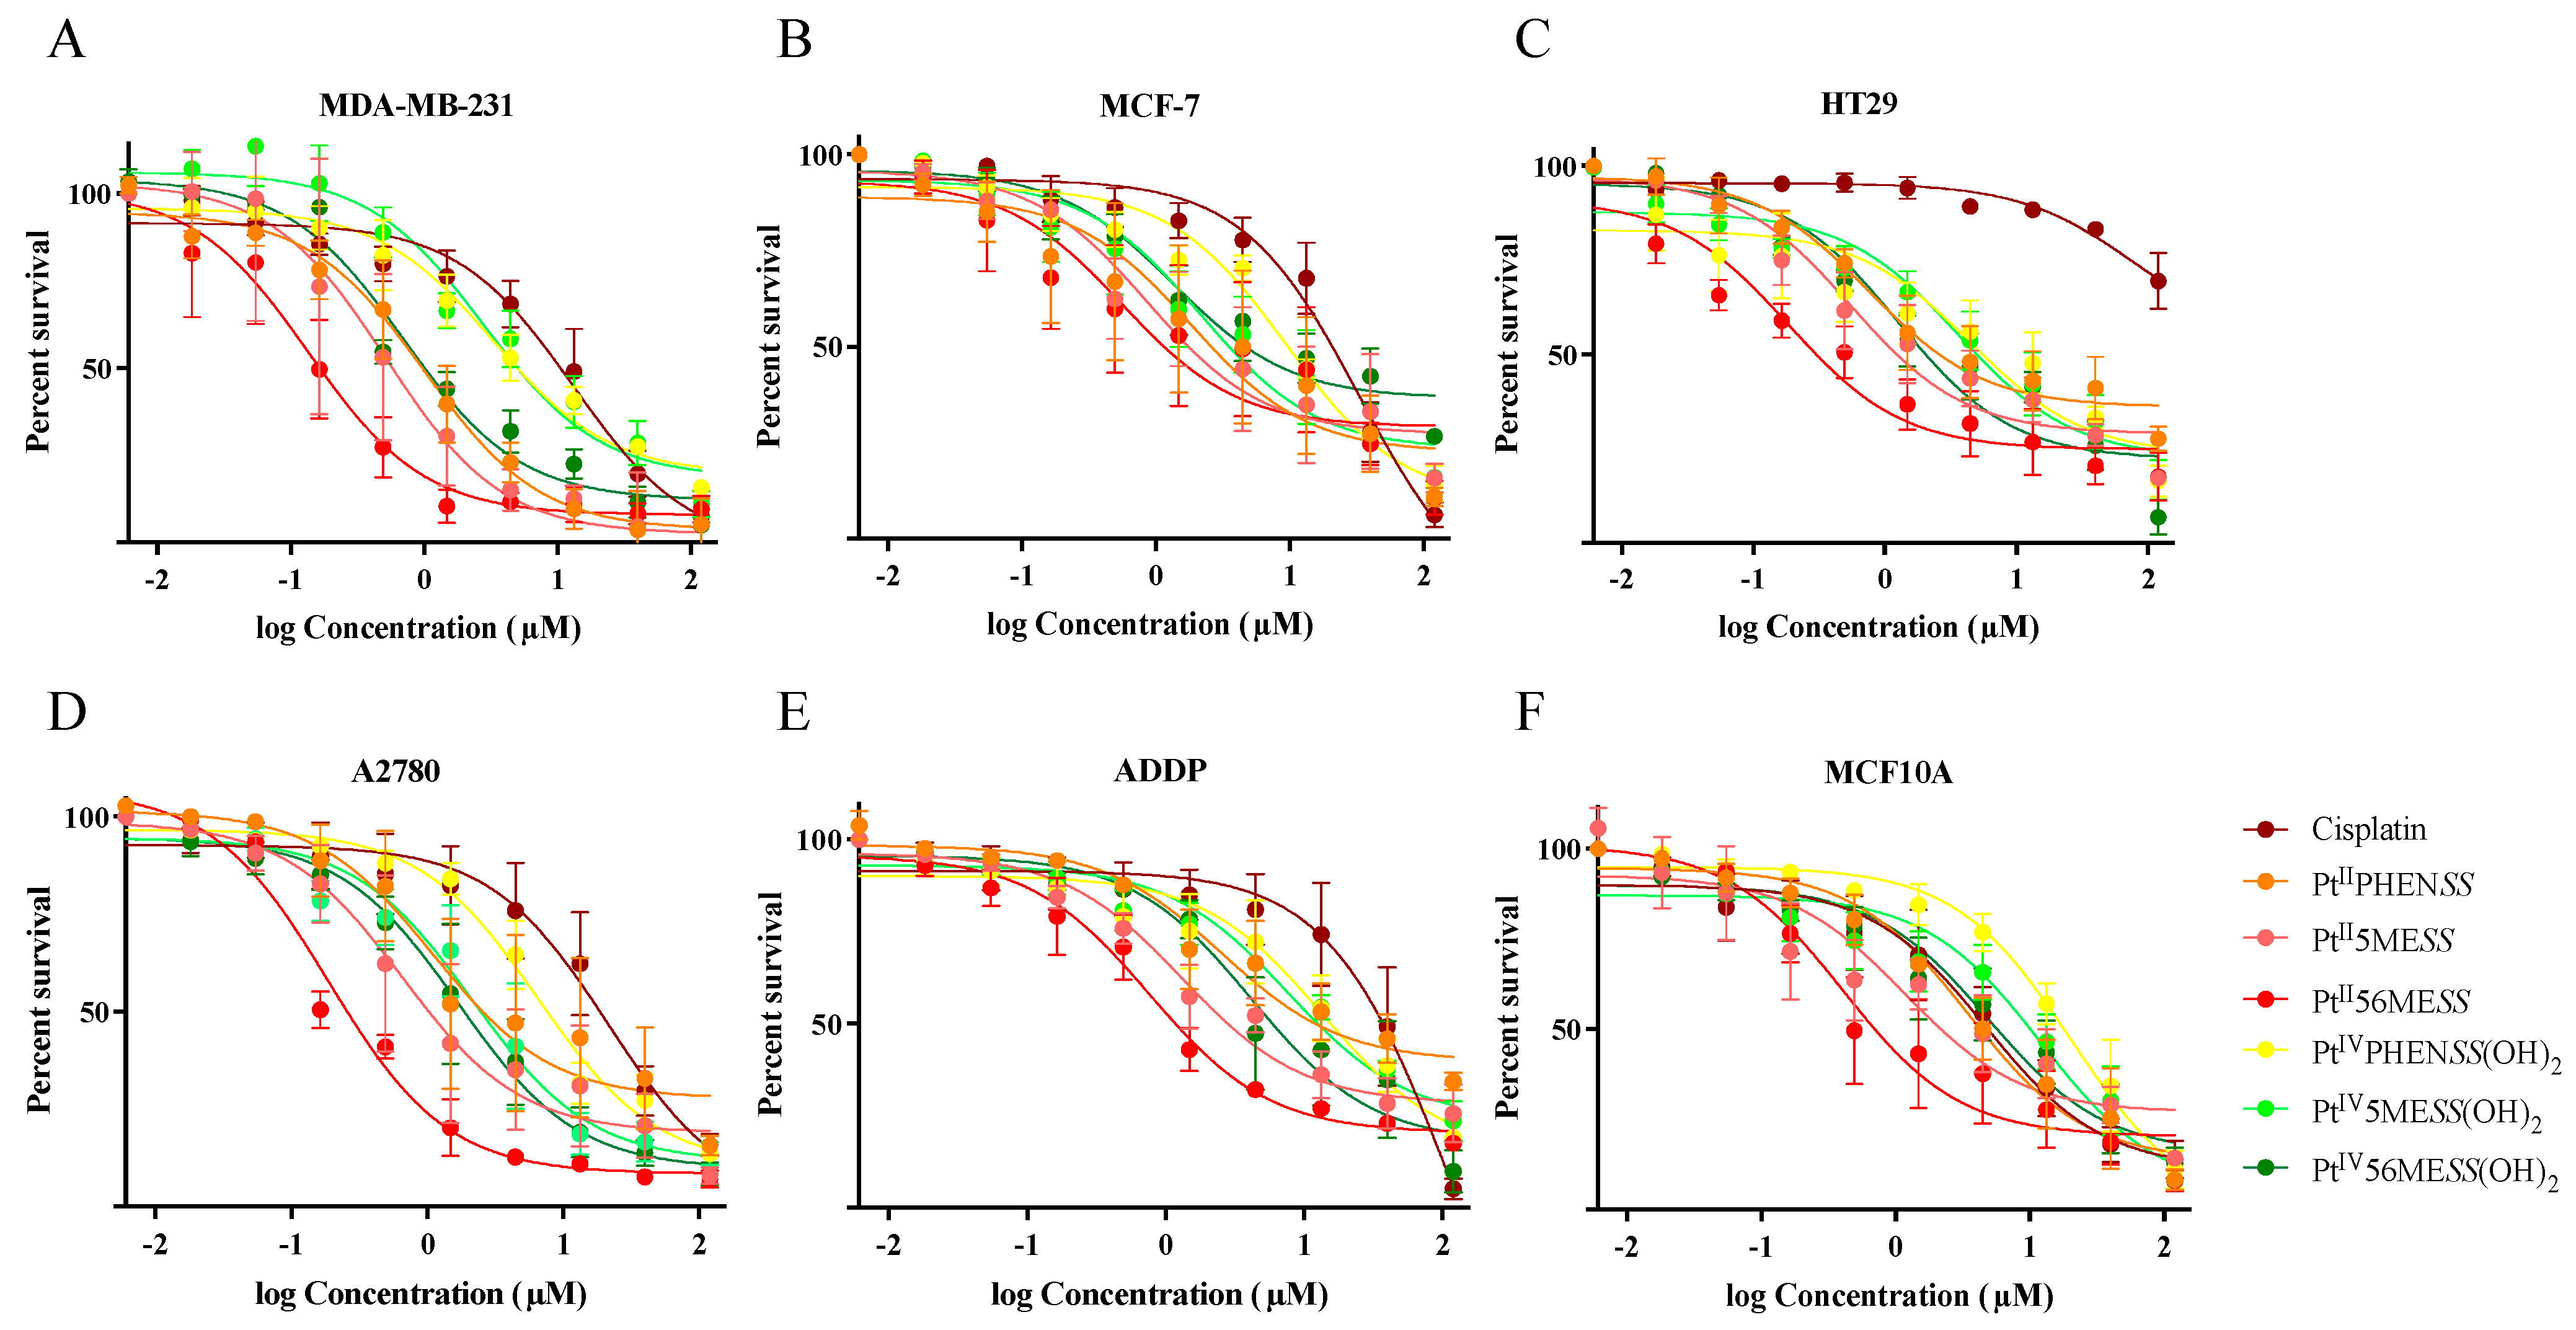
3.1. Cytotoxicity of Platinum(II) and (IV) Complexes
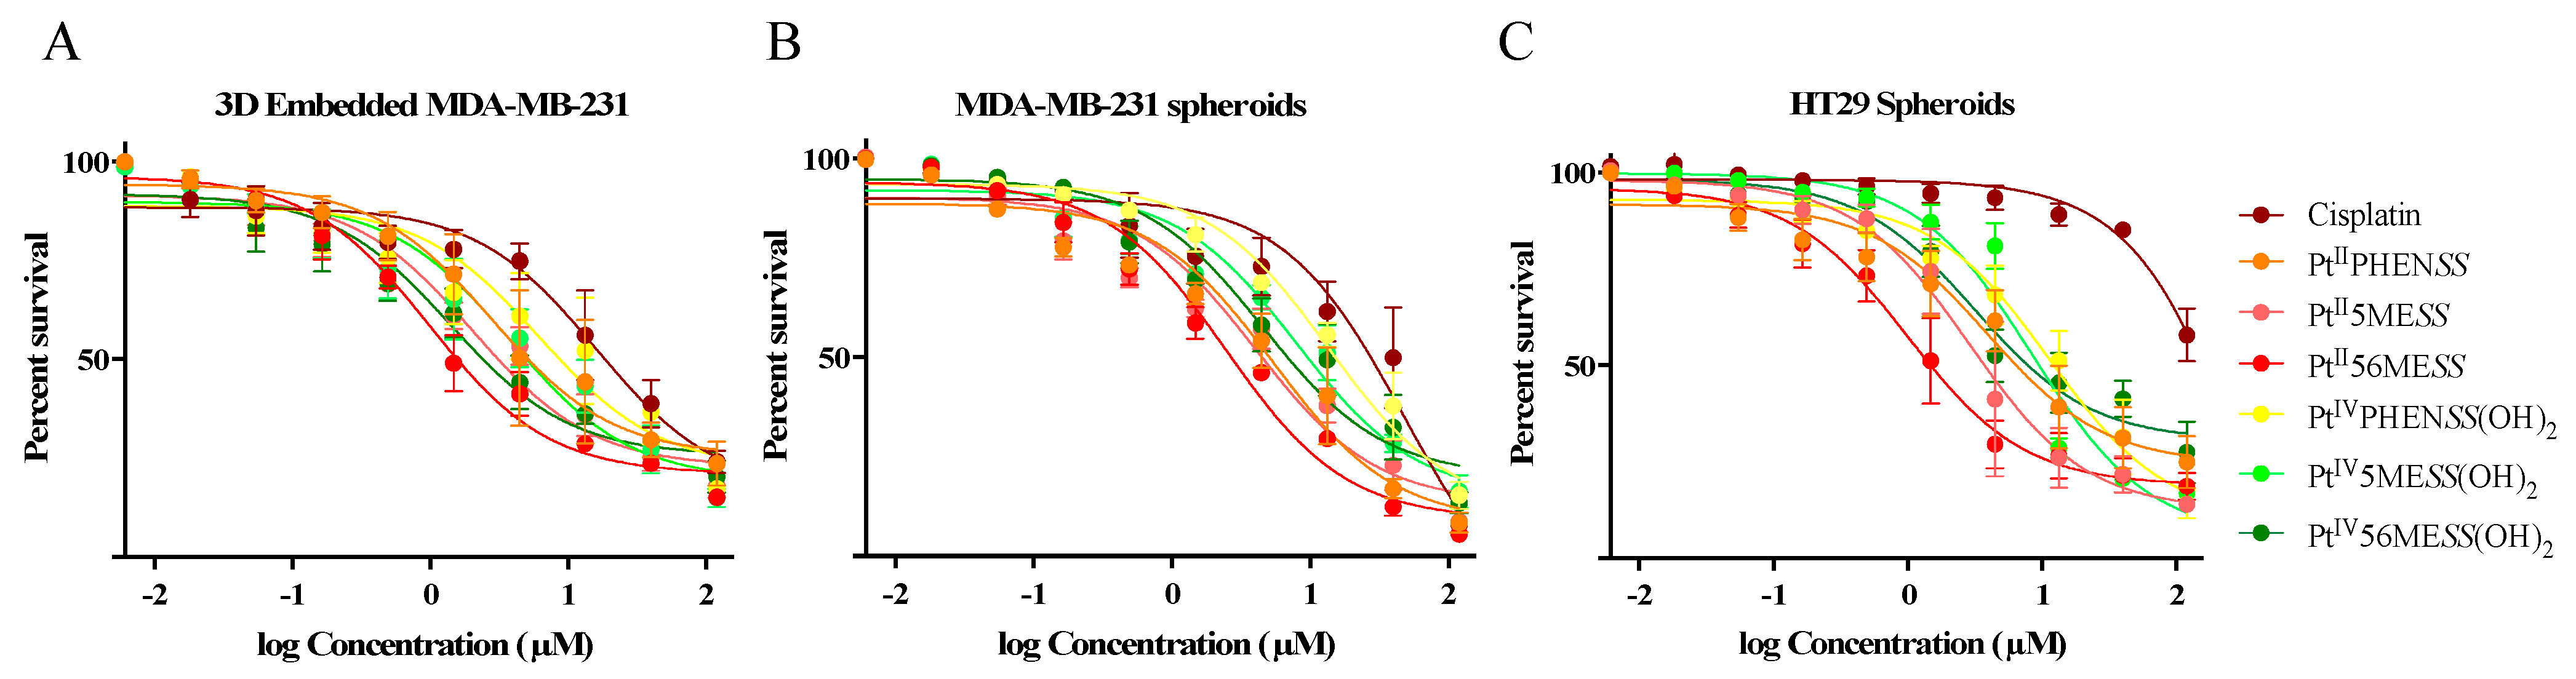
3.2. Single-Cell 3D Diffusely Embedded Breast Cancer Model and Spheroid Model of Breast and Colorectal Cancer for Cytotoxicity Evaluation
3.3. Cellular Uptake Platinum(II) vs. Platinum(IV) Complexes
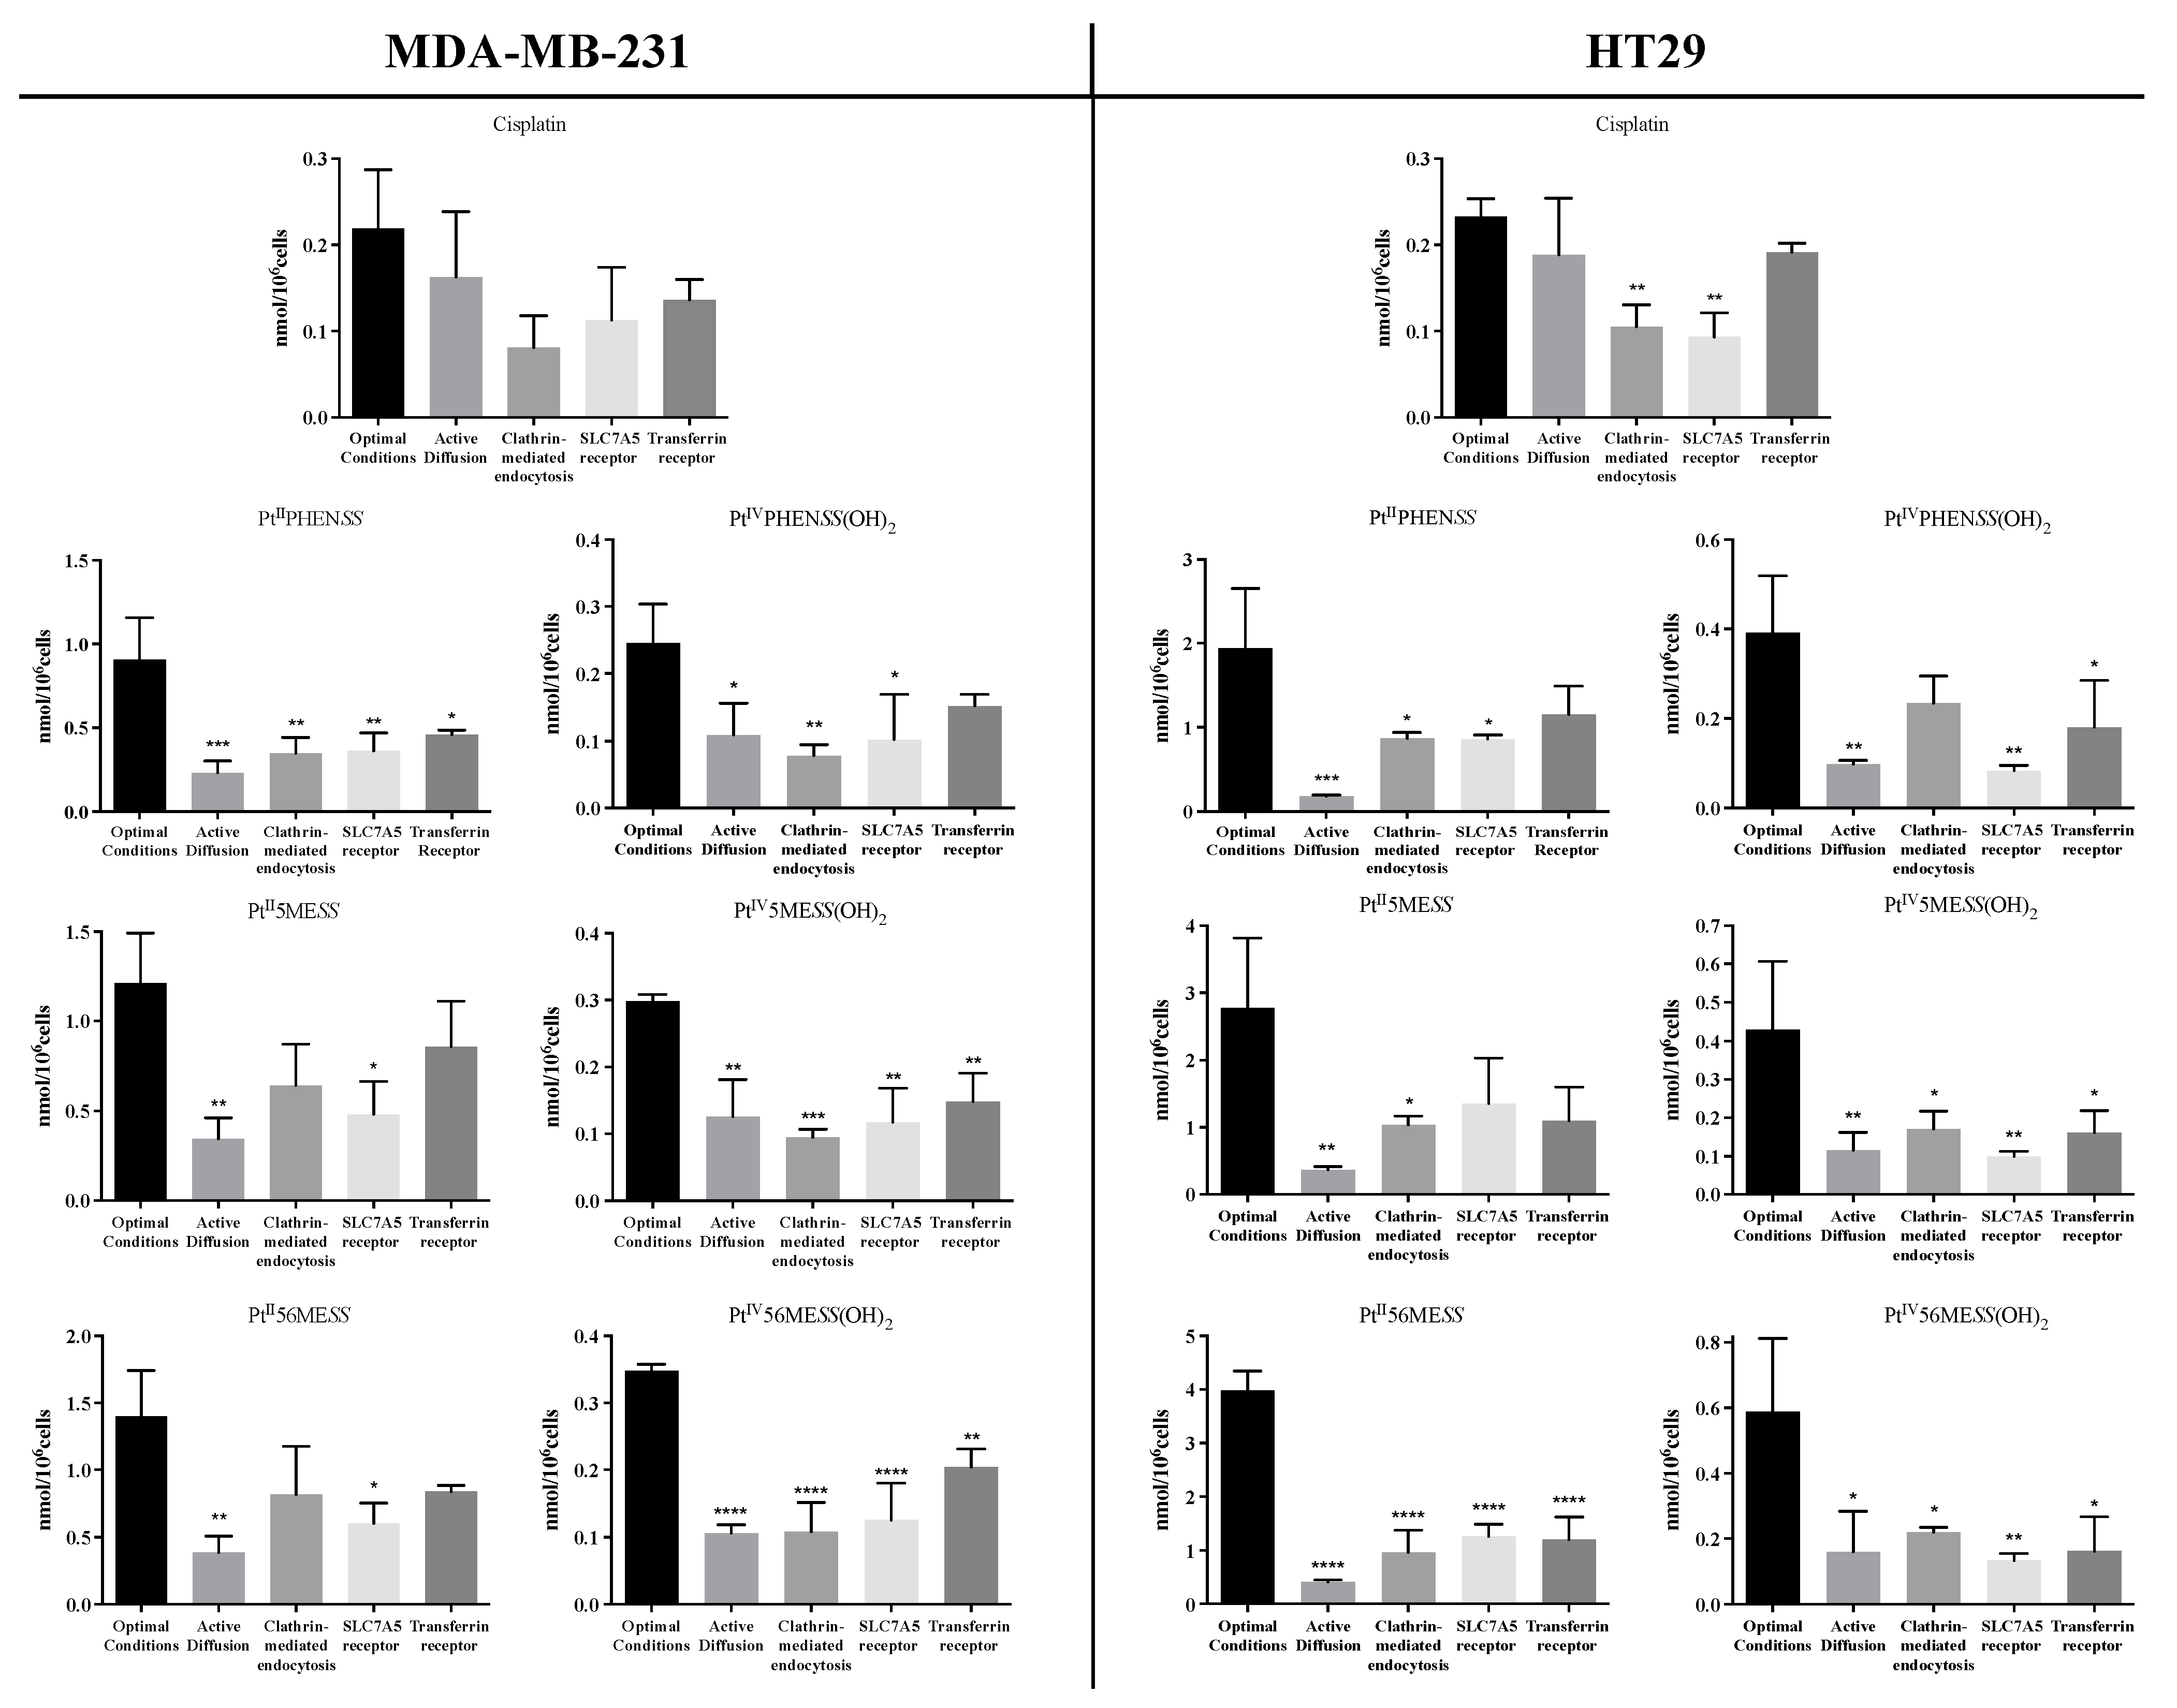
3.4. Mode of Uptake of Platinum(II) and Platinum(IV) Complexes
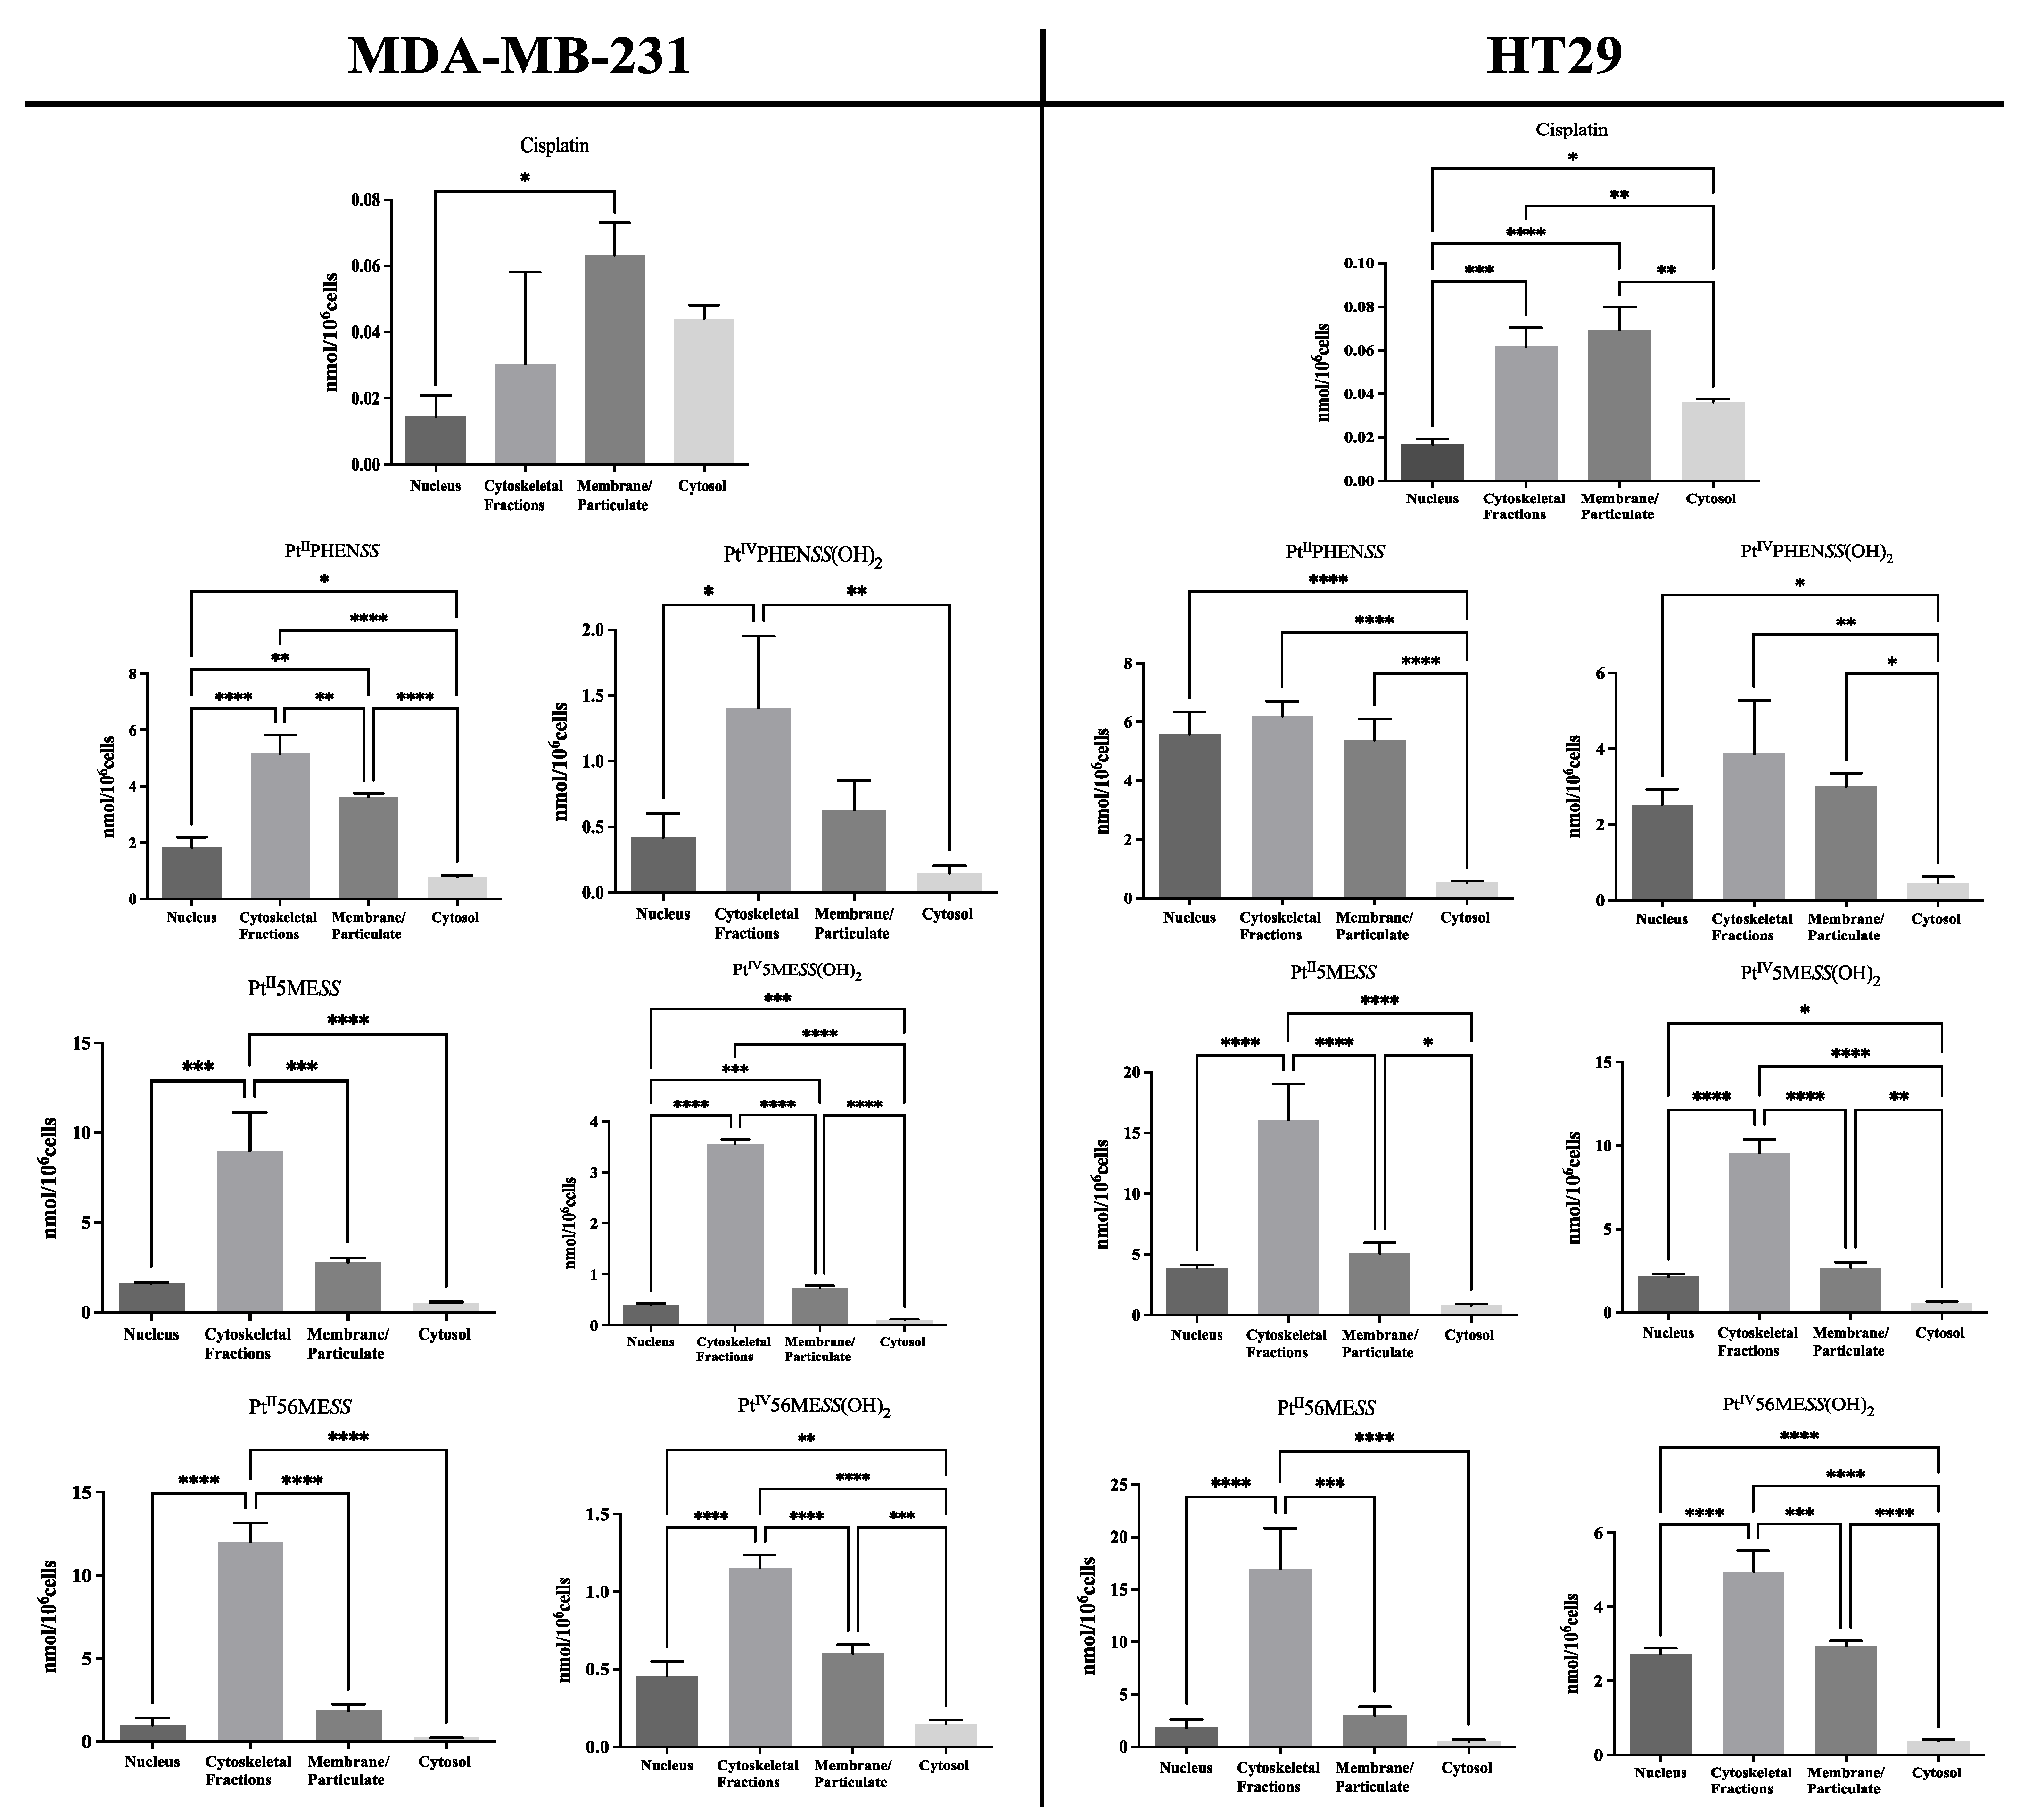
3.5. Cellular Localisation of Platinum(II) and Platinum(IV) Complexes
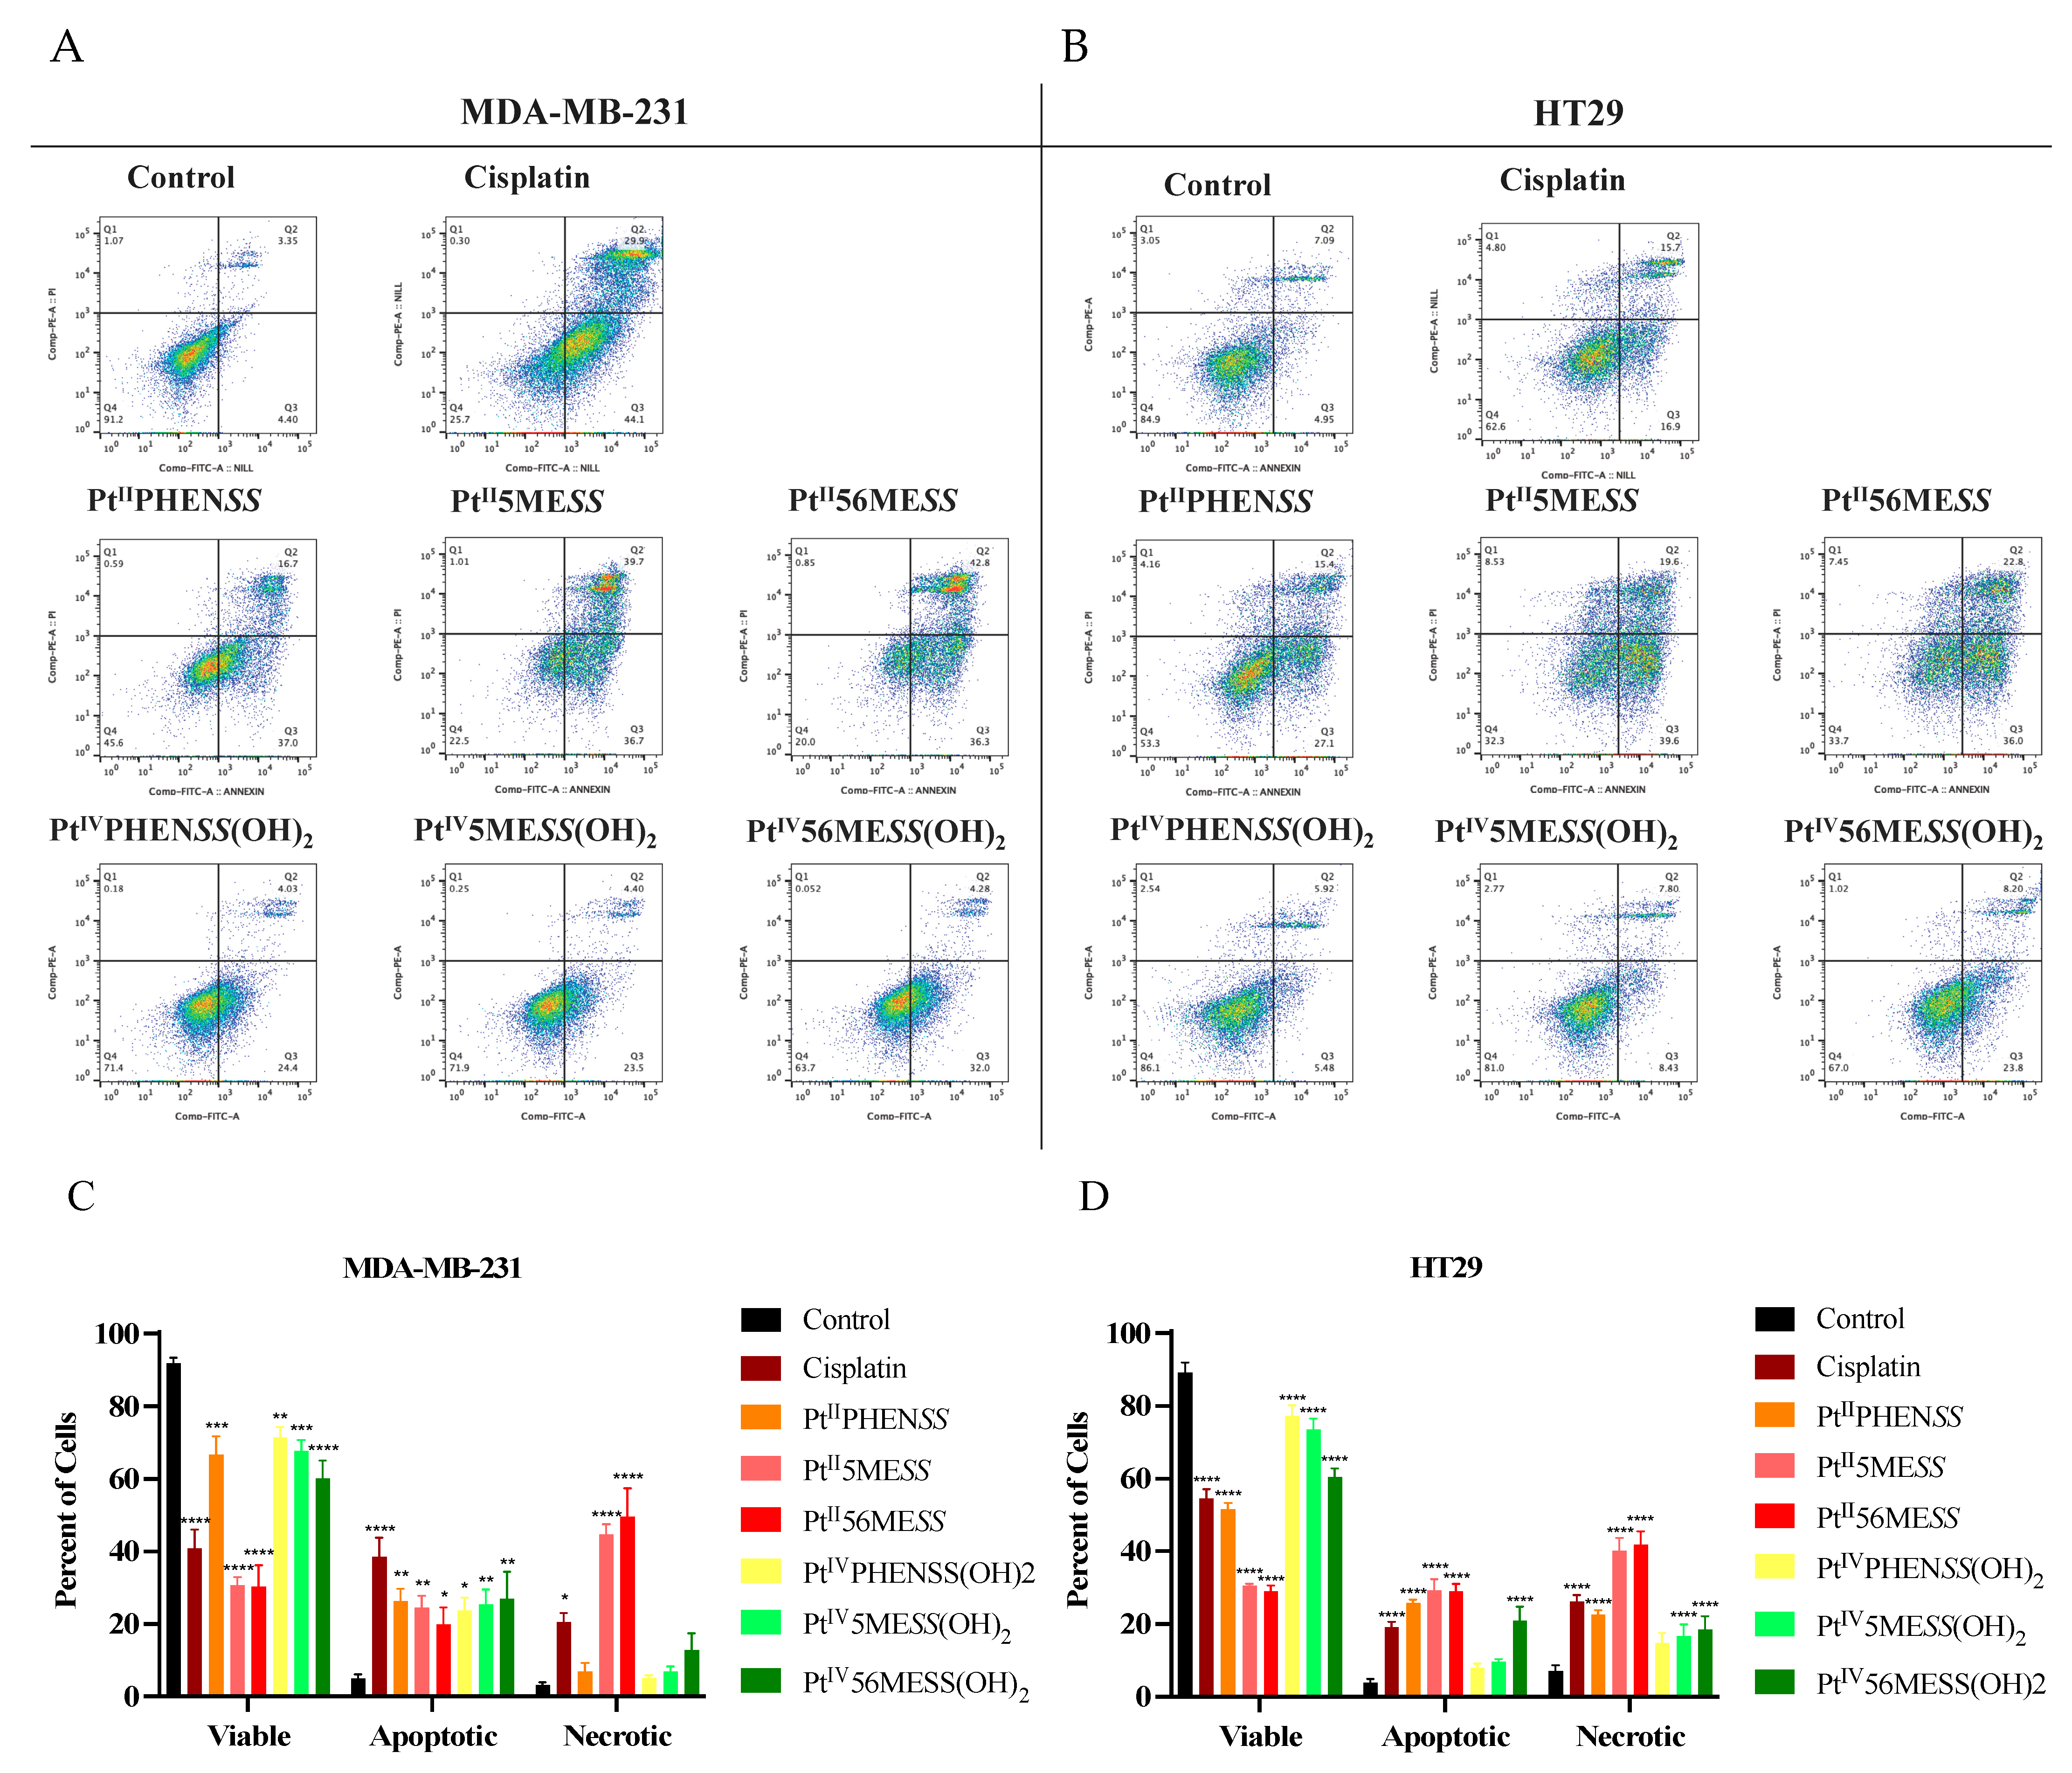
3.6. Cell Death Analysis
3.7. Cell Cycle Arrest
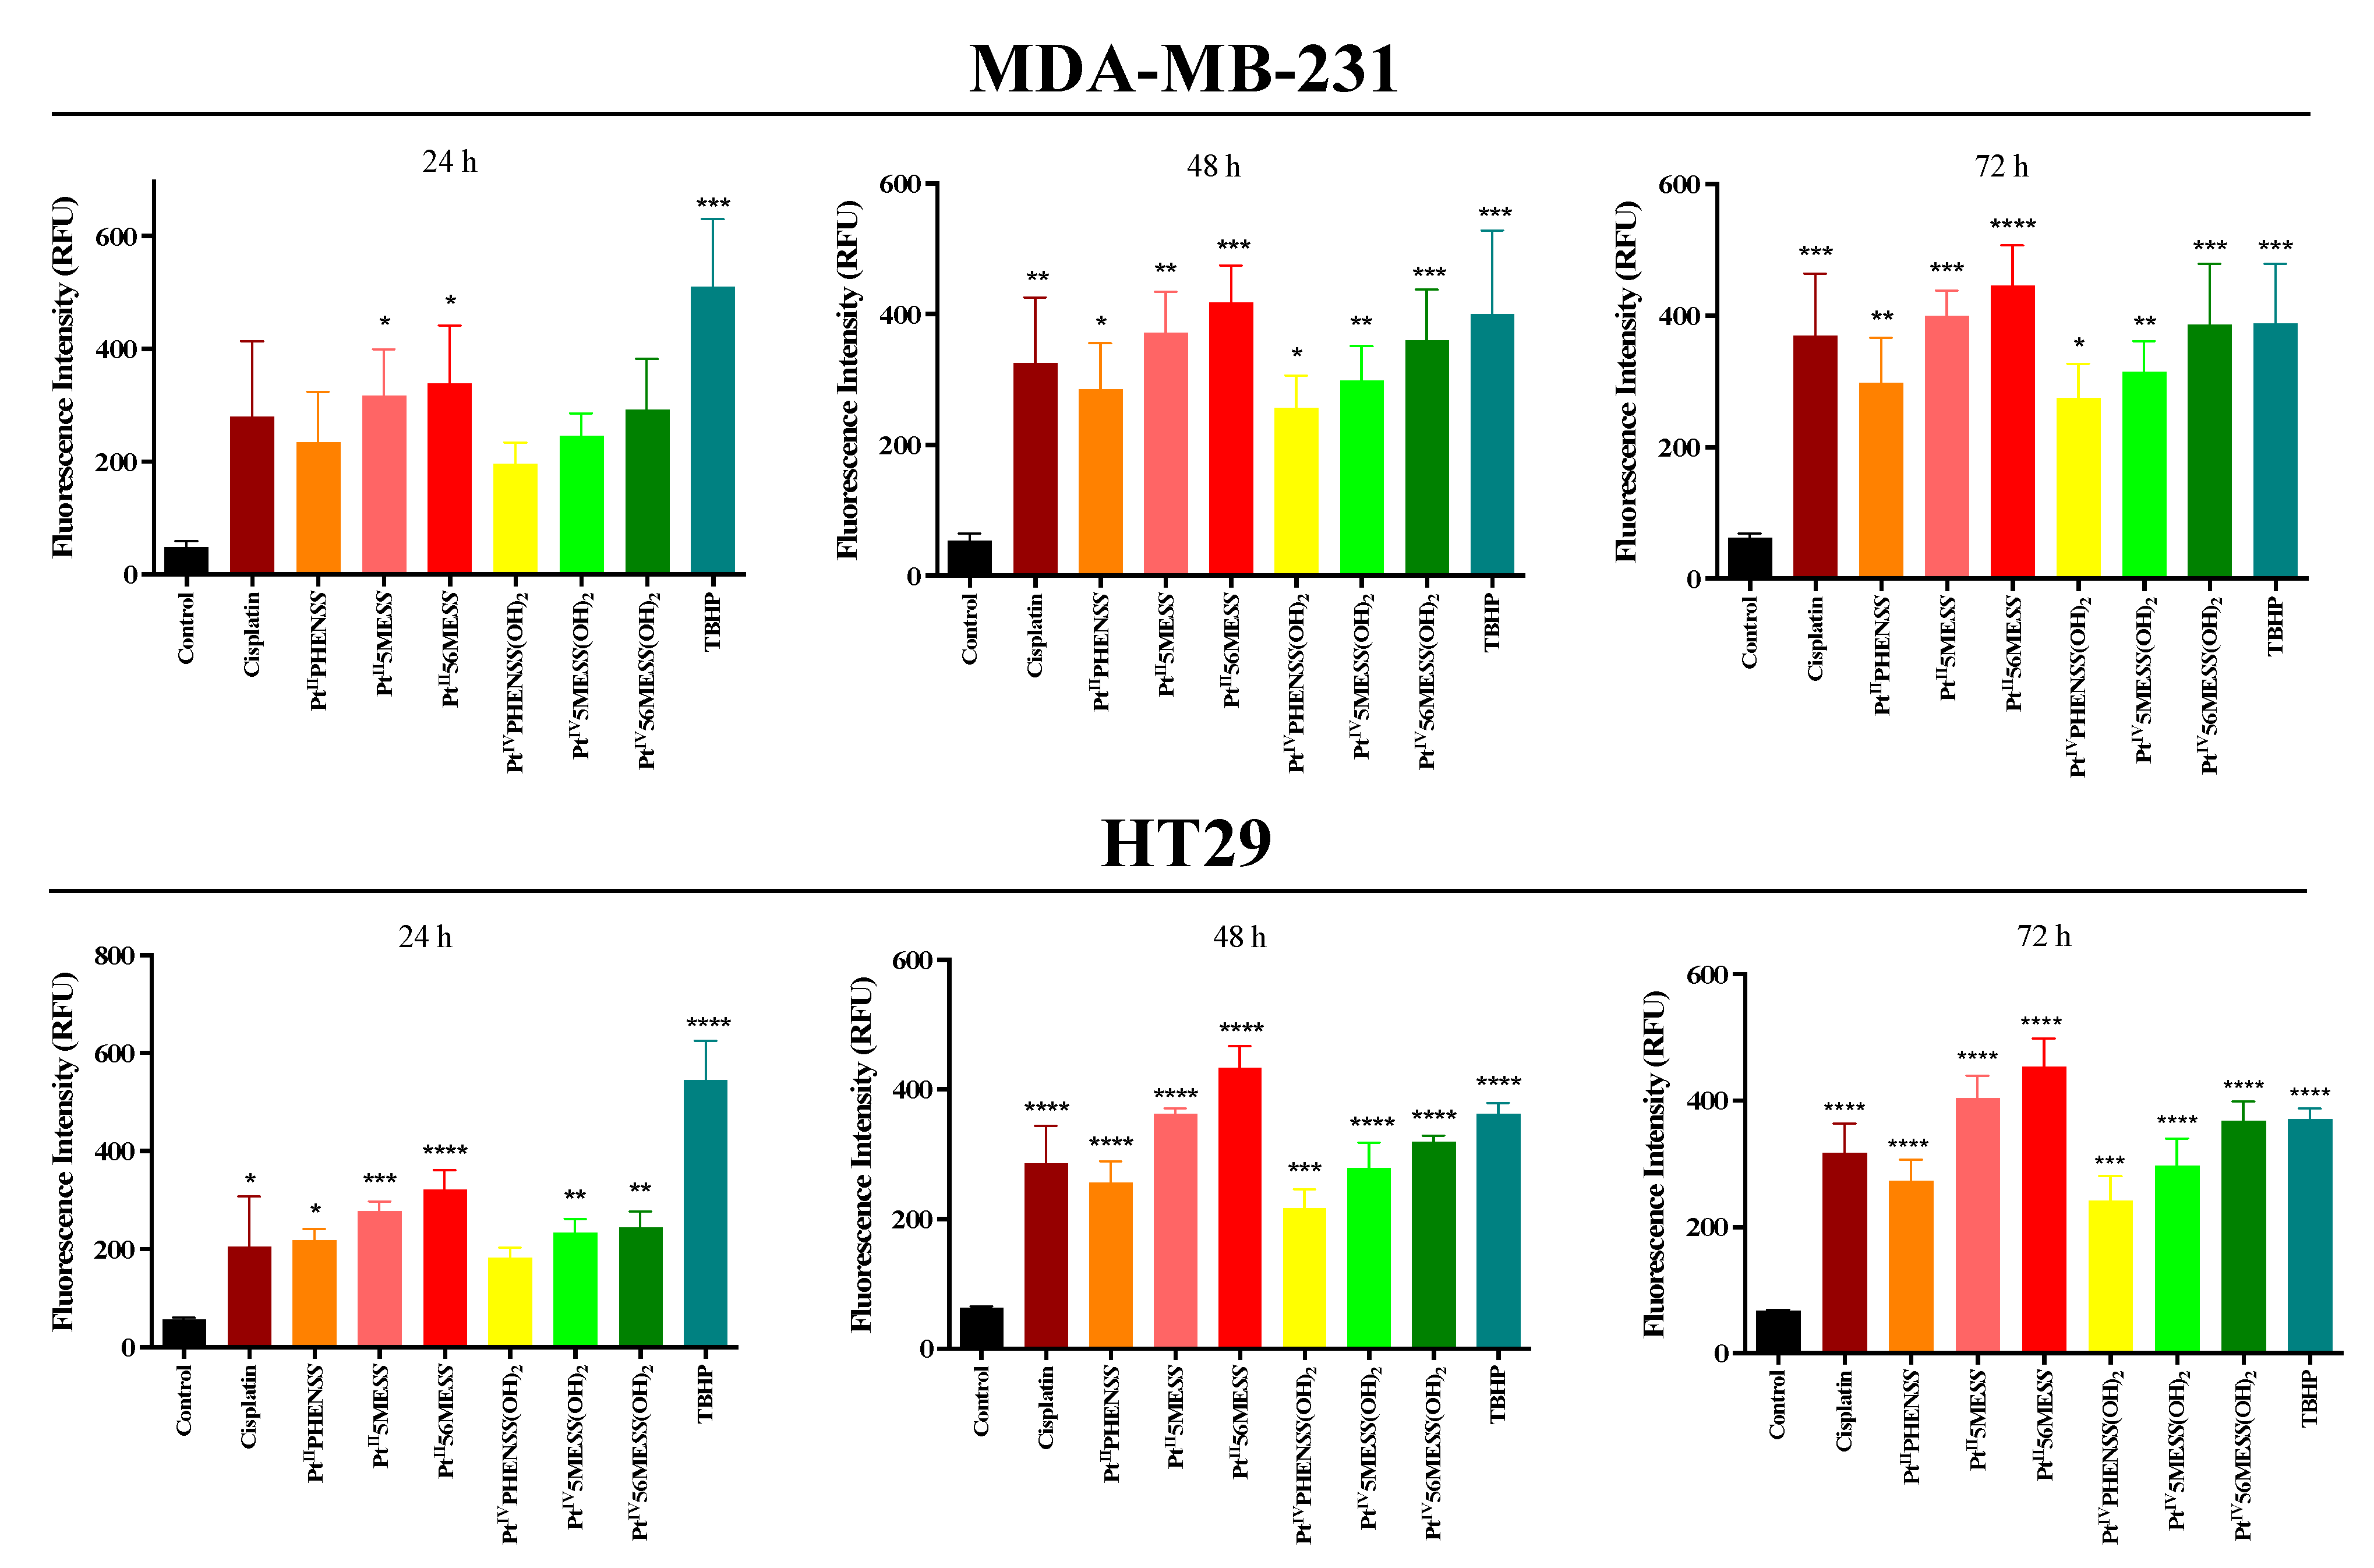
3.8. Reactive Oxygen Species (ROS) Detection Assay
3.9. Mitochondrial Membrane Potential
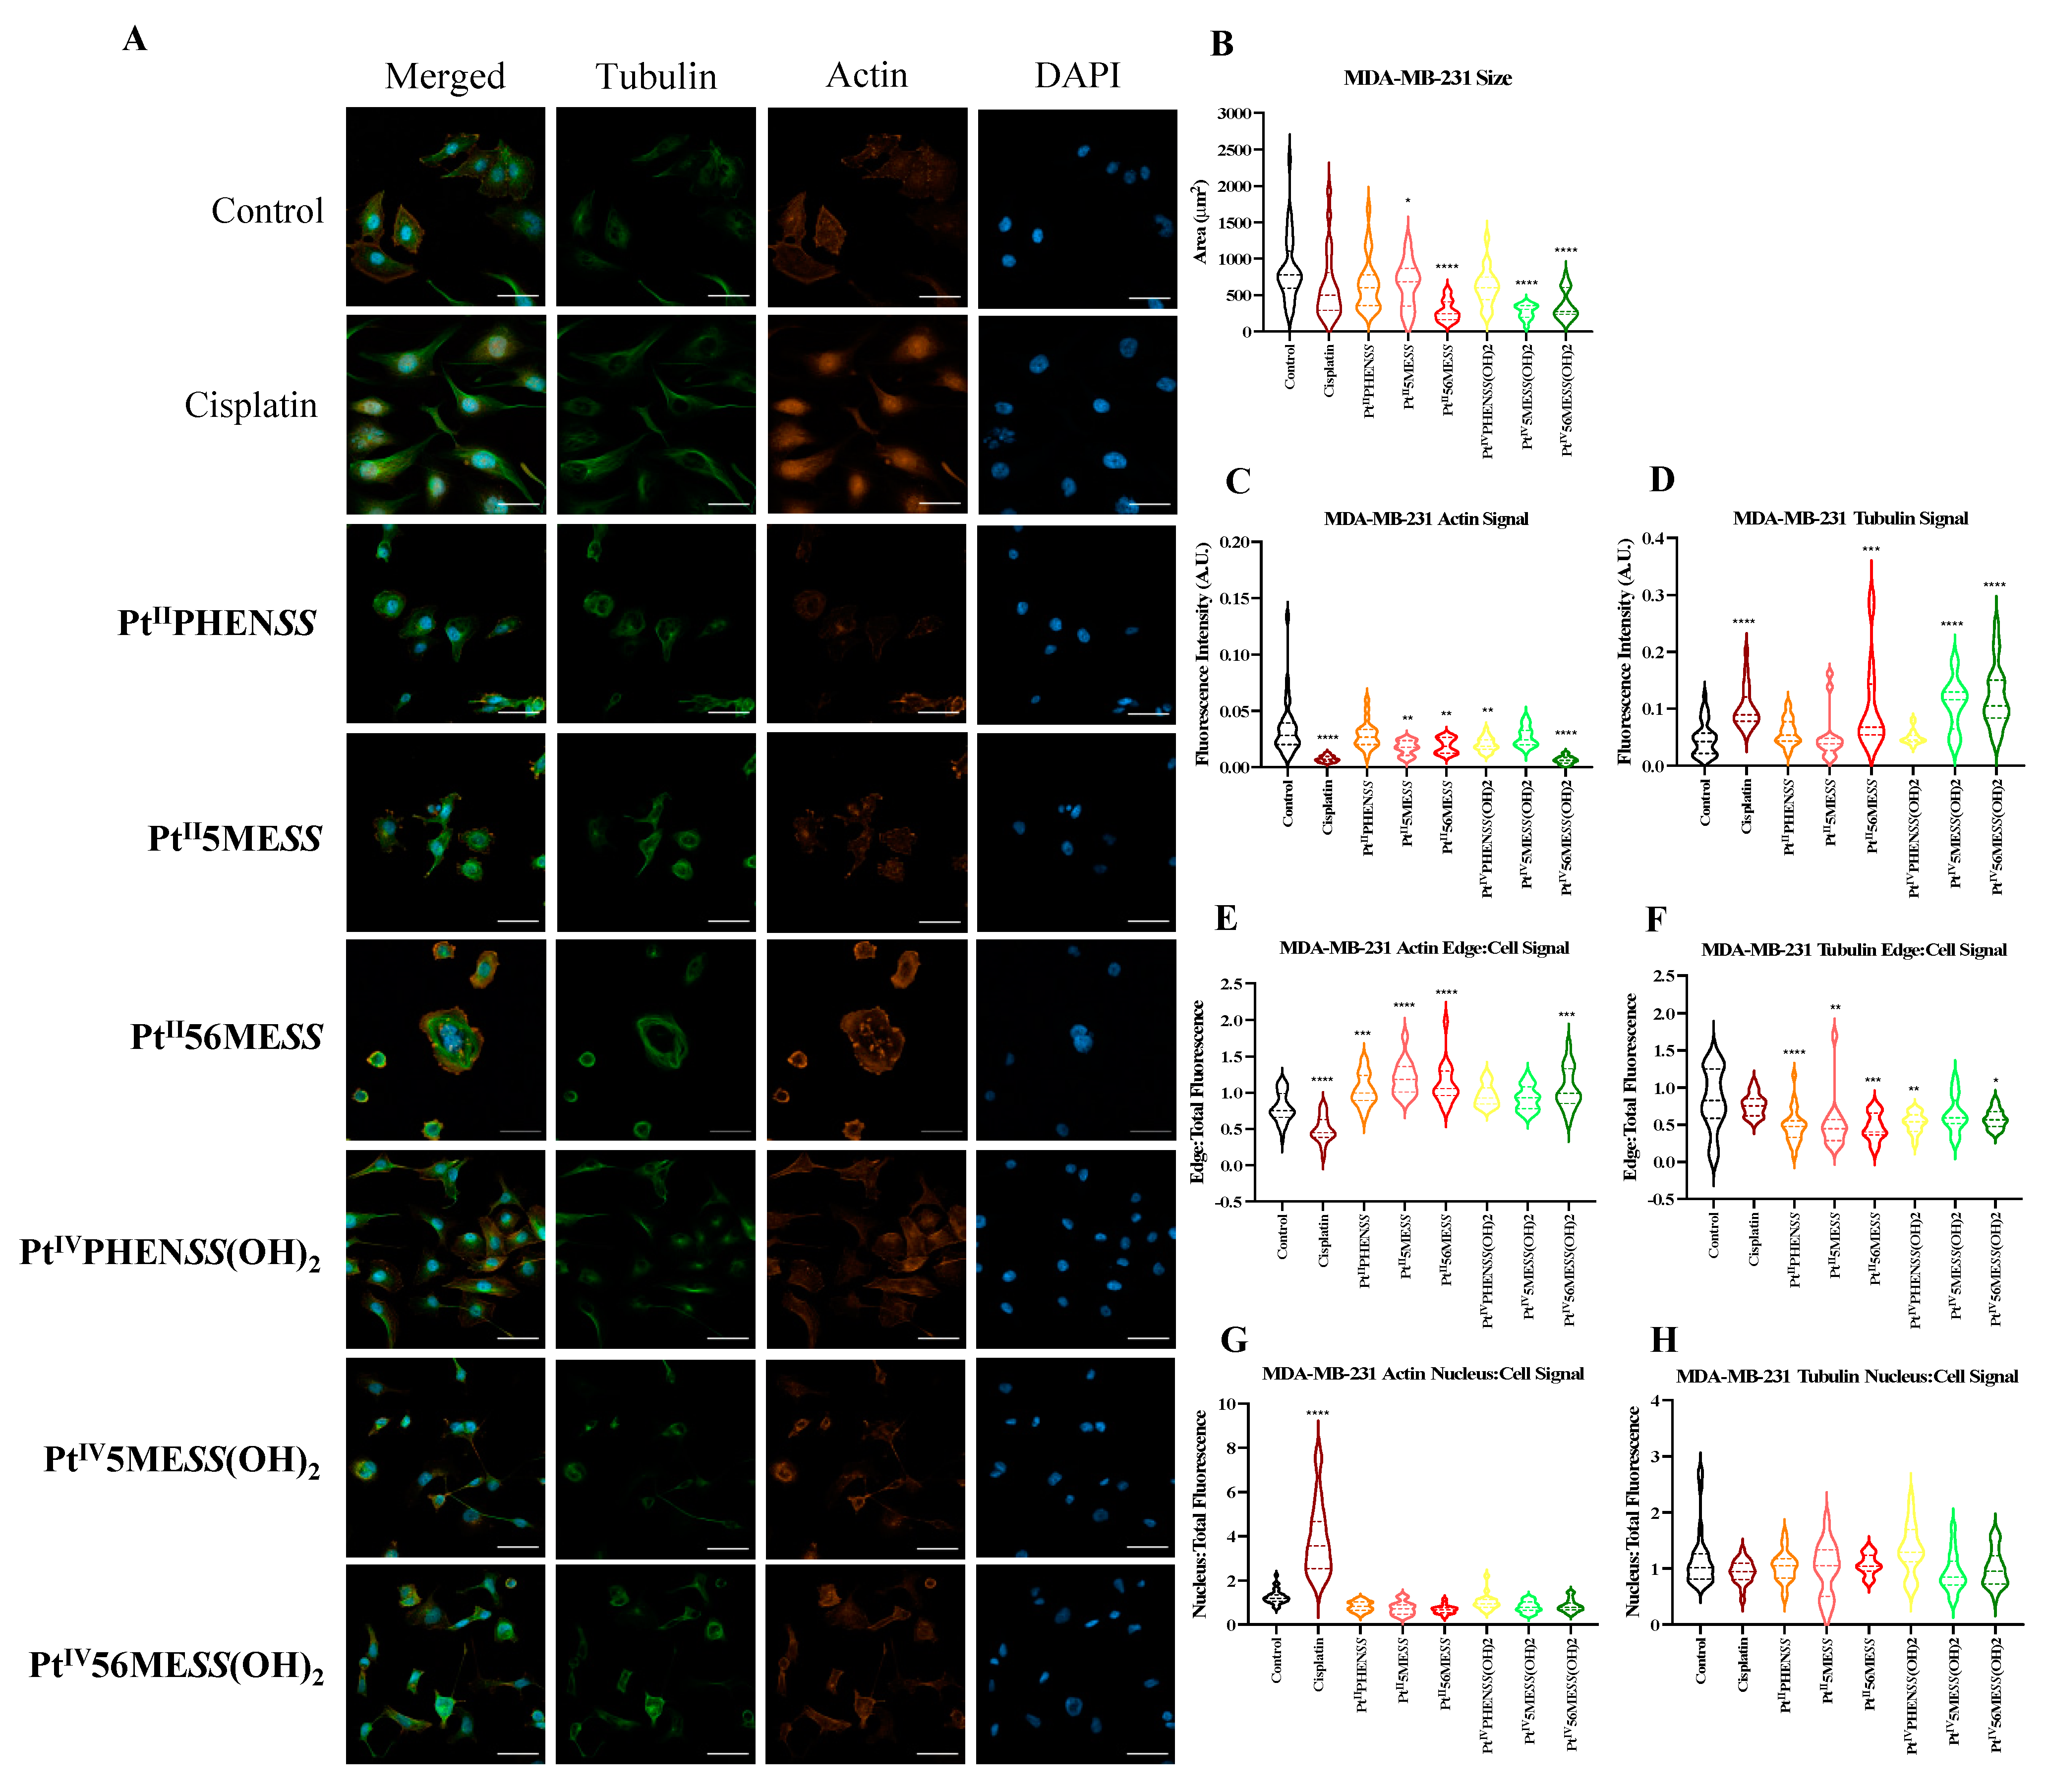
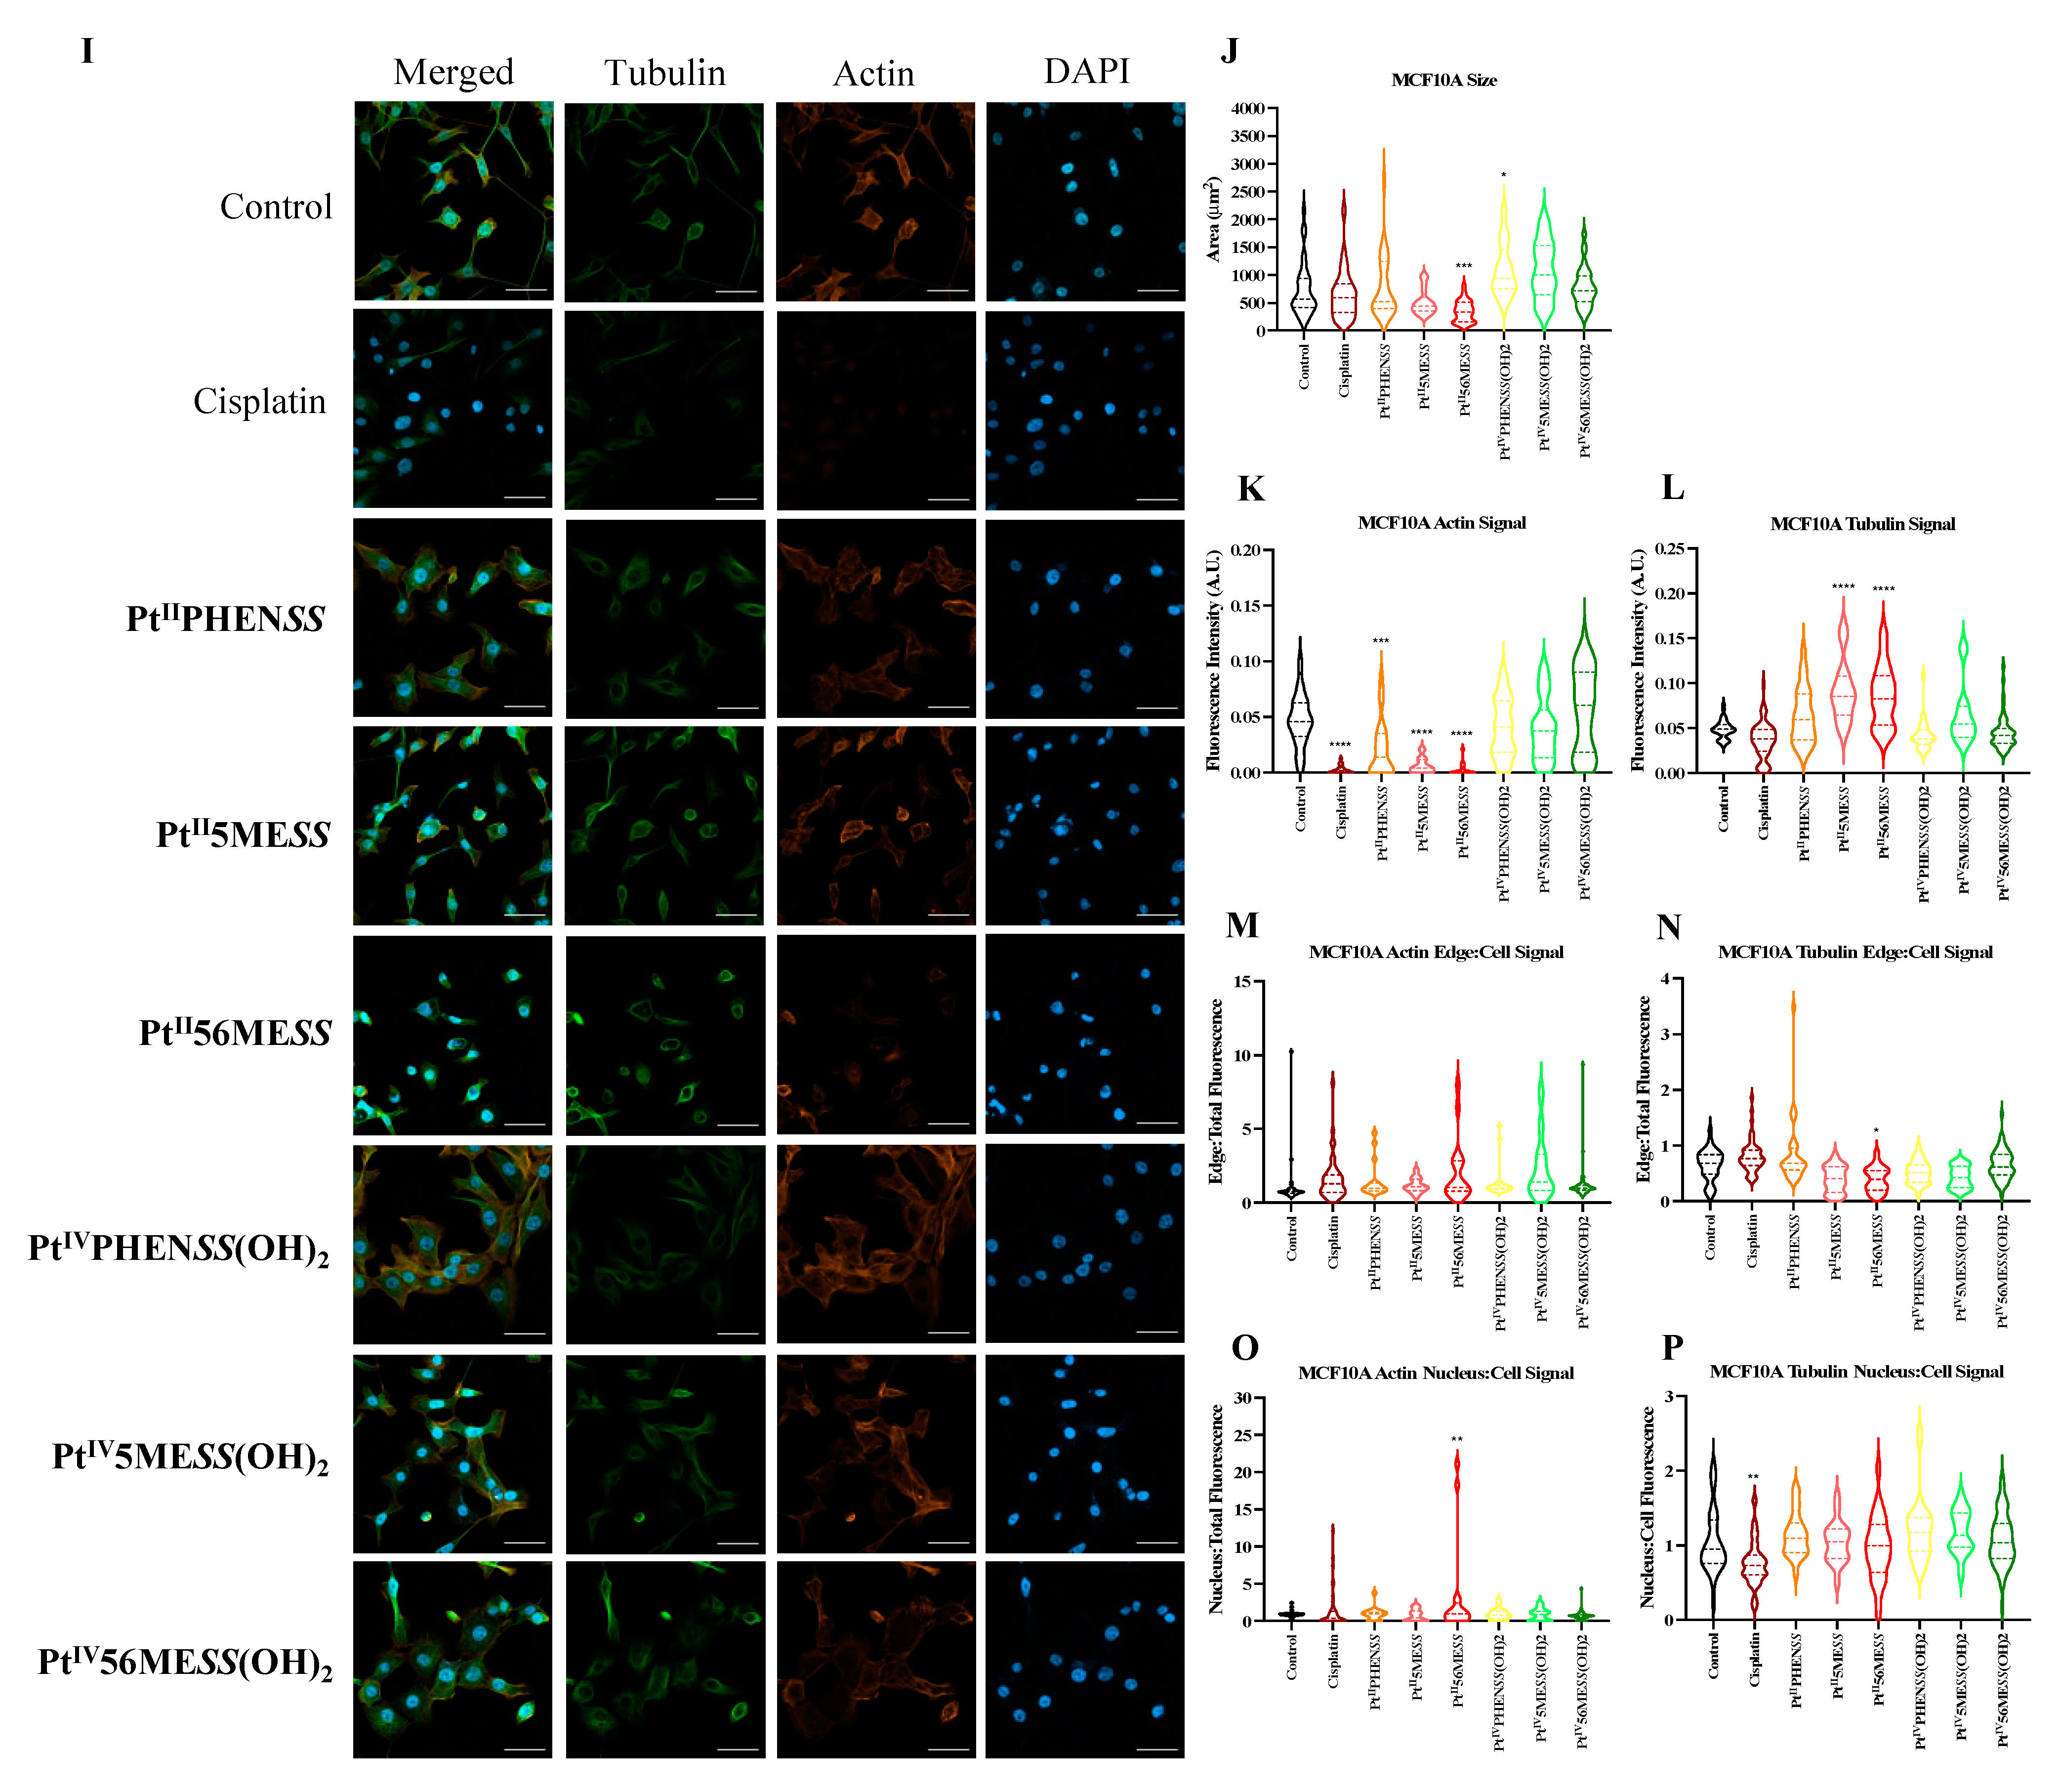
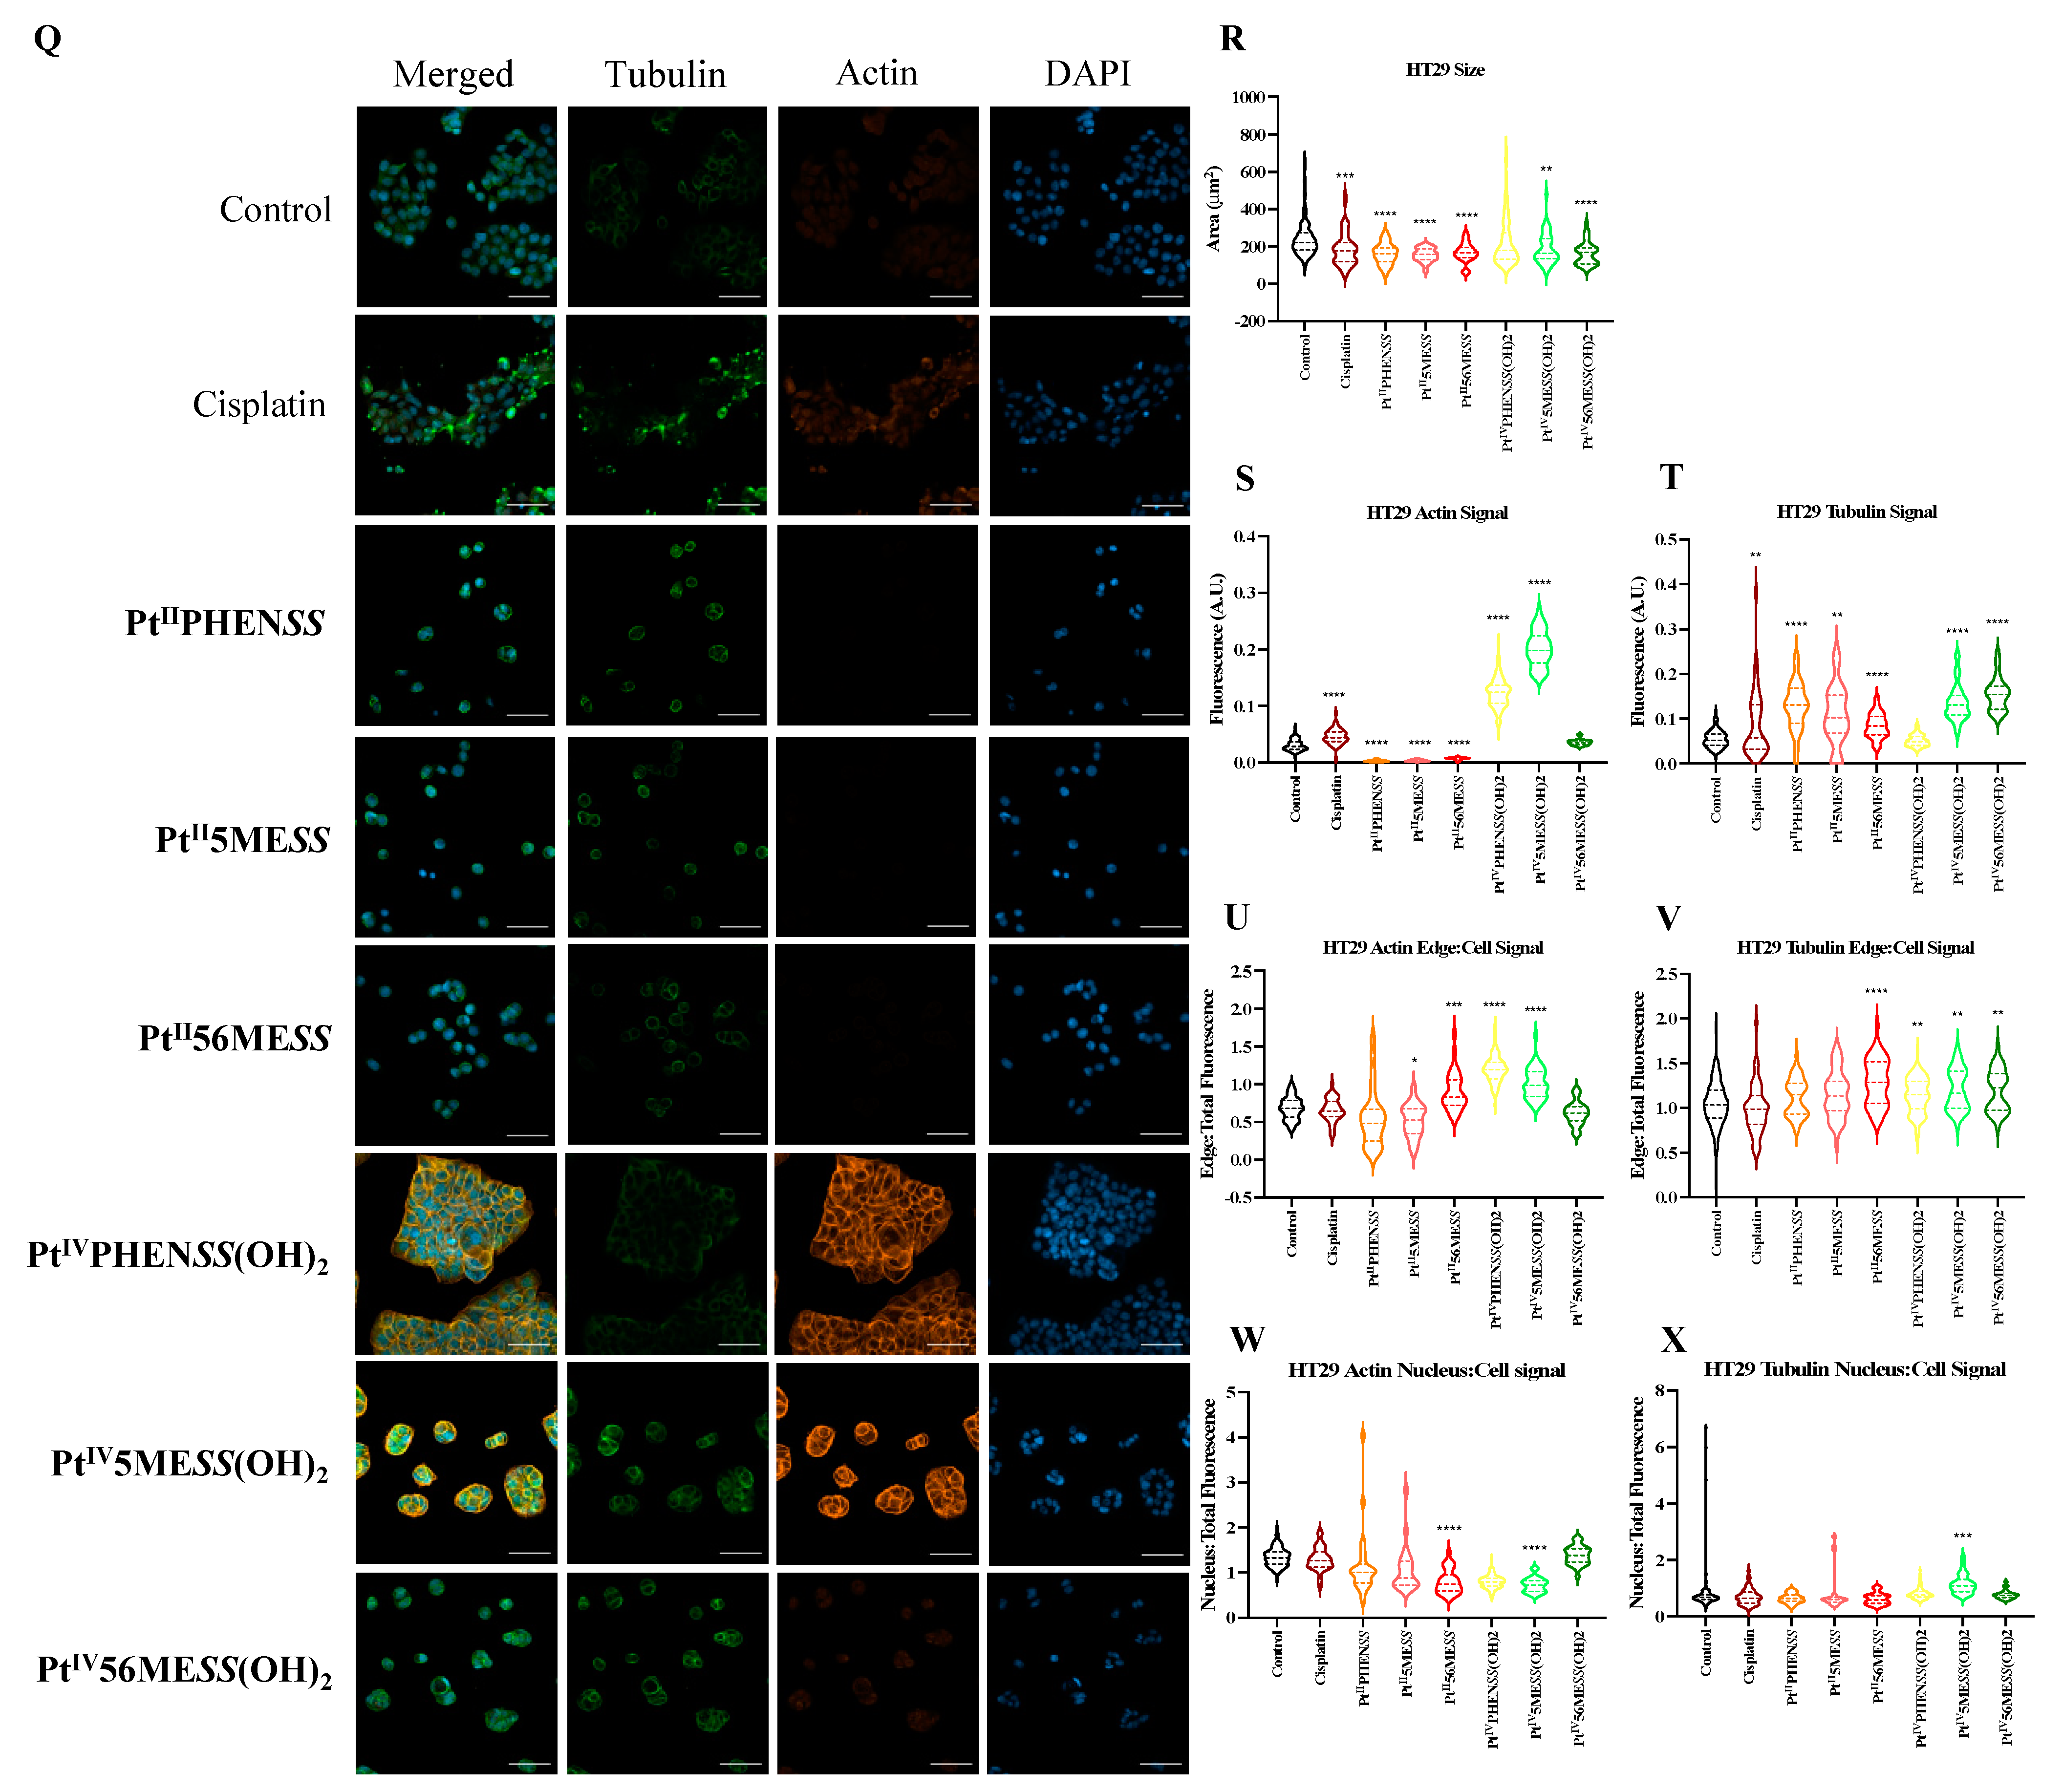
3.10. Morphological Changes in Microtubule Organisation Using Confocal Microscopy
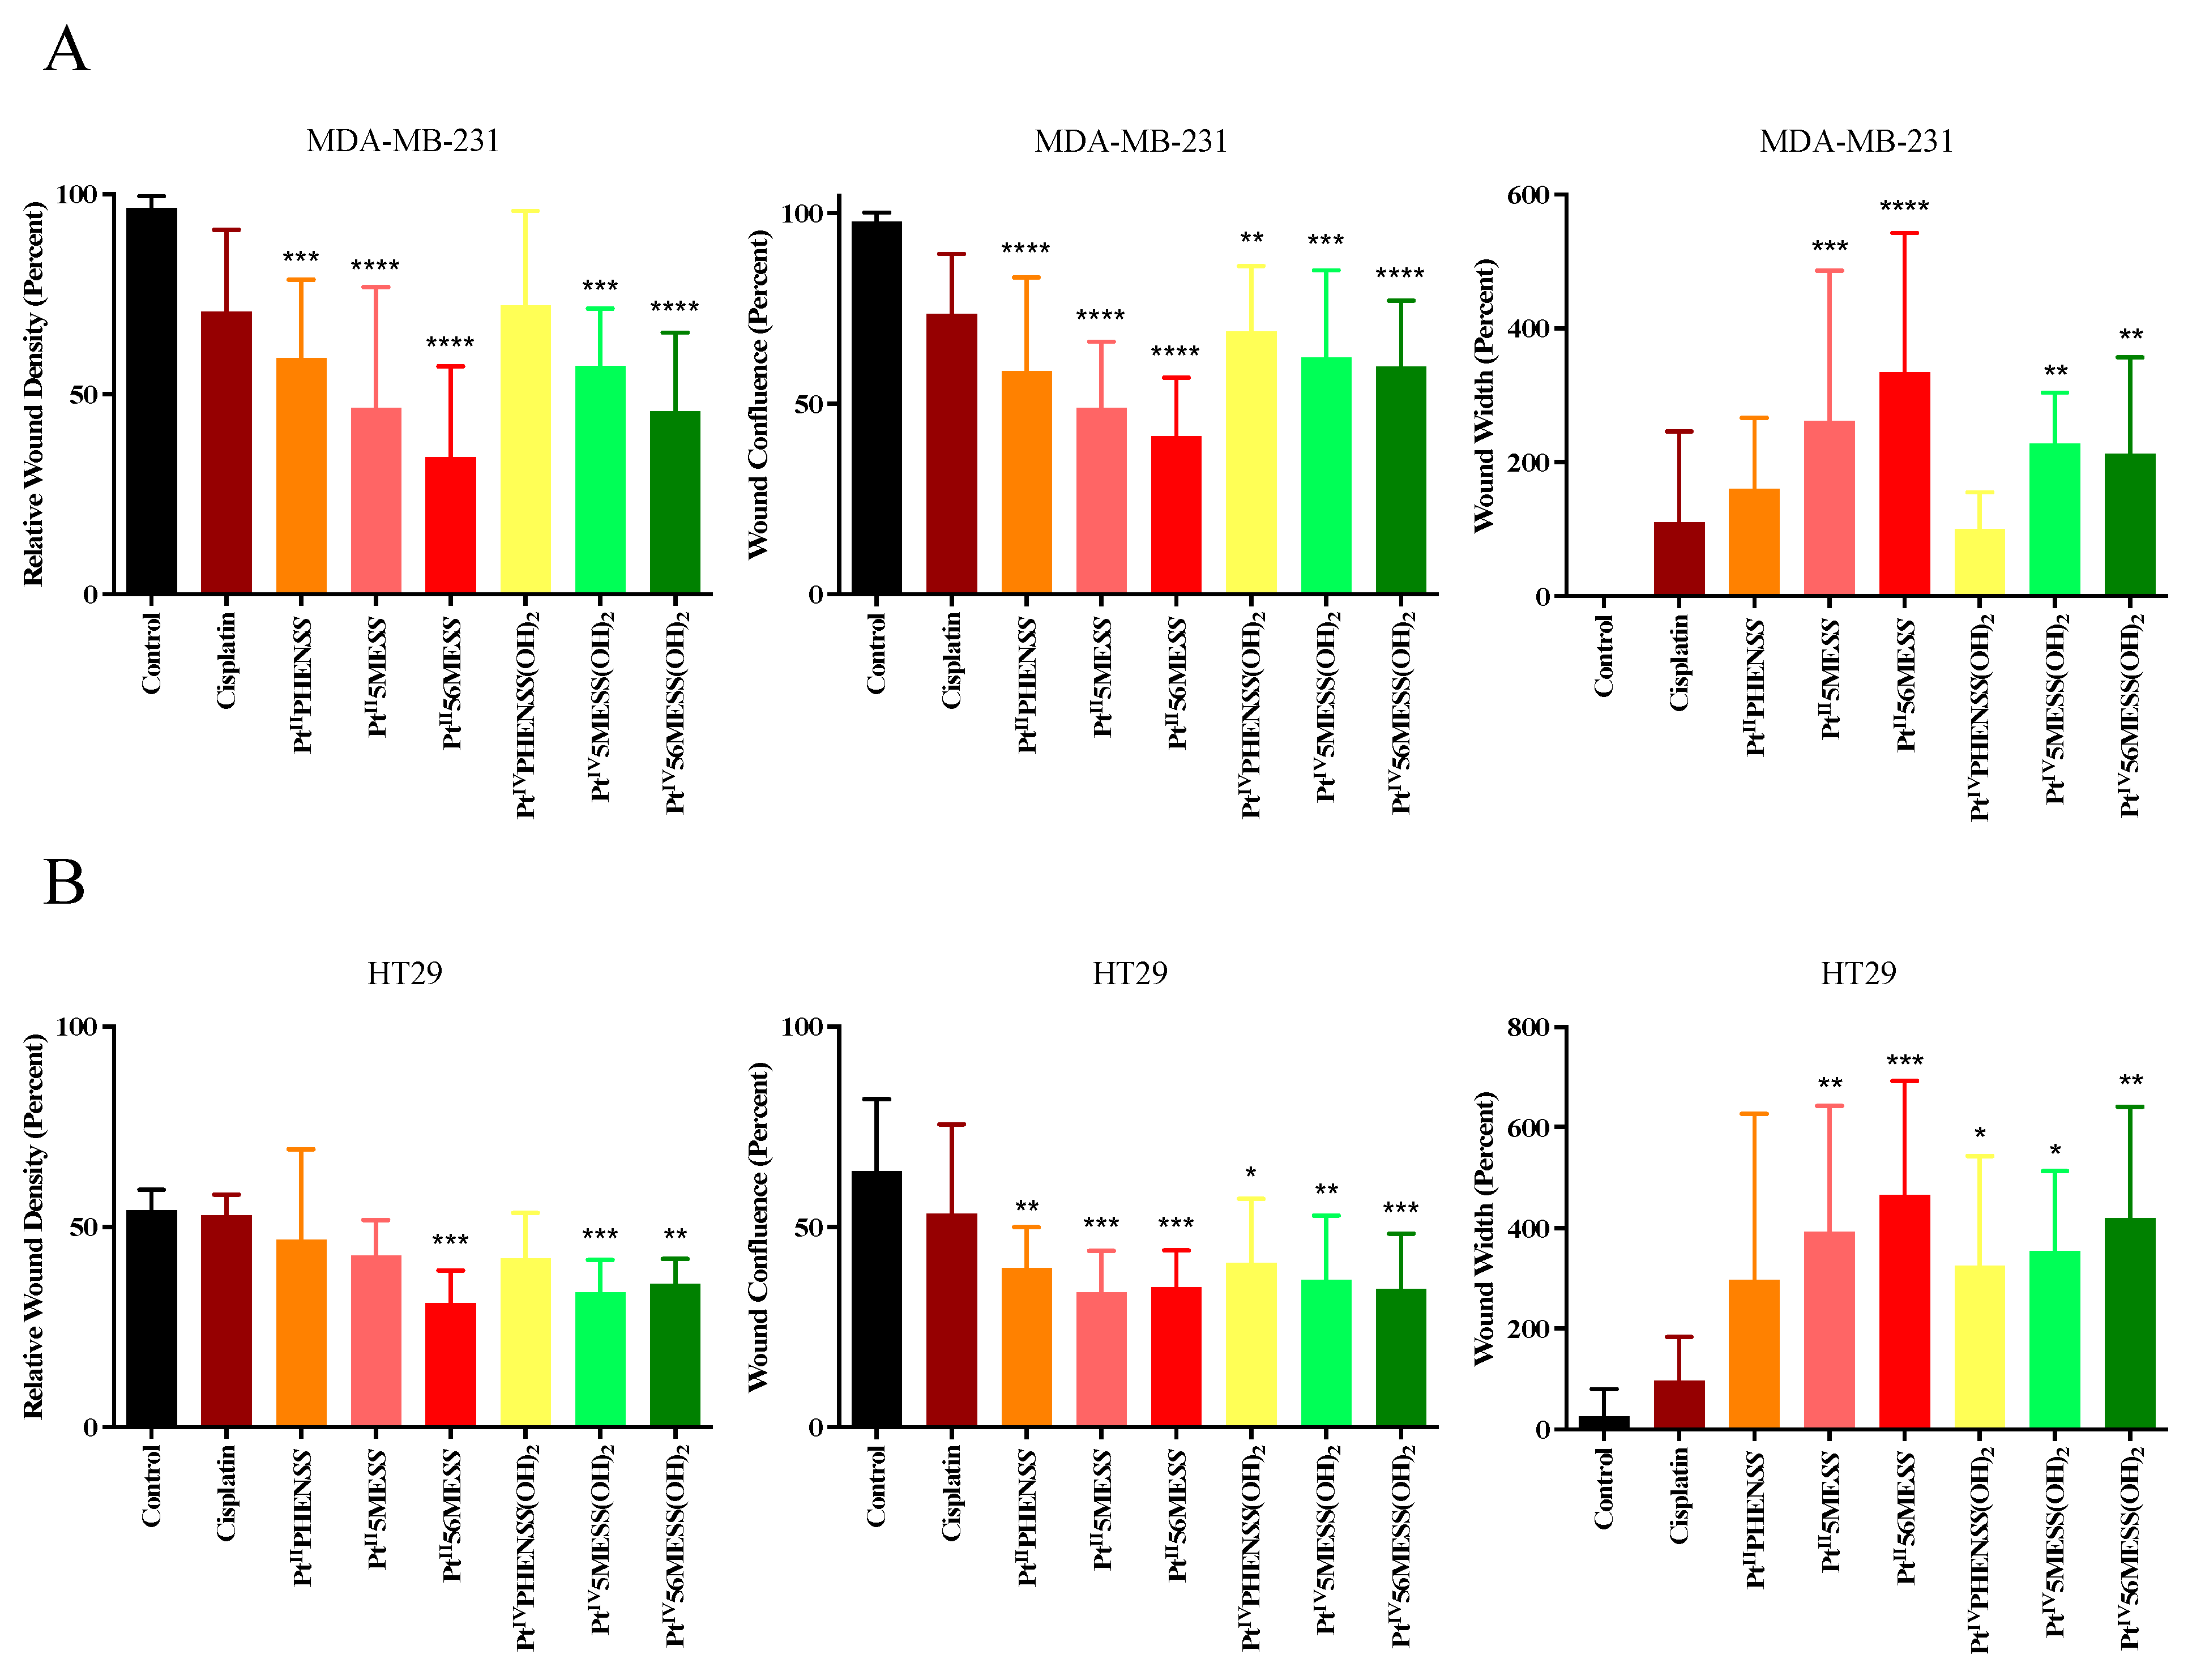
3.11. Wound Healing Assay
3.12. Western Blot
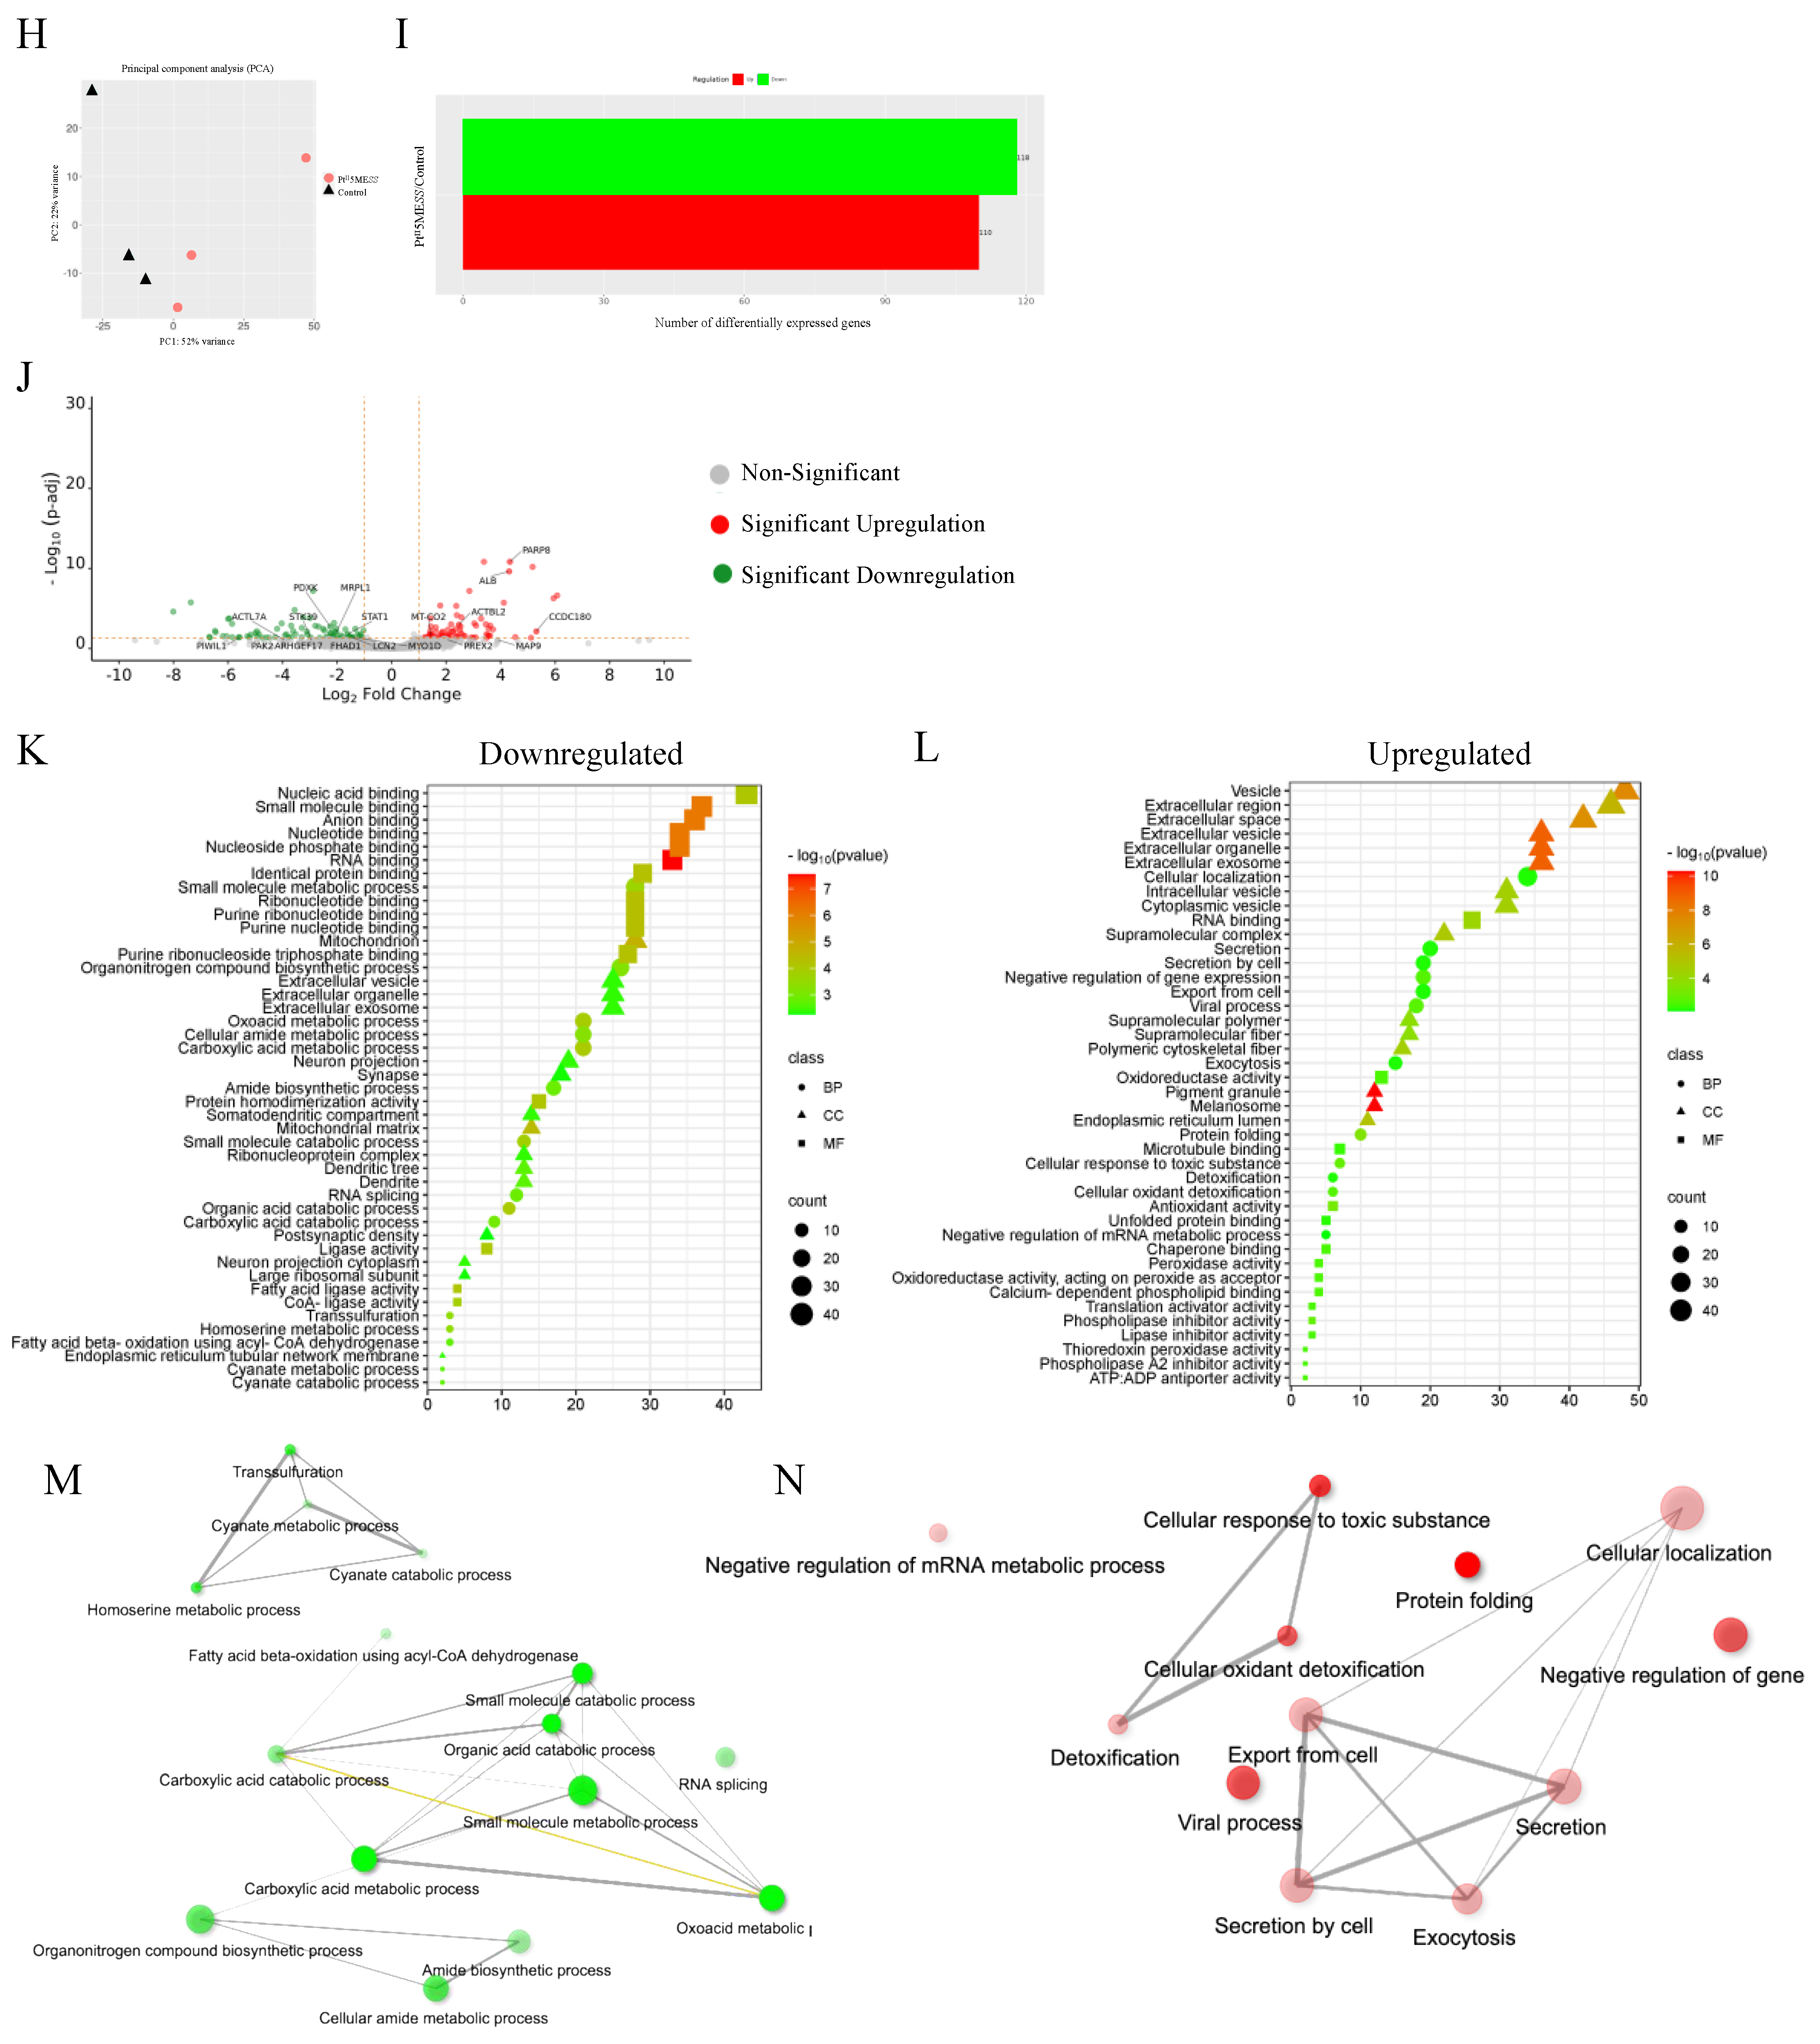
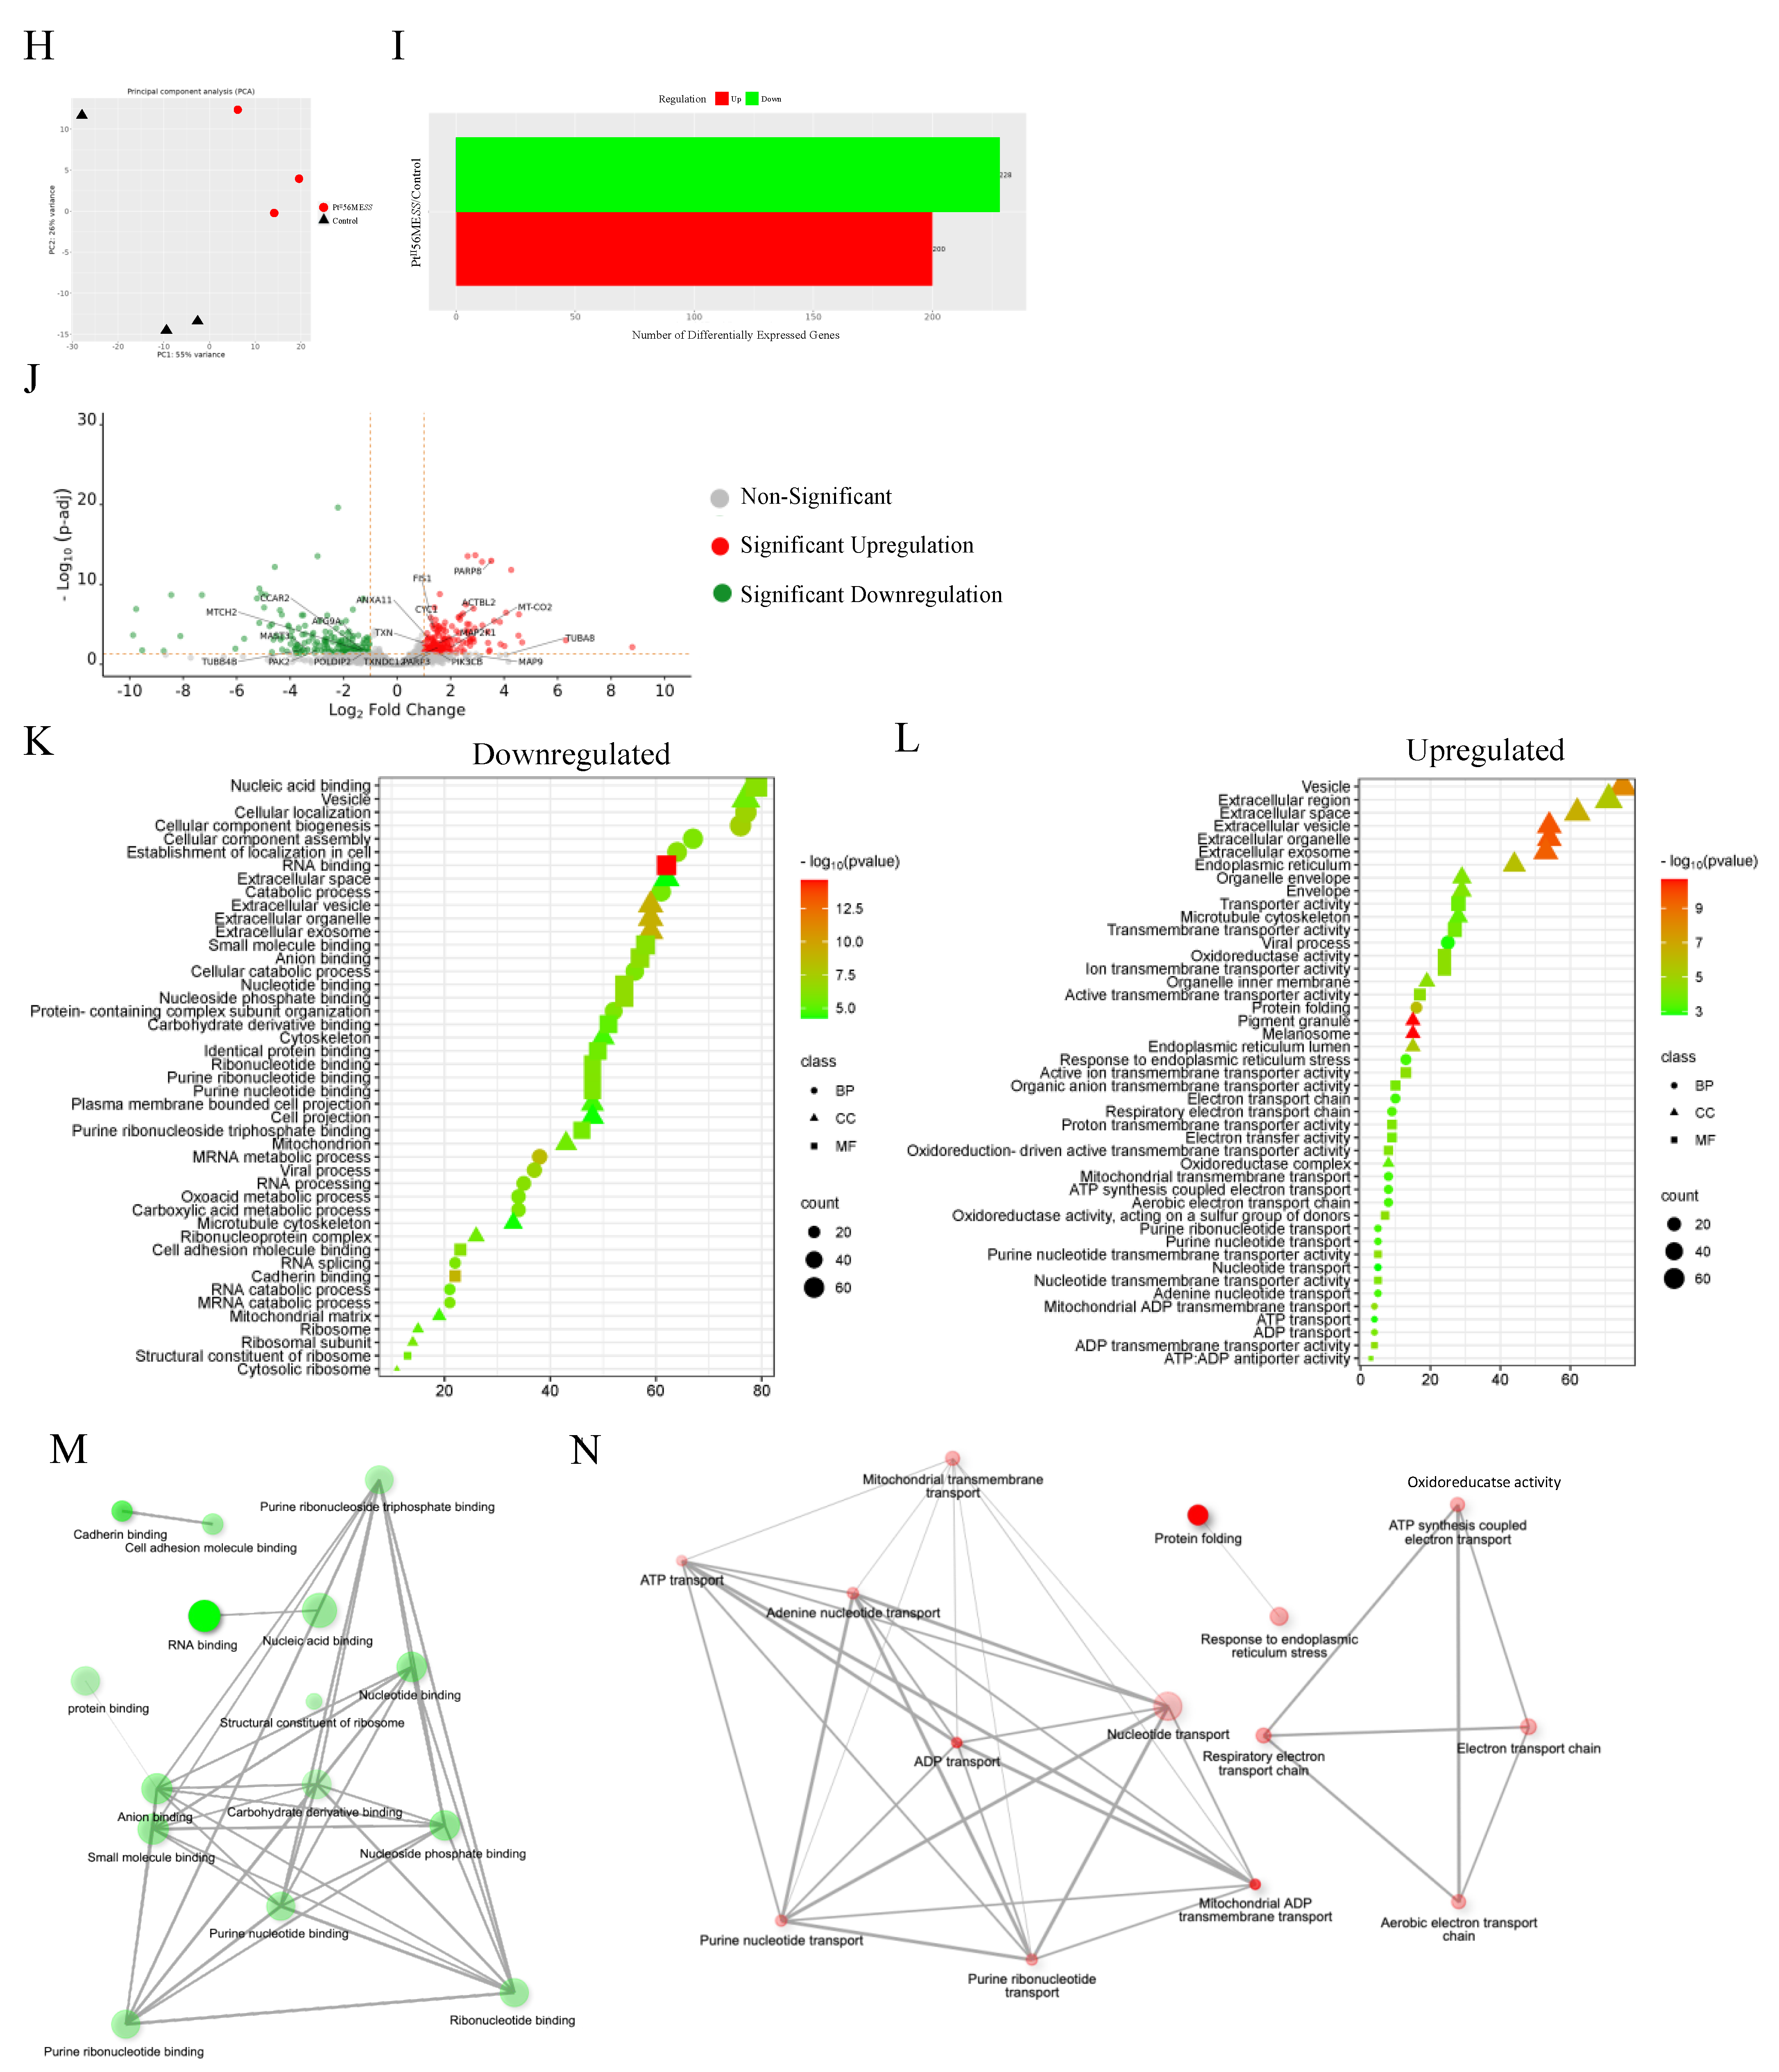
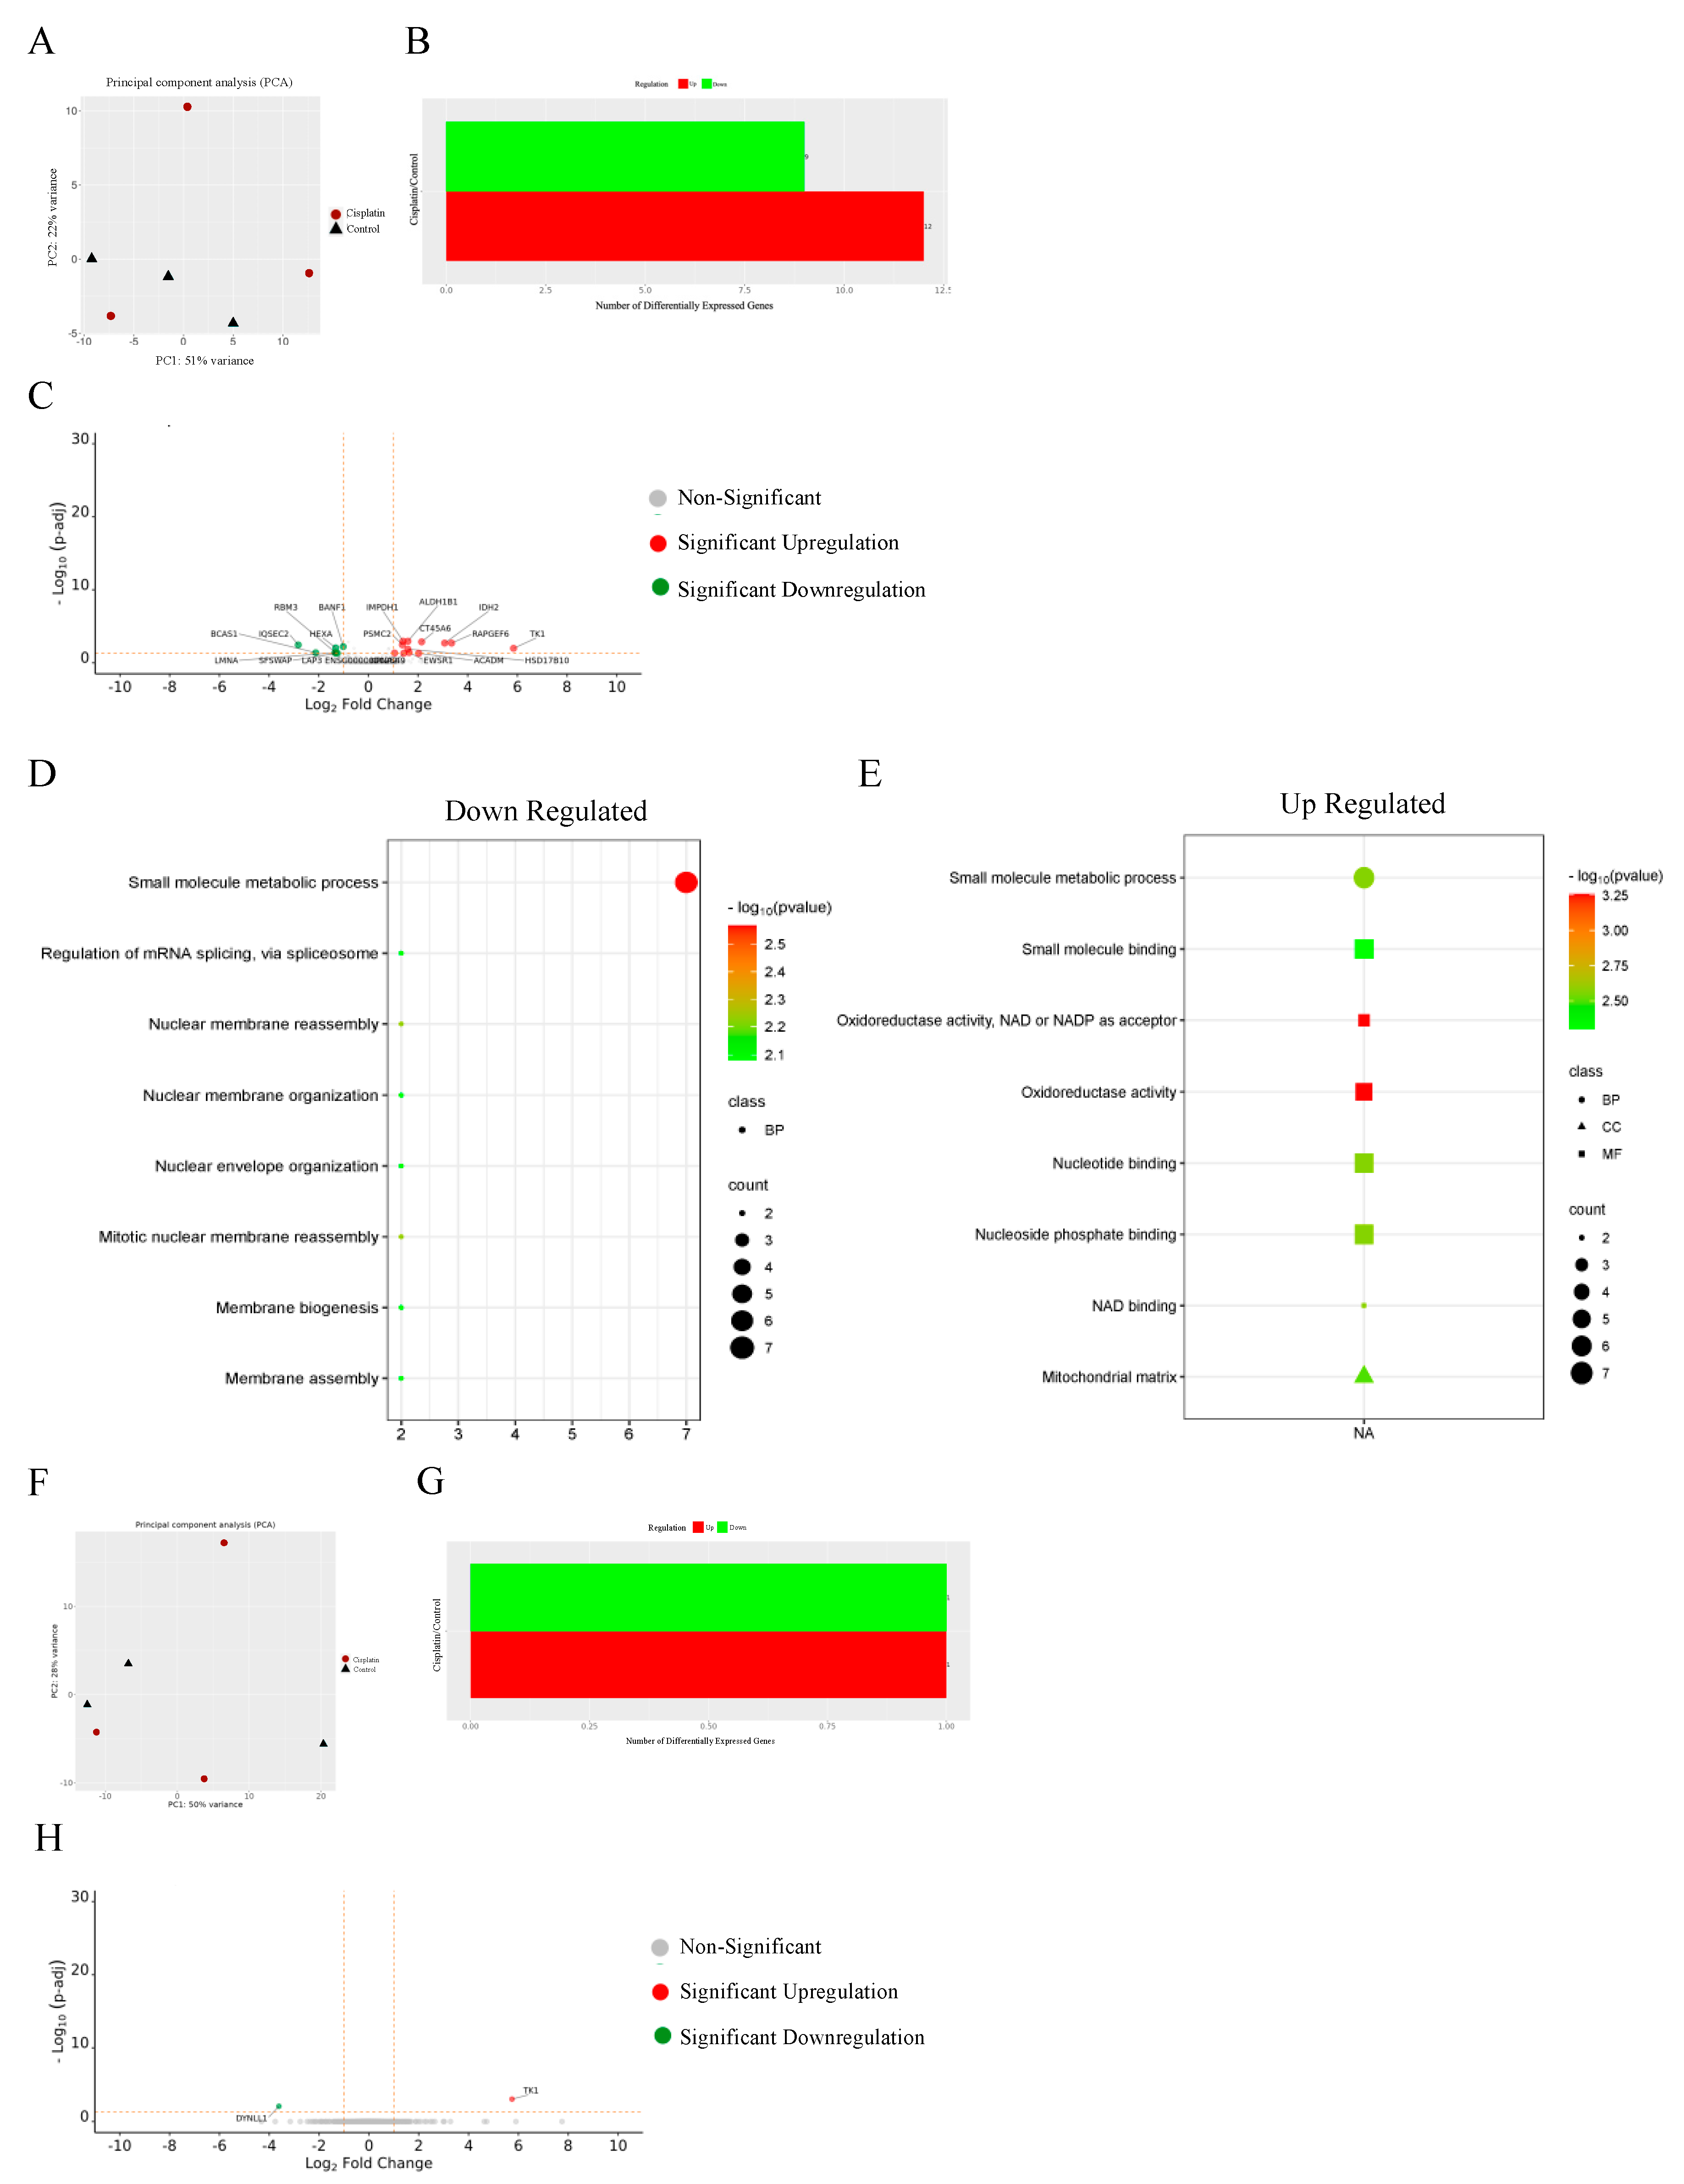
3.13. Proteomics
4. Discussion
5. Conclusions
6. Patents
Supplementary Materials
Author Contributions
Funding
Institutional Review Board Statement
Informed Consent Statement
Data Availability Statement
Acknowledgments
Conflicts of Interest
References
- World Health Organization. Cancer. Available online: https://www.who.int/health-topics/cancer#tab=tab_1 (accessed on 7 March 2024).
- Roser, M.; Ritchie, H. Cancer. Our World in Data. 2015. Available online: https://ourworldindata.org/cancer (accessed on 7 March 2024).
- Rosenberg, B.; Vancamp, L.; Krigas, T. Inhibition of cell division in escherichia coli by electrolysis products from a platinum electrode. Nature 1965, 205, 698–699. [Google Scholar] [CrossRef] [PubMed]
- Wiltshaw, E. Cisplatin in the treatment of cancer-the first metal anti-tumour drug. Platin. Met. Rev. 1979, 23, 90–98. [Google Scholar] [CrossRef]
- Ghosh, S. Cisplatin: The first metal based anticancer drug. Bioorg Chem. 2019, 88, 102925. [Google Scholar] [CrossRef]
- Rottenberg, S.; Disler, C.; Perego, P. The rediscovery of platinum-based cancer therapy. Nat. Rev. Cancer 2021, 21, 37–50. [Google Scholar] [CrossRef] [PubMed]
- Ranasinghe, R.; Mathai, M.L.; Zulli, A. Cisplatin for cancer therapy and overcoming chemoresistance. Heliyon 2022, 8, e10608. [Google Scholar] [CrossRef] [PubMed]
- Zhang, C.; Xu, C.; Gao, X.; Yao, Q. Platinum-based drugs for cancer therapy and anti-tumor strategies. Theranostics 2022, 12, 2115–2132. [Google Scholar] [CrossRef] [PubMed]
- Elias, M.G.; Mehanna, S.; Elias, E.; Khnayzer, R.S.; Daher, C.F. A photoactivatable chemotherapeutic Ru(II) complex bearing bathocuproine ligand efficiently induces cell death in human malignant melanoma cells through a multi-mechanistic pathway. Chem. Biol. Interact. 2021, 348, 109644. [Google Scholar] [CrossRef] [PubMed]
- Nonnekens, J.; Hoeijmakers, J.H. After surviving cancer, what about late life effects of the cure? EMBO Mol. Med. 2017, 9, 4–6. [Google Scholar] [CrossRef] [PubMed]
- Tanida, S.; Mizoshita, T.; Ozeki, K.; Tsukamoto, H.; Kamiya, T.; Kataoka, H.; Sakamuro, D.; Joh, T. Mechanisms of Cisplatin-Induced Apoptosis and of Cisplatin Sensitivity: Potential of BIN1 to Act as a Potent Predictor of Cisplatin Sensitivity in Gastric Cancer Treatment. Int. J. Surg. Oncol. 2012, 2012, 862879. [Google Scholar] [CrossRef]
- Shen, D.W.; Pouliot, L.M.; Hall, M.D.; Gottesman, M.M. Cisplatin resistance: A cellular self-defense mechanism resulting from multiple epigenetic and genetic changes. Pharmacol. Rev. 2012, 64, 706–721. [Google Scholar] [CrossRef]
- Chen, H.H.; Kuo, M.T. Role of glutathione in the regulation of Cisplatin resistance in cancer chemotherapy. Met. Based Drugs 2010, 2010, 430939. [Google Scholar] [CrossRef] [PubMed]
- Rocha, C.R.R.; Silva, M.M.; Quinet, A.; Cabral-Neto, J.B.; Menck, C.F.M. DNA repair pathways and cisplatin resistance: An intimate relationship. Clinics 2018, 73, e478s. [Google Scholar] [CrossRef] [PubMed]
- Ravera, M.; Gabano, E.; McGlinchey, M.J.; Osella, D. Pt(IV) antitumor prodrugs: Dogmas, paradigms, and realities. Dalton Trans. 2022, 51, 2121–2134. [Google Scholar] [CrossRef] [PubMed]
- Aputen, A.D.; Elias, M.G.; Gilbert, J.; Sakoff, J.A.; Gordon, C.P.; Scott, K.F.; Aldrich-Wright, J.R. Bioactive Platinum(IV) Complexes Incorporating Halogenated Phenylacetates. Molecules 2022, 27, 7120. [Google Scholar] [CrossRef] [PubMed]
- Aputen, A.D.; Elias, M.G.; Gilbert, J.; Sakoff, J.A.; Gordon, C.P.; Scott, K.F.; Aldrich-Wright, J.R. Potent Chlorambucil-Platinum(IV) Prodrugs. Int. J. Mol. Sci. 2022, 23, 10471. [Google Scholar] [CrossRef] [PubMed]
- Aputen, A.D.; Elias, M.G.; Gilbert, J.; Sakoff, J.A.; Gordon, C.P.; Scott, K.F.; Aldrich-Wright, J.R. Versatile Platinum(IV) Prodrugs of Naproxen and Acemetacin as Chemo-Anti-Inflammatory Agents. Cancers 2023, 15, 2460. [Google Scholar] [CrossRef] [PubMed]
- Aputen, A.D.; Elias, M.G.; Gilbert, J.; Sakoff, J.A.; Gordon, C.P.; Scott, K.F.; Aldrich-Wright, J.R. Platinum(IV) Prodrugs Incorporating an Indole-Based Derivative, 5-Benzyloxyindole-3-Acetic Acid in the Axial Position Exhibit Prominent Anticancer Activity. Int. J. Mol. Sci. 2024, 25, 2181. [Google Scholar] [CrossRef] [PubMed]
- Johnstone, T.C.; Suntharalingam, K.; Lippard, S.J. The Next Generation of Platinum Drugs: Targeted Pt(II) Agents, Nanoparticle Delivery, and Pt(IV) Prodrugs. Chem. Rev. 2016, 116, 3436–3486. [Google Scholar] [CrossRef] [PubMed]
- Wang, Z.; Deng, Z.; Zhu, G. Emerging platinum(iv) prodrugs to combat cisplatin resistance: From isolated cancer cells to tumor microenvironment. Dalton Trans. 2019, 48, 2536–2544. [Google Scholar] [CrossRef]
- Lee, K.G.Z.; Babak, M.V.; Weiss, A.; Dyson, P.J.; Nowak-Sliwinska, P.; Montagner, D.; Ang, W.H. Development of an Efficient Dual-Action GST-Inhibiting Anticancer Platinum(IV) Prodrug. ChemMedChem 2018, 13, 1210–1217. [Google Scholar] [CrossRef]
- Ocran Mattila, P.; Ahmad, R.; Hasan, S.S.; Babar, Z.U. Availability, Affordability, Access, and Pricing of Anti-cancer Medicines in Low- and Middle-Income Countries: A Systematic Review of Literature. Front. Public Health 2021, 9, 628744. [Google Scholar] [CrossRef] [PubMed]
- Bhargava, A.; Vaishampayan, U.N. Satraplatin: Leading the new generation of oral platinum agents. Expert. Opin. Investig. Drugs 2009, 18, 1787–1797. [Google Scholar] [CrossRef]
- Choy, H. Satraplatin: An orally available platinum analog for the treatment of cancer. Expert. Rev. Anticancer. Ther. 2006, 6, 973–982. [Google Scholar] [CrossRef] [PubMed]
- Kostrhunova, H.; Zajac, J.; Novohradsky, V.; Kasparkova, J.; Malina, J.; Aldrich-Wright, J.R.; Petruzzella, E.; Sirota, R.; Gibson, D.; Brabec, V. A Subset of New Platinum Antitumor Agents Kills Cells by a Multimodal Mechanism of Action Also Involving Changes in the Organization of the Microtubule Cytoskeleton. J. Med. Chem. 2019, 62, 5176–5190. [Google Scholar] [CrossRef] [PubMed]
- Medina, M.A.; Oza, G.; Sharma, A.; Arriaga, L.G.; Hernández Hernández, J.M.; Rotello, V.M.; Ramirez, J.T. Triple-Negative Breast Cancer: A Review of Conventional and Advanced Therapeutic Strategies. Int. J. Environ. Res. Public Health 2020, 17, 2078. [Google Scholar] [CrossRef] [PubMed]
- Almansour, N.M. Triple-Negative Breast Cancer: A Brief Review About Epidemiology, Risk Factors, Signaling Pathways, Treatment and Role of Artificial Intelligence. Front. Mol. Biosci. 2022, 9, 836417. [Google Scholar] [CrossRef]
- Nguyen, D.X.; Massagué, J. Genetic determinants of cancer metastasis. Nat. Rev. Genet. 2007, 8, 341–352. [Google Scholar] [CrossRef]
- Howard, F.M.; Olopade, O.I. Epidemiology of Triple-Negative Breast Cancer: A Review. Cancer J. 2021, 27, 8–16. [Google Scholar] [CrossRef] [PubMed]
- Kumar, N.; Ehsan, S.; Banerjee, S.; Fernandez Perez, C.; Lhuilier, I.; Neuner, J.; Friebel-Klinger, T.; Fayanju, O.M.; Nair, B.; Niinuma, S.A.; et al. The unique risk factor profile of triple negative breast cancer: A comprehensive meta-analysis. J. Natl. Cancer Inst. 2024, 56, djae056. [Google Scholar] [CrossRef]
- Obidiro, O.; Battogtokh, G.; Akala, E.O. Triple Negative Breast Cancer Treatment Options and Limitations: Future Outlook. Pharmaceutics 2023, 15, 1796. [Google Scholar] [CrossRef]
- Chang, J.W.; Ding, Y.; Tahir Ul Qamar, M.; Shen, Y.; Gao, J.; Chen, L.L. A deep learning model based on sparse auto-encoder for prioritizing cancer-related genes and drug target combinations. Carcinogenesis 2019, 40, 624–632. [Google Scholar] [CrossRef] [PubMed]
- Won, K.A.; Spruck, C. Triple-negative breast cancer therapy: Current and future perspectives (Review). Int. J. Oncol. 2020, 57, 1245–1261. [Google Scholar] [CrossRef] [PubMed]
- Goel, A.K.; Nandy, M.; Sharma, G. Cisplatin as neoadjuvant chemotherapy in triple negative breast cancer: Exciting early results. Indian. J. Med. Paediatr. Oncol. 2010, 31, 76–78. [Google Scholar] [CrossRef]
- Golshan, M.; Garber, J.E.; Gelman, R.; Tung, N.; Smith, B.L.; Troyan, S.; Greenberg, C.C.; Winer, E.P.; Ryan, P. Does neoadjuvant bevacizumab increase surgical complications in breast surgery? Ann. Surg. Oncol. 2011, 18, 733–737. [Google Scholar] [CrossRef] [PubMed]
- Abraham, B.K.; Fritz, P.; McClellan, M.; Hauptvogel, P.; Athelogou, M.; Brauch, H. Prevalence of CD44+/CD24-/low cells in breast cancer may not be associated with clinical outcome but may favor distant metastasis. Clin. Cancer Res. 2005, 11, 1154–1159. [Google Scholar] [CrossRef] [PubMed]
- Zhao, H.; Tang, H.; Xiao, Q.; He, M.; Zhao, L.; Fu, Y.; Wu, H.; Yu, Z.; Jiang, Q.; Yan, Y.; et al. The Hedgehog signaling pathway is associated with poor prognosis in breast cancer patients with the CD44+/CD24- phenotype. Mol. Med. Rep. 2016, 14, 5261–5270. [Google Scholar] [CrossRef] [PubMed]
- Rawla, P.; Sunkara, T.; Barsouk, A. Epidemiology of colorectal cancer: Incidence, mortality, survival, and risk factors. Prz. Gastroenterol. 2019, 14, 89–103. [Google Scholar] [CrossRef] [PubMed]
- Najafi, S.; Rahimi, Z.; Mansoori, B.; Mohammadi, A.; Mohammadnejad, F.; Amini, M.; Mokhtazadeh, A.; Asadzadeh, Z.; Chi-Shing Cho, W.; Baradaran, B. CD44 Suppression Improved the Chemosensitivity of HT-29 Colorectal Cancer Cells to 5-Fluorouracil and Inhibited Cell Migration. Adv. Pharm. Bull. 2023, 13, 551–562. [Google Scholar] [CrossRef]
- Baidoun, F.; Elshiwy, K.; Elkeraie, Y.; Merjaneh, Z.; Khoudari, G.; Sarmini, M.T.; Gad, M.; Al-Husseini, M.; Saad, A. Colorectal Cancer Epidemiology: Recent Trends and Impact on Outcomes. Curr. Drug Targets 2021, 22, 998–1009. [Google Scholar] [CrossRef]
- Zhou, Z.P.; Wang, L.P.; Hong, Z.S.; Qiu, C.Z.; Wang, M.Z.; Chen, Z.X.; Tang, L.F.; Yu, W.S.; Wang, C.X. Silencing GOLPH3 gene expression reverses resistance to cisplatin in HT29 colon cancer cells via multiple signaling pathways. Int. J. Oncol. 2018, 53, 1183–1192. [Google Scholar] [CrossRef]
- Morris, V.K.; Kennedy, E.B.; Baxter, N.N.; Benson, A.B., 3rd; Cercek, A.; Cho, M.; Ciombor, K.K.; Cremolini, C.; Davis, A.; Deming, D.A.; et al. Treatment of Metastatic Colorectal Cancer: ASCO Guideline. J. Clin. Oncol. 2023, 41, 678–700. [Google Scholar] [CrossRef]
- Dekker, E.; Tanis, P.J.; Vleugels, J.L.A.; Kasi, P.M.; Wallace, M.B. Colorectal cancer. Lancet 2019, 394, 1467–1480. [Google Scholar] [CrossRef] [PubMed]
- Blondy, S.; David, V.; Verdier, M.; Mathonnet, M.; Perraud, A.; Christou, N. 5-Fluorouracil resistance mechanisms in colorectal cancer: From classical pathways to promising processes. Cancer Sci. 2020, 111, 3142–3154. [Google Scholar] [CrossRef]
- De Rosa, M.; Pace, U.; Rega, D.; Costabile, V.; Duraturo, F.; Izzo, P.; Delrio, P. Genetics, diagnosis and management of colorectal cancer (Review). Oncol. Rep. 2015, 34, 1087–1096. [Google Scholar] [CrossRef] [PubMed]
- Tan, J.; Chen, Y.X. Dietary and Lifestyle Factors Associated with Colorectal Cancer Risk and Interactions with Microbiota: Fiber, Red or Processed Meat and Alcoholic Drinks. Gastrointest. Tumors 2016, 3, 17–24. [Google Scholar] [CrossRef]
- Deo, K.M.; Sakoff, J.; Gilbert, J.; Zhang, Y.; Aldrich Wright, J.R. Synthesis, characterisation and potent cytotoxicity of unconventional platinum(iv) complexes with modified lipophilicity. Dalton Trans. 2019, 48, 17217–17227. [Google Scholar] [CrossRef]
- Macias, F.J.; Deo, K.M.; Pages, B.J.; Wormell, P.; Clegg, J.K.; Zhang, Y.; Li, F.; Zheng, G.; Sakoff, J.; Gilbert, J.; et al. Synthesis and Analysis of the Structure, Diffusion and Cytotoxicity of Heterocyclic Platinum(IV) Complexes. Chemistry 2015, 21, 16990–17001. [Google Scholar] [CrossRef]
- Khoury, A.; Sakoff, J.A.; Gilbert, J.; Scott, K.F.; Karan, S.; Gordon, C.P.; Aldrich-Wright, J.R. Cyclooxygenase-Inhibiting Platinum(IV) Prodrugs with Potent Anticancer Activity. Pharmaceutics 2022, 14, 787. [Google Scholar] [CrossRef] [PubMed]
- Harper, B.W.J.; Petruzzella, E.; Sirota, R.; Faccioli, F.F.; Aldrich-Wright, J.R.; Gandin, V.; Gibson, D. Synthesis, characterization and in vitro and in vivo anticancer activity of Pt(iv) derivatives of [Pt(1S,2S-DACH)(5,6-dimethyl-1,10-phenanthroline)]. Dalton Trans. 2017, 46, 7005–7019. [Google Scholar] [CrossRef]
- Engel, M.; Belfiore, L.; Aghaei, B.; Sutija, M. Enabling high throughput drug discovery in 3D cell cultures through a novel bioprinting workflow. SLAS Technol. 2022, 27, 32–38. [Google Scholar] [CrossRef]
- Belfiore, L.; Aghaei, B.; Law, A.M.K.; Dobrowolski, J.C.; Raftery, L.J.; Tjandra, A.D.; Yee, C.; Piloni, A.; Volkerling, A.; Ferris, C.J.; et al. Generation and analysis of 3D cell culture models for drug discovery. Eur. J. Pharm. Sci. 2021, 163, 105876. [Google Scholar] [CrossRef] [PubMed]
- Cavaco, M.; Fraga, P.; Valle, J.; Andreu, D.; Castanho, M.; Neves, V. Development of Breast Cancer Spheroids to Evaluate Cytotoxic Response to an Anticancer Peptide. Pharmaceutics 2021, 13, 1863. [Google Scholar] [CrossRef] [PubMed]
- Fielding, A.B.; Willox, A.K.; Okeke, E.; Royle, S.J. Clathrin-mediated endocytosis is inhibited during mitosis. Proc. Natl. Acad. Sci. USA 2012, 109, 6572–6577. [Google Scholar] [CrossRef] [PubMed]
- Osorio-Navarro, C.; Toledo, J.; Norambuena, L. Sucrose targets clathrin-mediated endocytosis kinetics supporting cell elongation in Arabidopsis thaliana. Front. Plant Sci. 2022, 13, 987191. [Google Scholar] [CrossRef] [PubMed]
- Nicklin, P.; Bergman, P.; Zhang, B.; Triantafellow, E.; Wang, H.; Nyfeler, B.; Yang, H.; Hild, M.; Kung, C.; Wilson, C.; et al. Bidirectional transport of amino acids regulates mTOR and autophagy. Cell 2009, 136, 521–534. [Google Scholar] [CrossRef] [PubMed]
- Rosellini, M.; Omer, E.A.; Schulze, A.; Ali, N.T.; Boulos, J.C.; Marini, F.; Küpper, J.H.; Efferth, T. Impact of plastic-related compounds on the gene expression signature of HepG2 cells transfected with CYP3A4. Arch. Toxicol. 2024, 98, 525–536. [Google Scholar] [CrossRef] [PubMed]
- Ge, S.X.; Son, E.W.; Yao, R. iDEP: An integrated web application for differential expression and pathway analysis of RNA-Seq data. BMC Bioinform. 2018, 19, 534. [Google Scholar] [CrossRef] [PubMed]
- Zhang, X.; Smits, A.H.; van Tilburg, G.B.; Ovaa, H.; Huber, W.; Vermeulen, M. Proteome-wide identification of ubiquitin interactions using UbIA-MS. Nat. Protoc. 2018, 13, 530–550. [Google Scholar] [CrossRef] [PubMed]
- Conway, J.R.; Lex, A.; Gehlenborg, N. UpSetR: An R package for the visualization of intersecting sets and their properties. Bioinformatics 2017, 33, 2938–2940. [Google Scholar] [CrossRef]
- Szklarczyk, D.; Gable, A.L.; Lyon, D.; Junge, A.; Wyder, S.; Huerta-Cepas, J.; Simonovic, M.; Doncheva, N.T.; Morris, J.H.; Bork, P.; et al. STRING v11: Protein-protein association networks with increased coverage, supporting functional discovery in genome-wide experimental datasets. Nucleic Acids Res. 2019, 47, D607–D613. [Google Scholar] [CrossRef]
- Szklarczyk, D.; Gable, A.L.; Nastou, K.C.; Lyon, D.; Kirsch, R.; Pyysalo, S.; Doncheva, N.T.; Legeay, M.; Fang, T.; Bork, P.; et al. The STRING database in 2021: Customizable protein-protein networks, and functional characterization of user-uploaded gene/measurement sets. Nucleic Acids Res 2021, 49, D605–D612. [Google Scholar] [CrossRef] [PubMed]
- Zhong, W.; Dai, L.; Liu, J.; Zhou, S. Cholangiocarcinoma-associated genes identified by integrative analysis of gene expression data. Mol. Med. Rep. 2018, 17, 5744–5753. [Google Scholar] [CrossRef] [PubMed]
- López-Lázaro, M. A simple and reliable approach for assessing anticancer activity in vitro. Curr. Med. Chem. 2015, 22, 1324–1334. [Google Scholar] [CrossRef] [PubMed]
- López-Lázaro, M. Two preclinical tests to evaluate anticancer activity and to help validate drug candidates for clinical trials. Oncoscience 2015, 2, 91–98. [Google Scholar] [CrossRef] [PubMed]
- Mehanna, S.; Mansour, N.; Audi, H.; Bodman-Smith, K.; Mroueh, M.A.; Taleb, R.I.; Daher, C.F.; Khnayzer, R.S. Enhanced cellular uptake and photochemotherapeutic potential of a lipophilic strained Ru(ii) polypyridyl complex. RSC Adv. 2019, 9, 17254–17265. [Google Scholar] [CrossRef] [PubMed]
- Schoeberl, A.; Gutmann, M.; Theiner, S.; Corte-Rodríguez, M.; Braun, G.; Vician, P.; Berger, W.; Koellensperger, G. The copper transporter CTR1 and cisplatin accumulation at the single-cell level by LA-ICP-TOFMS. Front. Mol. Biosci. 2022, 9, 1055356. [Google Scholar] [CrossRef] [PubMed]
- Kim, S.S.; Rait, A.; Rubab, F.; Rao, A.K.; Kiritsy, M.C.; Pirollo, K.F.; Wang, S.; Weiner, L.M.; Chang, E.H. The clinical potential of targeted nanomedicine: Delivering to cancer stem-like cells. Mol. Ther. 2014, 22, 278–291. [Google Scholar] [CrossRef] [PubMed]
- Rizwanullah, M.; Ahmad, M.Z.; Ghoneim, M.M.; Alshehri, S.; Imam, S.S.; Md, S.; Alhakamy, N.A.; Jain, K.; Ahmad, J. Receptor-Mediated Targeted Delivery of Surface-ModifiedNanomedicine in Breast Cancer: Recent Update and Challenges. Pharmaceutics 2021, 13, 2039. [Google Scholar] [CrossRef] [PubMed]
- Groessl, M.; Zava, O.; Dyson, P.J. Cellular uptake and subcellular distribution of ruthenium-based metallodrugs under clinical investigation versus cisplatin. Metallomics 2011, 3, 591–599. [Google Scholar] [CrossRef] [PubMed]
- Shimizu, T.; Fujii, T.; Sakai, H. The Relationship Between Actin Cytoskeleton and Membrane Transporters in Cisplatin Resistance of Cancer Cells. Front. Cell Dev. Biol. 2020, 8, 597835. [Google Scholar] [CrossRef]
- Peng, G.E.; Wilson, S.R.; Weiner, O.D. A pharmacological cocktail for arresting actin dynamics in living cells. Mol. Biol. Cell 2011, 22, 3986–3994. [Google Scholar] [CrossRef] [PubMed]
- Desouza, M.; Gunning, P.W.; Stehn, J.R. The actin cytoskeleton as a sensor and mediator of apoptosis. Bioarchitecture 2012, 2, 75–87. [Google Scholar] [CrossRef] [PubMed]
- Gourlay, C.W.; Ayscough, K.R. The actin cytoskeleton in ageing and apoptosis. FEMS Yeast Res. 2005, 5, 1193–1198. [Google Scholar] [CrossRef] [PubMed]
- Belin, B.J.; Lee, T.; Mullins, R.D. Correction: DNA damage induces nuclear actin filament assembly by Formin-2 and Spire-1/2 that promotes efficient DNA repair. Elife 2015, 4, 11935. [Google Scholar] [CrossRef]
- Mills, J.C.; Stone, N.L.; Erhardt, J.; Pittman, R.N. Apoptotic membrane blebbing is regulated by myosin light chain phosphorylation. J. Cell Biol. 1998, 140, 627–636. [Google Scholar] [CrossRef] [PubMed]
- Aoki, K.; Satoi, S.; Harada, S.; Uchida, S.; Iwasa, Y.; Ikenouchi, J. Coordinated changes in cell membrane and cytoplasm during maturation of apoptotic bleb. Mol. Biol. Cell 2020, 31, 833–844. [Google Scholar] [CrossRef]
- Zhang, Y.; Chen, X.; Gueydan, C.; Han, J. Plasma membrane changes during programmed cell deaths. Cell Res. 2018, 28, 9–21. [Google Scholar] [CrossRef]
- van Zijl, F.; Krupitza, G.; Mikulits, W. Initial steps of metastasis: Cell invasion and endothelial transmigration. Mutat. Res. 2011, 728, 23–34. [Google Scholar] [CrossRef] [PubMed]
- Balzer, E.M.; Konstantopoulos, K. Intercellular adhesion: Mechanisms for growth and metastasis of epithelial cancers. Wiley Interdiscip. Rev. Syst. Biol. Med. 2012, 4, 171–181. [Google Scholar] [CrossRef]
- Fronik, P.; Gutmann, M.; Vician, P.; Stojanovic, M.; Kastner, A.; Heffeter, P.; Pirker, C.; Keppler, B.K.; Berger, W.; Kowol, C.R. A platinum(IV) prodrug strategy to overcome glutathione-based oxaliplatin resistance. Commun. Chem. 2022, 5, 46. [Google Scholar] [CrossRef]
- Li, Y.; An, L.; Lin, J.; Tian, Q.; Yang, S. Smart nanomedicine agents for cancer, triggered by pH, glutathione, H2O2, or H2S. Int. J. Nanomed. 2019, 14, 5729–5749. [Google Scholar] [CrossRef] [PubMed]
- Schreiber-Brynzak, E.; Pichler, V.; Heffeter, P.; Hanson, B.; Theiner, S.; Lichtscheidl-Schultz, I.; Kornauth, C.; Bamonti, L.; Dhery, V.; Groza, D.; et al. Behavior of platinum(iv) complexes in models of tumor hypoxia: Cytotoxicity, compound distribution and accumulation. Metallomics 2016, 8, 422–433. [Google Scholar] [CrossRef] [PubMed]
- Hall, M.D.; Alderden, R.A.; Zhang, M.; Beale, P.J.; Cai, Z.; Lai, B.; Stampfl, A.P.; Hambley, T.W. The fate of platinum(II) and platinum(IV) anti-cancer agents in cancer cells and tumours. J. Struct. Biol. 2006, 155, 38–44. [Google Scholar] [CrossRef] [PubMed]
- Sadacca, B.; Hamy, A.S.; Laurent, C.; Gestraud, P.; Bonsang-Kitzis, H.; Pinheiro, A.; Abecassis, J.; Neuvial, P.; Reyal, F. New insight for pharmacogenomics studies from the transcriptional analysis of two large-scale cancer cell line panels. Sci. Rep. 2017, 7, 15126. [Google Scholar] [CrossRef] [PubMed]
- Park, B.J.; Raha, P.; Pankovich, J.; Bazett, M. Utilization of Cancer Cell Line Screening to Elucidate the Anticancer Activity and Biological Pathways Related to the Ruthenium-Based Therapeutic BOLD-100. Cancers 2022, 15, 28. [Google Scholar] [CrossRef] [PubMed]
- Spreckelmeyer, S.; Orvig, C.; Casini, A. Cellular transport mechanisms of cytotoxic metallodrugs: An overview beyond cisplatin. Molecules 2014, 19, 15584–15610. [Google Scholar] [CrossRef] [PubMed]
- Bosshart, P.D.; Fotiadis, D. Secondary Active Transporters. Subcell. Biochem. 2019, 92, 275–299. [Google Scholar] [CrossRef] [PubMed]
- dos Santos, T.; Varela, J.; Lynch, I.; Salvati, A.; Dawson, K.A. Effects of transport inhibitors on the cellular uptake of carboxylated polystyrene nanoparticles in different cell lines. PLoS ONE 2011, 6, e24438. [Google Scholar] [CrossRef] [PubMed]
- Kunjachan, S.; Pola, R.; Gremse, F.; Theek, B.; Ehling, J.; Moeckel, D.; Hermanns-Sachweh, B.; Pechar, M.; Ulbrich, K.; Hennink, W.E.; et al. Passive versus active tumor targeting using RGD- and NGR-modified polymeric nanomedicines. Nano Lett. 2014, 14, 972–981. [Google Scholar] [CrossRef]
- Puckett, C.A.; Barton, J.K. Methods to explore cellular uptake of ruthenium complexes. J. Am. Chem. Soc. 2007, 129, 46–47. [Google Scholar] [CrossRef]
- Godlee, C.; Kaksonen, M. Review series: From uncertain beginnings: Initiation mechanisms of clathrin-mediated endocytosis. J. Cell Biol. 2013, 203, 717–725. [Google Scholar] [CrossRef] [PubMed]
- Troisi, R.; Galardo, F.; Ferraro, G.; Sica, F.; Merlino, A. Cisplatin Binding to Human Serum Transferrin: A Crystallographic Study. Inorg. Chem. 2023, 62, 675–678. [Google Scholar] [CrossRef] [PubMed]
- Zhang, J.; Xu, Y.; Li, D.; Fu, L.; Zhang, X.; Bao, Y.; Zheng, L. Review of the Correlation of LAT1 With Diseases: Mechanism and Treatment. Front. Chem. 2020, 8, 564809. [Google Scholar] [CrossRef] [PubMed]
- Wang, Q.; Holst, J. L-type amino acid transport and cancer: Targeting the mTORC1 pathway to inhibit neoplasia. Am. J. Cancer Res. 2015, 5, 1281–1294. [Google Scholar] [PubMed]
- Scalise, M.; Galluccio, M.; Console, L.; Pochini, L.; Indiveri, C. The Human SLC7A5 (LAT1): The Intriguing Histidine/Large Neutral Amino Acid Transporter and Its Relevance to Human Health. Front. Chem. 2018, 6, 243. [Google Scholar] [CrossRef] [PubMed]
- Daniels, T.R.; Bernabeu, E.; Rodríguez, J.A.; Patel, S.; Kozman, M.; Chiappetta, D.A.; Holler, E.; Ljubimova, J.Y.; Helguera, G.; Penichet, M.L. The transferrin receptor and the targeted delivery of therapeutic agents against cancer. Biochim. Biophys. Acta 2012, 1820, 291–317. [Google Scholar] [CrossRef] [PubMed]
- Fontana, F.; Esser, A.K.; Egbulefu, C.; Karmakar, P.; Su, X.; Allen, J.S.; Xu, Y.; Davis, J.L.; Gabay, A.; Xiang, J.; et al. Transferrin receptor in primary and metastatic breast cancer: Evaluation of expression and experimental modulation to improve molecular targeting. PLoS ONE 2023, 18, e0293700. [Google Scholar] [CrossRef] [PubMed]
- Lambert, I.H.; Sørensen, B.H. Facilitating the Cellular Accumulation of Pt-Based Chemotherapeutic Drugs. Int. J. Mol. Sci. 2018, 19, 2249. [Google Scholar] [CrossRef]
- Baz, J.; Khoury, A.; Elias, M.G.; Mansour, N.; Mehanna, S.; Hammoud, O.; Gordon, C.P.; Taleb, R.I.; Aldrich-Wright, J.R.; Daher, C.F. Enhanced potency of a chloro-substituted polyaromatic platinum(II) complex and its platinum(IV) prodrug against lung cancer. Chem. Biol. Interact. 2024, 388, 110834. [Google Scholar] [CrossRef]
- Lee, S.H.; Meng, X.W.; Flatten, K.S.; Loegering, D.A.; Kaufmann, S.H. Phosphatidylserine exposure during apoptosis reflects bidirectional trafficking between plasma membrane and cytoplasm. Cell Death Differ. 2013, 20, 64–76. [Google Scholar] [CrossRef]
- Crompton, T.; Peitsch, M.C.; MacDonald, H.R.; Tschopp, J. Propidium iodide staining correlates with the extent of DNA degradation in isolated nuclei. Biochem. Biophys. Res. Commun. 1992, 183, 532–537. [Google Scholar] [CrossRef] [PubMed]
- Velma, V.; Dasari, S.R.; Tchounwou, P.B. Low Doses of Cisplatin Induce Gene Alterations, Cell Cycle Arrest, and Apoptosis in Human Promyelocytic Leukemia Cells. Biomark. Insights 2016, 11, 113–121. [Google Scholar] [CrossRef] [PubMed]
- Chang, C.H.; Yu, F.Y.; Wu, T.S.; Wang, L.T.; Liu, B.H. Mycotoxin citrinin induced cell cycle G2/M arrest and numerical chromosomal aberration associated with disruption of microtubule formation in human cells. Toxicol. Sci. 2011, 119, 84–92. [Google Scholar] [CrossRef]
- Blajeski, A.L.; Phan, V.A.; Kottke, T.J.; Kaufmann, S.H. G(1) and G(2) cell-cycle arrest following microtubule depolymerization in human breast cancer cells. J. Clin. Investig. 2002, 110, 91–99. [Google Scholar] [CrossRef] [PubMed]
- Wang, X.; Tanaka, M.; Peixoto, H.S.; Wink, M. Cucurbitacins: Elucidation of their interactions with the cytoskeleton. PeerJ 2017, 5, e3357. [Google Scholar] [CrossRef] [PubMed]
- Barr, A.R.; Cooper, S.; Heldt, F.S.; Butera, F.; Stoy, H.; Mansfeld, J.; Novák, B.; Bakal, C. DNA damage during S-phase mediates the proliferation-quiescence decision in the subsequent G1 via p21 expression. Nat. Commun. 2017, 8, 14728. [Google Scholar] [CrossRef] [PubMed]
- Redza-Dutordoir, M.; Averill-Bates, D.A. Activation of apoptosis signalling pathways by reactive oxygen species. Biochim. Biophys. Acta 2016, 1863, 2977–2992. [Google Scholar] [CrossRef]
- Ježek, J.; Cooper, K.F.; Strich, R. Reactive Oxygen Species and Mitochondrial Dynamics: The Yin and Yang of Mitochondrial Dysfunction and Cancer Progression. Antioxidants 2018, 7, 13. [Google Scholar] [CrossRef] [PubMed]
- Johnstone, T.C.; Park, G.Y.; Lippard, S.J. Understanding and improving platinum anticancer drugs--phenanthriplatin. Anticancer. Res. 2014, 34, 471–476. [Google Scholar]
- Salerno, D.; Beretta, G.L.; Zanchetta, G.; Brioschi, S.; Cristofalo, M.; Missana, N.; Nardo, L.; Cassina, V.; Tempestini, A.; Giovannoni, R.; et al. Platinum-Based Drugs and DNA Interactions Studied by Single-Molecule and Bulk Measurements. Biophys. J. 2016, 110, 2151–2161. [Google Scholar] [CrossRef]
- Choi, Y.M.; Kim, H.K.; Shim, W.; Anwar, M.A.; Kwon, J.W.; Kwon, H.K.; Kim, H.J.; Jeong, H.; Kim, H.M.; Hwang, D.; et al. Mechanism of Cisplatin-Induced Cytotoxicity Is Correlated to Impaired Metabolism Due to Mitochondrial ROS Generation. PLoS ONE 2015, 10, e0135083. [Google Scholar] [CrossRef]
- Cadet, J.; Davies, K.J.A. Oxidative DNA damage & repair: An introduction. Free Radic. Biol. Med. 2017, 107, 2–12. [Google Scholar] [CrossRef] [PubMed]
- Tilokani, L.; Nagashima, S.; Paupe, V.; Prudent, J. Mitochondrial dynamics: Overview of molecular mechanisms. Essays Biochem. 2018, 62, 341–360. [Google Scholar] [CrossRef] [PubMed]
- Gupta, S.; Kass, G.E.; Szegezdi, E.; Joseph, B. The mitochondrial death pathway: A promising therapeutic target in diseases. J. Cell Mol. Med. 2009, 13, 1004–1033. [Google Scholar] [CrossRef] [PubMed]
- Saraste, A.; Pulkki, K. Morphologic and biochemical hallmarks of apoptosis. Cardiovasc. Res. 2000, 45, 528–537. [Google Scholar] [CrossRef] [PubMed]
- Ren, W.; Zhao, W.; Cao, L.; Huang, J. Involvement of the Actin Machinery in Programmed Cell Death. Front. Cell Dev. Biol. 2020, 8, 634849. [Google Scholar] [CrossRef]
- Davidson, P.M.; Cadot, B. Actin on and around the Nucleus. Trends Cell Biol. 2021, 31, 211–223. [Google Scholar] [CrossRef] [PubMed]
- Falahzadeh, K.; Banaei-Esfahani, A.; Shahhoseini, M. The potential roles of actin in the nucleus. Cell J. 2015, 17, 7–14. [Google Scholar] [CrossRef] [PubMed]
- Parker, A.L.; Kavallaris, M.; McCarroll, J.A. Microtubules and their role in cellular stress in cancer. Front. Oncol. 2014, 4, 153. [Google Scholar] [CrossRef]
- Ohi, R.; Strothman, C.; Zanic, M. Impact of the ‘tubulin economy’ on the formation and function of the microtubule cytoskeleton. Curr. Opin. Cell Biol. 2021, 68, 81–89. [Google Scholar] [CrossRef]
- Wang, Q.; Liu, X. The dual functions of α-tubulin acetylation in cellular apoptosis and autophage induced by tanespimycin in lung cancer cells. Cancer Cell Int. 2020, 20, 369. [Google Scholar] [CrossRef]
- Twomey, J.D.; Zhao, L.; Luo, S.; Xu, Q.; Zhang, B. Tubulin couples death receptor 5 to regulate apoptosis. Oncotarget 2018, 9, 36804–36815. [Google Scholar] [CrossRef]
- Kostrhunova, H.; McGhie, B.S.; Markova, L.; Novakova, O.; Kasparkova, J.; Aldrich-Wright, J.R.; Brabec, V. Platinum(IV) Derivatives of [Pt(1S,2S-diaminocyclohexane)(5,6-dimethyl-1,10-phenanthroline)] with Diclofenac Ligands in the Axial Positions: A New Class of Potent Multi-action Agents Exhibiting Selectivity to Cancer Cells. J. Med. Chem. 2023, 66, 7894–7908. [Google Scholar] [CrossRef]
- Park, M.; Hwang, J.W.; Cho, Y.; Kim, S.; Han, S.H.; Yu, J.; Ha, S.; Kim, W.Y.; Kim, S.N.; Kim, I.S.; et al. A novel synthetic microtubule inhibitor exerts antiproliferative effects in multidrug resistant cancer cells and cancer stem cells. Sci. Rep. 2021, 11, 10822. [Google Scholar] [CrossRef] [PubMed]
- Hasanpourghadi, M.; Karthikeyan, C.; Pandurangan, A.K.; Looi, C.Y.; Trivedi, P.; Kobayashi, K.; Tanaka, K.; Wong, W.F.; Mustafa, M.R. Targeting of tubulin polymerization and induction of mitotic blockage by Methyl 2-(5-fluoro-2-hydroxyphenyl)-1H-benzo[d]imidazole-5-carboxylate (MBIC) in human cervical cancer HeLa cell. J. Exp. Clin. Cancer Res. 2016, 35, 58. [Google Scholar] [CrossRef]
- Tseng, C.J.; Wang, Y.J.; Liang, Y.C.; Jeng, J.H.; Lee, W.S.; Lin, J.K.; Chen, C.H.; Liu, I.C.; Ho, Y.S. Microtubule damaging agents induce apoptosis in HL 60 cells and G2/M cell cycle arrest in HT 29 cells. Toxicology 2002, 175, 123–142. [Google Scholar] [CrossRef] [PubMed]
- Yamaguchi, H.; Wyckoff, J.; Condeelis, J. Cell migration in tumors. Curr. Opin. Cell Biol. 2005, 17, 559–564. [Google Scholar] [CrossRef] [PubMed]
- Pijuan, J.; Barceló, C.; Moreno, D.F.; Maiques, O.; Sisó, P.; Marti, R.M.; Macià, A.; Panosa, A. In vitro Cell Migration, Invasion, and Adhesion Assays: From Cell Imaging to Data Analysis. Front. Cell Dev. Biol. 2019, 7, 107. [Google Scholar] [CrossRef]
- Cavallaro, U.; Christofori, G. Cell adhesion in tumor invasion and metastasis: Loss of the glue is not enough. Biochim. Biophys. Acta 2001, 1552, 39–45. [Google Scholar] [CrossRef]
- Amaro, A.; Angelini, G.; Mirisola, V.; Esposito, A.I.; Reverberi, D.; Matis, S.; Maffei, M.; Giaretti, W.; Viale, M.; Gangemi, R.; et al. A highly invasive subpopulation of MDA-MB-231 breast cancer cells shows accelerated growth, differential chemoresistance, features of apocrine tumors and reduced tumorigenicity in vivo. Oncotarget 2016, 7, 68803–68820. [Google Scholar] [CrossRef]
- Qi, Q.; Lu, N.; Wang, X.T.; Gu, H.Y.; Yang, Y.; Liu, W.; Li, C.; You, Q.D.; Guo, Q.L. Anti-invasive effect of gambogic acid in MDA-MB-231 human breast carcinoma cells. Biochem. Cell Biol. 2008, 86, 386–395. [Google Scholar] [CrossRef] [PubMed]
- Gheytanchi, E.; Naseri, M.; Karimi-Busheri, F.; Atyabi, F.; Mirsharif, E.S.; Bozorgmehr, M.; Ghods, R.; Madjd, Z. Morphological and molecular characteristics of spheroid formation in HT-29 and Caco-2 colorectal cancer cell lines. Cancer Cell Int. 2021, 21, 204. [Google Scholar] [CrossRef] [PubMed]
- Chen, W.S.; Liu, J.H.; Wei, S.J.; Liu, J.M.; Hong, C.Y.; Yang, W.K. Colon cancer cells with high invasive potential are susceptible to induction of apoptosis by a selective COX-2 inhibitor. Cancer Sci. 2003, 94, 253–258. [Google Scholar] [CrossRef]
- Qian, S.; Wei, Z.; Yang, W.; Huang, J.; Yang, Y.; Wang, J. The role of BCL-2 family proteins in regulating apoptosis and cancer therapy. Front. Oncol. 2022, 12, 985363. [Google Scholar] [CrossRef] [PubMed]
- Elmore, S. Apoptosis: A review of programmed cell death. Toxicol. Pathol. 2007, 35, 495–516. [Google Scholar] [CrossRef] [PubMed]
- Huang, K.; Zhang, J.; O’Neill, K.L.; Gurumurthy, C.B.; Quadros, R.M.; Tu, Y.; Luo, X. Cleavage by Caspase 8 and Mitochondrial Membrane Association Activate the BH3-only Protein Bid during TRAIL-induced Apoptosis. J. Biol. Chem. 2016, 291, 11843–11851. [Google Scholar] [CrossRef] [PubMed]
- Woo, M.; Hakem, R.; Mak, T.W. Executionary pathway for apoptosis: Lessons from mutant mice. Cell Res. 2000, 10, 267–278. [Google Scholar] [CrossRef] [PubMed]
- Nuñez, G.; Benedict, M.A.; Hu, Y.; Inohara, N. Caspases: The proteases of the apoptotic pathway. Oncogene 1998, 17, 3237–3245. [Google Scholar] [CrossRef] [PubMed]
- Wang, Y.; Kanneganti, T.D. From pyroptosis, apoptosis and necroptosis to PANoptosis: A mechanistic compendium of programmed cell death pathways. Comput. Struct. Biotechnol. J. 2021, 19, 4641–4657. [Google Scholar] [CrossRef] [PubMed]
- Engeland, K. Cell cycle regulation: p53-p21-RB signaling. Cell Death Differ. 2022, 29, 946–960. [Google Scholar] [CrossRef]
- Han, Z.; Wei, W.; Dunaway, S.; Darnowski, J.W.; Calabresi, P.; Sedivy, J.; Hendrickson, E.A.; Balan, K.V.; Pantazis, P.; Wyche, J.H. Role of p21 in apoptosis and senescence of human colon cancer cells treated with camptothecin. J. Biol. Chem. 2002, 277, 17154–17160. [Google Scholar] [CrossRef] [PubMed]
- Steelman, L.S.; Chappell, W.H.; Abrams, S.L.; Kempf, R.C.; Long, J.; Laidler, P.; Mijatovic, S.; Maksimovic-Ivanic, D.; Stivala, F.; Mazzarino, M.C.; et al. Roles of the Raf/MEK/ERK and PI3K/PTEN/Akt/mTOR pathways in controlling growth and sensitivity to therapy-implications for cancer and aging. Aging 2011, 3, 192–222. [Google Scholar] [CrossRef] [PubMed]
- Cuesta, C.; Arévalo-Alameda, C.; Castellano, E. The Importance of Being PI3K in the RAS Signaling Network. Genes 2021, 12, 1094. [Google Scholar] [CrossRef] [PubMed]
- Lu, Y.; Liu, B.; Liu, Y.; Yu, X.; Cheng, G. Dual effects of active ERK in cancer: A potential target for enhancing radiosensitivity. Oncol. Lett. 2020, 20, 993–1000. [Google Scholar] [CrossRef] [PubMed]
- McCubrey, J.A.; Steelman, L.S.; Chappell, W.H.; Abrams, S.L.; Wong, E.W.; Chang, F.; Lehmann, B.; Terrian, D.M.; Milella, M.; Tafuri, A.; et al. Roles of the Raf/MEK/ERK pathway in cell growth, malignant transformation and drug resistance. Biochim. Biophys. Acta 2007, 1773, 1263–1284. [Google Scholar] [CrossRef] [PubMed]
- Cagnol, S.; Chambard, J.C. ERK and cell death: Mechanisms of ERK-induced cell death--apoptosis, autophagy and senescence. Febs. J. 2010, 277, 2–21. [Google Scholar] [CrossRef]
- Sugiura, R.; Satoh, R.; Takasaki, T. ERK: A Double-Edged Sword in Cancer. ERK-Dependent Apoptosis as a Potential Therapeutic Strategy for Cancer. Cells 2021, 10, 2509. [Google Scholar] [CrossRef] [PubMed]
- Sabio, G.; Davis, R.J. TNF and MAP kinase signalling pathways. Semin. Immunol. 2014, 26, 237–245. [Google Scholar] [CrossRef] [PubMed]
- Subramaniam, S.; Zirrgiebel, U.; von Bohlen Und Halbach, O.; Strelau, J.; Laliberté, C.; Kaplan, D.R.; Unsicker, K. ERK activation promotes neuronal degeneration predominantly through plasma membrane damage and independently of caspase-3. J. Cell Biol. 2004, 165, 357–369. [Google Scholar] [CrossRef]
- Son, Y.; Cheong, Y.K.; Kim, N.H.; Chung, H.T.; Kang, D.G.; Pae, H.O. Mitogen-Activated Protein Kinases and Reactive Oxygen Species: How Can ROS Activate MAPK Pathways? J. Signal Transduct. 2011, 2011, 792639. [Google Scholar] [CrossRef]
- Meng, Y.; Wang, W.; Kang, J.; Wang, X.; Sun, L. Role of the PI3K/AKT signalling pathway in apoptotic cell death in the cerebral cortex of streptozotocin-induced diabetic rats. Exp. Ther. Med. 2017, 13, 2417–2422. [Google Scholar] [CrossRef] [PubMed]
- Liu, R.; Chen, Y.; Liu, G.; Li, C.; Song, Y.; Cao, Z.; Li, W.; Hu, J.; Lu, C.; Liu, Y. PI3K/AKT pathway as a key link modulates the multidrug resistance of cancers. Cell Death Dis. 2020, 11, 797. [Google Scholar] [CrossRef] [PubMed]
- Mendoza, M.; Mandani, G.; Momand, J. The MDM2 gene family. Biomol. Concepts 2014, 5, 9–19. [Google Scholar] [CrossRef] [PubMed]
- Marquez, R.T.; Xu, L. Bcl-2:Beclin 1 complex: Multiple, mechanisms regulating autophagy/apoptosis toggle switch. Am. J. Cancer Res. 2012, 2, 214–221. [Google Scholar] [PubMed]
- Huang, J.; Manning, B.D. The TSC1-TSC2 complex: A molecular switchboard controlling cell growth. Biochem. J. 2008, 412, 179–190. [Google Scholar] [CrossRef] [PubMed]
- Zhang, H.; Cicchetti, G.; Onda, H.; Koon, H.B.; Asrican, K.; Bajraszewski, N.; Vazquez, F.; Carpenter, C.L.; Kwiatkowski, D.J. Loss of Tsc1/Tsc2 activates mTOR and disrupts PI3K-Akt signaling through downregulation of PDGFR. J. Clin. Investig. 2003, 112, 1223–1233. [Google Scholar] [CrossRef] [PubMed]
- Ye, X.; Zhou, X.J.; Zhang, H. Exploring the Role of Autophagy-Related Gene 5 (ATG5) Yields Important Insights Into Autophagy in Autoimmune/Autoinflammatory Diseases. Front. Immunol. 2018, 9, 2334. [Google Scholar] [CrossRef] [PubMed]
- Fujita, N.; Itoh, T.; Omori, H.; Fukuda, M.; Noda, T.; Yoshimori, T. The Atg16L complex specifies the site of LC3 lipidation for membrane biogenesis in autophagy. Mol. Biol. Cell 2008, 19, 2092–2100. [Google Scholar] [CrossRef] [PubMed]
- Nishimura, T.; Tooze, S.A. Emerging roles of ATG proteins and membrane lipids in autophagosome formation. Cell Discov. 2020, 6, 32. [Google Scholar] [CrossRef]
- Yousefi, S.; Perozzo, R.; Schmid, I.; Ziemiecki, A.; Schaffner, T.; Scapozza, L.; Brunner, T.; Simon, H.U. Calpain-mediated cleavage of Atg5 switches autophagy to apoptosis. Nat. Cell Biol. 2006, 8, 1124–1132. [Google Scholar] [CrossRef]
- Lystad, A.H.; Carlsson, S.R.; Simonsen, A. Toward the function of mammalian ATG12-ATG5-ATG16L1 complex in autophagy and related processes. Autophagy 2019, 15, 1485–1486. [Google Scholar] [CrossRef] [PubMed]
- Mailler, E.; Guardia, C.M.; Bai, X.; Jarnik, M.; Williamson, C.D.; Li, Y.; Maio, N.; Golden, A.; Bonifacino, J.S. The autophagy protein ATG9A enables lipid mobilization from lipid droplets. Nat. Commun. 2021, 12, 6750. [Google Scholar] [CrossRef] [PubMed]
- Maruyama, T.; Noda, N.N. Autophagy-regulating protease Atg4: Structure, function, regulation and inhibition. J. Antibiot. 2017, 71, 72–78. [Google Scholar] [CrossRef] [PubMed]
- Zhong, L.; Yang, B.; Zhang, Z.; Wang, J.; Wang, X.; Guo, Y.; Huang, W.; Wang, Q.; Cai, G.; Xia, F.; et al. Targeting autophagy peptidase ATG4B with a novel natural product inhibitor Azalomycin F4a for advanced gastric cancer. Cell Death Dis. 2022, 13, 161. [Google Scholar] [CrossRef] [PubMed]
- Zhou, Y.; Wang, Z.; Huang, Y.; Bai, C.; Zhang, X.; Fang, M.; Ju, Z.; Liu, B. Membrane dynamics of ATG4B and LC3 in autophagosome formation. J. Mol. Cell Biol. 2022, 13, 853–863. [Google Scholar] [CrossRef] [PubMed]
- Li, Z.; Li, Q.; Lv, W.; Jiang, L.; Geng, C.; Yao, X.; Shi, X.; Liu, Y.; Cao, J. The interaction of Atg4B and Bcl-2 plays an important role in Cd-induced crosstalk between apoptosis and autophagy through disassociation of Bcl-2-Beclin1 in A549 cells. Free Radic. Biol. Med. 2019, 130, 576–591. [Google Scholar] [CrossRef] [PubMed]
- Zając, A.; Maciejczyk, A.; Sumorek-Wiadro, J.; Filipek, K.; Deryło, K.; Langner, E.; Pawelec, J.; Wasiak, M.; Ścibiorski, M.; Rzeski, W.; et al. The Role of Bcl-2 and Beclin-1 Complex in “Switching” between Apoptosis and Autophagy in Human Glioma Cells upon LY294002 and Sorafenib Treatment. Cells 2023, 12, 2670. [Google Scholar] [CrossRef]
- Plana, D.; Palmer, A.C.; Sorger, P.K. Independent Drug Action in Combination Therapy: Implications for Precision Oncology. Cancer Discov. 2022, 12, 606–624. [Google Scholar] [CrossRef]
- Talevi, A. Multi-target pharmacology: Possibilities and limitations of the “skeleton key approach” from a medicinal chemist perspective. Front. Pharmacol. 2015, 6, 205. [Google Scholar] [CrossRef]
- Harper, B.W.; Friedman-Ezra, A.; Sirota, R.; Petruzzella, E.; Aldrich-Wright, J.R.; Gibson, D. Probing the Interactions of Cytotoxic [Pt(1S,2S-DACH)(5,6-dimethyl-1,10-phenanthroline)] and Its Pt(IV) Derivatives with Human Serum. ChemMedChem 2017, 12, 510–519. [Google Scholar] [CrossRef]
- Bitter, E.E.; Townsend, M.H.; Erickson, R.; Allen, C.; O’Neill, K.L. Thymidine kinase 1 through the ages: A comprehensive review. Cell Biosci. 2020, 10, 138. [Google Scholar] [CrossRef] [PubMed]
- Cargnello, M.; Roux, P.P. Activation and function of the MAPKs and their substrates, the MAPK-activated protein kinases. Microbiol. Mol. Biol. Rev. 2011, 75, 50–83. [Google Scholar] [CrossRef] [PubMed]
- Pizzino, G.; Irrera, N.; Cucinotta, M.; Pallio, G.; Mannino, F.; Arcoraci, V.; Squadrito, F.; Altavilla, D.; Bitto, A. Oxidative Stress: Harms and Benefits for Human Health. Oxid. Med. Cell Longev. 2017, 2017, 8416763. [Google Scholar] [CrossRef]
- Afzal, S.; Abdul Manap, A.S.; Attiq, A.; Albokhadaim, I.; Kandeel, M.; Alhojaily, S.M. From imbalance to impairment: The central role of reactive oxygen species in oxidative stress-induced disorders and therapeutic exploration. Front. Pharmacol. 2023, 14, 1269581. [Google Scholar] [CrossRef] [PubMed]


| IC50 (µM) | ||||||
|---|---|---|---|---|---|---|
| MCF−7 | MDA−MB−231 | HT29 | A2780 | ADDP | MCF10A | |
| Cisplatin | 1.35 a | 1.36 | 1.97 | 1.55 | 2.02 | 1.47 |
| PtIIPHENSS | 2.12 *** b | 1.36 ** | 1.47 **** | 1.88 ** | 1.48 **** | 1.39 NS |
| PtII5MESS | 1.67 *** | 1.94 ** | 1.42 **** | 1.71 *** | 1.33 **** | 1.75 NS |
| PtII56MESS | 2.08 *** | 1.48 ** | 1.49 **** | 1.17 *** | 1.27 **** | 1.52 NS |
| PtIVPHENSS(OH)2 | 1.26 *** | 1.37 ** | 1.77 **** | 1.23 ** | 1.57 **** | 1.32 ** |
| PtIV5MESS(OH)2 | 1.53 *** | 1.39 ** | 1.45 **** | 1.38 *** | 1.31 **** | 1.48 * |
| PtIV56MESS(OH)2 | 1.47 *** | 1.22 ** | 1.38 **** | 1.36 *** | 1.55 **** | 1.45 * |
| MCF−7 | MDA−MB−231 | HT29 | A2780 | ADDP | |
|---|---|---|---|---|---|
| Cisplatin | 0.14 | 0.36 | 0.06 | 0.22 | 0.04 |
| PtIIPHENSS | 1.91 | 3.45 | 4.59 | 3.14 | 1.37 |
| PtII5MESS | 1.37 | 2.27 | 2.15 | 1.82 | 0.89 |
| PtII56MESS | 0.73 | 2.93 | 2.28 | 2.16 | 0.54 |
| PtIVPHENSS(OH)2 | 2.18 | 6.13 | 4.57 | 3.15 | 1.49 |
| PtIV5MESS(OH)2 | 5.66 | 4.38 | 3.36 | 5.71 | 1.58 |
| PtIV56MESS(OH)2 | 3.61 | 6.92 | 3.93 | 2.90 | 1.18 |
| M) | MDA−MB−231 3D Networks | MDA−MB−231 Spheroids | HT29 Spheroids |
|---|---|---|---|
| Cisplatin | 15.99 1.49 a | 48.47 1.62 | 444.80 5.09 |
| PtIIPHENSS | 2.84 1.56 ** b | 5.44 1.35 **** | 3.93 1.46 **** |
| PtII5MESS | 2.04 1.31 ** | 4.08 1.37 **** | 2.91 1.39 **** |
| PtII56MESS | 0.98 1.21 ** | 2.49 1.98 **** | 0.99 1.29 **** |
| PtIVPHENSS(OH)2 | 6.18 1.62 * | 13.49 1.25 **** | 11.40 1.31 **** |
| PtIV5MESS(OH)2 | 3.82 1.42 ** | 7.99 1.30 **** | 8.46 1.23 **** |
| PtIV56MESS(OH)2 | 1.40 1.34 ** | 4.59 1.35 **** | 3.16 1.32 **** |
Disclaimer/Publisher’s Note: The statements, opinions and data contained in all publications are solely those of the individual author(s) and contributor(s) and not of MDPI and/or the editor(s). MDPI and/or the editor(s) disclaim responsibility for any injury to people or property resulting from any ideas, methods, instructions or products referred to in the content. |
© 2024 by the authors. Licensee MDPI, Basel, Switzerland. This article is an open access article distributed under the terms and conditions of the Creative Commons Attribution (CC BY) license (https://creativecommons.org/licenses/by/4.0/).
Share and Cite
Elias, M.G.; Fatima, S.; Mann, T.J.; Karan, S.; Mikhael, M.; de Souza, P.; Gordon, C.P.; Scott, K.F.; Aldrich-Wright, J.R. Anticancer Effect of PtIIPHENSS, PtII5MESS, PtII56MESS and Their Platinum(IV)-Dihydroxy Derivatives against Triple-Negative Breast Cancer and Cisplatin-Resistant Colorectal Cancer. Cancers 2024, 16, 2544. https://doi.org/10.3390/cancers16142544
Elias MG, Fatima S, Mann TJ, Karan S, Mikhael M, de Souza P, Gordon CP, Scott KF, Aldrich-Wright JR. Anticancer Effect of PtIIPHENSS, PtII5MESS, PtII56MESS and Their Platinum(IV)-Dihydroxy Derivatives against Triple-Negative Breast Cancer and Cisplatin-Resistant Colorectal Cancer. Cancers. 2024; 16(14):2544. https://doi.org/10.3390/cancers16142544
Chicago/Turabian StyleElias, Maria George, Shadma Fatima, Timothy J. Mann, Shawan Karan, Meena Mikhael, Paul de Souza, Christopher P. Gordon, Kieran F. Scott, and Janice R. Aldrich-Wright. 2024. "Anticancer Effect of PtIIPHENSS, PtII5MESS, PtII56MESS and Their Platinum(IV)-Dihydroxy Derivatives against Triple-Negative Breast Cancer and Cisplatin-Resistant Colorectal Cancer" Cancers 16, no. 14: 2544. https://doi.org/10.3390/cancers16142544