
Glioma Type Prediction with Dynamic Contrast-Enhanced MR Imaging and Diffusion Kurtosis Imaging—A Standardized Multicenter Study
 , , , , ,
Abstract
:Simple Summary
Abstract
1. Introduction
2. Materials and Methods
2.1. Study Design
2.2. Patients
2.3. MR Imaging
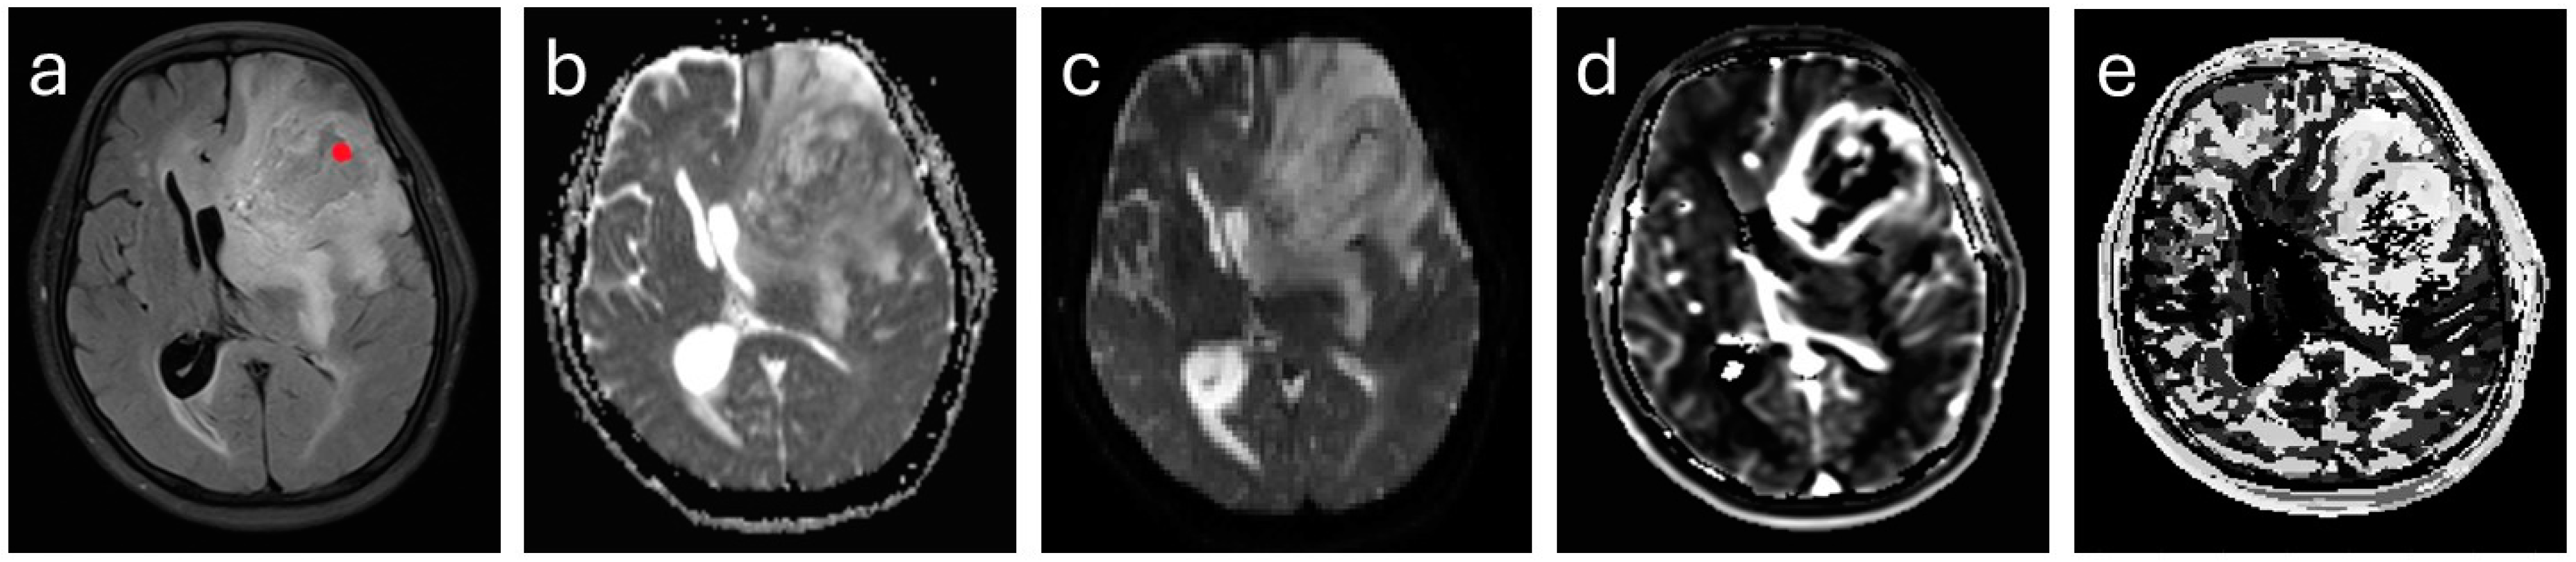
2.4. Image Analysis
2.5. Postoperative Tumor Grading
2.6. Statistical Analysis
3. Results
3.1. Patients
3.2. Evaluation of the Individual and Combined DCE-MRI and DKI Parameters
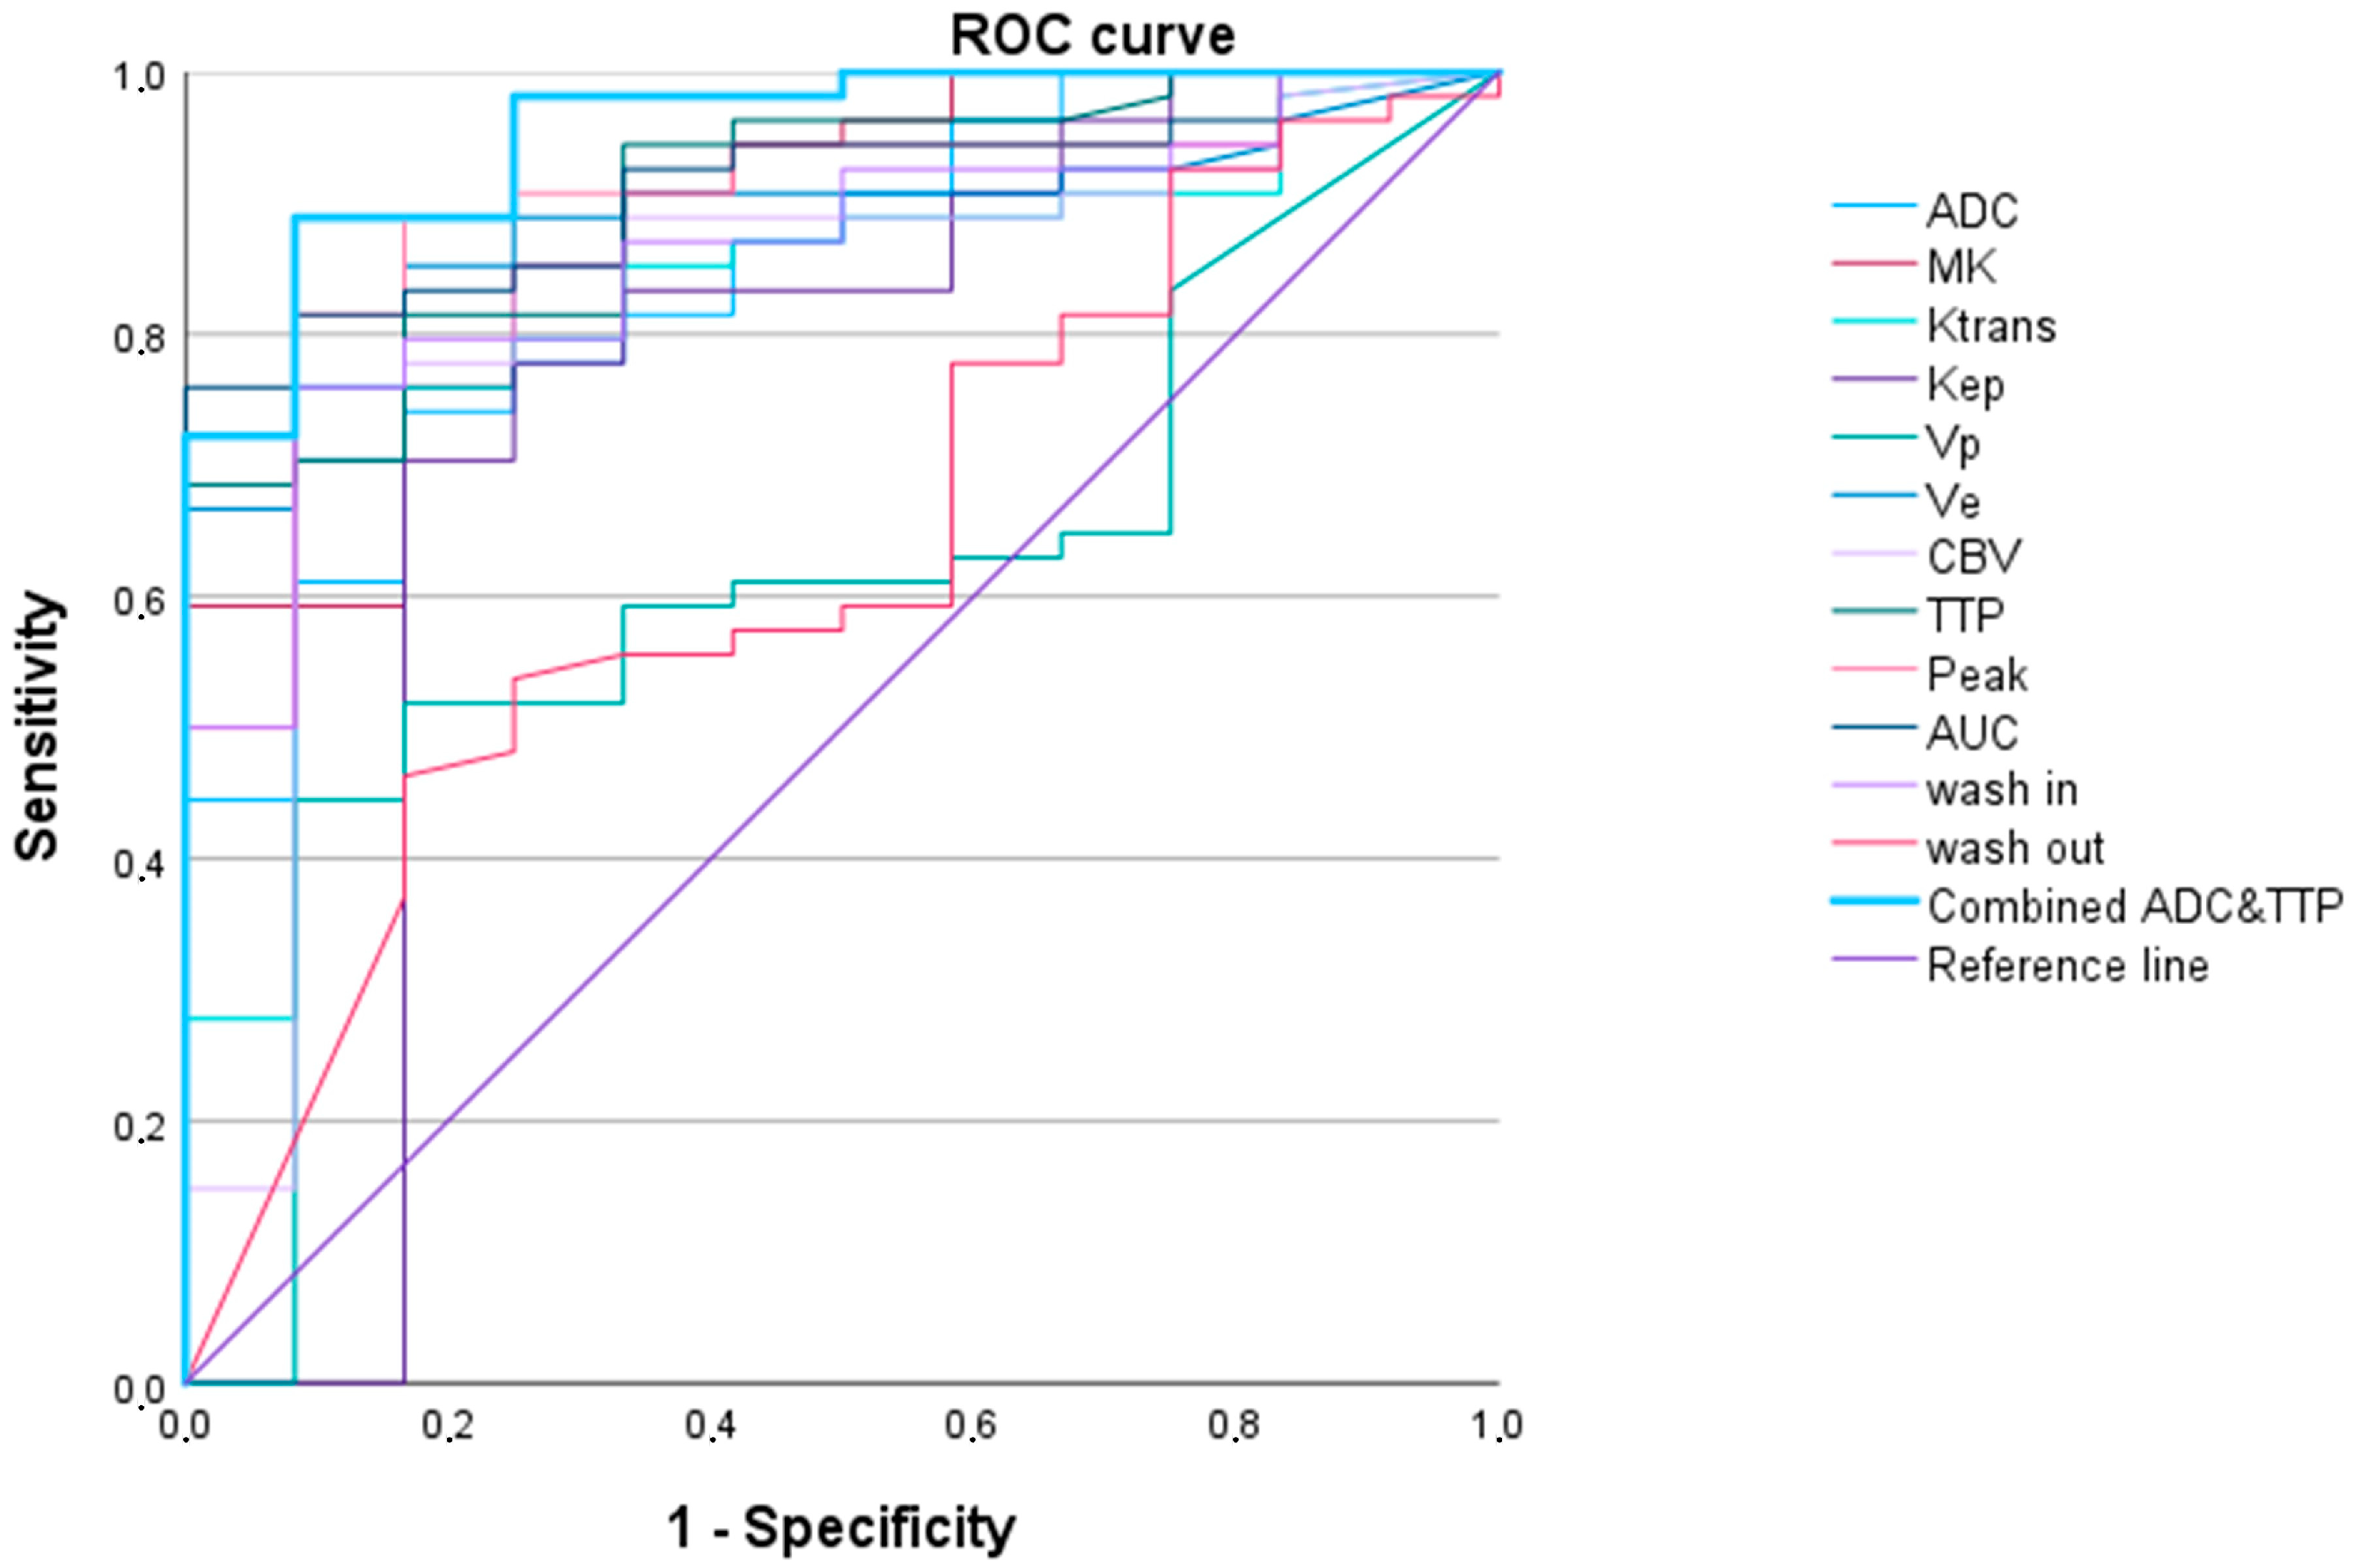
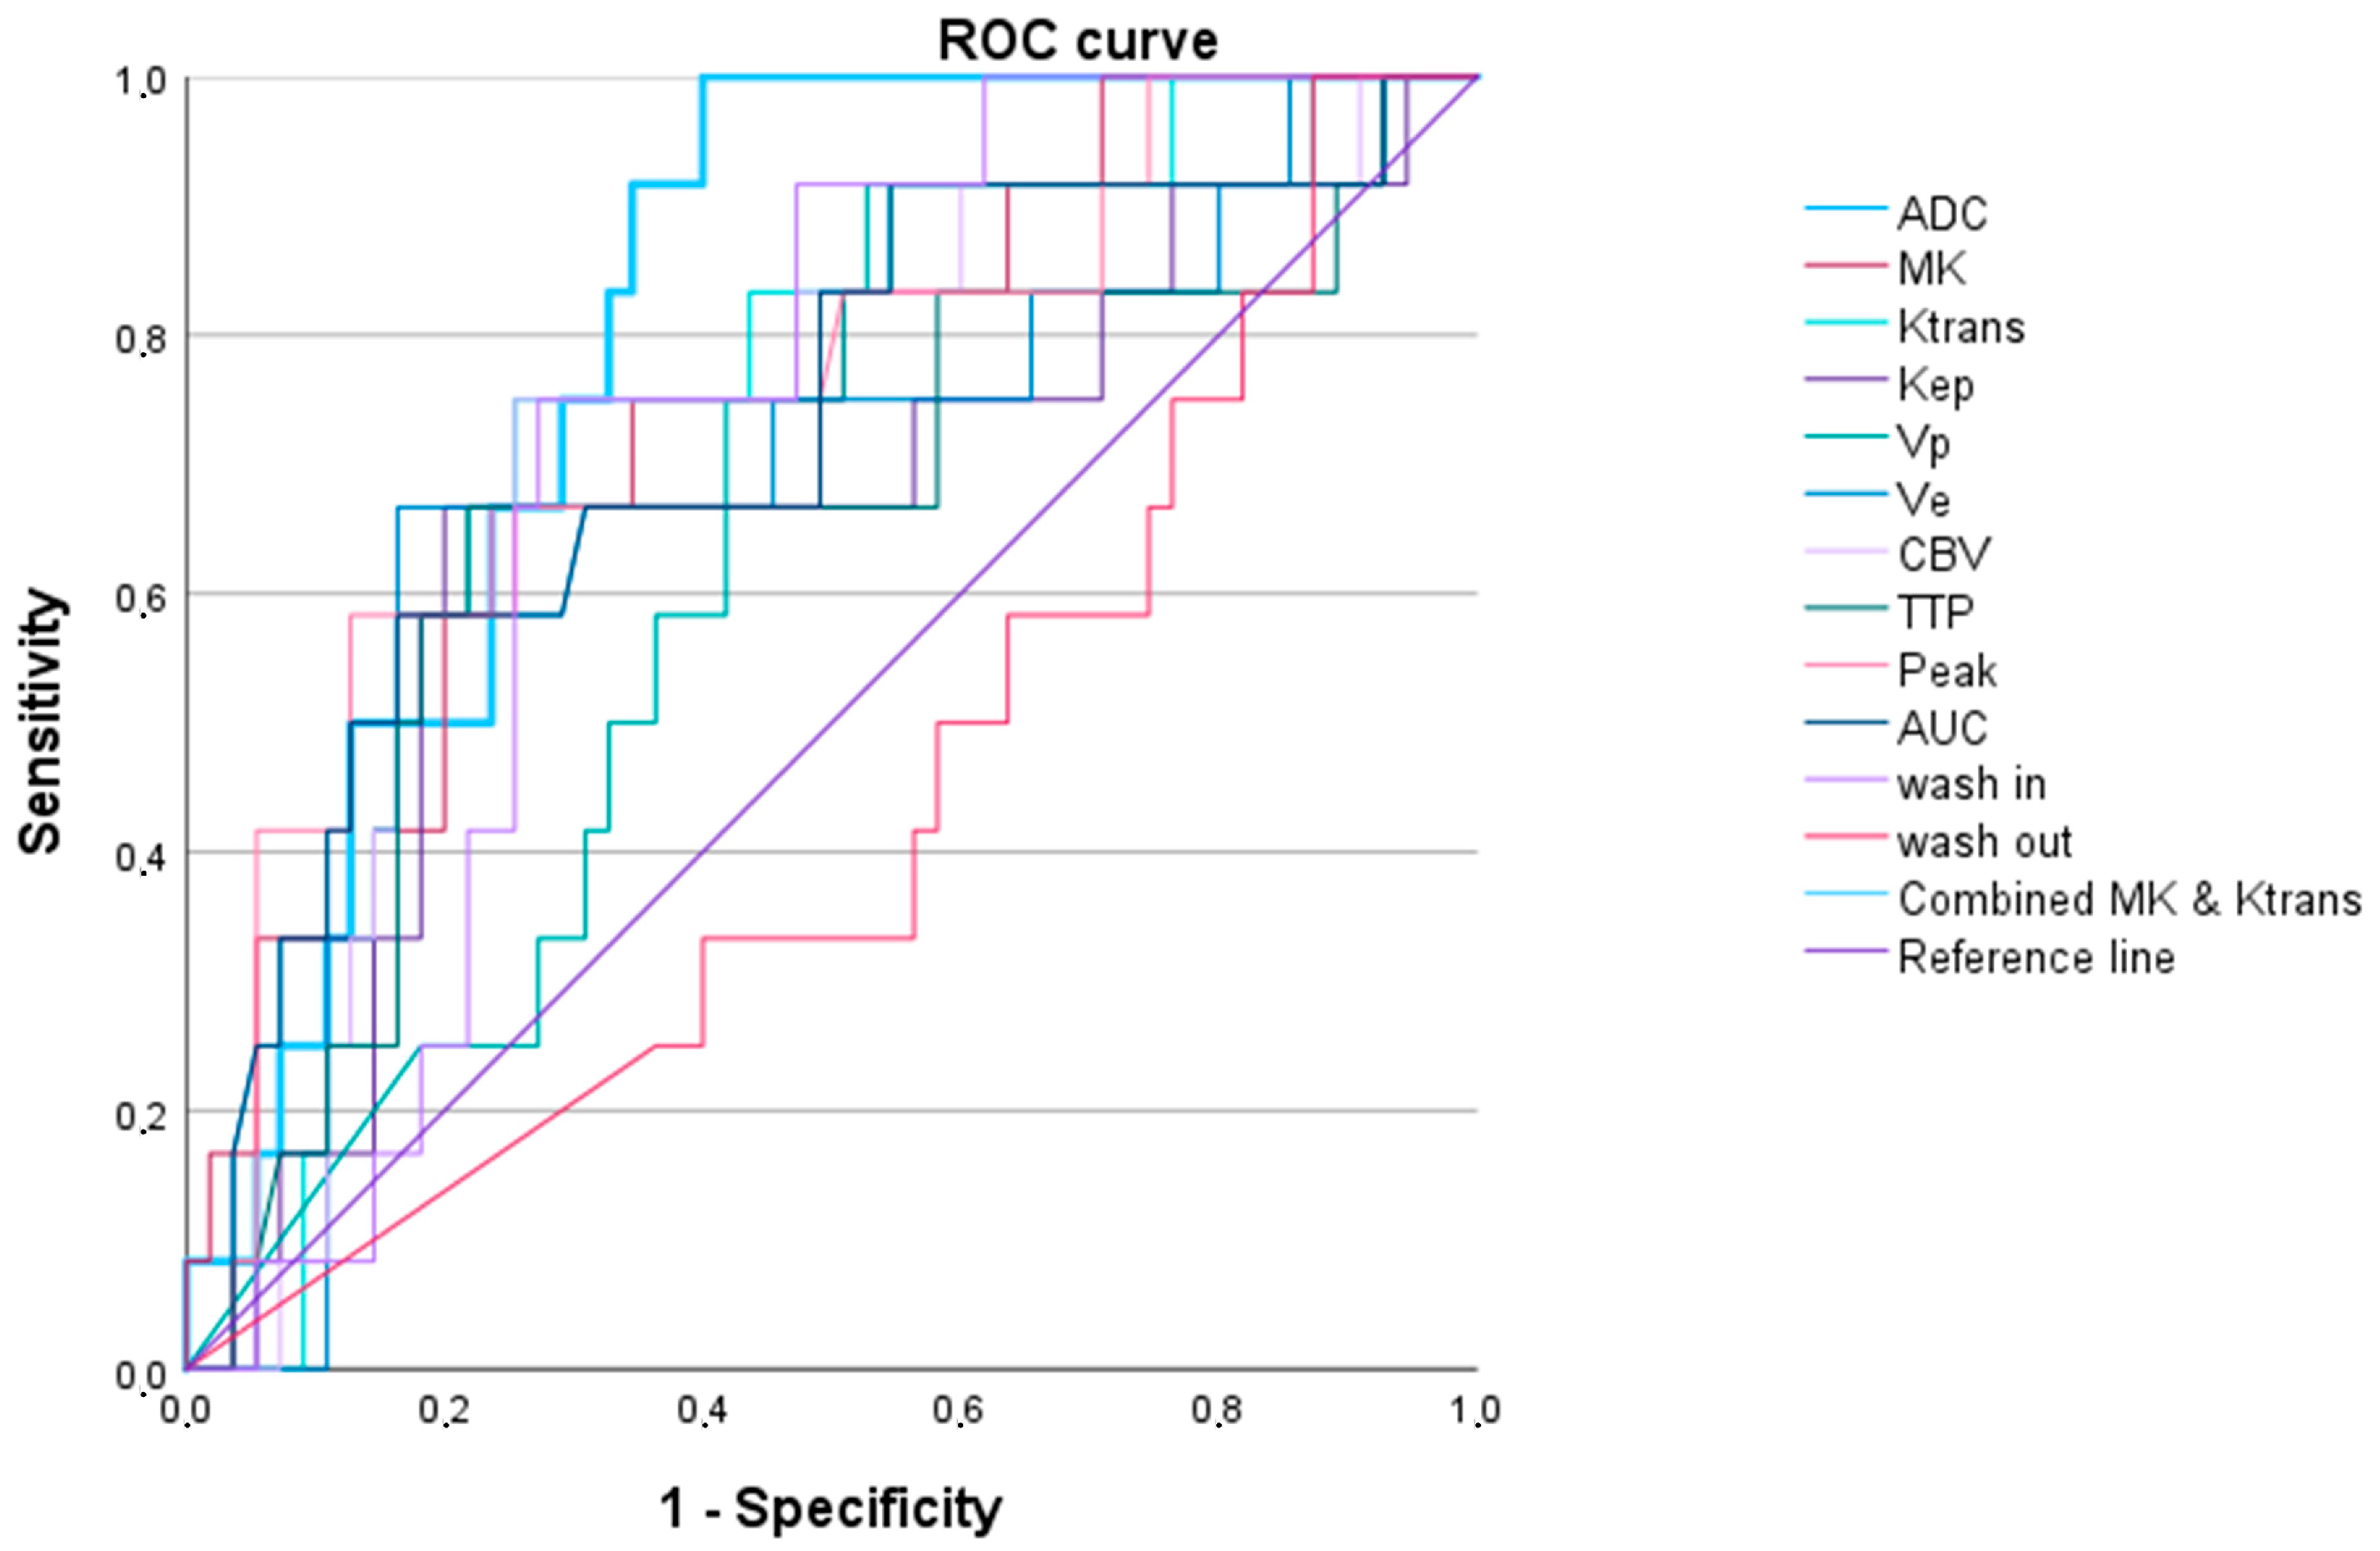
3.2.1. LGG versus HGG
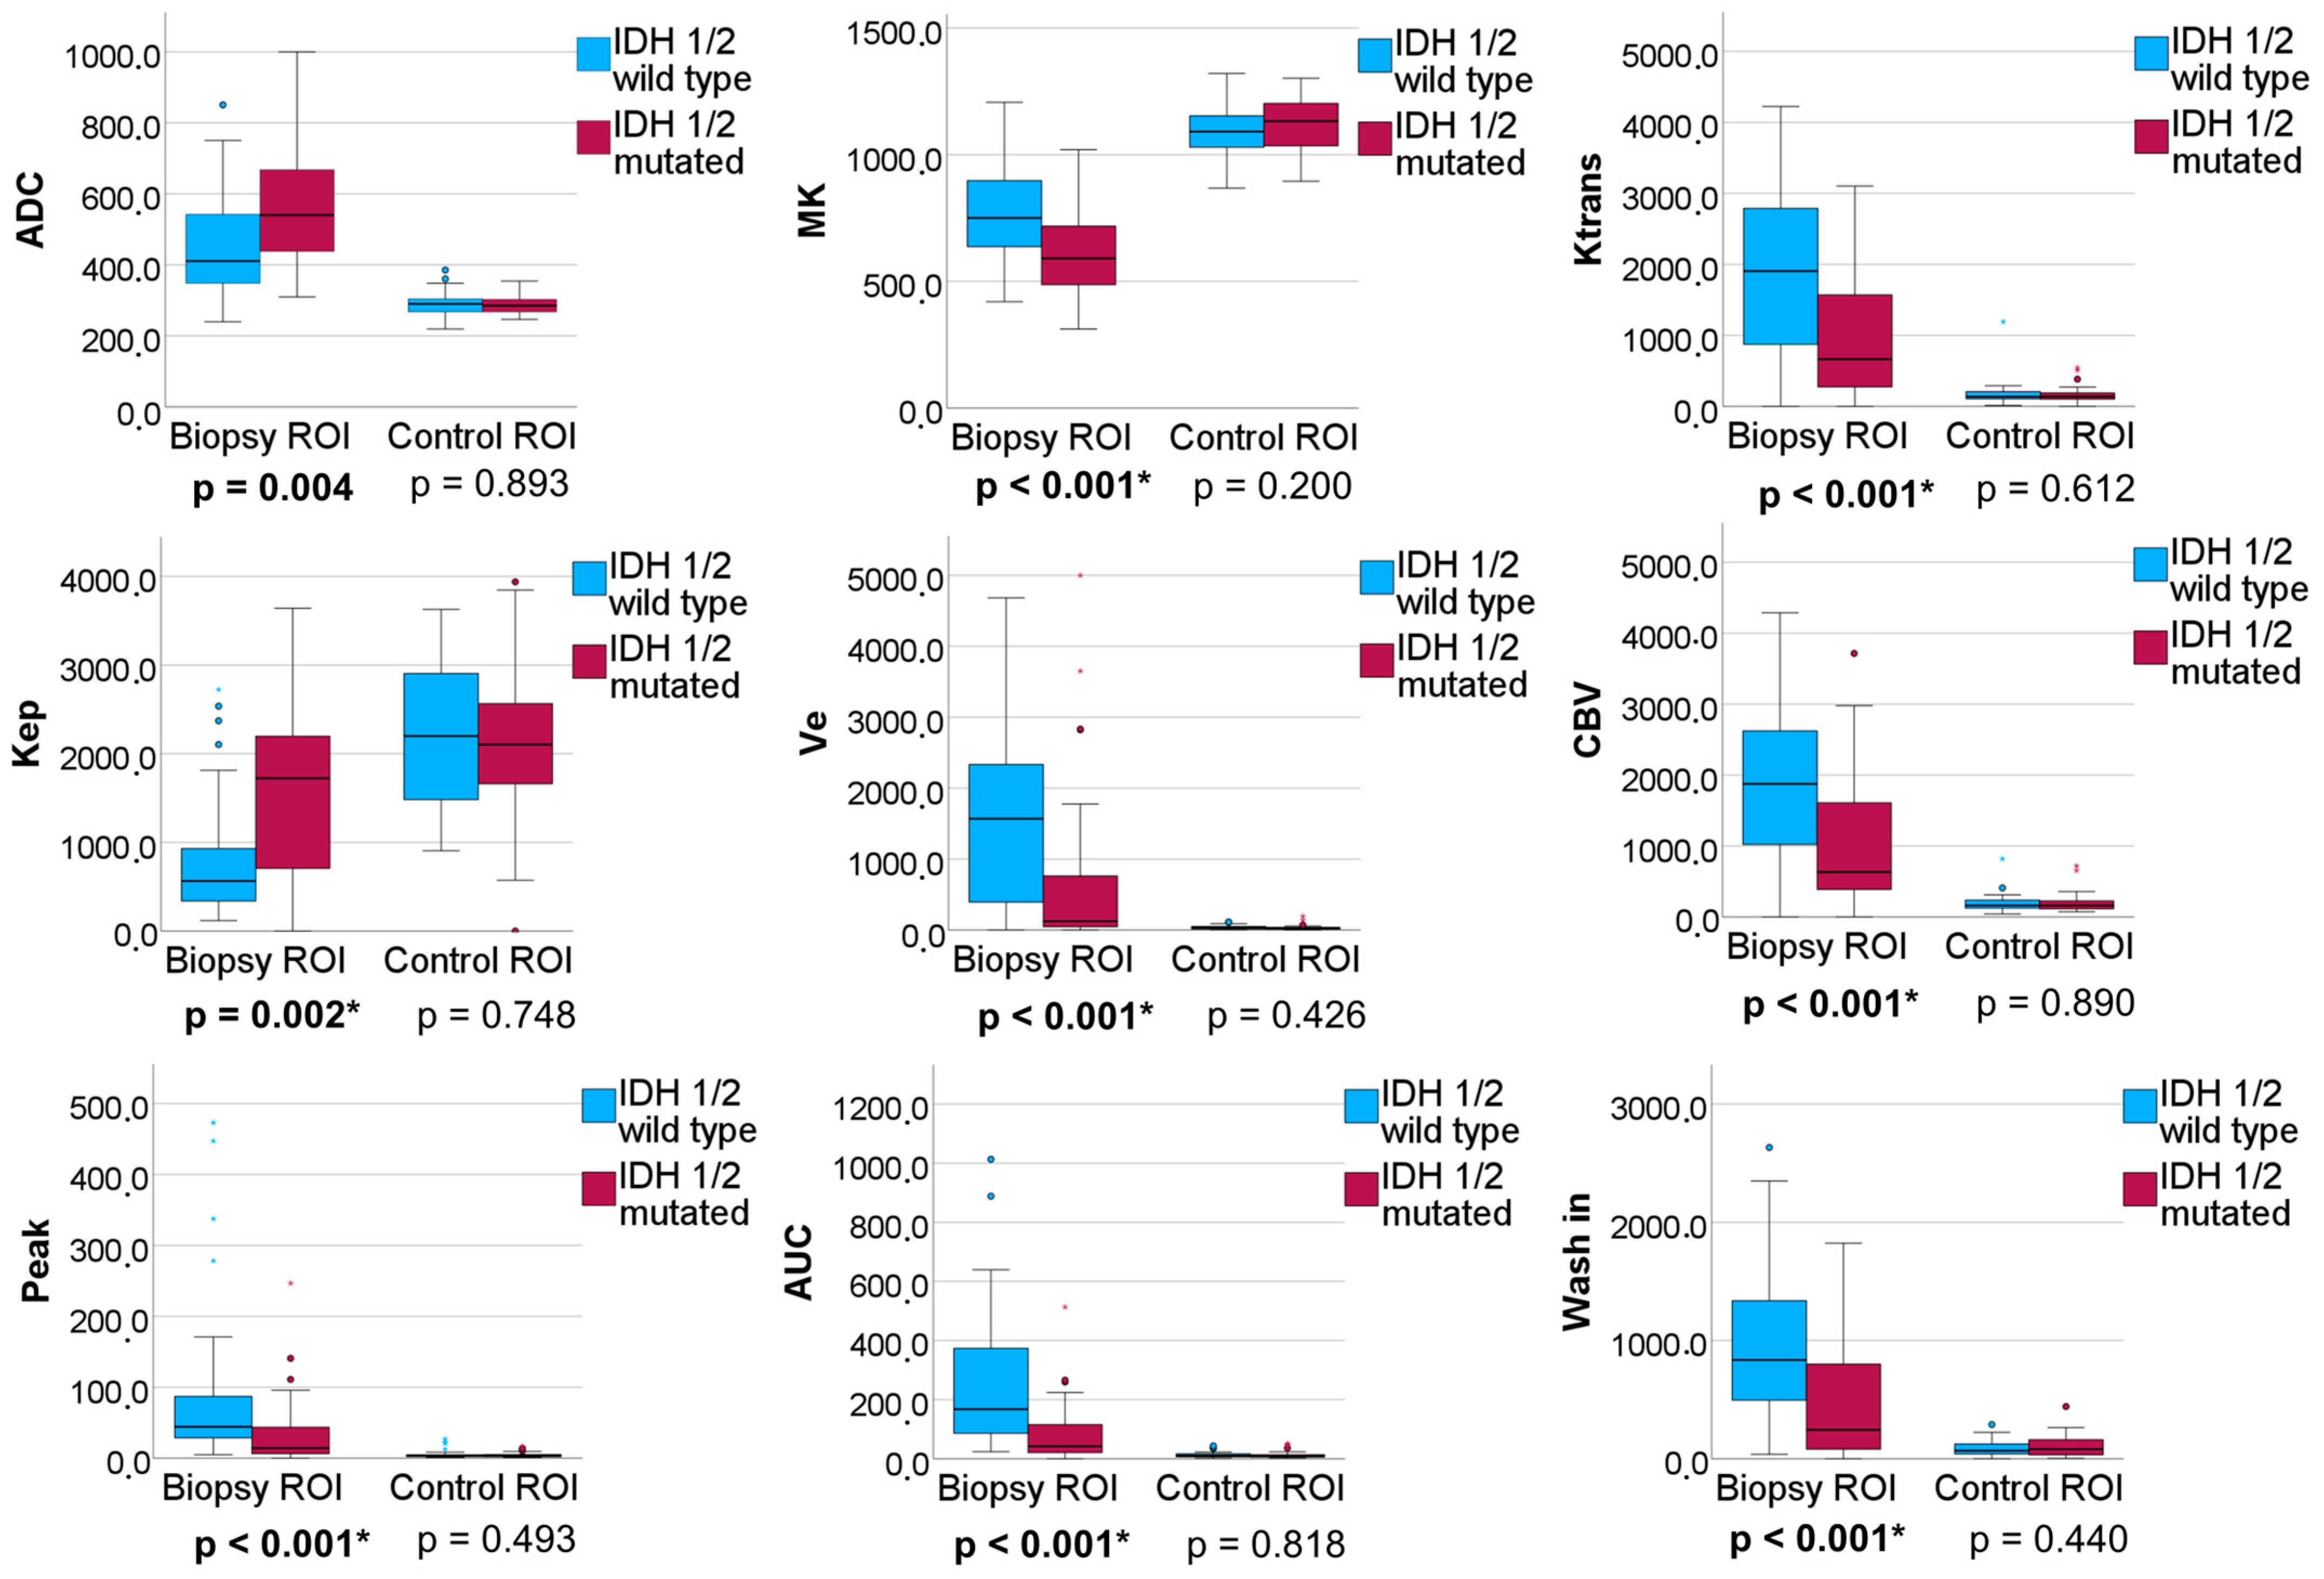
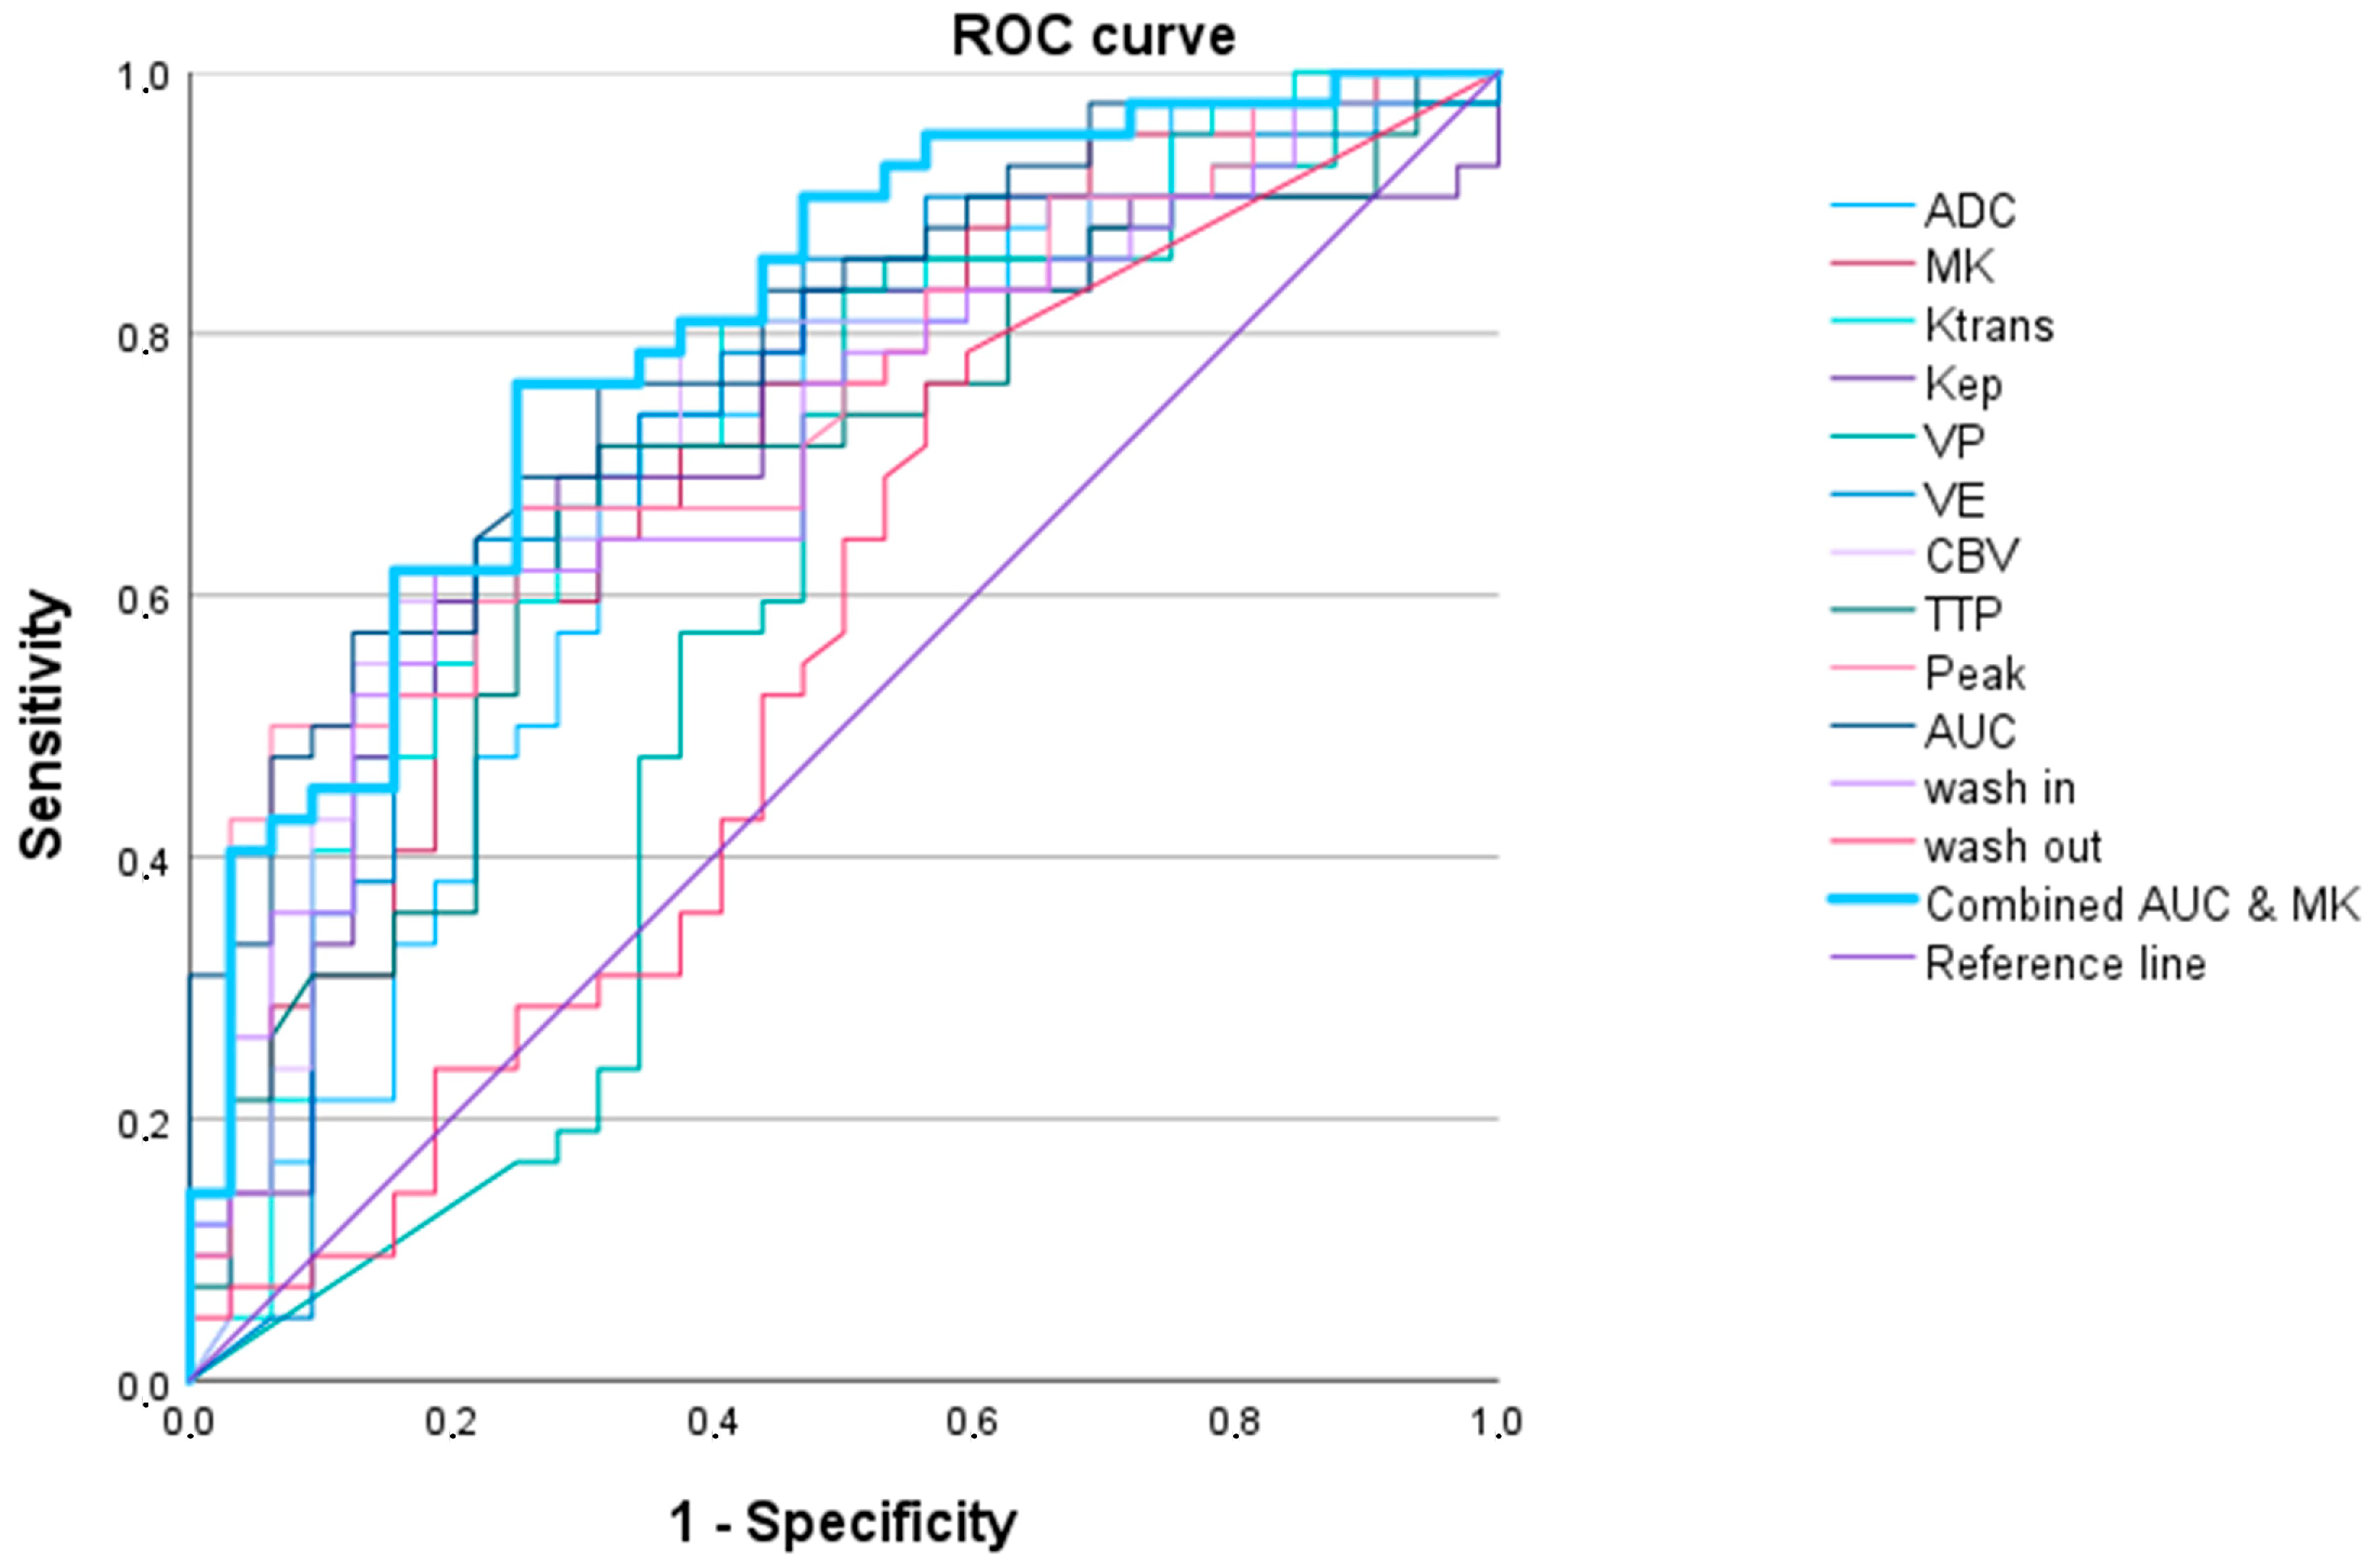
3.2.2. IDH 1/2 Mutated versus IDH 1/2 Wildtype Gliomas
3.2.3. High-Grade Oligodendroglial versus High-Grade Astrocytic Gliomas
4. Discussion
5. Conclusions
Supplementary Materials
Author Contributions
Funding
Institutional Review Board Statement
Informed Consent Statement
Data Availability Statement
Acknowledgments
Conflicts of Interest
References
- Horbinski, C.; Berger, T.; Packer, R.J.; Wen, P.Y. Clinical implications of the 2021 edition of the WHO classification of central nervous system tumours. Nat. Rev. Neurol. 2022, 18, 515–529. [Google Scholar] [CrossRef]
- Bale, T.A.; Rosenblum, M.K. The 2021 WHO Classification of Tumors of the Central Nervous System: An update on pediatric low-grade gliomas and glioneuronal tumors. Brain Pathol. 2022, 32, e13060. [Google Scholar] [CrossRef]
- Gritsch, S.; Batchelor, T.T.; Gonzalez Castro, L.N. Diagnostic, therapeutic, and prognostic implications of the 2021 World Health Organization classification of tumors of the central nervous system. Cancer 2022, 128, 47–58. [Google Scholar] [CrossRef]
- Louis, D.N.; Perry, A.; Reifenberger, G.; von Deimling, A.; Figarella-Branger, D.; Cavenee, W.K.; Ohgaki, H.; Wiestler, O.D.; Kleihues, P.; Ellison, D.W. The 2016 World Health Organization Classification of Tumors of the Central Nervous System: A summary. Acta Neuropathol. 2016, 131, 803–820. [Google Scholar] [CrossRef]
- Louis, D.N.; Perry, A.; Wesseling, P.; Brat, D.J.; Cree, I.A.; Figarella-Branger, D.; Hawkins, C.; Ng, H.K.; Pfister, S.M.; Reifenberger, G.; et al. The 2021 WHO Classification of Tumors of the Central Nervous System: A summary. Neuro-Oncology 2021, 23, 1231–1251. [Google Scholar] [CrossRef]
- Alkanhal, H.; Das, K.; Poptani, H. Diffusion- and Perfusion-Weighted Magnetic Resonance Imaging Methods in Nonenhancing Gliomas. World Neurosurg. 2020, 141, 123–130. [Google Scholar] [CrossRef]
- Hirschler, L.; Sollmann, N.; Schmitz-Abecassis, B.; Pinto, J.; Arzanforoosh, F.; Barkhof, F.; Booth, T.; Calvo-Imirizaldu, M.; Cassia, G.; Chmelik, M.; et al. Advanced MR Techniques for Preoperative Glioma Characterization: Part 1. J. Magn. Reson. Imaging 2023, 57, 1655–1675. [Google Scholar] [CrossRef]
- Hempel, J.M.; Schittenhelm, J.; Brendle, C.; Bender, B.; Bier, G.; Skardelly, M.; Tabatabai, G.; Castaneda Vega, S.; Ernemann, U.; Klose, U. Histogram analysis of diffusion kurtosis imaging estimates for in vivo assessment of 2016 WHO glioma grades: A cross-sectional observational study. Eur. J. Radiol. 2017, 95, 202–211. [Google Scholar] [CrossRef]
- Verburg, N.; Hoefnagels, F.W.A.; Barkhof, F.; Boellaard, R.; Goldman, S.; Guo, J.; Heimans, J.J.; Hoekstra, O.S.; Jain, R.; Kinoshita, M.; et al. Diagnostic Accuracy of Neuroimaging to Delineate Diffuse Gliomas within the Brain: A Meta-Analysis. AJNR Am. J. Neuroradiol. 2017, 38, 1884–1891. [Google Scholar] [CrossRef]
- Okuchi, S.; Rojas-Garcia, A.; Ulyte, A.; Lopez, I.; Usinskiene, J.; Lewis, M.; Hassanein, S.M.; Sanverdi, E.; Golay, X.; Thust, S.; et al. Diagnostic accuracy of dynamic contrast-enhanced perfusion MRI in stratifying gliomas: A systematic review and meta-analysis. Cancer Med. 2019, 8, 5564–5573. [Google Scholar] [CrossRef]
- Patel, P.; Baradaran, H.; Delgado, D.; Askin, G.; Christos, P.; John Tsiouris, A.; Gupta, A. MR perfusion-weighted imaging in the evaluation of high-grade gliomas after treatment: A systematic review and meta-analysis. Neuro-Oncology 2017, 19, 118–127. [Google Scholar] [CrossRef] [PubMed]
- Li, A.Y.; Iv, M. Conventional and Advanced Imaging Techniques in Post-treatment Glioma Imaging. Front. Radiol. 2022, 2, 883293. [Google Scholar] [CrossRef] [PubMed]
- Pope, W.B.; Brandal, G. Conventional and advanced magnetic resonance imaging in patients with high-grade glioma. Q. J. Nucl. Med. Mol. Imaging 2018, 62, 239–253. [Google Scholar] [CrossRef] [PubMed]
- Essig, M.; Shiroishi, M.S.; Nguyen, T.B.; Saake, M.; Provenzale, J.M.; Enterline, D.; Anzalone, N.; Dorfler, A.; Rovira, A.; Wintermark, M.; et al. Perfusion MRI: The five most frequently asked technical questions. AJR Am. J. Roentgenol. 2013, 200, 24–34. [Google Scholar] [CrossRef] [PubMed]
- Brendle, C.; Hempel, J.M.; Schittenhelm, J.; Skardelly, M.; Tabatabai, G.; Bender, B.; Ernemann, U.; Klose, U. Glioma Grading and Determination of IDH Mutation Status and ATRX loss by DCE and ASL Perfusion. Clin. Neuroradiol. 2018, 28, 421–428. [Google Scholar] [CrossRef] [PubMed]
- Abdalla, G.; Dixon, L.; Sanverdi, E.; Machado, P.M.; Kwong, J.S.W.; Panovska-Griffiths, J.; Rojas-Garcia, A.; Yoneoka, D.; Veraart, J.; Van Cauter, S.; et al. The diagnostic role of diffusional kurtosis imaging in glioma grading and differentiation of gliomas from other intra-axial brain tumours: A systematic review with critical appraisal and meta-analysis. Neuroradiology 2020, 62, 791–802. [Google Scholar] [CrossRef] [PubMed]
- Li, S.H.; Jiang, R.F.; Zhang, J.; Su, C.L.; Chen, X.W.; Zhang, J.X.; Jiang, J.J.; Zhu, W.Z. Application of Neurite Orientation Dispersion and Density Imaging in Assessing Glioma Grades and Cellular Proliferation. World Neurosurg. 2019, 131, e247–e254. [Google Scholar] [CrossRef]
- Hempel, J.M.; Bisdas, S.; Schittenhelm, J.; Brendle, C.; Bender, B.; Wassmann, H.; Skardelly, M.; Tabatabai, G.; Vega, S.C.; Ernemann, U.; et al. In vivo molecular profiling of human glioma using diffusion kurtosis imaging. J. Neurooncol. 2017, 131, 93–101. [Google Scholar] [CrossRef] [PubMed]
- Jensen, J.H.; Helpern, J.A. MRI quantification of non-Gaussian water diffusion by kurtosis analysis. NMR Biomed. 2010, 23, 698–710. [Google Scholar] [CrossRef]
- Cauter, S.V.; Veraart, J.; Sijbers, J.; Peeters, R.R.; Himmelreich, U.; Keyzer, F.D.; Gool, S.W.V.; Calenbergh, F.V.; Vleeschouwer, S.D.; Hecke, W.V.; et al. Gliomas: Diffusion Kurtosis MR Imaging in Grading. Radiology 2012, 263, 492–501. [Google Scholar] [CrossRef]
- Tan, Y.; Zhang, H.; Zhao, R.F.; Wang, X.C.; Qin, J.B.; Wu, X.F. Comparison of the values of MRI diffusion kurtosis imaging and diffusion tensor imaging in cerebral astrocytoma grading and their association with aquaporin-4. Neurol. India 2016, 64, 265–272. [Google Scholar] [CrossRef] [PubMed]
- Figini, M.; Riva, M.; Graham, M.; Castelli, G.M.; Fernandes, B.; Grimaldi, M.; Baselli, G.; Pessina, F.; Bello, L.; Zhang, H.; et al. Prediction of Isocitrate Dehydrogenase Genotype in Brain Gliomas with MRI: Single-Shell versus Multishell Diffusion Models. Radiology 2018, 289, 788–796. [Google Scholar] [CrossRef] [PubMed]
- Arevalo-Perez, J.; Peck, K.K.; Young, R.J.; Holodny, A.I.; Karimi, S.; Lyo, J.K. Dynamic Contrast-Enhanced Perfusion MRI and Diffusion-Weighted Imaging in Grading of Gliomas. J. Neuroimaging 2015, 25, 792–798. [Google Scholar] [CrossRef] [PubMed]
- Richter, V.; Nagele, T.; Erb, G.; Klose, U.; Ernemann, U.; Hauser, T.K. Improved diagnostic confidence and tumor type prediction in adult-type diffuse glioma by multimodal imaging including DCE perfusion and diffusion kurtosis mapping—A standardized multicenter study. Eur. J. Radiol. 2024, 171, 111293. [Google Scholar] [CrossRef] [PubMed]
- Pan, T.; Su, C.Q.; Tang, W.T.; Lin, J.; Lu, S.S.; Hong, X.N. Combined texture analysis of dynamic contrast-enhanced MRI with histogram analysis of diffusion kurtosis imaging for predicting IDH mutational status in gliomas. Acta Radiol. 2023, 64, 2552–2560. [Google Scholar] [CrossRef] [PubMed]
- Kickingereder, P.; Sahm, F.; Radbruch, A.; Wick, W.; Heiland, S.; Deimling, A.; Bendszus, M.; Wiestler, B. IDH mutation status is associated with a distinct hypoxia/angiogenesis transcriptome signature which is non-invasively predictable with rCBV imaging in human glioma. Sci. Rep. 2015, 5, 16238. [Google Scholar] [CrossRef] [PubMed]
- Gupta, M.; Gupta, A.; Yadav, V.; Parvaze, S.P.; Singh, A.; Saini, J.; Patir, R.; Vaishya, S.; Ahlawat, S.; Gupta, R.K. Comparative evaluation of intracranial oligodendroglioma and astrocytoma of similar grades using conventional and T1-weighted DCE-MRI. Neuroradiology 2021, 63, 1227–1239. [Google Scholar] [CrossRef] [PubMed]
- van der Meulen, M.; Mason, W.P. First-line chemotherapeutic treatment for oligodendroglioma, WHO grade 3-PCV or temozolomide? Neuro-Oncol. Pract. 2022, 9, 163–164. [Google Scholar] [CrossRef] [PubMed]
- Perneger, T.V. What’s wrong with Bonferroni adjustments. BMJ 1998, 316, 1236–1238. [Google Scholar] [CrossRef]
- Reynaud, O. Time-Dependent Diffusion MRI in Cancer: Tissue Modeling and Applications. Front. Phys. 2017, 5, 58. [Google Scholar] [CrossRef]
- Wurtemberger, U.; Diebold, M.; Erny, D.; Hosp, J.A.; Schnell, O.; Reinacher, P.C.; Rau, A.; Kellner, E.; Reisert, M.; Urbach, H.; et al. Diffusion Microstructure Imaging to Analyze Perilesional T2 Signal Changes in Brain Metastases and Glioblastomas. Cancers 2022, 14, 1155. [Google Scholar] [CrossRef] [PubMed]
- Wurtemberger, U.; Rau, A.; Reisert, M.; Kellner, E.; Diebold, M.; Erny, D.; Reinacher, P.C.; Hosp, J.A.; Hohenhaus, M.; Urbach, H.; et al. Differentiation of Perilesional Edema in Glioblastomas and Brain Metastases: Comparison of Diffusion Tensor Imaging, Neurite Orientation Dispersion and Density Imaging and Diffusion Microstructure Imaging. Cancers 2022, 15, 129. [Google Scholar] [CrossRef] [PubMed]
- Panagiotaki, E.; Walker-Samuel, S.; Siow, B.; Johnson, S.P.; Rajkumar, V.; Pedley, R.B.; Lythgoe, M.F.; Alexander, D.C. Noninvasive quantification of solid tumor microstructure using VERDICT MRI. Cancer Res. 2014, 74, 1902–1912. [Google Scholar] [CrossRef] [PubMed]


| Patients enrolled | 108 |
| Patients included | 81 |
| Patients excluded due to histopathological diagnosis | 17 |
| Patients excluded due to insufficient MRI quality | 10 |
| Mean age of the included patients ± SD | 45.1 ± 14.8 |
| Female/male ratio | 1:1.14 |
| Diffuse Astrocytoma (WHO grade 2) | 12 (14.8%) |
| Anaplastic Astrocytoma (WHO grade 3) | 7 (8.6%) |
| Oligodendroglioma (WHO grade 2) | 3 (3.7%) |
| Oligodendroglioma (WHO grade 3) | 12 (14.8%) |
| Glioblastoma (WHO grade 4) | 47 (58.0%) |
| WHO grade 2 | 15 (18.5%) |
| WHO grade 3 | 19 (23.5%) |
| WHO grade 4 | 47 (58.0%) |
| High-grade glioma (WHO grade 3 and 4) | 66 (81.5%) |
| Low-grade glioma (WHO grade 2) | 15 (18.5%) |
| IDH 1/2 wildtype | 32 (39.5%) |
| IDH 1/2 mutation | 42 (51.9%) |
| WHO Grade 2 vs. WHO Grades 3 and 4 Adult-Type Gliomas | ||||||
|---|---|---|---|---|---|---|
| AUC (95% Confidence Interval) | p-Value | Cut-Off Value 1 | Sensitivity | Specificity | AIC | |
| Ktrans | 0.819 (0.695–0.944) | 0.001 | 1083.0 | 0.704 | 0.917 | 50.101 |
| Kep | 0.738 (0.538–0.938) | 0.010 | 388.4 | 0.704 | 0.833 | 53.158 |
| Vp | 0.610 (0.445–0.775) | 0.235 | 1272.1 | 0.444 | 0.917 | 62.937 |
| Ve | 0.885 (0.803–0.967) | <0.001 | 133.4 | 0.852 | 0.833 | 40.898 |
| CBV | 0.821 (0.682–0.960) | 0.001 | 827.9 | 0.778 | 0.833 | 50.917 |
| TTP | 0.902 (0.822–0.982) | <0.001 | 1769.4 | 0.685 | 1.000 | 43.158 |
| Peak | 0.895 (0.804–0.986) | <0.001 | 11.9 | 0.889 | 0.883 | 41.096 |
| AUCDCE | 0.910 (0.840–0.980) | <0.001 | 76.2 | 0.759 | 1.000 | 37.911 |
| wash in | 0.860 (0.761–0.958) | <0.001 | 13,334.5 | 0.759 | 0.917 | 45.400 |
| wash out | 0.631 (0.461–0.801) | 0.158 | 4.3 | 0.463 | 0.833 | 60.495 |
| ADC | 0.844 (0.732–0.956) | <0.001 | 542.1 | 0.741 | 0.833 | 48.012 |
| MK | 0.884 (0.788–0.981) | <0.001 | 551.5 | 0.852 | 0.750 | 41.893 |
| TTP and ADC 2 | 0.954 (0.900–1.000) | <0.001 | 0.8 | 0.889 | 0.917 | 28.532 |
| IDH1/2 Wildtype vs. IDH1/2 Mutated Adult-Type Gliomas | ||||||
|---|---|---|---|---|---|---|
| AUC (95% Confidence Interval) | p-Value | Cut-Off Value 1 | Sensitivity | Specificity | AIC | |
| Ktrans | 0.731 (0.614–0.849) | 0.001 | 1692.2 | 0.810 | 0.594 | 89.848 |
| Kep | 0.710 (0.588–0.831) | 0.002 | 842.3 | 0.667 | 0.750 | 91.636 |
| Vp | 0.583 (0.441–0.724) | 0.226 | 1303.0 | 0.833 | 0.500 | 99.564 |
| Ve | 0.726 (0.604–0.848) | 0.001 | 366.3 | 0.643 | 0,781 | 94.220 |
| CBV | 0.738 (0.622–0.854) | <0.001 | 1734.6 | 0.810 | 0.625 | 91.196 |
| TTP | 0.685 (0.562–0.807) | 0.007 | 2000.3 | 0.714 | 0.688 | 95.088 |
| Peak | 0.738 (0.625–0.850) | <0.001 | 13.0 | 0.500 | 0.938 | 94.056 |
| AUCDCE | 0.791 (0.609–0.891) | <0.001 | 118.8 | 0.762 | 0.688 | 83.677 |
| wash in | 0.718 (0.602–0.834) | 0.001 | 439.5 | 0.619 | 0.813 | 92.798 |
| wash out | 0.555 (0.419–0.692) | 0.416 | 1.0 | 0.786 | 0.406 | 103.058 |
| ADC | 0.699 (0.576–0.821) | 0.004 | 468.8 | 0.738 | 0.656 | 94.858 |
| MK | 0.718 (0.601–0.835) | 0.001 | 620.9 | 0.595 | 0.781 | 91.430 |
| AUCDCE and MK 2 | 0.802 (0.702–0.903) | <0.001 | 0.6 | 0.762 | 0.759 | 80.982 |
| Oligodendroglioma (IDH1/2 Mutated 1p/19q Codeletion) (WHO Grade 3) vs. Glioblastoma IDH1/2 Wildtype (WHO Grade 4) and Astrocytoma IDH1/2 Mutated (WHO Grades 3 and 4) | ||||||
|---|---|---|---|---|---|---|
| AUC (95% Confidence Interval) | p Value | Cut-Off Value 1 | Sensitivity | Specificity | AIC | |
| Ktrans | 0.739 (0.598–0.880) | 0.010 | 834.1 | 0.750 | 0.745 | 57.060 |
| Kep | 0.655 (0.471–0.838) | 0.095 | 1665.0 | 0.667 | 0.800 | 60.861 |
| Vp | 0.642 (0.490–0.795) | 0.124 | 1269.2 | 0.917 | 0.436 | 61.163 |
| Ve | 0.680 (0.505–0.855) | 0.052 | 134.7 | 0.667 | 0.836 | 62.006 |
| CBV | 0.720 (0.561–0.878) | 0.018 | 900.6 | 0.750 | 0.745 | 59.183 |
| TTP | 0.660 (0.473–0.847) | 0.085 | 669.4 | 0.667 | 0.782 | 60.728 |
| Peak | 0.733 (0.571–0.894) | 0.012 | 10.9 | 0.583 | 0.873 | 58.150 |
| AUCDCE | 0.721 (0.555–0.887) | 0.017 | 41.4 | 0.583 | 0.836 | 61.297 |
| wash in | 0.715 (0.587–0.843) | 0.020 | 471.6 | 0.750 | 0.727 | 57.818 |
| wash out | 0.433 (0.262–0.605) | 0.472 | 44.0 | 1.000 | 0.127 | 64.886 |
| ADC | 0.721 (0.555–0.887) | 0.054 | 505.4 | 0.583 | 0.836 | 60.645 |
| MK | 0.741 (0.592–0.890) | 0.009 | 658.3 | 0.750 | 0.655 | 57.369 |
| Ktrans and MK 2 | 0.806 (0.700–0.912) | <0.001 | 0.1 | 1.000 | 0.600 | 54.839 |
Disclaimer/Publisher’s Note: The statements, opinions and data contained in all publications are solely those of the individual author(s) and contributor(s) and not of MDPI and/or the editor(s). MDPI and/or the editor(s) disclaim responsibility for any injury to people or property resulting from any ideas, methods, instructions or products referred to in the content. |
© 2024 by the authors. Licensee MDPI, Basel, Switzerland. This article is an open access article distributed under the terms and conditions of the Creative Commons Attribution (CC BY) license (https://creativecommons.org/licenses/by/4.0/).
Share and Cite
Zerweck, L.; Hauser, T.-K.; Klose, U.; Han, T.; Nägele, T.; Shen, M.; Gohla, G.; Estler, A.; Xie, C.; Hu, H.; et al. Glioma Type Prediction with Dynamic Contrast-Enhanced MR Imaging and Diffusion Kurtosis Imaging—A Standardized Multicenter Study. Cancers 2024, 16, 2644. https://doi.org/10.3390/cancers16152644
Zerweck L, Hauser T-K, Klose U, Han T, Nägele T, Shen M, Gohla G, Estler A, Xie C, Hu H, et al. Glioma Type Prediction with Dynamic Contrast-Enhanced MR Imaging and Diffusion Kurtosis Imaging—A Standardized Multicenter Study. Cancers. 2024; 16(15):2644. https://doi.org/10.3390/cancers16152644
Chicago/Turabian StyleZerweck, Leonie, Till-Karsten Hauser, Uwe Klose, Tong Han, Thomas Nägele, Mi Shen, Georg Gohla, Arne Estler, Chuanmiao Xie, Hongjie Hu, and et al. 2024. "Glioma Type Prediction with Dynamic Contrast-Enhanced MR Imaging and Diffusion Kurtosis Imaging—A Standardized Multicenter Study" Cancers 16, no. 15: 2644. https://doi.org/10.3390/cancers16152644