Article

The Significance of Longitudinal Psoas Muscle Loss in Predicting the Maintenance Efficacy of Durvalumab Treatment Following Concurrent Chemoradiotherapy in Patients with Non-Small Cell Lung Cancer: A Retrospective Study

by
Haruka Kuno
1,†,
Naoya Nishioka
1,†,
Tadaaki Yamada
1,*,
Yusuke Kunimatsu
1,2,
Akihiro Yoshimura
2,
Soichi Hirai
1,2,
Shun Futamura
3,
Taiki Masui
1,
Masashi Egami
1,
Yusuke Chihara
4 and
Koichi Takayama
1
1
Department of Pulmonary Medicine, Graduate School of Medical Science, Kyoto Prefectural University of Medicine, Kyoto 602-0841, Japan
2
Department of Respiratory Medicine, Japanese Red Cross Kyoto Daini Hospital, Kyoto 602-8026, Japan
3
Department of Medical Oncology, Fukuchiyama City Hospital, Fukuchiyama 620-8505, Japan
4
Department of Respiratory Medicine, Uji-Tokushukai Medical Center, Uji 611-0041, Japan
*
Author to whom correspondence should be addressed.
These authors contributed equally to this work.
Cancers 2024, 16(17), 3037; https://doi.org/10.3390/cancers16173037 (registering DOI)
Submission received: 16 August 2024 / Revised: 27 August 2024 / Accepted: 28 August 2024 / Published: 30 August 2024

Abstract

:

Simple Summary

Sarcopenia refers to a progressive and systemic reduction in skeletal muscle mass and strength and is a primary component of cancer cachexia. This retrospective study examined the impact of the rate of muscle loss between two time points during the pretreatment period with concurrent chemoradiotherapy on the clinical outcomes during subsequent durvalumab maintenance treatment. As the results showed, patients who experienced psoas muscle loss during chemoradiotherapy had a shorter progression-free survival and experienced reduced effectiveness of durvalumab treatment. This study highlights the importance of monitoring psoas muscle changes during chemoradiotherapy to predict the success of subsequent durvalumab therapy better in non-small cell lung cancer patients.

Abstract

Sarcopenia assessed at a single time point is associated with the efficacy of immunotherapy, and we hypothesized that longitudinal changes in muscle mass may also be important. This retrospective study included patients with non-small cell lung cancer (NSCLC) who received durvalumab treatment after concurrent chemoradiotherapy (CCRT) between January 2017 and April 2023. Muscle loss and sarcopenia were assessed based on the lumbar skeletal muscle area. Patients with a decrease in muscle area of 10% or more during CCRT were categorized into the muscle loss group, while those with a decrease of less than 10% were categorized into the muscle maintenance group. We evaluated the relationship between muscle changes during CCRT and the efficacy of durvalumab treatment. Among the 98 patients, the muscle maintenance group had a significantly longer PFS of durvalumab treatment compared to the muscle loss group (29.2 months [95% confidence interval (CI): 17.2—not reached] versus 11.3 months [95% CI: 7.6–22.3]; p = 0.008). The multivariable analysis confirmed that muscle change was a significant predictor of a superior PFS (HR: 0.47 [95% CI: 0.25–0.90]; the p-value was less than 0.05). In contrast, the OS between the groups did not differ significantly (not reached [95% CI: 21.8 months—not reached] and 36.6 months [95% CI: 26.9—not reached]; p = 0.49). Longitudinal muscle changes during CCRT are a predictor of durvalumab’s efficacy in patients with NSCLC after CCRT.

1. Introduction

Since their approval for the treatment of advanced lung cancer, immune checkpoint inhibitors (ICIs) have demonstrated durable efficacy compared to conventional chemotherapy in patients with non-small cell lung cancer (NSCLC), although ICIs are ineffective in certain patients [1,2,3,4,5]. Therefore, identifying the predictors of treatment response to ICI therapy is a critical clinical task. For patients with unresectable stage III NSCLC, concurrent chemoradiotherapy (CCRT) followed by ICI treatment is the standard of care [6]. Currently, programmed cell death ligand 1 (PD-L1) expression in tumors is universally used as a major predictor of the response to immunotherapy. However, this is not a sufficiently comprehensive factor [7,8,9]. Tumor mutational burden (TMB) has been suggested as another potential predictor. TMB refers to the total number of mutations per coding area of a tumor genome, and it has been associated with an increased neoantigen load and a better response to ICIs [10]. However, determining the cutoff for high TMB levels remains problematic. Furthermore, even among patients with a high TMB, only 29% responded to treatment, highlighting the limitations of TMB as a biomarker for ICI therapy [11,12]. Another factor is tumor aneuploidy, a condition characterized by abnormal chromosome copy numbers that is common in most cancers [13]. Aneuploidy plays a crucial role in the growth and survival of cancer cells and may promote tumor progression by suppressing antitumor immunity. Additionally, tumors with high levels of aneuploidy often have a poor prognosis in response to ICI therapy [14,15]. However, conclusive evidence supporting their efficacy remains lacking.
Sarcopenia refers to a progressive and systemic reduction in skeletal muscle mass and strength and is a primary component of cancer cachexia [16]. Sarcopenia is associated with a poor prognosis in solid cancers, including lung cancer [17]; approximately half of patients with stage III-IV NSCLC are affected by sarcopenia [18]. In patients with NSCLC with sarcopenia, a shorter progression-free survival (PFS) and overall survival (OS) have been reported compared to those in patients with NSCLC without sarcopenia [19,20,21,22,23]. Although accumulating evidence suggests that sarcopenia at a single time point is associated with the response to ICI therapy, assessing the rate of muscle loss at multiple time points from cancer onset to treatment initiation dynamically reflects sarcopenia independent of preexisting changes in body size and muscle mass at cancer diagnosis and can provide a more precise assessment. Recently, sarcopenia has been diagnosed based on skeletal muscle mass measurements using computed tomography (CT) images [24,25].
This study examines the impact of the rate of muscle loss between two time points during the pretreatment period with CCRT on the PFS and OS during subsequent ICI maintenance treatments. We also investigate whether the progression of sarcopenia at a given time point in this cohort could predict the treatment response to ICIs.

2. Materials and Methods

2.1. The Study Population

The study population included patients with NSCLC who received durvalumab treatment for at least one cycle after CCRT between January 2017 and April 2023 at four medical institutions. The reasons for exclusion were as follows: (a) the CT images obtained before chemoradiotherapy did not include images extending to the level of the third lumbar vertebra (L3) and (b) the CT images obtained before durvalumab administration did not include images extending to the L3 level. The institutional review board of our hospital approved this study and waived the requirement for written informed consent due to the retrospective nature of the study.

2.2. Data Collection

The following data were collected from the medical records of eligible patients: age, sex, Eastern Cooperative Oncology Group performance status (ECOG-PS) just before the initiation of chemoradiotherapy and durvalumab administration, stage, histology, driver oncogenes, PD-L1 tumor proportion score (TPS), type of chemotherapy, date of starting chemoradiotherapy and durvalumab administration, and the presence of grade 3 or higher gastrointestinal adverse events/anorexia/radiation esophagitis during CCRT according to the Common Terminology Criteria for Adverse Events (CTCAE version 5.0). Height and weight were measured within a week before chemoradiotherapy and durvalumab administration, and the body mass index (BMI) was calculated from these data. Cachexia was defined as weight loss >5% during chemoradiotherapy or >2% in patients with a BMI < 20 kg/m2. We obtained imaging data from chest and thoracoabdominal CT images obtained within 2 months before chemoradiotherapy and 1 month before durvalumab administration. These scans were used to collect data on the cross-sectional area of the lumbar skeletal muscle at L3 before chemoradiotherapy and durvalumab administration.

2.3. Evaluation of Muscle Quantity and Sarcopenia

Computed tomography scans with a slice thickness of 1–5 mm taken before chemoradiotherapy and durvalumab administration were used to identify the lumbar vertebral skeletal muscles, using a threshold of −29 to +150 Hounsfield units (HU). In this cohort, the cutoff value for muscle loss determined by ROC curve analysis of the durvalumab completion rates was 6.6% (area under the curve: 0.61; 95% confidence interval: 0.49–0.72) (Supplementary Figure S1). Additionally, based on previous studies, we classified NSCLC patients with a reduction of 10% or more in the cross-sectional area of their bilateral psoas muscles at the L3 level as belonging to the muscle loss group and those with a reduction of less than 10% as belonging to the muscle maintenance group in this study [26,27]. In addition to these criteria, the cross-sectional area of the psoas muscle at L3 was measured in the CT slices, and the psoas muscle mass index (PMI) was calculated by dividing this value by the square of the patient’s height to evaluate sarcopenia. The cutoff values for sarcopenia were set at 6.36 cm2/m2 for men and 3.92 cm2/m2 for women [25].

2.4. Statistical Analyses

The primary endpoint was PFS, which was defined as the duration from the initial administration of durvalumab to the first occurrence of disease progression according to the Response Evaluation Criteria in Solid Tumors (RECIST) criteria or death from any cause, whichever occurred first. Overall survival was defined as the period from the initial administration of durvalumab to the day of death from any cause or to the last confirmed date of survival. The survival analysis was conducted with the cutoff date for the entire cohort set as 31 May 2023. Progression-free survival and OS were calculated using the Kaplan–Meier method. Survival curves for the muscle loss and maintenance groups were compared using a log-rank test. Potential predictors were assessed using Cox proportional hazard models for PFS. Continuous variables are presented as medians (ranges or 95% confidence intervals), and comparisons between two groups were conducted using the Mann–Whitney U test. Nominal variables are presented as numbers (n) or percentages (%), and comparisons between two groups were performed using Fisher’s exact test. Statistical significance was set at p < 0.05. All the analyses were performed using EZR (Saitama Medical Center, Jichi Medical University, Saitama, Japan), which is a graphical user interface for R (R Foundation for Statistical Computing, Vienna, Austria). More precisely, it is a modified version of the R commander (version 2.9-1) designed to add statistical functions frequently used in biostatistics.

3. Results

3.1. Patient Characteristics and Treatment

Of 131 consecutive patients with NSCLC who initially received durvalumab for at least one cycle after chemoradiotherapy between January 2017 and April 2023 in four medical institutions, 98 patients were enrolled (Figure 1). The patient characteristics are provided in Table 1. The median age of the patients was 72 years (range: 49–87 years); a total of 73 (74.5%) patients were men, all with an ECOG-PS score of 0–1. The majority of the population comprised patients with stage III disease (89.7%), and 45 (45.9%) had adenocarcinomas, of whom 14 (14.3%) had driver oncogenes. In addition, the TPS was available for 86 (87.8%) patients; the TPS was <50% in 47 (46.9%) patients. The median BMI was 21.9 (range: 15.6–30.5) kg/m2 pre-chemoradiotherapy and 21.2 (range: 15.2–28.7) kg/m2 post-chemoradiotherapy. Further, 82 (83.7%) and 87 (88.8%) patients had sarcopenia before chemoradiotherapy and durvalumab administration, respectively. In addition, approximately half of the patients (54.1%) had cancer cachexia before chemoradiotherapy. The median interval from the initiation of chemoradiotherapy to the administration of durvalumab was 15.0 (range: 1.0–49.0) days. The completion rate for durvalumab treatment was 50% (49 cases). During the course of CCRT, the most common hematological toxicities were leukopenia (49 patients, 50%), neutropenia (43 patients, 43.9%), anemia (25 patients, 25.5%), and thrombocytopenia (20 patients, 20.4%). Toxicities of grade 3 or higher included leukopenia (40 patients, 40.8%), neutropenia (35 patients, 35.7%), and anemia (3 patients, 3.1%) and no severe thrombocytopenia cases. Febrile neutropenia occurred in six patients (6.1%). All grades of non-hematological toxicity included radiation pneumonitis (42 patients, 42.9%), esophagitis (41 patients, 41.8%), anorexia (34 patients, 34.7%), and hypoalbuminemia (18 patients, 18.4%). Non-hematologic toxicities of grade 3 or higher included esophagitis (14 patients, 14.3%), anorexia (11 patients, 11.2%), and radiation pneumonitis (2 patients, 2.0%) and no severe hypoalbuminemia cases.
The muscle maintenance (n = 62) and muscle loss groups (n = 36) showed no differences, except for those in the pre-chemotherapy median BMI (21.5 vs. 23.0 kg/m2, p < 0.05), the pre-chemoradiotherapy PMI in men (4.68 vs. 5.25 cm2/m2, p < 0.05), and the median duration from the start of chemoradiotherapy to the initiation of ICI treatment (21 days vs. 14 days, p < 0.05).

3.2. Impact of Sarcopenia on Durvalumab’s Efficacy at Different Time Points in Patients with NSCLC

We evaluated the effects of sarcopenia on the therapeutic efficacy of durvalumab in patients with NSCLC before chemoradiotherapy and durvalumab administration. The patients were divided into two groups based on the presence or absence of sarcopenia at two different time points: before chemoradiotherapy and before initiating durvalumab treatment. In the study population, 82 (83.6%) and 87 (88.8%) patients were diagnosed with sarcopenia before chemoradiotherapy and durvalumab administration, respectively. At both evaluation points, patients with sarcopenia tended to have shorter durvalumab efficacy durations, but no statistically significant differences were observed in PFS or OS based on the presence or absence of sarcopenia (Supplementary Figure S2).

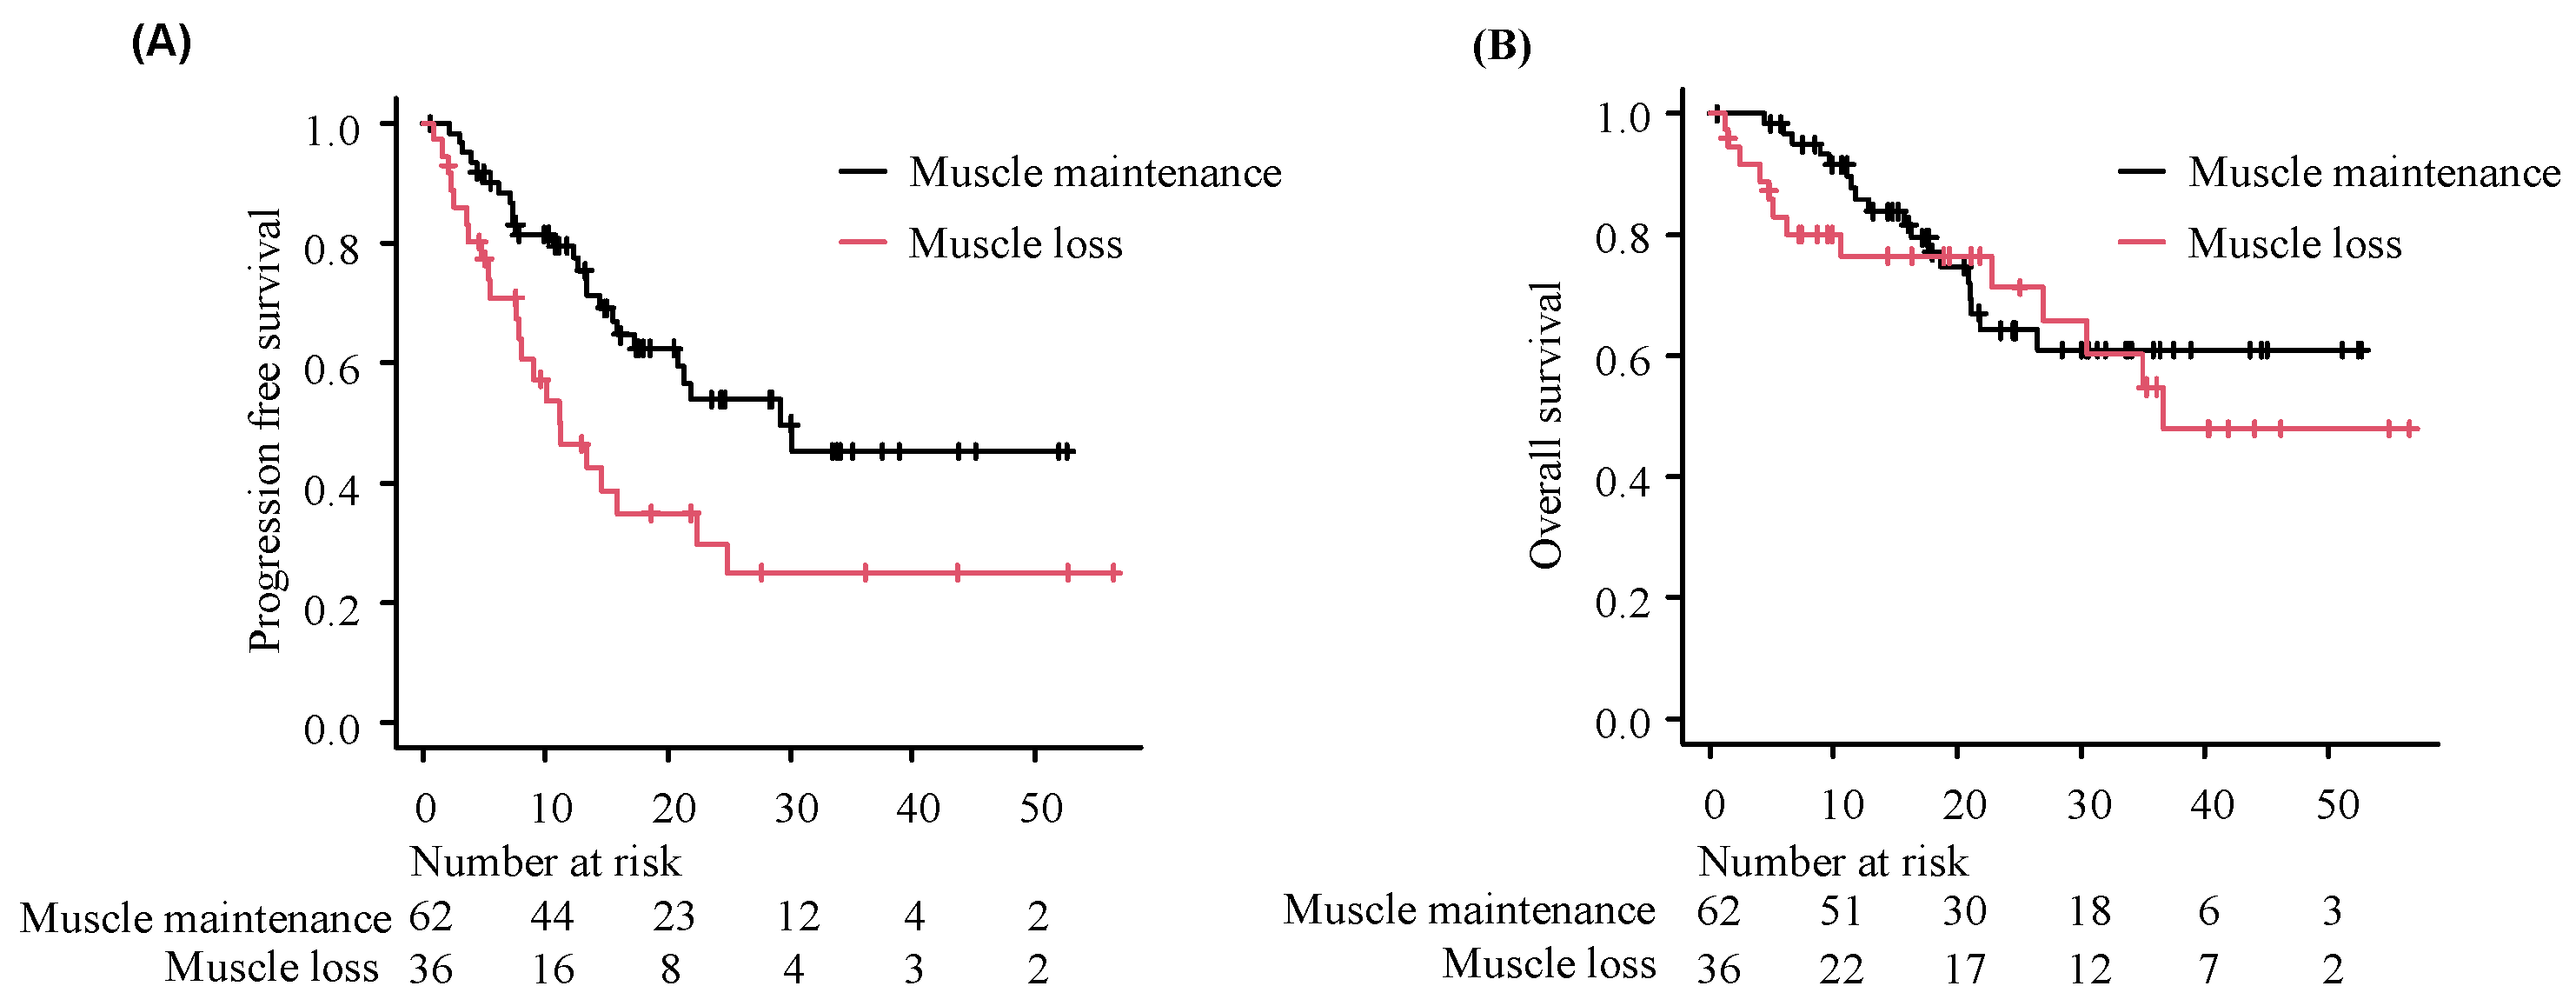
3.3. Impact of Longitudinal Muscle Loss on Clinical Outcomes of Durvalumab Treatment

As of the data cutoff date of 31 May 2023, with a median follow-up of 19.1 months (range: 0.6–57.4), 47/98 patients (48%) had experienced progressive disease. The muscle maintenance group had a longer PFS with durvalumab administration than the muscle loss group (29.2 months [95% CI: 17.2—not reached] versus 11.3 months [95% CI: 7.6–22.3], p = 0.008, Figure 2A). The multivariable analysis adjusted for age, ECOG PS score, and PD-L1 expression revealed that muscle maintenance was significantly associated with a superior PFS (hazard ratio: 0.47 [95% CI: 0.25–0.90], p < 0.05, Table 2). Of the 98 patients, 31 (31.6%) died before the cutoff date. The OS did not significantly differ between the two groups; respectively, the median OS was not reached (95% CI: 21.8 months not reached) and 36.6 months (95% CI: 26.9 months not reached) (p = 0.49, Figure 2B).

3.4. Combined Analysis of Longitudinal Muscle Loss and Single Time Point Sarcopenia in Predicting Durvalumab’s Efficacy

We categorized patients with NSCLC into four groups based on their longitudinal muscle loss combined with the presence or absence of sarcopenia at two specific time points: before chemoradiotherapy and before durvalumab administration. For the analysis based on sarcopenia status before chemoradiotherapy and muscle loss, the groups were defined as follows: non-sarcopenia with muscle maintenance; sarcopenia with muscle maintenance; non-sarcopenia with muscle loss; and sarcopenia with muscle loss (8 patients, PFS: NA [95% CI: NA–NA]; 54 patients, PFS: 21.9 months [95% CI: 15.5–NA]; 8 patients, PFS: 13.4 months [95% CI: 2.30–NA]; 28 patients, PFS: 11.1 months [95% CI: 5.49–22.31], respectively, p = 0.051) (Supplementary Figure S3A). For the evaluation of the association between sarcopenia status before durvalumab administration and muscle loss, the groups were defined as follows: non-sarcopenia with muscle maintenance; sarcopenia with muscle maintenance; non-sarcopenia with muscle loss; and sarcopenia with muscle loss (8 patients, PFS: NA [95% CI: NA–NA]; 54 patients, PFS: 21.9 months [95% CI: 15.5–NA]; 3 patients, PFS: 9.0 months [95% CI: 2.3–NA]; 33 patients, PFS: 11.3 months [95% CI: 7.6–22.3], respectively, p = 0.14) (Supplementary Figure S3B). Although no statistically significant differences were observed at any time point, there was a trend toward a shorter PFS with ICIs in patients with sarcopenia or a reduced muscle mass before chemoradiotherapy. Both conditions resulted in poor PFS outcomes. Conversely, before durvalumab treatment, a consistent trend of a shorter PFS with ICIs was observed in patients with a reduced muscle mass, regardless of the presence of sarcopenia (Supplementary Figure S3A).

4. Discussion

Muscle loss during chemoradiotherapy adversely affected the therapeutic efficacy of durvalumab maintenance therapy following CCRT in patients with NSCLC. However, the presence of sarcopenia at a single point, either before chemoradiotherapy or durvalumab administration, was not significantly associated with the therapeutic maintenance effect of durvalumab treatment, suggesting that longitudinal muscle loss may be a better predictor of treatment response to immunotherapy than a single-point assessment of skeletal muscle. Furthermore, on comparing the four groups based on longitudinal muscle loss and the presence or absence of sarcopenia, the muscle loss group consistently demonstrated a lower efficacy of durvalumab, regardless of the sarcopenia status before durvalumab administration.
The therapeutic effect of PD-1/PD-L1 inhibitors is associated with sarcopenia in patients with NSCLC [19,20,21,22,28,29,30,31]. In these previous reports, muscle loss (sarcopenia) was defined solely by the muscle mass observed in CT scans at a single point before treatment and suggested that the therapeutic effect of PD-1/PD-L1 inhibitors was significantly lower in the sarcopenia group [19,21,26]. We also evaluated the efficacy of durvalumab based on the presence or absence of sarcopenia before chemoradiotherapy and durvalumab administration. Although no significant differences were found, patients with sarcopenia tended to have a shorter PFS. However, when comparing the four groups based on longitudinal muscle loss and sarcopenia status before durvalumab administration, patients with muscle loss had a shorter PFS regardless of sarcopenia status. Therefore, in a cohort of patients with NSCLC receiving durvalumab after CCRT, longitudinal muscle mass loss may be a more sensitive predictor of treatment efficacy than sarcopenia before durvalumab administration. Roch et al. and Loosen et al. have linked changes in muscle mass over time to the therapeutic effects of ICIs [22,32]. These findings support our finding that longitudinal muscle loss is associated with the therapeutic effects of ICIs.
There are several hypotheses explaining why longitudinal muscle loss before ICI administration may adversely affect ICIs’ effectiveness. One hypothesis is that muscle loss serves as a marker of chronic inflammation [33,34]. In chronic inflammation caused by cancer cachexia, inflammatory cytokines such as TNF-α and IL-6 promote muscle loss and tumor growth [35,36]. Chronic inflammation promotes tumor progression by suppressing CD8+ T-cell infiltration through inflammatory cytokines/mediators or the induction of regulatory T cells and myeloid-derived suppressor cells (MDSCs), which are immunosuppressive cells [37,38]. Therefore, muscle loss may serve as a biomarker of chronic inflammation, and the insufficient effectiveness of ICIs may be attributed to altered tumor microcirculation caused by chronic inflammation. Longitudinal changes in muscle quantity, which allow for more precise assessments, may be more sensitive to the effects of chronic inflammation than single-point measurements. A second hypothesis is that exercise in the muscle maintenance group during chemoradiotherapy may have boosted muscle strength and antitumor immunity, thereby enhancing the ICI treatment’s efficacy. Unfortunately, we were unable to collect patient data on rehabilitation and exercise during the radiotherapy period in this study. However, in general, the muscle-maintaining group tended to maintain their muscle strength better than the muscle loss group [39,40]. In addition, exercise is beneficial for patients with lung cancer, as it promotes muscle growth, maintains muscle strength, increases appetite, and prevents weight loss [39,40]. In animal models, exercise suppresses tumor growth by altering the tumor microenvironment and increasing the levels of NK and CD8+ T cells while also reducing the growth of regulatory T cells and MDSCs [41,42]. Additionally, exercise reduces inflammation and stimulates the skeletal muscle cells to produce immune-regulating cytokines (myokines) [43,44,45,46]. Based on these results, we speculate that exercise may maintain and enhance the therapeutic effects of ICIs by suppressing inflammation and altering the tumor microenvironment. Although adverse events from prior treatments may have influenced the changes in muscle mass observed in this study, there was no significant difference in the frequency of severe esophagitis or loss of appetite between the muscle maintenance and loss groups. Therefore, these adverse events are unlikely to have had a substantial impact on muscle mass.
This study had several limitations. First, this was a small retrospective study limited to a Japanese population, so selection bias could not be eliminated. Secondly, we were unable to collect data on inflammatory markers, which are necessary to substantiate the relationship between inflammation and muscle mass. Third, data on several adverse events during CCRT were not collected; therefore, we could not assess the effects of CCRT adverse events on efficacy. Fourth, information on smoking history, which could influence the efficacy of immunotherapy, was lacking. Therefore, it is possible that the muscle maintenance group had a higher proportion of patients with a history of smoking [47]. Fifth, comprehensive genomic data, including on TMB, were lacking. These data, which were not measured in this study, may have influenced the therapeutic effect of durvalumab. Sixth, because we did not investigate the rehabilitation interventions during the entire treatment period, we could not confirm the relationship between exercise and muscle mass. Lastly, there may have been potential confounding factors, such as patient comorbidities and differences in treatments between facilities.

5. Conclusions

Evaluating longitudinal muscle loss, rather than sarcopenia before treatment alone, may predict the efficacy of durvalumab maintenance therapy following concurrent chemoradiotherapy in patients with NSCLC better. However, this was a small retrospective study, and further prospective studies are required to confirm these findings.

Supplementary Materials

The following supporting information can be downloaded at https://www.mdpi.com/article/10.3390/cancers16173037/s1. Figure S1: ROC curve analysis for cutoff values of muscle loss rate; Figure S2: Comparison of the treatment effect of durvalumab between the sarcopenia and non-sarcopenia groups; Figure S3: Comparison of durvalumab’s efficacy based on longitudinal muscle loss and sarcopenia status before chemoradiotherapy and durvalumab administration.

Author Contributions

Software: H.K., N.N.; validation: N.N.; investigation: H.K., N.N., T.Y.; visualization: H.K., N.N.; writing—original draft: H.K., N.N.; conceptualization: N.N.; resources: H.K., N.N., Y.K., A.Y., S.H., S.F., T.M., M.E., Y.C., K.T.; project administration: N.N., T.Y.; writing—review and editing: N.N., T.Y.; methodology: N.N., T.Y.; formal analysis: N.N., T.Y.; supervision: K.T. All authors have read and agreed to the published version of the manuscript.

Funding

This study did not receive any specific grants from funding agencies in the public, commercial, or not-for-profit sectors.

Institutional Review Board Statement

This study complied with the Declaration of Helsinki and followed the protocols approved by the Ethics Committee of the Kyoto Prefectural University of Medicine (Approval No. ERB-C-2920), covering all participating centers through a centralized review process.

Informed Consent Statement

Informed consent for the use of personal medical data was obtained using the opt-out method, as described in the disclosure document.

Data Availability Statement

The datasets used and analyzed during the current study are available from the corresponding author upon reasonable request.

Conflicts of Interest

Naoya Nishioka has received personal fees from Chugai Pharmaceutical Co. Ltd., AstraZeneca KK., Eli Lilly Japan KK, and MSD KK outside the purview of the submitted work. Tadaaki Yamada has received research grants from Ono Pharmaceutical, Janssen, AstraZeneca, and Takeda Pharmaceutical and has received speaking honoraria from Eli Lilly and Chugai-Roshe outside the purview of the submitted work. The authors declare no potential conflicts of interest.

References

  1. Reck, M.; Rodríguez-Abreu, D.; Robinson, A.G.; Hui, R.; Csőszi, T.; Fülöp, A.; Gottfried, M.; Peled, N.; Tafreshi, A.; Cuffe, S.; et al. Updated Analysis of KEYNOTE-024: Pembrolizumab Versus Platinum-Based Chemotherapy for Advanced Non-Small-Cell Lung Cancer With PD-L1 Tumor Proportion Score of 50% or Greater. J. Clin. Oncol. 2019, 37, 537–546. [Google Scholar] [CrossRef] [PubMed]
  2. Herbst, R.S.; Baas, P.; Kim, D.W.; Felip, E.; Pérez-Gracia, J.L.; Han, J.Y.; Molina, J.; Kim, J.H.; Arvis, C.D.; Ahn, M.J.; et al. Pembrolizumab versus docetaxel for previously treated, PD-L1-positive, advanced non-small-cell lung cancer (KEYNOTE-010): A randomised controlled trial. Lancet 2016, 387, 1540–1550. [Google Scholar] [CrossRef]
  3. Borghaei, H.; Paz-Ares, L.; Horn, L.; Spigel, D.R.; Steins, M.; Ready, N.E.; Chow, L.Q.; Vokes, E.E.; Felip, E.; Holgado, E.; et al. Nivolumab versus Docetaxel in Advanced Nonsquamous Non–Small-Cell Lung Cancer. N. Engl. J. Med. 2015, 373, 1627–1639. [Google Scholar] [CrossRef]
  4. Brahmer, J.; Reckamp, K.L.; Baas, P.; Crinò, L.; Eberhardt, W.E.; Poddubskaya, E.; Antonia, S.; Pluzanski, A.; Vokes, E.E.; Holgado, E.; et al. Nivolumab versus Docetaxel in Advanced Squamous-Cell Non-Small-Cell Lung Cancer. N. Engl. J. Med. 2015, 373, 123–135. [Google Scholar] [CrossRef] [PubMed]
  5. Herbst, R.S.; Giaccone, G.; de Marinis, F.; Reinmuth, N.; Vergnenegre, A.; Barrios, C.H.; Morise, M.; Felip, E.; Andric, Z.; Geater, S.; et al. Atezolizumab for First-Line Treatment of PD-L1-Selected Patients with NSCLC. N. Engl. J. Med. 2020, 383, 1328–1339. [Google Scholar] [CrossRef] [PubMed]
  6. Spigel, D.R.; Faivre-Finn, C.; Gray, J.E.; Vicente, D.; Planchard, D.; Paz-Ares, L.; Vansteenkiste, J.F.; Garassino, M.C.; Hui, R.; Quantin, X.; et al. Five-Year Survival Outcomes From the PACIFIC Trial: Durvalumab After Chemoradiotherapy in Stage III Non-Small-Cell Lung Cancer. J. Clin. Oncol. 2022, 40, 1301–1311. [Google Scholar] [CrossRef] [PubMed]
  7. Mansfield ASMurphy, S.J.; Peikert, T.; Yi, E.S.; Vasmatzis, G.; Wigle, D.A.; Aubry, M.C. Heterogeneity of Programmed Cell Death Ligand 1 Expression in Multifocal Lung Cancer. Clin. Cancer Res. 2016, 22, 2177–2182. [Google Scholar] [CrossRef]
  8. Carbone, D.P.; Reck, M.; Paz-Ares, L.; Creelan, B.; Horn, L.; Steins, M.; Felip, E.; van den Heuvel, M.M.; Ciuleanu, T.E.; Badin, F.; et al. First-Line Nivolumab in Stage IV or Recurrent Non-Small-Cell Lung Cancer. N. Engl. J. Med. 2017, 376, 2415–2426. [Google Scholar] [CrossRef]
  9. Forde, P.M.; Chaft, J.E.; Smith, K.N.; Anagnostou, V.; Cottrell, T.R.; Hellmann, M.D.; Zahurak, M.; Yang, S.C.; Jones, D.R.; Broderick, S.; et al. Neoadjuvant PD-1 Blockade in Resectable Lung Cancer. N. Engl. J. Med. 2018, 378, 1976–1986. [Google Scholar] [CrossRef]
  10. Jardim, D.L.; Goodman, A.; de Melo Gagliato, D.; Kurzrock, R. The Challenges of Tumor Mutational Burden as an Immunotherapy Biomarker. Cancer Cell 2021, 39, 154–173. [Google Scholar] [CrossRef]
  11. Marabelle, A.; Fakih, M.; Lopez, J.; Shah, M.; Shapira-Frommer, R.; Nakagawa, K.; Chung, H.C.; Kindler, H.L.; Lopez-Martin, J.A.; Miller, W.H., Jr.; et al. Association of tumour mutational burden with outcomes in patients with advanced solid tumours treated with pembrolizumab: Prospective biomarker analysis of the multicohort, open-label, phase 2 KEYNOTE-158 study. Lancet Oncol. 2020, 21, 1353–1365. [Google Scholar] [CrossRef]
  12. Ricciuti, B.; Wang, X.; Alessi, J.V.; Rizvi, H.; Mahadevan, N.R.; Li, Y.Y.; Polio, A.; Lindsay, J.; Umeton, R.; Sinha, R.; et al. Association of High Tumor Mutation Burden in Non–Small Cell Lung Cancers With Increased Immune Infiltration and Improved Clinical Outcomes of PD-L1 Blockade Across PD-L1 Expression Levels. JAMA Oncol. 2022, 8, 1160–1168. [Google Scholar] [CrossRef]
  13. Lakhani, A.A.; Thompson, S.L.; Sheltzer, J.M. Aneuploidy in human cancer: New tools and perspectives. Trends Genet. 2023, 39, 968–980. [Google Scholar] [CrossRef]
  14. Salk, J.J.; Schmitt, M.W.; Loeb, L.A. Enhancing the accuracy of next-generation sequencing for detecting rare and subclonal mutations. Nat. Rev. Genet. 2018, 19, 269–285. [Google Scholar] [CrossRef]
  15. Spurr, L.F.; Weichselbaum, R.R.; Pitroda, S.P. Tumor aneuploidy predicts survival following immunotherapy across multiple cancers. Nat. Genet. 2022, 54, 1782–1785. [Google Scholar] [CrossRef]
  16. Antoun, S.; Morel, H.; Souquet, P.J.; Surmont, V.; Planchard, D.; Bonnetain, F.; Foucher, P.; Egenod, T.; Krakowski, I.; Gaudin, H.; et al. Staging of nutrition disorders in non-small-cell lung cancer patients: Utility of skeletal muscle mass assessment. J. Cachexia Sarcopenia Muscle 2019, 10, 782–793. [Google Scholar] [CrossRef]
  17. Shachar, S.S.; Williams, G.R.; Muss, H.B.; Nishijima, T.F. Prognostic value of sarcopenia in adults with solid tumours: A meta-analysis and systematic review. Eur. J. Cancer 2016, 57, 58–67. [Google Scholar] [CrossRef]
  18. Baracos, V.E.; Reiman, T.; Mourtzakis, M.; Gioulbasanis, I.; Antoun, S. Body composition in patients with non-small cell lung cancer: A contemporary view of cancer cachexia with the use of computed tomography image analysis. Am. J. Clin. Nutr. 2010, 91, 1133S–1137S. [Google Scholar] [CrossRef]
  19. Shiroyama, T.; Nagatomo, I.; Koyama, S.; Hirata, H.; Nishida, S.; Miyake, K.; Fukushima, K.; Shirai, Y.; Mitsui, Y.; Takata, S.; et al. Impact of sarcopenia in patients with advanced non-small cell lung cancer treated with PD-1 inhibitors: A preliminary retrospective study. Sci. Rep. 2019, 9, 2447. [Google Scholar] [CrossRef] [PubMed]
  20. Cortellini, A.; Verna, L.; Porzio, G.; Bozzetti, F.; Palumbo, P.; Masciocchi, C.; Cannita, K.; Parisi, A.; Brocco, D.; Tinari, N.; et al. Predictive value of skeletal muscle mass for immunotherapy with nivolumab in non-small cell lung cancer patients: A “hypothesis-generator” preliminary report. Thorac. Cancer 2019, 10, 347–351. [Google Scholar] [CrossRef]
  21. Tsukagoshi, M.; Yokobori, T.; Yajima, T.; Maeno, T.; Shimizu, K.; Mogi, A.; Araki, K.; Harimoto, N.; Shirabe, K.; Kaira, K. Skeletal muscle mass predicts the outcome of nivolumab treatment for non-small cell lung cancer. Medicine 2020, 99, e19059. [Google Scholar] [CrossRef]
  22. Roch, B.; Coffy, A.; Jean-Baptiste, S.; Palaysi, E.; Daures, J.P.; Pujol, J.L.; Bommart, S. Cachexia—Sarcopenia as a determinant of disease control rate and survival in non-small lung cancer patients receiving immune-checkpoint inhibitors. Lung Cancer 2020, 143, 19–26. [Google Scholar] [CrossRef]
  23. Wang, J.; Cao, L.; Xu, S. Sarcopenia affects clinical efficacy of immune checkpoint inhibitors in non-small cell lung cancer patients: A systematic review and meta-analysis. Int. Immunopharmacol. 2020, 88, 106907. [Google Scholar] [CrossRef] [PubMed]
  24. Kim, E.Y.; Kim, Y.S.; Park, I.; Ahn, H.K.; Cho, E.K.; Jeong, Y.M. Prognostic Significance of CT-Determined Sarcopenia in Patients with Small-Cell Lung Cancer. J. Thorac. Oncol. 2015, 10, 1795–1799. [Google Scholar] [CrossRef] [PubMed]
  25. Hamaguchi, Y.; Kaido, T.; Okumura, S.; Kobayashi, A.; Hammad, A.; Tamai, Y.; Inagaki, N.; Uemoto, S. Proposal for new diagnostic criteria for low skeletal muscle mass based on computed tomography imaging in Asian adults. Nutrition 2016, 32, 1200–1205. [Google Scholar] [CrossRef]
  26. Nishioka, N.; Uchino, J.; Hirai, S.; Katayama, Y.; Yoshimura, A.; Okura, N.; Tanimura, K.; Harita, S.; Imabayashi, T.; Chihara, Y.; et al. Association of Sarcopenia with and Efficacy of Anti-PD-1/PD-L1 Therapy in Non-Small-Cell Lung Cancer. J. Clin. Med. 2019, 8, 450. [Google Scholar] [CrossRef]
  27. Blauwhoff-Buskermolen, S.; Versteeg, K.S.; de van der Schueren, M.A.; den Braver, N.R.; Berkhof, J.; Langius, J.A.; Verheul, H.M. Loss of Muscle Mass During Chemotherapy Is Predictive for Poor Survival of Patients With Metastatic Colorectal Cancer. J. Clin. Oncol. 2016, 34, 1339–1344. [Google Scholar] [CrossRef]
  28. Minami SIhara, S.; Tanaka, T.; Komuta, K. Sarcopenia and Visceral Adiposity Did Not Affect Efficacy of Immune-Checkpoint Inhibitor Monotherapy for Pretreated Patients With Advanced Non-Small Cell Lung Cancer. World J. Oncol. 2020, 11, 9–22. [Google Scholar] [CrossRef] [PubMed]
  29. Cortellini, A.; Bozzetti, F.; Palumbo, P.; Brocco, D.; Di Marino, P.; Tinari, N.; De Tursi, M.; Agostinelli, V.; Patruno, L.; Valdesi, C.; et al. Weighing the role of skeletal muscle mass and muscle density in cancer patients receiving PD-1/PD-L1 checkpoint inhibitors: A multicenter real-life study. Sci. Rep. 2020, 10, 1456. [Google Scholar] [CrossRef]
  30. Katsui, K.; Ogata, T.; Sugiyama, S.; Yoshio, K.; Kuroda, M.; Hiraki, T.; Kiura, K.; Maeda, Y.; Toyooka, S.; Kanazawa, S. Sarcopenia is associated with poor prognosis after chemoradiotherapy in patients with stage III non-small-cell lung cancer: A retrospective analysis. Sci. Rep. 2021, 11, 11882. [Google Scholar] [CrossRef]
  31. Rounis, K.; Makrakis, D.; Tsigkas, A.P.; Georgiou, A.; Galanakis, N.; Papadaki, C.; Monastirioti, A.; Vamvakas, L.; Kalbakis, K.; Vardakis, N.; et al. Cancer cachexia syndrome and clinical outcome in patients with metastatic non-small cell lung cancer treated with PD-1/PD-L1 inhibitors: Results from a prospective, observational study. Transl. Lung Cancer Res. 2021, 10, 3538–3549. [Google Scholar] [CrossRef]
  32. Loosen, S.H.; van den Bosch, V.; Gorgulho, J.; Schulze-Hagen, M.; Kandler, J.; Jördens, M.S.; Tacke, F.; Loberg, C.; Antoch, G.; Brümmendorf, T.; et al. Progressive Sarcopenia Correlates with Poor Response and Outcome to Immune Checkpoint Inhibitor Therapy. J. Clin. Med. 2021, 10, 1361. [Google Scholar] [CrossRef] [PubMed]
  33. Maccio, A.; Sanna, E.; Neri, M.; Oppi, S.; Madeddu, C. Cachexia as Evidence of the Mechanisms of Resistance and Tolerance during the Evolution of Cancer Disease. Int. J. Mol. Sci. 2021, 22, 2890. [Google Scholar] [CrossRef]
  34. Myers, J.S. Proinflammatory cytokines and sickness behavior: Implications for depression and cancer-related symptoms. Oncol. Nurs. Forum 2008, 35, 802–807. [Google Scholar] [CrossRef]
  35. Baltgalvis, K.A.; Berger, F.G.; Pena, M.M.; Davis, J.M.; Muga, S.J.; Carson, J.A. Interleukin-6 and cachexia in ApcMin/+ mice. Am. J. Physiol. Regul. Integr. Comp. Physiol. 2008, 294, R393–R401. [Google Scholar] [CrossRef] [PubMed]
  36. Wherry, E.J. T cell exhaustion. Nat. Immunol. 2011, 12, 492–499. [Google Scholar] [CrossRef]
  37. Wang, D.; DuBois, R.N. Immunosuppression associated with chronic inflammation in the tumor microenvironment. Carcinogenesis 2015, 36, 1085–1093. [Google Scholar] [CrossRef] [PubMed]
  38. Almand, B.; Clark, J.I.; Nikitina, E.; van Beynen, J.; English, N.R.; Knight, S.C.; Carbone, D.P.; Gabrilovich, D.I. Increased production of immature myeloid cells in cancer patients: A mechanism of immunosuppression in cancer. J. Immunol. 2001, 166, 678–689. [Google Scholar] [CrossRef]
  39. Ballaro, R.; Beltrà, M.; De Lucia, S.; Pin, F.; Ranjbar, K.; Hulmi, J.J.; Costelli, P.; Penna, F. Moderate exercise in mice improves cancer plus chemotherapy-induced muscle wasting and mitochondrial alterations. FASEB J. 2019, 33, 5482–5494. [Google Scholar] [CrossRef]
  40. Hojman, P.; Fjelbye, J.; Zerahn, B.; Christensen, J.F.; Dethlefsen, C.; Lonkvist, C.K.; Brandt, C.; Gissel, H.; Pedersen, B.K.; Gehl, J. Voluntary exercise prevents cisplatin-induced muscle wasting during chemotherapy in mice. PLoS ONE 2014, 9, e109030. [Google Scholar] [CrossRef]
  41. Ashcraft, K.A.; Peace, R.M.; Betof, A.S.; Dewhirst, M.W.; Jones, L.W. Efficacy and Mechanisms of Aerobic Exercise on Cancer Initiation, Progression, and Metastasis: A Critical Systematic Review of In Vivo Preclinical Data. Cancer Res. 2016, 76, 4032–4050. [Google Scholar] [CrossRef] [PubMed]
  42. Holmen Olofsson, G.; Jensen, A.W.P.; Idorn, M.; Thor Straten, P. Exercise Oncology and Immuno-Oncology; A (Future) Dynamic Duo. Int. J. Mol. Sci. 2020, 21, 3816. [Google Scholar] [CrossRef] [PubMed]
  43. Pedersen, B.K. Muscle as a secretory organ. Compr. Physiol. 2013, 3, 1337–1362. [Google Scholar]
  44. Koelwyn, G.J.; Wennerberg, E.; Demaria, S.; Jones, L.W. Exercise in Regulation of Inflammation-Immune Axis Function in Cancer Initiation and Progression. Oncology 2015, 29, 908–920,922. [Google Scholar]
  45. Steensberg, A. IL-6 enhances plasma IL-1ra, IL-10, and cortisol-in-humans. Am. J. Physiol. Endocrinol. Metab. 2003, 285, e433–e437. [Google Scholar] [CrossRef]
  46. Li, F.; Li, Y.; Duan, Y.; Hu, C.A.; Tang, Y.; Yin, Y. Myokines and adipokines: Involvement in the crosstalk between skeletal muscle and adipose tissue. Cytokine Growth Factor. Rev. 2017, 33, 73–82. [Google Scholar] [CrossRef]
  47. Zhao, W.; Jiang, W.; Wang, H.; He, J.; Su, C.; Yu, Q. Impact of Smoking History on Response to Immunotherapy in Non-Small-Cell Lung Cancer: A Systematic Review and Meta-Analysis. Front. Oncol. 2021, 11, 703143. [Google Scholar] [CrossRef]
Figure 1. Flow diagram of patient enrollment. A total of 131 patients with advanced NSCLC received at least one cycle of durvalumab treatment after concurrent chemoradiotherapy between January 2017 and April 2023 at four medical institutions (n = 131). We excluded cases for the following reasons: the CT images before chemoradiotherapy did not include images extending to the L3 level (n = 23) and the CT images before durvalumab administration did not include images extending to the L3 level (n = 10). Ultimately, 98 patients were included in the analysis. NSCLC, non-small cell lung cancer; CT, computed tomography; L3, third lumbar vertebra.
Cancers 16 03037 g001
Figure 2. Comparison of the treatment effect of durvalumab between the muscle maintenance and loss groups. We compared the PFS and OS between the muscle maintenance and loss groups; Kaplan–Meier curves are shown for PFS (A) and OS (B). PFS: progression-free survival; OS: overall survival.
Cancers 16 03037 g002
Table 1. Patient characteristics.
Characteristic n (%)Total
N = 98(%)
Muscle Maintenance Group
N = 62(%)
Muscle Loss Group
N = 36(%)
p-Value
Age (years)
Median [range]
<75
≥75

71.5 [49–87]
60 (61.2)
38 (38.8)

70.5 [49–87]
40 (64.5)
22 (35.5)

72.0 [49–84]
20 (55.6)
16 (44.4)

0.55
0.40
Gender
Male
Female

73 (74.5)
25 (25.5)

46 (74.2)
16 (25.8)

27 (75.0)
9 (25.0)

1.00
ECOG-PS
0
1

41 (41.8)
57 (58.2)

25 (40.3)
37 (59.7)

16 (44.4)
20 (55.6)

0.83
Stage
IIB
IIIA
IIIB
IIIC
Postoperative recurrence

4 (4.1)
35 (35.7)
39 (39.8)
14 (14.3)
6 (6.1)

1 (1.6)
19 (30.6)
27 (43.5)
10 (16.1)
5 (8.1)

3 (8.3)
16 (44.4)
12 (33.3)
4 (11.1)
1 (2.8)

0.24
Histology
Adeno
Others

45 (45.9)
53 (54.1)

25 (40.3)
37 (59.7)

20 (55.6)
16 (44.4)

0.21
Driver oncogenes
EGFR mutation
ALK rearrangement
Others
Negative
Unknown

8 (8.2)
1 (1.0)
5 (5.1)
71 (72.4)
14 (13.3)

4 (6.5)
1 (1.6)
4 (6.5)
45 (72.6)
9 (12.9)

4 (11.1)
0 (0.0)
1 (2.8)
26 (72.2)
5 (13.9)

0.86
PD-L1
<50%
≥50%
Unknown

47 (46.9)
39 (40.8)
12 (12.2)

28 (45.2)
27 (43.5)
7 (11.3)

19 (52.8)
12 (33.3)
5 (13.9)

0.62
BMI-kg/m2 (pre-chemoradiotherapy)
Median [range]
<22
≥22

21.9 [15.6–30.5]
52 (53.1)
46 (46.9)

21.5 [16.5–28.3]
38 (61.3)
24 (38.7)

23.0 [15.6–30.5]
14 (38.9)
22 (61.1)

0.005
BMI -kg/m2 (post-chemoradiotherapy)
Median [range]
<22
≥22

21.2 [15.2–28.7]
63 (64.3)
35 (35.7)

21.0 [15.4–28.7]
44 (71.0)
18 (29.0)

21.8 [15.2–27.6]
19 (52.8)
17 (47.2)

0.08
PMI-cm2/m2 (pre-chemoradiotherapy)
Median [range]
Male
Female


5.03 [2.24–10.25]
3.52 [2.23–6.50]


4.68 [2.24–10.25]
3.28 [2.23–6.14]


5.25 [3.55–8.22]
4.32 [2.77–6.50]


0.01
0.07
PMI-cm2/m2 (post-chemoradiotherapy)
Median [range]
Male
Female


4.60 [2.31–9.58]
3.21 [2.09–6.28]


4.66 [2.31–9.58]
3.16 [2.41–6.28]


4.43 [2.97–6.47]
3.58 [2.09–4.38]


0.61
0.89
Sarcopenia (pre-chemoradiotherapy)
yes
no

82 (83.7)
16 (16.3)

54 (87.1)
8 (12.9)

28 (77.8)
8 (22.2)

0.26
Sarcopenia (post-chemoradiotherapy)
yes
no

87 (88.8)
11 (11.2)

54 (87.1)
8 (12.9)

33 (91.7)
3 (8.3)

0.74
Cachexia
yes
no

53 (54.1)
45 (45.9)

32 (51.6)
30 (48.4)

21 (58.3)
17 (41.7)

0.54
Period between CCRT and ICIs (days)
Median [range]

15.0 [1.0–49.0]

12.0 [1.0–45.0]

21.5 [1.0–49.0]

0.002
Chemotherapy
CDDP+DTX
CBDCA+PTX
Daily CBDCA
CDDP+VNR
Weekly CBDCA+PTX
Others

24 (24.5)
45 (45.9)
7 (7.1)
7 (7.1)
13 (13.3)
2 (2.0)

17 (27.4)
26 (41.9)
5 (8.1)
4 (6.5)
9 (14.5)
1 (2.8)

7 (19.4)
19 (52.8)
2 (5.6)
3 (8.3)
4 (11.1)
1 (1.6)

0.87
ICI completion rate49 (50.0)36 (58.1)13 (36.1)0.07
Adverse Events during Concurrent Chemoradiotherapy
Leukopenia
Any grade
Grade 3 or more

49 (50)
40 (40.8)

34 (54.8)
28 (45.2)

15 (41.7)
12 (33.3)

0.30
Neutropenia
Any grade
Grade 3 or more

43 (43.9)
35 (35.7)

29 (46.8)
24 (38.7)

14 (38.9)
11 (30.6)

0.53
Thrombocytopenia
Any grade
Grade 3 or more

20 (20.4)
0

12 (21.0)
0

8 (22.2)
0

1.00
Febrile neutropenia
Grade 3 or more

6 (6.1)

4 (6.5)

2 (5.6)
1.00
Anemia
Any grade
Grade 3 or more

25 (25.5)
3 (3.1)

16 (25.8)
0

9 (25.0)
3 (8.3)

1.00
Radiation pneumonitis
Any grade
Grade 3 or more

42 (42.9)
2 (2.0)

27 (43.5)
1 (1.6)

15 (41.7)
1 (2.8)

1.00
Anorexia
Any grade
Grade 3 or more

34 (34.7)
11 (11.2)

22 (35.5)
8 (12.9)

12 (33.3)
3 (8.3)

1.00
Radiation esophagitis
Any grade
Grade 3 or more

41 (41.8)
14 (14.3)

26 (41.9)
8 (12.9)

15 (41.7)
6 (16.7)

1.00
Hypoalbuminemia
Any grade
Grade 3 or more

18 (18.4)
0

12 (19.4)
0

6 (16.7)
0

0.79
Abbreviation; ECOG-PS: Eastern Cooperative Group performance status; Adeno: adenocarcinoma; EGFR: epidermal growth factor receptor; ALK: anaplastic lymphoma kinase; PD-L1: programmed cell death ligand 1; CDDP: cisplatin; DTX: docetaxel; CBDCA: carboplatin; PTX: paclitaxel; VNR: vinorelbine; BMI: body mass index; PMI: psoas muscle index; CCRT: concurrent chemoradiotherapy; ICI: immune checkpoint inhibitor.
Table 2. Univariable and multivariable analyses of PFS.
Predictors of PFSCrude HR95% CIp-ValueAdjusted HR95 CIp-Value
Muscle loss rate-%
(<10 vs. ≥10)
0.470.26–0.83p < 0.050.4780.26–0.86p < 0.05
Age (years)
(<75 vs. ≥75)
0.540.31–0.97p < 0.050.590.33–1.070.08
ECOG-PS
(0 vs. 1)
1.110.62–1.970.731.280.60–1.970.78
Histology
(Adeno vs. others)
0.690.38–1.230.21NININI
Mutation
(+ vs. −)
0.830.35–1.950.67NININI
PD-L1
(≥50% vs <50%)
1.060.70–1.630.781.180.64–2.180.59
Pre-chemotherapy BMI (kg/m2)
(≥22 vs. <22)
1.180.67–2.100.57NININI
Post-chemotherapy BMI (kg/m2)
(≥22 vs. <22)
0.770.41–1.430.40NININI
Cachexia
(No vs. Yes)
0.680.38–1.220.19NININI
Sarcopenia (pre-chemotherapy)
(No vs. Yes)
0.440.16–1.220.11NININI
Sarcopenia (post-chemotherapy)
(No vs. Yes)
0.320.08–1.330.12NININI
Multivariable analysis adjusted for age, ECOG-PS score, and PD-L1 expression. Abbreviations: PFS, progression-free survival; HR, hazard ratio; CI, confidence interval; ECOG-PS, Eastern Cooperative Group performance status; Adeno, adenocarcinoma; PD-L1, programmed cell death ligand 1; BMI, body mass index.
Disclaimer/Publisher’s Note: The statements, opinions and data contained in all publications are solely those of the individual author(s) and contributor(s) and not of MDPI and/or the editor(s). MDPI and/or the editor(s) disclaim responsibility for any injury to people or property resulting from any ideas, methods, instructions or products referred to in the content.

