Simple Summary
The tumor microenvironment (TME) influences treatment outcome, and analysis of immune cell composition plays an important role in establishing effective prognostic models. This study investigated cellular proportions decomposed from Rulk RNA expression data and immune profiles of patients with lung adenocarcinoma (LUAD) using publicly available data from TCGA and GEO. The results of the study showed a correlation between specific immune signatures, poor prognostic signatures (PPS) and patient outcomes such as progression-free survival and chemotherapy response. We integrated these features and used machine learning models to predict prognosis, with support vector machines (SVMs) having the highest accuracy. This study highlights the importance of immune profiling in advancing precision medicine for lung cancer patients.
Abstract
Background: The development of tumors is a highly complex process that entails numerous interactions and intricate relationships between the host immune system and cancer cells. It has been demonstrated in studies that the treatment response of patients can be correlated with the tumor microenvironment (TME). Consequently, the examination of diverse immune profiles within the TME can facilitate the elucidation of tumor development and the development of advantageous models for diagnoses and prognoses. Methods: In this study, we utilized a single-cell decomposition method to analyze the relationships between cell proportions and immune signatures in lung adenocarcinoma (LUAD) patients. Results: Our findings indicate that specific immune cell populations and immune signatures are significantly associated with patient prognosis. By identifying poor prognosis signatures (PPS), we reveal the critical role of immune profiles and cellular composition in disease outcomes, emphasizing their diagnostic potential for predicting patient prognosis. Conclusions: This study highlights the importance of immune signatures and cellular composition, which may serve as valuable biomarkers for disease prognosis in LUAD patients.
1. Introduction
Non-small-cell lung carcinoma (NSCLC) is the predominant form of lung cancer, accounting for more than 85% of cases [1]. NSCLC can be further categorized into subtypes, such as lung adenocarcinoma (LUAD) and lung squamous cell carcinoma (LUSC), based on histological features [2,3]. Treatment options for NSCLC include surgery, radiation therapy, chemotherapy, immunotherapy, and targeted therapy, often used in combination. Immunotherapy utilizing checkpoint inhibitors for programmed death 1 (PD-1) and programmed death ligand 1 (PD-L1) has revolutionized cancer treatment and is now employed as first-line or second-line therapy for lung cancer. However, only a small percentage of patients have derived significant benefits from immunotherapy [4]. Chemotherapy remains a fundamental approach in lung cancer treatment, with 53.4% of stage 1 NSCLC patients undergoing chemotherapy [5].
It is becoming increasingly clear that tumor development is a complex process that involves a number of different interactions between cancer cells and the host immune system. The tumor microenvironment (TME) is understood to play an important role in determining the response to chemotherapy, with an efficient immune system shown to optimize chemotherapeutic effects [6]. Given the complexity of the TME, it is becoming increasingly clear that a combination of biomarkers is required to predict individual responses to treatment. The concept of immunograms has been introduced as a potential tool to assess the immune status of cancer patients visually [7]. Blank et al. developed cancer immunograms with the aim of representing interactions between the immune system and cancer cells, with the intention of aiding in biomarker research and clinical drug selection [8]. Additionally, tools like ESTIMATE estimate the content of tumor and immune cells to understand tumor purity [9]. Karasaki et al. used whole-exome and RNA sequencing on 20 NSCLC patients, creating radar plots that revealed three immune patterns: T-cell rich, intermediate, and T-cell depleted [10]. Immunograms are valuable biomarkers that provide insights into the TME, though there is a view that more T-cell-related factors could be incorporated. Furthermore, Donghai et al. validated immunological features in melanomas, showing that ImmunCell.Sig includes gene features of immune cell subtypes and can predict immunotherapy responses [11].
Single-cell sequencing is a recently developed and widely used technique that enables a more detailed exploration of cell types and compositions compared to bulk RNA-Seq. However, this kind of sequencing method is expensive. Several computational tools, such as Bisque, CIBERSORT, CIBERSORTx, MuSiC, and various algorithms, have been developed to estimate immune cell proportions using bulk RNA-Seq data [11,12,13,14]. Some researchers utilized cell-type decomposition to cluster lung cancer patients based on major components of the TME. Various publicly available data resources, such as The Cancer Genome Atlas (TCGA) for bulk RNA-Seq data and DISCO, GEO, and CancerSEA for single-cell (sc)RNA-Seq data, provide valuable information for cell type decomposition [15,16,17].
Previous studies have contributed to the development of several deconvolution techniques that have been used to estimate immune cell proportions. CIBERSORT [18], developed by Newman et al., employs 22 leukocyte signatures (LM22) as reference markers, though its accuracy may be limited in certain instances, potentially leading to errors in cell type estimation. In contrast, Bisque [13], introduced by Brandon et al. in 2020, has the potential to provide more accurate cell proportion estimates by combining bulk RNA and single-cell RNA sequencing (scRNA-seq) data. Chang Li et al. employed CIBERSORT to categorize NSCLC patients into subgroups based on tumor-infiltrating immune cells (TIICs), with the aim of identifying potential therapeutic targets [19]. Yang Zheng et al. applied non-negative matrix factorization (NMF) to categorize patients, revealing significant correlations between copy number alterations (CNAs) and immune checkpoint expressions [20]. This study aims to build on these insights by integrating immune profiles with single-cell decomposition techniques, with the goal of enhancing the diagnostic potential for predicting patient prognosis and improving precision medicine approaches for NSCLC patients.
2. Methods
2.1. System Flow and Datasets of the Study
This study can be briefly divided into three parts: an immune profile analysis of patients, immune clustering analysis, and prognosis model construction as shown in Figure 1, and as described in various subsections of “Section 2”. In addition, we utilized datasets including RNA-Seq data of bulk tumors with both raw read counts and transcripts per kilobase million (TPM) from 513 patients with LUAD in the TCGA database (https://portal.gdc.cancer.gov/, accessed on 24 January 2021), which corresponded to clinical and mutation data, including follow-up information, drug treatment, responses, and genetic alteration of ALK and EGFR. Of these patients, 177 had once received chemotherapy treatment. Also, we utilized scRNA-Seq data from 42 patients with NSCLC, which were used in Wu’s study [21] and can be downloaded from the Gene Expression Omnibus (GEO) database under the accession numbers GSE148071 (https://www.ncbi.nlm.nih.gov/geo/, assessed on 24 January 2021).
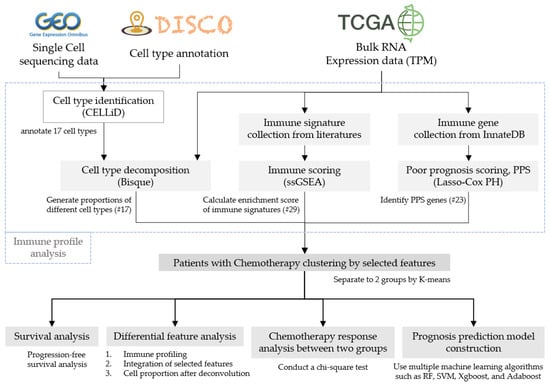
Figure 1.
Research process flowchart.
2.2. Immune Profile Estimations of Patients
In the beginning, we employed the CELLiD (cell-type identification) tool of the DISCO database for cell-type annotation, after several cell clusters were identified in compliance with the requirements of scRNA-Seq analytical tools. Meanwhile, 89,888 cells were identified in these scRNA-Seq data, for an average of 2140 cells per patient. The 17 different cell types identified among patients with LUAD (parts of 42 patients) included basal cells, classical dendritic cells (cDCs), differentiated ciliated cells, endothelial cells, epithelial cells, macrophages, mast cells, mesothelial cells, monocytes, myofibroblasts, plasma cells, proliferative epithelial cells, proliferative macrophages, secretory cells, smooth muscle cells, T cells, and type 2 alveolar epithelial cells. For the immune profile analysis, three processes were further performed. First, we used the BisqueRNA (R package, version v1.0.5) by importing single-cell sequencing data and combined those with bulk RNA read counts to analyze cell proportions of the 17 cell types in patients with LUAD. Second, we evaluated 29 immune signatures (Table S1) for each patient, which were integrated from 4 studies [7,10,11,22] and the ESTIMATES tool [9], using the single-sample gene set enrichment analysis (ssGSEA) scoring method. The ssGSEA method is extended from the GSEA method, which can be used to evaluate enriched levels (enrichment scores) of specific gene sets (existing gene signatures) in a single sample using expression data [23]. Finally, poor prognosis signature (PPS) genes were identified [19] based on immune-relevant genes, which were collected from the InnateDB database [24]. The Cox proportional hazards (CoxPH) model and the Lasso feature selection method of the R package were used to generate representative PPS genes. We set the parameter alpha of Lasso to 1 and lambda to 100. After that, 23 representative PPS genes were identified.
2.3. Immune Clustering Analysis
The K-means algorithm was employed to cluster patients into different groups based on their immune profiles. In this study, the parameter k was set to 2, and the patients were subsequently divided into two distinct groups (cluster 1 and cluster 2, designated as C1 and C2, respectively). Several different scenarios were additionally investigated between the two groups including survival durations, immunograms, and all kinds of features identified in the previous section, titled “Immune profile estimations of patients”. For survival durations, survminer (R package, version v0.4.9) was used to explore the progression-free interval (PFI) between the C1 and C2 groups. For immunogram generation, Z-score normalization was applied for scores of aforementioned immune features, and the formula 3 + 1.5 × Z was used to further transform scores of each feature to depict the immunograms. Immunograms of the C1 group could then be compared to those of the C2 group. Moreover, all kinds of features were also used to explore differences between the groups using a boxplot and heatmap.
2.4. Statistical Tests and Prognosis MODEL Construction
Chi-square tests were used to determine whether there were differences in the problems of relapse within 1 year (yes vs. no) and the chemotherapy response (complete response (CR) vs. progressive disease (PD)) between groups C1 and C2. In addition, we utilized the sklearn (Python package, version v1.1.3) for machine learning and employed various classifiers, including random forest (RF), support vector machine (SVM), extreme gradient boosting (XGBoost), and adaptive boosting (AdaBoost), to make predictions. The Mann–Whitney U-test was applied to select discriminative features between the two groups from among 69 features. The RF parameters were set to n_estimator = 100 and criterion = gini, while SVM parameters were set to kernel = linear, degree = 3, and gamma = scale. XGBoost parameters were set to n_estimators = 3, and AdaBoost parameters were set to n_estimators = 50. Five-fold cross-validation was applied, and the accuracy, recall, precision, F1 score, and area under the curve (AUC) were used to evaluate model performances.
3. Results
3.1. Statistics of the Study Cohort
A total of 513 patients with lung adenocarcinoma (LUAD) were included in the study, of whom 177 had received chemotherapy. The demographic characteristics of the patients are presented in Table 1. The number of males and females in each group and the number of smokers are indicated in the table. In terms of population, the majority of subjects were identified as white, followed by African American. The mean age of all patients was 65.2 years, with 395 patients in the early-stage group (274 in stage I and 121 in stage II), 115 patients in the advanced-stage group (86 in stage III and 29 in stage IV), and 5 patients without this record. Among those who received chemotherapy, the mean age was 63.3, with 106 patients in the early-stage group and 68 patients in the advanced-stage group. Additionally, 62 and 29 patients receiving chemotherapy in the early-stage and the advanced-stage groups, respectively, exhibited a complete response (CR) to the drugs, while 25 and 17 demonstrated progressive disease (PD). Utilizing the mutation data available on the GDC portal, our findings revealed that 14–16% of patients exhibited EGFR mutations, while nearly 6% of patients demonstrated ALK mutations, both in all LUAD patients and in those who received chemotherapy.

Table 1.
Demographic information of TCGA-LUAD samples.
3.2. Cell Proportions and Immunograms of Chemotherapy Patients
We sought to explore associations of cell proportions with the chemotherapeutic response. Cell proportions of all 513 LUAD patients and 177 chemotherapy patients are, respectively, shown in Figure S1A,B. Results showed that the highest average proportions were of basal cells and proliferative epithelial cells, and the lowest average proportions were of smooth muscle cells, mast cells, and endothelial cells among these samples. Moreover, to unravel the immune signatures among all patients and chemotherapy patients, immunograms were used and are provided in Figure S2. In both immunograms of all patients (Figure S2A) and chemotherapy patients specifically (Figure S2B), glycolysis and recognition of tumor cells exhibited the highest scores, while immune checkpoints and anti-CTLA4 resistance MAGE gene (CRMA) signature demonstrated the lowest. Furthermore, stromal scores exhibited a slight increase for chemotherapy patients in comparison to all patients.
3.3. PPS Score Evaluation of Patients with LUAD
Of 4617 immune-associated genes in InnateDB following the Cox regression and LASSO analyses, 23 genes were related to the prognosis of patients with LUAD (as shown in Table S2). Moreover, the PPS scores of patients were evaluated in depth with the LASSO Cox model, which was constructed by these 23 genes, and it was similar to a previous study [19]. The results demonstrated a significant divergence in prognoses between patients with high PPS scores and those with low PPS scores, which were divided by mean (as shown in Figure S3A,B). Patients with high PPS scores exhibited poor prognoses and were designated as a high-risk cohort, whereas those with low PPS scores demonstrated favorable prognoses and were classified as a low-risk cohort. Furthermore, the gene signatures of the two risk groups exhibited notable differences (as illustrated in Figure S3C).
3.4. Immune Profiles within Different Clusters
In this study, we integrated 69 features including proportions of 17 cell types, 29 immune-relevant scores, and 23 PPS genes for the clustering of 177 patients who had undergone chemotherapy. Patients with LUAD and treated with chemotherapy were categorized into two clusters, as illustrated in the accompanying demographic table (Table S3). It was also notable that the PFI between the two clusters exhibited significant differences. Cluster C1 (n = 102) had a survival advantage compared to cluster C2 (n = 75). The p value of the log-rank test of survival durations of the two clusters was <0.05 (as shown in Figure 2).
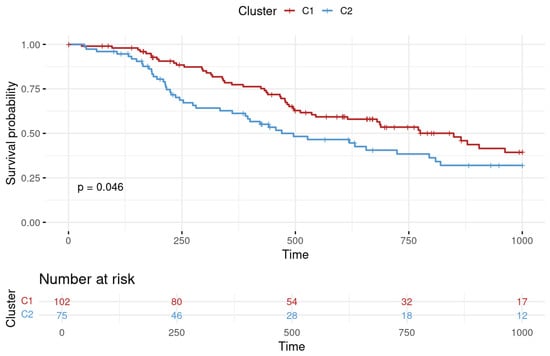
Figure 2.
Progression-free interval (PFI) survival analysis for lung adenocarcinoma clusters. The survival probability over time is plotted with cluster 1 depicted in red and cluster 2 in blue. Time is represented on the X-axis in days, while the Y-axis indicates the survival probability. The number of patients at risk at various time points is provided below the graph, offering a detailed view of the cohort size over the study period.
On the other hand, we utilized immunograms to determine the difference in immunophenotypes between C1 and C2 (as shown in Figure 3). Several immune signatures differed such as CRMA signature, inhibitory cells Tregs, inhibitory cells MDSC, recognition of tumor cells, and proliferation, and were significantly higher in C2 than in C1. The CRMA and proliferation signatures obviously showed relatively large differences. Conversely, the remaining immune-relevant signatures were significantly higher in C1 than in C2. Among these signatures, trafficking infiltration and priming activation exhibited relatively large differences between the clusters.
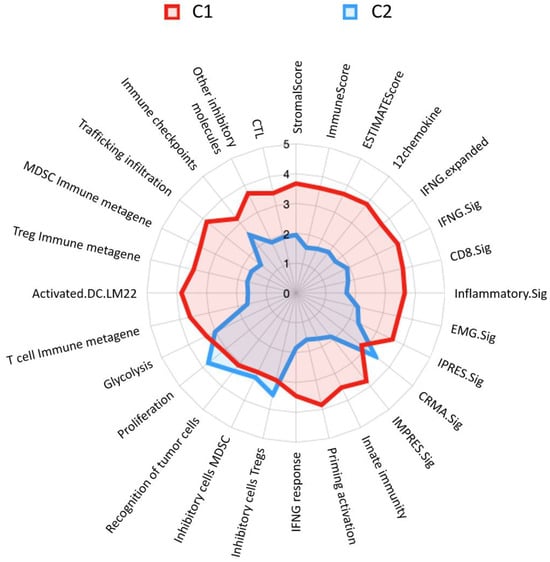
Figure 3.
Immunoprofiling radar chart of lung adenocarcinoma patient clusters. C1 is represented by the red area with a good prognosis, while C2 is outlined in blue with a poor prognosis. Each axis on the radar represents a different immune signature. The values extend from the center of the radar chart outwards, with higher values indicating a more pronounced presence of the corresponding immune function within the cluster. Abbreviated information and a fully expanded response may be provided, as in Table S1.
Moreover, distributions of cell proportions between the two clusters were further examined (as shown in Figure 4). Results demonstrated that the mean proportions of eight cell types significantly differed between the C1 and C2 clusters, including macrophages (0.10), mast cells (0.01), myofibroblasts (0.06), plasma cells (0.05), proliferative macrophages (0.10), and T cells (0.06), which were higher in C1 and proliferative epithelial cells (0.19) and secretory cells (0.09), which were conversely higher in C2.
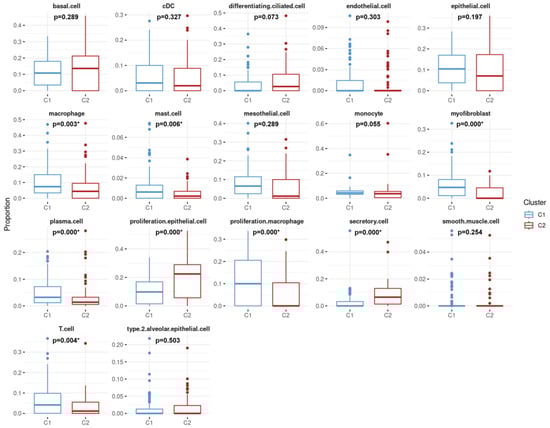
Figure 4.
Comparative analysis of cell-type distribution between two lung adenocarcinoma patient clusters. C1 is represented by blue boxes, while C2 is shown in red. The X-axis categorizes the 17 cell types. The Y-axis quantifies the proportion of each cell type within the samples from each cluster. Statistical significance is indicated by p-values, with asterisks denoting p-values less than 0.05, suggesting significant differences in the distribution of certain cell types between the two clusters.
Among the 69 features in this study, 49 features exhibited statistically significant differences between clusters C1 and C2 (Table S4). Furthermore, the normalized source values of each feature, proportion of each cell type, enrichment score from ssGSEA, and score of each PPS gene were employed to generate a heatmap (as shown in Figure 5). The 9 features were derived from cell-type classification (designated in green), the 25 features were assessed by ssGSEA (designated in yellow), and the 15 PPS genes were designated in grey. Additionally, the majority of ssGSEA-assessed immune profiles exhibited a greater degree of enrichment in C1.
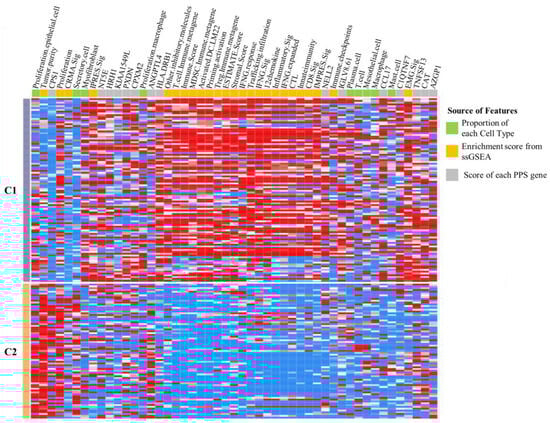
Figure 5.
The heatmap depicts the two clustering groups of lung adenocarcinoma chemotherapy patients. The C1 group is represented by grey, while the C2 group is represented by orange. The features, including proportion of cell types and estimations of immune signatures via ssGSEA and PPS gene, are represented by green, yellow, and grey, respectively.
3.5. Correlation Analysis of Immune Clustering and Chemotherapeutic Response
According to the clustering results of patients who underwent chemotherapy, we further performed Chi-square tests with various scenarios between clusters. For disease recurrence within 1 year in these patients, the frequency statistically significantly differed between clusters C1 (20.5%) and C2 (36.0%), with a p value of 0.035 (Table 2).
Table 2.
Prognostic association analysis of clusters C1 and C2.
Frequencies of the chemotherapy response among patients with LUAD also statistically significantly differed between clusters C1 and C2 (p = 0.0474). The CR in C1 at 75.6% was higher than that in C2 (59.6%), while PD in C1 at 24.3% was lower than that in C2 (40.3%) (Table 3).
Table 3.
Drug response association analysis in clusters C1 and C2.
3.6. Performance of Prognostic Models of Patients Who Underwent Chemotherapy
After exploring different clusters C1 and C2 of patients who had undergone chemotherapy, patients could potentially be divided into different risk groups with good or poor prognoses. Thus, the 49 critical features filtered in the previous section, “Immune profiles within different clusters”, were then used to construct prognostic models. Performances of the prediction models showed that the SVM had the highest accuracy of 0.955, while XGBoost had the lowest at 0.904. In terms of recall, SVM had the highest score of 1.000, while RF had the lowest at 0.931. Moreover, the highest precision was achieved by the SVM at 0.934, while XGBoost had the lowest precision at 0.898. For the F1 score, the SVM had the highest score at 0.964, while XGBoost had the lowest one at 0.918. Additionally, the SVM had the highest AUC score at 0.996, while RF and XGBoost had the lowest scores at 0.977. Detailed performances of the different models for each evaluation metric are shown in Table 4. These results demonstrated that the SVM outperformed other models and could be a promising tool for distinguishing good/poor prognoses among patients who had undergone chemotherapy.
Table 4.
Evaluation of prediction accuracy of each model.
4. Discussion
On the basis of several features, LUAD patients treated with chemotherapy could be divided into two different risk groups (C1 and C2). Relative to C2, higher levels of macrophages and T cells were expressed in C1 (as shown in Figure 4). Moreover, the immunogram demonstrated that the score of T cell immune metagene in C1 was higher than that in C2 (as shown in Figure 3). A previous study indicated that a high proportion of T cells was significantly associated with a better LUAD prognosis [25], while high infiltration of M1 macrophages was related to better overall survival of NSCLC patients [26]. Those studies were useful for describing reasons why both clusters had different risk profiles. On the other hand, cell-proportion-relevant features were derived from Bisque in this study. We also attempted to apply another tool, MuSiC, for cell decomposition, and it showed similar results to those of Bisque. For instance, in terms of the estimated proportion of plasma cells, Pearson’s correlation coefficient reached 0.98 between the MuSiC and Bisque tools.
In our immunogram analysis, we observed that the majority of immune-relevant features had higher scores in C1 (as shown in Figure 3). The features, including cytotoxic T lymphocytes (CTLs) and CD8 signature, were hypothesized to be associated with the prognosis of patients with LUAD, as a previous study indicated that high levels of CD8 T cells in the TME were associated with better prognoses [27]. On the other hand, myeloid-derived suppressor cells (MDSCs) were higher in C2; these cells were shown to play a key role in the immunosuppressive TME, and studies confirmed their involvement in the progression and prognosis of NSCLC [28]. In this study, different immunogram trends were correlated with patients’ prognoses (as shown in Figure 2 and Figure 3).
Liu et al. proposed the concepts of “hot” and “cold” tumors, with immune checkpoint inhibitors (ICIs) being ineffective against cold tumors that lack T cells [29]. Radiation and chemotherapy were found to induce changes in the TME of LUAD patients, with the detection of PD-L1 changing from negative to positive, indicating the transformation of cold tumors to hot tumors [30]. Our results showed that immune-associated features in cluster C1 were more highly activated and potentially belonged to hot tumors, with better prognoses and chemotherapy responses.
We utilized the LASSO Cox model to evaluate the PPS scores of patients with prognosis-associated genes. The aforementioned results showed that LUAD patients with lower PPS scores had better prognoses in terms of the PFI. We observed that among the filtered gene signatures, the HLA.DRB1, NELL2, IGLV8.61, C1QTNF7, TNFSF13, CAT, and AZGP1 genes were highly expressed in cluster 1 and lowly expressed in cluster 2 (as shown in Figure S3C), which could be favorable factors for patient outcomes. Relative to cluster 1, however, the CPS1 gene was highly expressed in cluster 2, which could be a poor factor for patient outcomes. According to previous reports, HLA-DR expression was positively correlated with T cell infiltration in the TME of LUAD patients [31]. Moreover, the TNFSF13 gene was suggested to be a prognostic factor for NSCLC and a potential treatment target [28].
The constructed prediction model for C1 and C2 in this study was based on different kinds of features such as cell proportions, immune-relevant signatures, and PPS-associated genes. The SVM exhibited optimal performance in terms of accuracy (0.955), recall (1.000), and AUC (0.996) in predicting the good prognosis cluster (C2 in this study). This result is comparable to that of a high-performance model constructed by Chang et al., which employed the AdaBoost algorithm and achieved an accuracy of 0.962, a recall of 0.875, and an AUC of 0.938 in predicting a good prognosis [19]. The overall performance of the constructed model in this study indicated that our methods had good predictive ability for identifying good and poor prognoses of LUAD patients. In Chang et al.’s study, moreover, they focused on the relationships between the immune status and overall survival in patients with stage 3 or 4 NSCLC, whereas we investigated the impacts of the immune profiles of patients on the chemotherapeutic response and disease recurrence. The cell proportions and immune signatures identified in our study demonstrate robust correlations with disease prognosis, particularly in regard to progression-free survival (PFI). These findings indicate that specific immune cell populations, such as T cells and macrophages, along with immune signatures, can serve as reliable biomarkers for predicting patient prognosis. This illustrates the diagnostic potential of immune signatures and cellular compositions in LUAD, providing a foundation for future studies to utilize these biomarkers in clinical settings to assess patient outcomes with greater precision.
5. Conclusions
Given the complexity of the TME, we used the Bisque cell decomposition tool in combination with single-cell reference to estimate the cell proportions of LUAD patients. We integrated immune-related variables through the ssGSEA method to establish immunograms and identified immune-relevant genes, the expressions of which were significantly related to the PFI using the CoxPH model. Our findings suggested that cell proportions, immune signatures, and PPSs were associated with the chemotherapy response in LUAD patients. We recommend that future studies explore different cell annotation tools and leverage single-cell data to improve the accuracy of research results. Tools such as Bisque can improve the ability to disassemble cells in tumor tissues when data from bulk tumors are combined with single-cell data, and collecting single-cell data in clinical experiments may enhance research outcomes.
Supplementary Materials
The following supporting information can be downloaded at: https://www.mdpi.com/article/10.3390/cancers16183207/s1, Figure S1: the proportions of the 17 cell types; Figure S2: immunoprofiling radar chart of the lung adenocarcinoma patients; Figure S3: PPS score evaluation of patients with the lung adenocarcinoma. Table S1: the marker genes of 29 immune signatures; Table S2: 23 genes were related to the prognosis of patients with LUAD; Table S3: demographic information of two clusters of patients who received chemotherapy; Table S4: a differential analysis of the 69 features in the two cluster groups.
Author Contributions
Conceptualization, J.B.-K.H. and T.-H.C.; Data Curation, J.B.-K.H.; Formal Analysis, C.-Y.L., Y.-C.W. and T.-C.L.; Investigation, C.-Y.L., Y.-C.W. and S.-H.H.; Methodology, C.-Y.L. and Y.-C.W.; Project Administration, T.-H.C.; Supervision, J.B.-K.H. and T.-H.C.; Visualization, C.-Y.L. and T.-C.L.; Writing—Original Draft, C.-Y.L. and Y.-C.W. All authors have read and agreed to the published version of the manuscript.
Funding
This work was supported by Taipei Medical University Hospital, R.O.C. (Taiwan) (110TMU-TMUH-01-1).
Institutional Review Board Statement
Not applicable. This study used publicly available datasets (TCGA and GEO) that were previously collected with appropriate ethical approvals. No new data collection involving human participants was conducted in this study.
Informed Consent Statement
Informed consent was obtained from all subjects involved in the study.
Data Availability Statement
The data utilized in this study are publicly available. The RNA-seq data from lung adenocarcinoma patients were obtained from The Cancer Genome Atlas (TCGA), which can be accessed at https://portal.gdc.cancer.gov/ (accessed on 29 March 2021). Additionally, the single-cell sequencing datasets were retrieved from the Gene Expression Omnibus (GEO) under the accession numbers GSE148071, which are available at https://www.ncbi.nlm.nih.gov/geo/ (accessed on 24 January 2021).
Acknowledgments
The authors wish to thank all who assisted in conducting this work.
Conflicts of Interest
The authors declare no conflicts of interest.
References
- Gridelli, C.; Rossi, A.; Carbone, D.P.; Guarize, J.; Karachaliou, N.; Mok, T.; Petrella, F.; Spaggiari, L.; Rosell, R. Non-small-cell lung cancer. Nat. Rev. Dis. Primers 2015, 1, 15009. [Google Scholar] [CrossRef] [PubMed]
- Devarakonda, S.; Morgensztern, D.; Govindan, R. Genomic alterations in lung adenocarcinoma. Lancet Oncol. 2015, 16, e342–e351. [Google Scholar] [CrossRef] [PubMed]
- Oser, M.G.; Niederst, M.J.; Sequist, L.V.; Engelman, J.A. Transformation from non-small-cell lung cancer to small-cell lung cancer: Molecular drivers and cells of origin. Lancet Oncol. 2015, 16, e165–e172. [Google Scholar] [CrossRef] [PubMed]
- Havel, J.J.; Chowell, D.; Chan, T.A. The evolving landscape of biomarkers for checkpoint inhibitor immunotherapy. Nat. Rev. Cancer 2019, 19, 133–150. [Google Scholar] [CrossRef] [PubMed]
- Service NCRaA. Chemotherapy, Radiotherapy and Tumour Resections in England: 2013–2014; National Cancer Research Institute: Bethesda, MD, USA, 2017.
- Cerbelli, B.; Scagnoli, S.; Mezi, S.; De Luca, A.; Pisegna, S.; Amabile, M.I.; Roberto, M.; Fortunato, L.; Costarelli, L.; Pernazza, A.; et al. Tissue Immune Profile: A Tool to Predict Response to Neoadjuvant Therapy in Triple Negative Breast Cancer. Cancers 2020, 12, 2648. [Google Scholar] [CrossRef]
- Kobayashi, Y.; Kushihara, Y.; Saito, N.; Yamaguchi, S.; Kakimi, K. A novel scoring method based on RNA-Seq immunograms describing individual cancer-immunity interactions. Cancer Sci. 2020, 111, 4031–4040. [Google Scholar] [CrossRef]
- Blank, C.U.; Haanen, J.B.; Ribas, A.; Schumacher, T.N. The “cancer immunogram”. Science 2016, 352, 658–660. [Google Scholar] [CrossRef]
- Yoshihara, K.; Shahmoradgoli, M.; Martinez, E.; Vegesna, R.; Kim, H.; Torres-Garcia, W.; Trevino, V.; Shen, H.; Laird, P.W.; Levine, D.A.; et al. Inferring tumour purity and stromal and immune cell admixture from expression data. Nat. Commun. 2013, 4, 2612. [Google Scholar] [CrossRef] [PubMed]
- Karasaki, T.; Nagayama, K.; Kuwano, H.; Nitadori, J.I.; Sato, M.; Anraku, M.; Hosoi, A.; Matsushita, H.; Morishita, Y.; Kashiwabara, K.; et al. An Immunogram for the Cancer-Immunity Cycle: Towards Personalized Immunotherapy of Lung Cancer. J. Thorac. Oncol. 2017, 12, 791–803. [Google Scholar] [CrossRef]
- Xiong, D.; Wang, Y.; You, M. A gene expression signature of TREM2(hi) macrophages and gammadelta T cells predicts immunotherapy response. Nat. Commun. 2020, 11, 5084. [Google Scholar] [CrossRef]
- Wang, X.; Park, J.; Susztak, K.; Zhang, N.R.; Li, M. Bulk tissue cell type deconvolution with multi-subject single-cell expression reference. Nat. Commun. 2019, 10, 380. [Google Scholar] [CrossRef] [PubMed]
- Jew, B.; Alvarez, M.; Rahmani, E.; Miao, Z.; Ko, A.; Garske, K.M.; Sul, J.H.; Pietilainen, K.H.; Pajukanta, P.; Halperin, E. Accurate estimation of cell composition in bulk expression through robust integration of single-cell information. Nat. Commun. 2020, 11, 1971. [Google Scholar] [CrossRef] [PubMed]
- Chen, B.; Khodadoust, M.S.; Liu, C.L.; Newman, A.M.; Alizadeh, A.A. Profiling tumor infiltrating immune cells with CIBERSORT. Cancer Syst. Biol. Methods Protoc. 2018, 1711, 243–259. [Google Scholar]
- Li, M.; Zhang, X.; Ang, K.S.; Ling, J.; Sethi, R.; Lee, N.Y.S.; Ginhoux, F.; Chen, J. DISCO: A database of Deeply Integrated human Single-Cell Omics data. Nucleic Acids Res. 2022, 50, D596–D602. [Google Scholar] [CrossRef]
- Edgar, R.; Domrachev, M.; Lash, A.E. Gene Expression Omnibus: NCBI gene expression and hybridization array data repository. Nucleic Acids Res. 2002, 30, 207–210. [Google Scholar] [CrossRef] [PubMed]
- Yuan, H.; Yan, M.; Zhang, G.; Liu, W.; Deng, C.; Liao, G.; Xu, L.; Luo, T.; Yan, H.; Long, Z. CancerSEA: A cancer single-cell state atlas. Nucleic Acids Res. 2019, 47, D900–D908. [Google Scholar] [CrossRef]
- Newman, A.M.; Liu, C.L.; Green, M.R.; Gentles, A.J.; Feng, W.; Xu, Y.; Hoang, C.D.; Diehn, M.; Alizadeh, A.A. Robust enumeration of cell subsets from tissue expression profiles. Nat. Methods 2015, 12, 453–457. [Google Scholar] [CrossRef]
- Li, C.; Tian, C.; Zeng, Y.; Liang, J.; Yang, Q.; Gu, F.; Hu, Y.; Liu, L. Machine learning and bioinformatics analysis revealed classification and potential treatment strategy in stage 3-4 NSCLC patients. BMC Med. Genom. 2022, 15, 33. [Google Scholar] [CrossRef]
- Zheng, Y.; Tang, L.; Liu, Z. Multi-omics analysis of an immune-based prognostic predictor in non-small cell lung cancer. BMC Cancer 2021, 21, 1322. [Google Scholar] [CrossRef]
- Wu, F.; Fan, J.; He, Y.; Xiong, A.; Yu, J.; Li, Y.; Zhang, Y.; Zhao, W.; Zhou, F.; Li, W.; et al. Single-cell profiling of tumor heterogeneity and the microenvironment in advanced non-small cell lung cancer. Nat. Commun. 2021, 12, 2540. [Google Scholar] [CrossRef]
- Jiang, P.; Gu, S.; Pan, D.; Fu, J.; Sahu, A.; Hu, X.; Li, Z.; Traugh, N.; Bu, X.; Li, B.; et al. Signatures of T cell dysfunction and exclusion predict cancer immunotherapy response. Nat. Med. 2018, 24, 1550–1558. [Google Scholar] [CrossRef] [PubMed]
- Yi, M.; Nissley, D.V.; McCormick, F.; Stephens, R.M. ssGSEA score-based Ras dependency indexes derived from gene expression data reveal potential Ras addiction mechanisms with possible clinical implications. Sci. Rep. 2020, 10, 10258. [Google Scholar] [CrossRef] [PubMed]
- Breuer, K.; Foroushani, A.K.; Laird, M.R.; Chen, C.; Sribnaia, A.; Lo, R.; Winsor, G.L.; Hancock, R.E.; Brinkman, F.S.; Lynn, D.J. InnateDB: Systems biology of innate immunity and beyond—Recent updates and continuing curation. Nucleic Acids Res. 2013, 41, D1228–D1233. [Google Scholar] [CrossRef] [PubMed]
- Guo, X.; Zhang, Y.; Zheng, L.; Zheng, C.; Song, J.; Zhang, Q.; Kang, B.; Liu, Z.; Jin, L.; Xing, R.; et al. Global characterization of T cells in non-small-cell lung cancer by single-cell sequencing. Nat. Med. 2018, 24, 978–985. [Google Scholar] [CrossRef]
- Jackute, J.; Zemaitis, M.; Pranys, D.; Sitkauskiene, B.; Miliauskas, S.; Vaitkiene, S.; Sakalauskas, R. Distribution of M1 and M2 macrophages in tumor islets and stroma in relation to prognosis of non-small cell lung cancer. BMC Immunol. 2018, 19, 3. [Google Scholar] [CrossRef]
- Zhang, M.; Ma, J.; Guo, Q.; Ding, S.; Wang, Y.; Pu, H. CD8(+) T Cell-Associated Gene Signature Correlates with Prognosis Risk and Immunotherapy Response in Patients With Lung Adenocarcinoma. Front. Immunol. 2022, 13, 806877. [Google Scholar] [CrossRef]
- Qian, Z.; Qingshan, C.; Chun, J.; Huijun, Z.; Feng, L.; Qiang, W.; Qiang, X.; Min, Z. High expression of TNFSF13 in tumor cells and fibroblasts is associated with poor prognosis in non–small cell lung cancer. Am. J. Clin. Pathol. 2014, 141, 226–233. [Google Scholar] [CrossRef] [PubMed]
- Liu, Y.-T.; Sun, Z.-J. Turning cold tumors into hot tumors by improving T-cell infiltration. Theranostics 2021, 11, 5365. [Google Scholar] [CrossRef]
- Miao, Q.; Zhang, L.; Zheng, X.; Jiang, K.; Wu, B.; Lin, G. Transformation of a cold to hot tumor and a durable response to immunotherapy in a patient with non-small cell lung cancer after chemoradiotherapy: A case report. Ann. Palliat. Med. 2021, 10, 4982–4986. [Google Scholar] [CrossRef]
- Senosain, M.F.; Zou, Y.; Novitskaya, T.; Vasiukov, G.; Balar, A.B.; Rowe, D.J.; Doxie, D.B.; Lehman, J.M.; Eisenberg, R.; Maldonado, F.; et al. HLA-DR cancer cells expression correlates with T cell infiltration and is enriched in lung adenocarcinoma with indolent behavior. Sci. Rep. 2021, 11, 14424. [Google Scholar] [CrossRef]
Disclaimer/Publisher’s Note: The statements, opinions and data contained in all publications are solely those of the individual author(s) and contributor(s) and not of MDPI and/or the editor(s). MDPI and/or the editor(s) disclaim responsibility for any injury to people or property resulting from any ideas, methods, instructions or products referred to in the content. |
© 2024 by the authors. Licensee MDPI, Basel, Switzerland. This article is an open access article distributed under the terms and conditions of the Creative Commons Attribution (CC BY) license (https://creativecommons.org/licenses/by/4.0/).