Simple Summary
Intracranial Epidermoid Cysts (IECs) are rare tumors. Despite their benign course, IECs can adhere to critical brain structures resulting in impairment and morbidity. The primary treatment is surgery; however, cyst adherence often complicates complete removal, resulting in notably high progression rates after subtotal resection. Due to the rarity of IECs, there has been limited research focused on understanding the mechanisms of the disease and advancing therapeutic options. As a result, there are currently no effective drug therapies available for treating patients with IECs. Targeted therapy is an effective form of treatment for tumors. It focuses on mutations that turn healthy cells into tumor cells. The mutation profile of IECs has not been investigated. We aimed to investigate the somatic landscape of IECs to gain insights into tumor biology and identify mutations that could potentially serve as targets for additional therapies. Surgery is still the most effective treatment for these patients.
Abstract
Background/Objectives: Intracranial Epidermoid Cysts (IECs) are rare intracranial tumors primarily treated through surgery. Cyst adherence complicates complete removal, leading to high rates of tumor progression after subtotal resection. The molecular drivers of IEC remain unknown. Consequently, advances in treatment have fallen short. Tumor genetic profiling has revealed potential targets for drug development, including FDA-approved options and reshaping treatment. The genetic landscape of IECs has not been explored. We applied Whole Exome Sequencing (WES) to IECs to gain insights into the mechanisms of oncogenesis and identify potential therapeutic targets. Methods: We performed WES on tumor tissue and matched blood samples, when available. Following GATK best practices, we conducted read processing, quality control, somatic variant calling, and copy-number inference. Data analyses and visualization were conducted in R. Results: Top altered genes are associated with the immune system and tumor microenvironment, suggesting a mechanism of immune evasion. Gene and pathway enrichment revealed a high mutation burden in genes associated with Extracellular Matrix (ECM) and PI3K-AKT-mTOR cascades. Recurrent and deleterious alterations in NOTCH2 and USP8 were identified in 50% and 30% of the cohort, respectively. Frequent amplifications in deubiquitinases and beta-defensins strengthened the involvement of immune mechanisms for oncogenic transformation. Conclusions: Top altered genes and recurrent mutations may play a role in shaping the microenvironment and modulating immune evasion in IECs. USP8 and NOTCH2 may serve as clinically relevant target for IECs. Finally, we present evidence that the crosstalk between the PI3K-Akt-mTOR and ECM signaling pathways may play a role in modulating the immune escape mechanism in IECs.
1. Introduction
Intracranial Epidermoid Cysts (IECs) are congenital ectodermal inclusions that arise from incomplete closure of the neural tube during fetal brain development [1,2]. IECs are rare brain tumors representing only 0.3–1.8% of all intracranial tumors [2,3]. They typically occur in both genders, between the ages of 20–60 years, with a peak incidence in the fourth decade [4]. In the skull base, IECs are often located in the cerebellopontine angle (37.3%) and parasellar region (30%), spreading in the subarachnoid space of the basal cisterns [5]. They may also be found in the middle cranial fossa (18%), diploe (16%), spinal canal (5%) [5,6], and rarely in the brain stem [7,8,9]. Magnetic resonance imaging (MRI) is the diagnostic approach to identify IECs. Diffusion-weighted MRI allows greater accuracy in the preoperative differential diagnosis [10].
IECs are usually slow-growing and indolent tumors. Despite their benign nature, they can undergo malignant transformation. Tumor growth can be driven by the division of the stratified squamous epithelium lining its cavity. Cyst contents are largely composed of acellular keratin debris and cholesterol inclusions. Liquefaction of the cyst contents is associated with infection or loss of vascularity [11]. Aggressive IECs have a propensity to adhere to critical neurovascular structures, resulting in significant morbidity and neurologic deficit [12,13]. Malignant transformation of IECs into secondary malignant lesions has been reported [14,15,16], including the development of melanoma [17] and Squamous Cell Carcinoma (SCC) [18].
Surgery becomes necessary when IECs exhibit characteristics of malignant transformation, such as rapid growth, adherence to or invasion of critical brain structures, recurrence/progression, and, in rare cases, metastasis. Gross total resection is critical to minimize tumor progression [19]; however, cyst adherence results in difficult removal. A subtotal resection yields progression rates of up to 93% [20]. Radiation does not appear to play a significant role in the management of IECs; however, it has been used as an adjunct therapy for cysts in an effort to control potential malignant transformation. Due to the rarity of IECs, research focusing on cyst prognosis, diagnosis, and treatment is limited. Challenges include a lack of timely access to molecular testing for determining eligibility for targeted therapies, difficulties in enrolling sufficient numbers of patients in clinical trials, and limited incentives for drug development. As a result of the insufficient understanding of the pathophysiology and molecular characteristics of IECs, effective systemic or targeted therapies for these patients are not currently available.
Next-generation sequencing has dramatically reshaped oncological treatment through the identification of genetic variants that provide prognostic information, and aid in therapeutic selection, resulting in hypothesis-driven clinical trials [21]. Many genetic variants may be targeted by FDA-approved options, highlighting the potential repositioning of these drugs to a new indication [22].
The genetics of IECs remain underexplored. There have been suggestions of a familial inheritance pattern observed for epidermoid cysts of the spleen [23]. Mice lacking the IL-1 receptor (IL-1R) (IL1r−/−) or deficient in IL1-β developed immunosuppression and multiple epidermal cysts after chronic UVB [24], suggesting that induced somatic events and an altered innate immune response may be involved in the initiation of epidermoid cysts. However, the role of somatic genetic variants in the development and progression of skull base epidermoid cysts is unknown.
In this study, we applied Whole Exome Sequencing (WES) to investigate somatic alterations in IECs that required surgical intervention due to their aggressive features. Our primary goal was to improve our understanding of the pathophysiology underlying their malignant transformation. Gaining insight into the mechanisms of cyst development and progression could lead to the identification of potentially actionable variants with clinical relevance, ultimately advancing treatment options for patients who currently rely on surgery as the most effective intervention.
2. Materials and Methods
2.1. Specimens, Patients, and Clinical Data
Studies were conducted following the U.S. Common Rule ethical guidelines. Tumor was resected from participants with the diagnosis of IEC who underwent surgery between 1995 and 2021 at the University of Washington hospitals (Seattle, WA, USA). The respective clinical data was extracted from the University of Washington, School of Medicine clinical database. Data and specimen collection were reviewed and approved by the University of Washington Institutional Review (STUDY 00002162). Written informed consent was obtained from all subjects. Samples were collected and stored in tumor biobank until further processing. Specimens were reviewed by three neuropathologists and neurosurgeons. The pathology reports confirmed the diagnosis of IECs with aggressive features. Clinical data was gathered regarding date, history, demographics, imaging, neuropathology reports, operative information, pre-and post-operative symptoms, adjuvant treatment, and outcomes (Supplementary Table S1). Recurrence was defined as at least 1 cm of enhancement on MRI subsequent gross total resection. Progression was considered to be, at least, 1 cm of growth of a residual tumor on MRI after partial surgical resection.
2.2. Genomic DNA Storage and Handling
Genomic DNA (gDNA) was isolated from six fresh-frozen tissues and matching blood (when available) using the QIAmp DNA Mini Kit (Qiagen, Hilden, Germany) and QIAmp DNA Blood Mini Kit (Qiagen, Hilden, Germany), respectively, following the manufacturer’s recommended protocol. gDNA samples were isolated post-surgically. Proper storage and handling are essential to the maintenance of quality DNA for downstream research applications. gDNA was stored in aliquots to avoid freeze-thawing. Samples were stored at a temperature below −80 °C to maintain integrity during long-term storage.
2.3. Whole-Exome Sequencing
DNA Quality Control (QC), library preparation and sequencing of gDNA was carried out at the University of Washington Northwest Genomics Center, Seattle, WA. DNA was quantified using the Qubit fluorometer (Invitrogen, Carlsbad, CA, USA). DNA quality control included DNA quantification, values of absorbance ratio A260/A280, sex typing, and molecular “fingerprinting” using TaqMan Open Array 63-SNP assay (Thermo Fischer Scientific, Waltham, MA, USA) using a custom exome SNP (Northwest Genomics). Samples fail QC if: (1) the total amount, concentration, or volume is too low; (2) the fingerprint assay produces poor genotype data or integrity of DNA; or (3) sex-typing is inconsistent with the sample. All samples passed QC. Automated library construction and exome capture were carried out in 96-well plate format, using Perkin-Elmer Janus II (PerkinElmer, Waltham, MA, USA) equipment. Five hundred nanograms of genomic DNA were subjected to a series of shotgun library construction steps, including fragmentation through acoustic sonication (Covaris, Woburn, MA, USA), end-polishing, and A-tailing ligation of sequencing adaptors, followed by PCR amplification with dual 10 bp barcodes for multiplexing. Libraries underwent exome capture using the Twist Human Core Exome Kit + RefSeq exome (36.5 MB target) (Twist Biosciences, San Francisco, CA, USA). Briefly, 187.5 ng of the shotgun library was hybridized to biotinylated capture probes for 16–18 h. Enriched fragments were recovered via streptavidin beads and PCR was amplified. Since each library was uniquely barcoded, samples were captured in multiplex. Before sequencing, the pooled library concentration was determined by fluorometric assay. Molecular weight distributions were verified on the Agilent Bioanalyzer (Agilent, Santa Clara, CA, USA) (consistently 180 ± 15 bp). Parallel sequencing-by-synthesis with fluorescently labeled, reversibly terminating nucleotides was carried out on the NovaSeq6000 instrument (RTA 3.1.5) (Illumina, San Diego, CA, USA) in Paired-End 100 bp (PE100) mode, using NovaSeq 6000 v1.5 Reagent Kit (Illumina, San Diego, CA, USA).
2.4. Read Processing, Quality Control, and Somatic Variant Calling
Base calls generated in real-time on the NovaSeq6000 were demultiplexed. Raw reads were assessed for Phred score quality using the FastQC tool kit v0.11.9 (https://www.bioinformatics.babraham.ac.uk/projects/fastqc/, accessed on 21 September 2023). Trimmomatic v0.3.9 [25] was used to detect and remove sequencing adapters, primers, and low-quality nucleotides. Trimmed reads were aligned against the reference human genome build hg38 (UCSC Genome Browser) [26] using the Burrows-Wheeler Aligner (BWA) (v0.7.15) [27]. All aligned read data were sorted and subject to duplicate removal using Picard (v2.6.0) (https://broadinstitute.github.io/picard/, accessed on 21 September 2023). Base qualities were recalibrated with GATK BaseRecalibrator (v4.2.6.1) (https://gatk.broadinstitute.org/, accessed on 21 September 2023). Somatic variant calling in unmatched samples was performed against the GATK panel of normal (PoN) (human-built hg38) using three variant callers: Mutect2 (v4.2.6.1) (GATK), Varscan (v2.4.2) [28], and Vardict v2019.06.04-0 [29]. Tumor/normal variant calling was conducted with Mutect2 (v4.2.6.1) (GATK), Varscan (v2.4.2) [28], MuSe (v1.0), and Strelka2 v2.9 [30]. To identify high-confidence mutations, a joint analysis was applied by combining at least three software (three-caller pipeline approach) [31]. Mutation calls were selected through a stringent filtering process and functionally annotated with ANNOVAR v 2020-06-08 [32]. See also Supplementary Table S2.
2.5. Somatic Copy-Number Inference
Somatic Copy Number Variations (CNVs) were identified using CNVkit (v0.9.9) [33]. Whole-exome sequencing read alignments in BAM format, the capture bait locations, and the reference human genome build hg38 (UCSC Genome Browser) [26] were the inputs to the program. All additional files used in the copy-number workflow, such as GC content and the location of sequence repeats, were extracted from the genome sequence in FASTA format using scripts included with the CNVkit v0.9.9 distribution. Log2 copy ratios across the genome for each sample were calculated based on on-target reads and the nonspecifically captured off-target reads. The baseline of normalized sequencing depth on targeted regions was first constructed based on normal samples. For each tumor sample, log2 copy number ratio of normalized sequencing depth on each targeted region between the tumor sample and the baseline was calculated. A CNVKit built-in segmentation algorithm was applied to the log2 ratio values to infer discrete copy number segments [33]. The log2 ratios and segments were used as inputs for the genomic Identification of Significant Targets in Cancer (GISTIC) v2.0.23 [34], allowing the identification of copy number regions that were significantly amplified or deleted across the set of samples.
2.6. Data Analysis and Visualization
Genomic data analysis, visualization, and annotation were conducted in R v4.1.2. Gene Ontology (GO) was performed by using Bioconductor v3.1.7, clusterProfiler v4.2.2 [35] and enrichR browser (https://maayanlab.cloud/Enrichr/, accessed on 16 December 2023) [36] with the inclusion of Molecular Function, Biological Process, and Molecular Component databases [37]. The parameters for GO analysis included the list of all 728 altered genes identified in IECs, a q-value cutoff of 0.1, and a Benjamini and Hochberg (BH) adjusted p-value cutoff of 0.05. Pathway enrichment analysis was carried out using the Kyoto Encyclopedia of Genes and Genomes (KEGG) 2021 Human database [38]. Reactome 2022 [39] and WikiPathways 2024 [40] databases were also assessed. Search Tool for the Retrieval of Interacting Genes (STRING-DB V12.0, http://www.string-db.org/, accessed on 11 October 2024) was used to construct the Protein-Protein Interaction (PPI) network using full STRING network, medium confidence, FDR stringency of 5% and k-means clusterization. We utilized the Maftools v2.10.05 [41] package to extract, analyze, and visualize copy-number aberrations and mutational signatures. p < 0.05 was considered statistically significant unless stated otherwise. Biorender software v4 (Toronto, CA, USA) was used for scientific illustration. See also Supplementary Table S2.
All software versions, source code, and databases used in the present study are listed in Supplementary Table S2.
Data will be deposited in a publicly available database before publication.
3. Results
3.1. Samples and Clinical Data
We performed WES in six IEC tissue samples. The six samples used in this study were collected from patients who underwent surgical resection of an IEC from 1995 to 2021 at the University of Washington hospitals (Table 1 and Supplementary Table S1). WES was also performed in the gDNA of matching blood samples, if available. The mean age of the patient cohort was 36.8 years, with all but one individual being of female sex. Fifty per cent of the patients presented with symptoms of headaches, while 33% experienced changes in vision before surgical intervention. After diagnosis, all patients underwent craniotomy for tumor resection. Among them, 50% of the cases underwent Gross Total Resection (GTR), two patients (33%) received Subtotal Resection (STR), and one individual (17%) underwent a near Gross Total Resection (nGTR) (Table 1). In H766, an STR posed a progression risk, diagnosed ~7 months post-STR. For 4316, two Gross Total Resections (GTR) in 2011, and 2016 resulted in tumor recurrence. The complete clinical information is presented in the Supplementary Table S1.

Table 1.
Demographics and Tumor Characteristics.
3.2. Overview of the Somatic Mutational Signature of IECs
The WES workflow and data analysis are shown in Figure 1. We performed the gDNA isolation of six fresh-frozen epidermoid samples resected during surgery and respective matching blood, when available. After library preparation, the WES was carried out. Read alignment, somatic variant calling, and VCF filtration were carried out as described in the methods. For translational purposes, only non-synonymous alterations and indels were considered for downstream analysis. A total of 1221 variants corresponding to 1094 unique alterations and affecting 728 unique genes were identified (Supplementary Table S3). From these, ~13.00% (158/1221) have been reported in the Catalogue of Somatic Mutations in Cancer—COSMIC database (https://cancer.sanger.ac.uk/cosmic, accessed on 21 September 2023) (Figure 1).
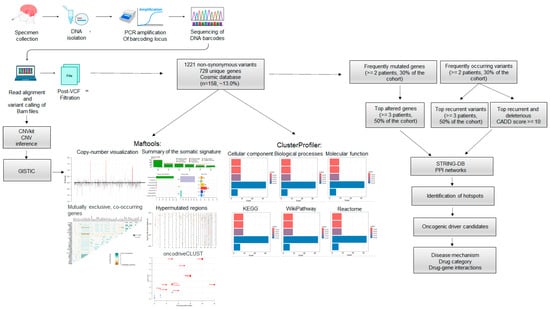
Figure 1.
Whole Exome Sequencing (WES) and data analysis workflow. WES was conducted on six fresh-frozen epidermoid cysts. The sequencing reads were aligned to the reference human genome hg38. Aligned BAM files underwent copy number inference using CNVkit and somatic variant calling. A total of 1221 alterations across 728 unique genes were identified, with nearly 13.0% (n = 158/1221) of these mutations reported in COSMIC. Gene Ontology (GO) annotation and pathway enrichment were performed on the 728 altered genes. The analysis of frequently mutated genes and common variants enabled the identification of protein-protein interaction (PPI) networks, mutation hotspots, and potential oncogenic drivers. Disease mechanisms and possible targeted therapeutic options were suggested.
The summary of the somatic mutational signature of IECs is shown in Figure 2. The median number of variants per sample was 178. The majority of variants identified were missense mutations (1065/1221, 87.22%). In-frame deletions and insertions corresponded to 72/1221 (6.47%) and 15/1221 (1.23%), respectively. Frame shift mutations constituted 2.7% (33/1221) of all somatic alterations. Nonsense and nonstop mutations corresponded to 22/1221 (1.80%) and 5/1221 (0.41%), respectively. Two (0.16%) translation start site alterations were also identified. According to the variant type, 89.43% (1092/1221) were Single Nucleotide Polymorphisms (SNPs), 2.21% (27/1221) were insertions, and 8.35% (102/1221) were deletions. The most predominant Single Nucleotide Variant (SNV) class alterations were C > T (n = 408) and T > C (n = 231) (Figure 2A). Hypermutated regions were explored by plotting inter-variant distances on a linear genomic scale. Visualization through a rainfall plot revealed changes in inter-event distances located on chromosomes 7, 12, 16, and 19 (Figure 2B). Potential driver candidates identified by the algorithm oncodriveCLUST [42] included the genes PDPR, DNAH2, UBXN11, KIR2DL1/3, FCGBP, PRSS2, MTCH2, LILRB1, HLA-DQB1, HLA-DRB1, and TPTE (Figure 2C). Pair-wise Fisher’s Exact of the top fifty altered genes of the dataset detected pairs of mutually exclusive or co-occurring sets of mutated genes. Relationships were identified when p < 0.1 (Figure 2D).
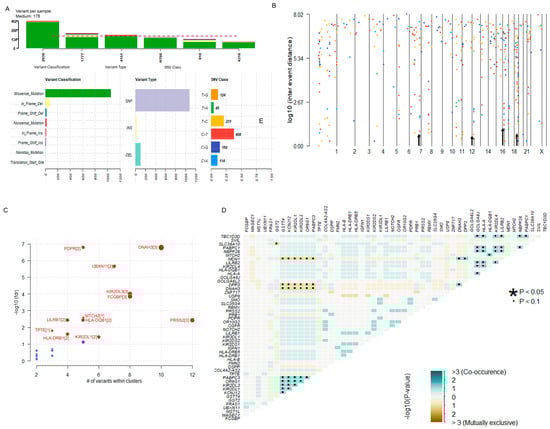
Figure 2.
Overview of the Somatic Mutational Signature of IECs. (A) Data Summary: The bar plots summarize the number of variants identified in each sample, including the variant classification, variant type, and SNV class in the dataset. The median number of variants per sample was 178. Most variants identified were missense mutations (1065/1221, 87.22%) and SNPs (1092/1221, 89.43%). Predominant SNV alterations included C > T (n = 408) and T > C (n = 231). (B) Hypermutated regions. The rainfall plot of log10(inter-event distance) and chromosome number show regions where potential changes in inter-event distances are located (also indicated by an arrow). Each point of the rainfall plot is color-coded according to the SNV class. Changes in inter-event distances (arrow) are located on chromosomes 7, 12, 16, and 19. (C) Prediction of Disease-Associated Driver Genes. The bubble plot of -log10(fdr) and the number of variants within clusters show the predicted driver candidates (marked in red). The number of closely spaced mutational clusters is highlighted within brackets. (D) Mutually Exclusive or Co-occurring genes: the triangular matrix displays relationships among the top mutated genes (p < 0.1). Green indicates a tendency toward co-occurrence, whereas pink indicates a tendency toward exclusiveness. See also Supplementary Table S3.
3.3. IECs Are Characterized by an Altered Immune Repertoire
GO annotation and pathway analyses were performed on the 728 altered genes. The top five cellular components involved the MHC protein complex, the luminal side of the endoplasmic reticulum membrane, the collagen-containing extracellular matrix, and the MHC class II protein complex. The molecular function annotation showed extracellular matrix structural constituent, carbohydrate binding, inhibitory MHC class I receptor activity, peptide binding antigen, and MHC protein complex binding. The main biology processes were associated with the MHC protein complex assembly, peptide antigen assembly with the MHC protein complex, MHC class II protein complex assembly, and peptide antigen assembly with the MHC class II protein complex (Figure 3A) (Supplementary Table S4). Pathway enrichment analysis was carried out using KEGG [38], Reactome [39], and WikiPathways [40] (Figure 3B). The top five KEGG pathways included antigen processing and presentation, graft-versus-host disease, cell adhesion molecules, Extracellular Matrix (ECM)-receptor interaction, and human papillomavirus infection. The KEGG pathway enrichment and respective associated genes are presented in Figure 3C and Supplementary Table S5.
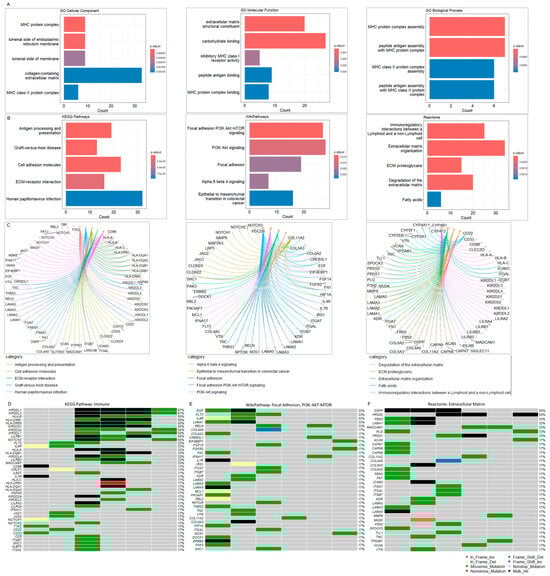
Figure 3.
(A) Gene Ontology (GO) analysis. GO was performed with the inclusion of Molecular Function, Biological Process, and Molecular Component databases. The bar plots show the top enriched terms. Bars correspond to terms with significant adjusted p-values < 0.05. (B) Pathway enrichment analysis. The bar plots show the top enriched terms in each library (KEGG 2021, WikiPathway 2024, and Reactome 2022). Colored bars correspond to terms with significant adjusted p-values < 0.05. (C) Pathway gene networks. Pathway categories are color-coded to facilitate the visualization of the genes associated with each significant term. (D) Oncoplot of altered immune-associated genes. The oncoplot illustrates the most altered immune-associated genes within the cohort. (E) Oncoplot of altered focal adhesion/PI3K-Akt-mTOR-associated genes. (F) Oncoplot of Extracellular Matrix (ECM)-associated genes. The oncoplots illustrate the most altered immune-associated genes within the cohort. The oncoplot illustrates the most altered immune-associated genes within the cohort. The legend shows color-coded variant classification. Variants labeled as Multi_Hit indicate genes that are mutated more than once within the same sample. See also Supplementary Tables S4–S7.
The top WikiPathways involved focal adhesion PI3K-Akt-mTOR, PI3K-Akt-mTOR, and focal adhesion pathways, followed by the alpha-6-beta-4 and epithelial to mesenchymal transition in colorectal cancer cascade. The WikiPathways enrichment and associated genes are presented in Figure 3C and Supplementary Table S6. The analysis with Reactome revealed immunoregulatory interactions between lymphoid and non-lymphoid cells, ECM organization, ECM proteoglycans, degradation of the ECM and fatty acids signaling. The Reactome enrichment and associated genes are presented in Figure 3C and Supplementary Table S7.
Both GO and pathways enrichments demonstrated that many altered genes in IECs are closely associated with immunity and ECM, suggesting the involvement of the immune system and microenvironment as a mechanism of intracranial epidermoid cyst formation.
To better visualize alterations in the immune repertoire, we assessed genetic changes in immune-related genes using an oncoplot (Figure 3D). Remarkably, somatic mutations in these genes were present in 100% of the cohort. The most frequently altered immune-related genes in IECs were Killer cell immunoglobulin-like receptors 2DL1 (KIR2DL1) and 2DL3 (KIR2DL3), which harbored multiple missense and multi-hit mutations, affecting approximately 70% of IEC patients. Additionally, we observed DNA variations in other Killer cell immunoglobulin-like receptors (KIR2DS1/2/4, KIR3DL1/2, KIR2DL4), HLA genes (HLA-A/B/C, HLA-DRB1/5, HLA-DQB1, HLA-DPB1, HLA-DQA1/2), and other immune-associated genes, albeit at lower frequencies within the study cohort (Figure 3D, Supplementary Table S3). These alterations in the immune repertoire associated with IECs strongly suggest mechanisms of tumor immune evasion.
IECs display a high mutation burden in genes associated with ECM-mediated cellular interactions and PI3K-AKT-mTOR signaling.
Next, we assessed the mutation burden in genes associated with PI3K-Akt-mTOR signaling and ECM-mediated cellular interactions as enriched by WikiPathways and Reactome. Somatic mutations on these genes also affected 100% of the cohort.
The top altered genes associated with the focal Adhesion and PI3K-Akt-mTOR signaling included the Epidermal Growth Factor (EGF), Receptor-type tyrosine-protein kinase FLT3 (FLT3), Interleukin-4 receptor subunit alpha (IL4R), Laminin subunit alpha-1 (LAMA1), and Reelin (RELN) (~33%) (Figure 3E, Supplementary Table S3). The top altered genes related to the extracellular matrix included the Dentin sialophosphoprotein (DSPP) and Trypsin-2 (PRSS2) (Figure 3F, Supplementary Table S3).
ECM components and the PI3K-Akt-mTOR signaling pathway play crucial roles in processes related to tumor progression, including cell proliferation, adhesion, invasion, and migration [43,44]. Aberrant interactions between EGF and ECM receptors lead to the downstream activation of the PI3K-Akt-mTOR pathway [43]. The high mutation burden observed in genes strongly suggests a potential interplay between PI3K-Akt-mTOR signaling and ECM, contributing to tumor cell function and the establishment of a tumor-supportive microenvironment in IECs.
Gene Ontology (GO) was performed by using Bioconductor v3.1.7, clusterProfiler v4.2.2 [35] and enrichR browser (https://maayanlab.cloud/Enrichr/, accessed on 11 October 2024) [36] with the inclusion of Molecular Function, Biological Process, and Molecular Component databases [37]. The parameters for GO analysis included the list of all 728 altered genes identified in IECs, a q-value cutoff of 0.1, and a Benjamini and Hochberg (BH) adjusted p-value cutoff of 0.05. Pathway enrichment analysis was carried out using the Kyoto Encyclopedia of Genes and Genomes (KEGG) 2021 Human database [38]. Reactome 2022 [39] and WikiPathways 2024 [40] databases were also assessed.
3.4. Oncogenic Driver Candidates of IECs
To identify highly mutated genes that are likely oncogenic drivers of IECs, we focused on genes altered in at least 50% of the cohort. (≥3 patients). Thirty-three genes met the criteria (Figure 4A, Supplementary Table S8). Except for Basic Salivary Proline-Rich Protein 1 (PRB1), which is not associated with cancer hallmarks according to the literature, all other identified genes have been previously linked to oncogenic transformation. Furthermore, over 50% of these genes have been previously linked to tumor immune infiltration and the tumor microenvironment (Table 2), reinforcing their potential role as oncogenic drivers. The malignant transformation of IECs into Squamous Cell Carcinoma (SCC) and melanoma has been previously reported [17,18]. Notably, approximately 36% (n = 12/33) of the most affected genes were also found to be altered in squamous cell carcinoma (SCC) and melanoma (Table 2—genes highlighted in bold), strongly suggesting their involvement in the progression of IECs. Thus, these genes may represent promising targets for further investigation in therapeutic strategies to block or delay epidermoid malignant transformation.
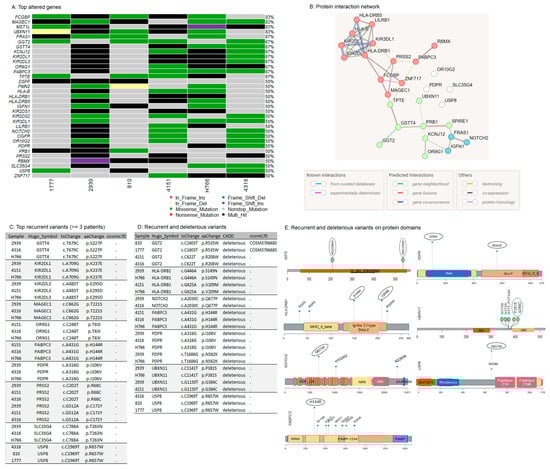
Figure 4.
Potential oncogenic drivers and recurrent somatic variants in IECs. (A) Top altered genes in IECs. The oncoplot illustrates the most altered genes within the cohort. The legend shows color-coded variant classification. Variants labeled as Multi_Hit indicate genes that are mutated more than once within the same sample. (B) Interaction network. The protein-protein interaction (PPI) network illustrates the functional associations among the top altered genes. This PPI analysis was conducted using the STRING tool, applying a medium confidence threshold, an FDR stringency of 5%, and k-means clustering. (C) Top recurrent variants: list of the most recurrent somatic events, affecting at least 50% (n = 3/6) of the cohort. (D) Recurrent and predicted deleterious variants: list of recurrent variants predicted as deleterious according to the Combined Annotation Dependent Depletion (CADD). (E) Lollipop plots of recurrent and predicted deleterious variants on protein domains. The circle indicates the most frequently occurring mutations within the cohort. See also Supplementary Tables S3 and S8.
Table 2.
Characteristics of potential drivers of IECs.
Variants identified in the driver candidates were frequently located in specific DNA sites suggesting disease-related mutation hotspots. The hotspots were positioned in conserved protein regions, domains, and motifs (Supplementary Figure S1), strengthening a potential involvement in the disease.
The functional protein association network analysis revealed three interaction clusters associated with the MHC protein complex, antigen processing, and presentation, suggesting again an altered mechanism to circumvent immune control (Figure 4B, Supplementary Table S9).
3.5. Recurrent Variants in NOTCH2 and USP8
After the investigation of the most altered genes, we conducted the analysis focusing on recurrent mutations observed in IECs. The most frequently observed alterations, affecting at least 50% (n = 3/6) of the cohort were identified in GSTT4 (p.S227P), KIR2DL1 (p.K237E), KIR2DL3 (p.E295D), MAGEC1 (p.T221S), OR9G1 (p.T83I), PABPC3 (p.H144R), PDPR (p.I106V), PRSS2 (p.R68C and p.C171Y), SLC35G4 (p.T263N), and USP8 (p.R657W). None of these variants has been previously associated with cancer (Figure 3C).
Next, from all the recurrent variants identified, we investigated alterations that are likely to be deleterious, according to the Combined Annotation-Dependent Depletion (CADD) scores [108]. (Figure 4D, Supplementary Table S8). Recurrent and deleterious alterations included the two missense mutations p.R208W and p.R535W in GGT2, involving the gamma-glutamyl transpeptidase domain, p.S149N and p.V209M in HLA-DRB1, both positioned in the Ig-like C1-type domain and Beta-2 region, the missense p.Q677P in the EGF-like calcium-binding domain of NOTCH2, and p.P381S and p.G384C in UBXN11, both located adjacently to the UBX domain. In PDPR, the variants p.I106V and p.N562K are positioned in the chain and the GcvT domain of the protein, respectively. PDPR p.I106V, PABPC3 p.H144R, and USP8 p.R657W occurred in the highest frequency within the cohort, affecting 50% of patients. PDPR p.I106V is in the chain-pyruvate dehydrogenase phosphatase regulatory subunit, which is involved in the regulation of pyruvate metabolism. PABPC3 p.H144R is positioned in the RNA recognition motif (RRM) domain, which is the most prevalent RNA binding domain in eukaryotes, and it is responsible for the high-affinity binding to homopolymeric adenosines for the regulation of mRNA stability and translation initiation [109]. USP8 p.R657W is adjacent to the peptidase C19 domain of the deubiquitinase, which is important to recognize and hydrolyze the peptide bond at the C-terminal glycine of the ubiquitin (Figure 4E, Supplementary Figure S1).
Among the recurrent and predicted deleterious variants, only the GGT2 p.R535W has been previously reported in cancer (COSM3766685) (Figure 4D). USP8 and NOTCH2 are well-known oncogenes that are frequently overexpressed in human cancers. The high expression of NOTCH2 and USP8 has been correlated to a worse prognosis in many tumor types [104,105,110,111], including SCC [84,110,111], and melanoma [85,105]. Consistently, USP8 and NOTCH2 mutations were characterized as gain-of-function alterations [112,113]. These observations suggest that the USP8 and NOTCH2 variants identified in IECs may enhance protein function and promote tumorigenesis. However, further experimental investigation is needed to fully characterize their roles in epidermoid formation and progression.
Considering NOTCH2 as a potentially significant driver of IECs, we noted that among the three clusters identified in the functional protein association network (Figure 4B), NOTCH2 indirectly interacts with clusters enriched by immune-associated genes. Notch signaling plays a crucial role in regulating various components of the tumor microenvironment, including immune and mesenchymal cells [114]. These observations suggest that an interplay between NOTCH signaling and immune cells within the IEC tumor microenvironment may influence immune-mediated oncogenic mechanisms.
3.6. Somatic Copy-Number Inference Strengthens the Involvement of Immune-Associated Genes in the Pathogenesis of IECs
The CNV analysis of each sample was performed by using CNVkit [33] (Supplementary Table S10). CNVs stratified by sample, CNV length, and hit counts by chromosome are shown in Supplementary Figure S2. The chromosome 19 was the most affected (Supplementary Figure S2).
To identify somatic copy number regions that are significantly amplified or deleted across all six samples, the log2 ratios and segments generated with CNVkit [33] (Supplementary Table S10) were used as inputs for GISTIC [34] (Supplementary Table S11). The cohort analysis of the distributions of amplification and deletion events revealed seven cytobands significantly altered in the cohort, among them, amplifications of 7q35, 4p16.1, 17q12 (AP_5 and AP_6), 8p23.1, and 14q11.2, and the deletion of 2p11.1 (Figure 5A). Of these, the events with the lowest False Discovery Rate qvalues calculated for aberrant regions included the amplification of the cytobands 7q35 (AP_5 and AP_6), 4p16.1, and 17q12 (Figure 5A), affecting 67% (n = 4/6), 50% (n = 3/6), and 33% (n = 2/6) of the cohort, respectively (Figure 5B). The list of genes located in each wide peak region is shown in Figure 5C. Interestingly, the pattern of alterations in deubiquitinases and immune-related genes is also present at copy number levels. Recurrent amplifications were predominantly noted in DUB/ubiquitin-specific protease 17 (USP17) family, TBC1 domain protein family, and beta-defensins genes (DEFB4B, DEFB103A, DEFB104A, DEFB105A, DEFB106A, DEFB107A, and DEFB131) within the cohort, which overexpression plays a major role in the immune response to cancer [115,116,117,118,119,120].
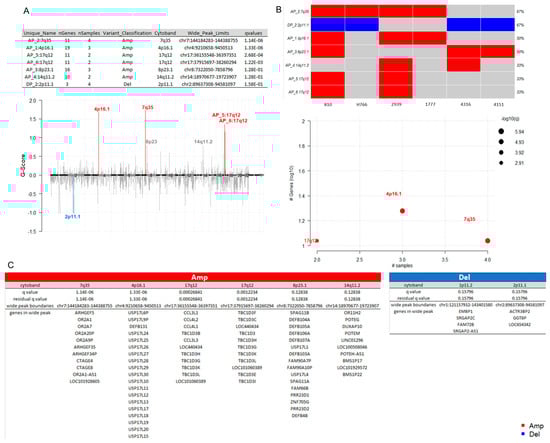
Figure 5.
Somatic copy-number alterations in IECs. (A) Cytoband summary. The table at the top displays seven cytobands found to be altered in the cohort, including amplifications at 7q35, 4p16.1, 17q12 (AP_5 and AP_6), 8p23.1, and 14q11.2, as well as a deletion at 2p11.1. The chromPlot highlights the most significant events in the study (lower q values), specifically in cytobands 4p16.1, 7q35, 17q12, and 2p11.1. (B) Recurrently altered regions. The oncoplot and the bubble plot show the number of samples affected by frequently occurring copy-number events. Among them, the amplification of 7q35 (AP_5 and AP_6), 4p16.1, and 17q12 affected 67% (n = 4/6), 50% (n = 3/6), and 33% (n = 2/6) of the cohort, respectively (C) Genes located in wide peak regions. The wide peak boundaries illustrate the most likely gene targets within each aberrant cytoband region. Amplifications are indicated in red, while deletions are shown in blue. The red color indicates amplifications. The blue color indicates deletions. See also Supplementary Tables S10 and S11.
3.7. Potential Targets in IECs
To generate hypotheses about how the potential driver candidates of IECs might be targeted therapeutically or prioritized for drug development, we matched the list of the thirty-three gene driver candidates against the Drug-Gene Interaction database (DGIdb), a compendium of drug-gene interactions and potentially druggable genes, to prioritize drug-gene interactions [121,122]. The categorical analysis revealed the PTEN family which includes the TPTE gene. Variants in TPTE (p.L332P, p.R57Q, p.R84del, p.R84W) were observed in 70% of the cohort. Given that the pathway enrichment analysis indicated the significant enrichment by PI3K-Akt-mTOR and ECM pathways (Figure 3E,F), current PI3K, AKT, mTORC1/mTORC2, and PDK1 inhibitors may be interesting drug candidates for therapeutic intervention of IECs.
NOTCH2, whose genomic alterations p.Q677P, p.H1024Q, p.N2265K affected 50% of the IECs, was identified as a clinically relevant target for IECs (Figure 6A). The drug-gene interaction analysis indicated inhibitors and antibody candidates for targeted therapies (Figure 6B). Among these, the NOTCH2 inhibitor Nirogacestat (PF-03084014) is an FDA-approved chemotherapeutic agent marketed as Ogsiveo® (SpringWorks Therapeutics). It is indicated for adult patients with progressing desmoid tumors requiring systemic treatment. Additionally, NOTCH2 inhibitors RO4929097 and MK0752 are currently in trial for pancreatic cancer. Furthermore, NOTCH2 antibodies OMP-59R5 (Tarextumab), and REGN-421 are under investigation for solid tumors (Figure 6B).
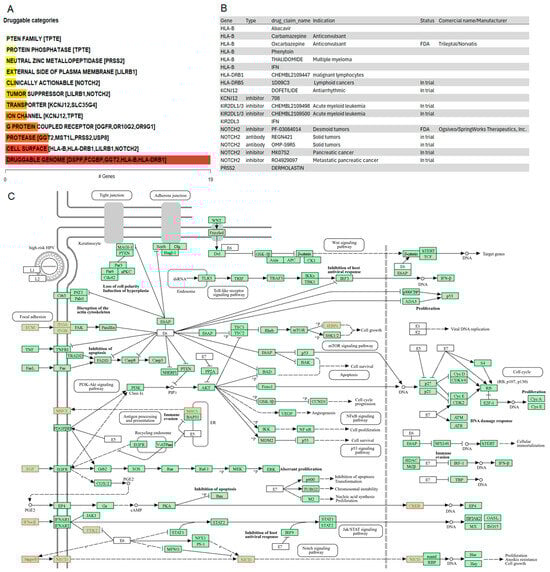
Figure 6.
Drug-gene interactions and potentially druggable oncogenic mechanisms in IECs. (A) Druggable categories. The plot shows druggable gene categories along with up to top five genes involved in them. The categorical analysis revealed the PTEN family which includes the TPTE gene. NOTCH2 was identified as a clinically relevant target. (B) Drug-gene interactions. List of inhibitors and antibodies, including FDA-approved options to target the oncogenic drivers of IECs. (C) Crosstalk of potential mechanisms underlying the oncogenesis of IECs. Green boxes highlight the genes within the reference pathways, ensuring the pathway’s completeness. Red coloring in the pathway map indicates enriched disease-associated nodes. The figure highlights a crosstalk among focal adhesion, EGF, MHC, and antigen processing signaling cascades.
To investigate additional oncogenic mechanisms driving intracranial epidermoid cysts that could be targeted by existing drugs, we examined the relationship between potential drivers of IECs and the top pathways identified in the enrichment analysis. The analysis demonstrated crosstalk among focal adhesion, EGF, MHC, and antigen processing signaling related to immune evasion and NOTCH2 signaling, indicated by the red coloring in the pathway. Together, these results provide evidence of multiple potential mechanisms underlying the oncogenesis of IECs (Figure 6C).
4. Discussion
There is an urgent need to understand the mechanisms and identify oncogenic drivers underlying the progression of IECs to improve treatment options. Due to the rarity of these tumors, limited research has been done; consequently, these patients continue to rely on surgery as the most effective treatment option, resulting in neurological impairment and poor outcomes.
Next-generation sequencing has dramatically reshaped oncological treatment through the identification of genetic variants that provide prognostic information, and aid in therapeutic selection, resulting in hypothesis-driven clinical trials [21]. Since the genetics of IECs were completely unexplored, we sought to apply WES on resected IECs to improve our knowledge of the mechanisms of IEC’s oncogenic transformation and identify drivers of potential clinical value.
Tumor cells induce significant molecular, cellular, and physical changes in their surrounding tumor microenvironment (TME) to actively promote tumor development and progression [123]. The pathway enrichment analysis of the altered gene set identified in IECs revealed a strong association with the MHC complex. The pathway enrichment indicated involvement in antigen processing and presentation, ECM-receptor, focal adhesion, as well as PI3K-Akt-mTOR signaling. ECM components and the PI3K-Akt-mTOR signaling pathway play crucial roles in cell proliferation, adhesion, invasion, and migration [43,44]. Given that the TME comprises blood vessels, extracellular matrix, stromal and immune cells [123,124], our results indicate that genetic alterations in immune, ECM-receptor and adhesion genes may have a role in shaping the TME of intracranial epidermoid cysts.
IECs were characterized by an altered immune repertoire. The immune cells of the TME are the ones involved in the acquisition of immune escape mechanisms for tumor progression and development [123,124]. Tumor cells with stronger immunogenicity can be recognized and eliminated by the immune system, while some others can escape from it by several mechanisms and then develop into cancers [125]. Somatic mutations in immune genes affected 100% of the cohort, strongly indicating the involvement of a mechanism of immune evasion. Top altered immune-related genes included HLA and KIR genes. HLA class I-specific killer-cell immunoglobulin-like receptors (KIR) play a crucial role in regulating natural killer (NK) cell function in the elimination of malignancies. Alterations in the HLA expression patterns and/or changes in NK receptor modulation on effector cells can lead to an altered immune response, either enhancing or inhibiting antitumor cytolytic activity [125,126]. The relevance of KIR and HLA ligand gene background in the occurrence and outcome of certain tumors has been documented [127,128,129]. The high mutation burden observed in HLA and KIR genes suggests that these genes may be involved in mechanisms of immune evasion in IECs. Interestingly, Kulkarni et al. demonstrated that mice lacking the IL-1 receptor (IL-1R) (IL1r−/−) or deficient in IL1-β developed immunosuppression and multiple epidermal cysts after chronic UVB [24], suggesting that induced somatic events and an altered innate immune response may be involved in the initiation of epidermoid cysts, strongly corroborating our findings.
To identify potential oncogenic drivers of IECs, we focused on the most altered genes identified in the cohort, resulting in a set of 33 driver candidates. Our literature review revealed that except PRB1, all other candidate drivers have previously been associated with cancer immune infiltration, TME, and/or endoplasmic reticulum (ER) stress, thereby supporting their role as oncogenic drivers in IECs.
Interestingly, many genes on the list of potential driver candidates have been implicated in SCC and melanoma. This may be related to the presence of epidermoid inclusions which consists of ectodermal and stratified squamous epithelial tissue embedded in connective tissue with keratin accumulation on the epithelium [12]. The transformation of IECs into malignant SCC [18] and melanoma [17] has been described. Targeting these overlapping genes could be a promising strategy to potentially block the malignant transformation of IECs.
Recurrent mutations in NOTCH2 and USP8 were identified in IECs, affecting 50% of the cohort. The most frequent alterations included USP8 p.R657W and NOTCH2 p.Q677P, observed in 50% and 30% of the cohort, respectively. Both USP8 and NOTCH2 are frequently overexpressed in human cancers [104,105,110,111]. Consistently, mutations on these genes confer upregulated protein functionality [112,113]. These observations suggest that the USP8 and NOTCH2 variants identified in IECs may enhance protein function, making them potential candidates for targeted therapy.
The missense p.Q677P in NOTCH2 is positioned in the EGF-like calcium-binding domain of the protein. The USP8 p.R657W is adjacent to the 14-3-3 binding motif (RSYSS). Somatic activating mutations in USP8 located between the amino acids 713 and 720 have been identified in (ACTH)-secreting neuroendocrine tumors. In ACTH pituitary adenomas, USP8 mutations are also positioned within or in close proximity to the 14-3-3 binding motif (RSYSS). Characterization of USP8 mutations in neuroendocrine tumors has shown that they promote oncogenic transformation through the activation of EGF receptor signaling [112]. Together, these observations suggest that alteration in USP8 and NOTCH2 may result in downstream dysregulation of EGF receptor signaling in IECs. Interestingly, aberrant interactions between EGF and ECM receptors result in the downstream activation of the PI3K-Akt-mTOR cascade [43]. Inhibition of USP8, NOTCH2, or EGFR deserved further investigation.
Many challenges are involved in drug development for IECs and other rare tumors, including a limited understanding of the tumor pathophysiology, molecular characteristics, and natural history. Additionally, there is a lack of timely access to molecular testing to determine eligibility for targeted therapies and difficulties enrolling sufficient patients for clinical trials. FDA-approved drugs for new indications may promote the development of safe and effective therapeutic approaches for these patients [22].
We conducted a drug-gene interaction analysis to generate hypotheses regarding how the potential driver candidates for IECs could be therapeutically targeted. The PTEN family category included the TPTE gene. Variants in TPTE were observed in 70% of the cohort. Given that the pathway enrichment analysis indicated significant involvement of PI3K-Akt-mTOR and ECM pathways, current inhibitors targeting PI3K, AKT, mTORC1/mTORC2, and PDK1 may be interesting drug candidates for therapeutic intervention of IECs.
NOTCH2 was highlighted as a clinically relevant target for IECs. Notch regulates both cancer cells and cancer stem cells as well as many components of the TME, including immune cells, fibroblasts, endothelial, and mesenchymal cells, cooperating with multiple signaling cascades to exercise its functions [114]. The analysis of the relationship between oncogenic drivers and altered signaling pathways in IECs provided evidence of crosstalk among focal adhesion, EGF, MHC, and antigen processing signaling where NOTCH signaling may contribute to tumor immune evasion. These observations highlight potential pathway nodes that could be targeted separately or in combination to tailor therapies for IECs.
Finally, given the high genomic instability observed in deubiquitinases and the indication of tumor immune evasion mechanisms also observed at the copy-number level, proteasome inhibitors and immunotherapy may also represent interesting treatment options.
We acknowledge the limitations of our study. IECs are considered uncommon tumors, and our experimental design, which involved samples from a cohort of six patients, may be subject to bias due to the small sample size. We also acknowledge that combining newly diagnosed IECs with cases of recurrence (sample 4316) and progression (sample H766) might induce a bias in the results. These limitations also complicate the correlation of molecular findings with clinical data, making it challenging to identify potential biomarker candidates. Furthermore, experimental validation is difficult due to the lack of suitable in vitro or in vivo models. Despite these challenges, molecular information on IECs remains scarce, and the relationship between immune system modulation and tumorigenesis in IECs has not been well characterized. The genetic data presented here highlight potential driver candidates that could be targeted with existing drugs and contribute to a better understanding of the molecular mechanisms underlying IEC oncogenesis. Further investigation is needed to elucidate how these mutations may induce changes in the surrounding non-tumor immune cells of the TME, contributing to tumor immune escape mechanisms. However, the highly reproducible somatic patterns of an altered immune repertoire, along with the crosstalk between PI3K-Akt-mTOR and ECM signaling, provide strong evidence of an immune escape mechanism in IECs, in which NOTCH2 may play a role. This mechanism may be influenced by similar underlying molecular factors across most patients, highlighting new opportunities to reverse tumor immune escape and progression. Additionally, variations in NOTCH2 and USP8 could pave the way for novel investigations and the development of tailored approaches to treat IECs.
5. Conclusions
We investigated the somatic landscape of IECs to gain insights into tumor biology and identify potential drivers for targeted therapies. While surgery remains the most effective treatment for these patients, our findings highlight key altered genes associated with the immune system and TME, suggesting mechanisms of immune evasion. Notably, frequent amplifications in deubiquitinases and beta-defensins further emphasize the role of immune mechanisms in oncogenic transformation. We also identified recurrent and deleterious alterations in NOTCH2 and USP8, which may be clinically relevant drivers of IECs. Finally, we provide evidence that the crosstalk between PI3K-Akt-mTOR and ECM signaling may have an important function in modulating the immune escape mechanism in IECs, in which NOTCH2 may play a crucial role.
Supplementary Materials
The following supporting information can be downloaded at: https://www.mdpi.com/article/10.3390/cancers16203487/s1. Figure S1: Mutation hotspots in IECs; Figure S2: Summary of somatic copy-number alterations in IECs; Table S1: Clinical features; Table S2: Software and databases; Table S3: IEC variants; Table S4: GO analysis; Table S5: KEGG pathway enrichment; Table S6: WikiPathway enrichment; Table S7: Reactome pathway enrichment; Table S8: Driver Candidates; Table S9: Protein-protein Interaction Networks; Table S10: Copy Number Variation with CNVKit; Table S11: GISTIC Summaries.
Author Contributions
Conceptualization, M.F.J.; methodology, M.F.J., C.A.P. and S.K.; software, C.A.P.; formal analysis, S.K., O.P. and C.A.P.; investigation, S.K., O.P. and C.A.P.; resources, M.F.J.; data curation, C.A.P. and O.P.; writing—original draft preparation, S.K. and C.A.P.; writing—review and editing, C.A.P.; visualization, S.K. and C.A.P.; supervision, C.A.P. and M.F.J.; project administration, C.A.P.; funding acquisition, M.F.J. All authors have read and agreed to the published version of the manuscript.
Funding
This research was funded by Kuni Foundation in support of the project “Discovery Omics for Targeted Treatment of Orphan Brain Cancers”, grant number A163217 and University of Washington Brain Tumor Research Fund in support of the “Tumor Bank to Investigate the Biological and Clinical Behavior of Human Brain Tumors”.
Institutional Review Board Statement
The study was conducted in accordance with the Declaration of Helsinki and approved by the Institutional Review Board of the University of Washington (STUDY R00002162, date of approval: 20 May 2019).
Informed Consent Statement
Informed consent was obtained from all subjects involved in the study.
Data Availability Statement
The original data presented in the study are openly available in the NCBI’s Sequence Read Archive (SRA).
Acknowledgments
We acknowledge the participants of this study and respective families for sample donation. We acknowledge the Kuni Foundation for the financial support.
Conflicts of Interest
The authors declare no conflicts of interest.
References
- Tytus, J.S.; Pennybacker, J. Pearly tumours in relation to the central nervous system. J. Neurol. Neurosurg. Psychiatry 1956, 19, 241–259. [Google Scholar] [CrossRef] [PubMed]
- Yamakawa, K.; Shitara, N.; Genka, S.; Manaka, S.; Takakura, K. Clinical Course and Surgical Prognosis of 33 Cases of Intracranial Epidermoid Tumors. Neurosurgery 1989, 24, 568–573. [Google Scholar] [CrossRef] [PubMed]
- Iaconetta, G.; Carvalho, G.A.; Vorkapic, P.; Samii, M. Intracerebral Epidermoid Tumor: A Case Report and Review of the Literature. Surg. Neurol. 2001, 55, 218–222. [Google Scholar] [CrossRef] [PubMed]
- Braun, I.F.; Naidich, T.P.; Leeds, N.E.; Koslow, M.; Zimmerman, H.M.; Chase, N.E. Dense Intracranial Epidermoid Tumors. Radiology 1977, 122, 717–719. [Google Scholar] [CrossRef] [PubMed]
- Vinchon, M.; Lejeune, J.P.; Krivosic, I.; Assaker, R.; Pruvo, J.P.; Christiaens, J.L. Cranio-cerebral dermoid and epidermoid cysts. Classification and pathogenesis. Neurochirurgie 1995, 41, 29–37. [Google Scholar]
- Mohanty, S.; Bhattacharya, R.N.; Tandon, S.C.; Shukla, P.K. Intracerebral cystic epidermoid. Acta Neurochir. 1981, 57, 107–113. [Google Scholar] [CrossRef]
- Obana, W.G.; Wilson, C.B. Epidermoid cysts of the brain stem. J. Neurosurg. 1991, 74, 123–128. [Google Scholar] [CrossRef]
- Fournier, D.; Mercier, P.; Menei, P.; Pouplard, F.; Rizk, T.; Guy, G. Recurrent intrinsic brain stem epidermoid cyst. Child’s Nerv. Syst. 1992, 8, 471–474. [Google Scholar] [CrossRef]
- Weaver, E.N.; Coulon, R.A. Excision of a brain-stem epidermoid cyst. J. Neurosurg. 1979, 51, 254–257. [Google Scholar] [CrossRef]
- Pereira, R.G.; de Ribeiro, B.N.F.; de Hollanda, R.T.L.; de Almeida, L.B.; Simeão, T.B.; Marchiori, E. Non-neoplastic intracranial cystic lesions: Not everything is an arachnoid cyst. Radiol. Bras. 2021, 54, 49–55. [Google Scholar] [CrossRef]
- Ziyal, I.M.; Bilginer, B.; Bozkurt, G.; Çataltepe, O.; Tezel, G.G.; Akalan, N. Epidermoid cyst of the brain stem symptomatic in childhood. Child’s Nerv. Syst. 2005, 21, 1025–1029. [Google Scholar] [CrossRef] [PubMed]
- Ulrich, J. Intracranial Epidermoids. J. Neurosurg. 1964, 21, 1051–1058. [Google Scholar] [CrossRef] [PubMed]
- Alvord, E.C. Growth rates of epidermoid tumors. Ann. Neurol. 1977, 2, 367–370. [Google Scholar] [CrossRef] [PubMed]
- Bayindir, C.; Balak, N.; Karasu, A. Micro-invasive squamous cell carcinoma arising in a pre-existing intraventricular epidermoid cyst. Acta Neurochir. 1996, 138, 1008–1012. [Google Scholar] [CrossRef] [PubMed]
- Michenet, P.; Vital, C.; Rivel, J.; Lebail, B.; Riemens, V. Malignant transformation of an intracranial epidermoid cyst. Ann. Pathol. 1989, 9, 360–362. [Google Scholar]
- Uchino, A.; Hasuo, K.; Matsumoto, S.; Uda, K.; Moriguchi, M.; Nishio, T.; Fukui, M.; Masuda, K. Intracranial epidermoid carcinoma: CT and MRI. Neuroradiology 1995, 37, 155–158. [Google Scholar] [CrossRef]
- Vajtai, I.; Tassi, D.; Varga, Z.; Tarjányi, J.; Vörös, E. Malignant melanoma evolving inside a cerebral epidermoid cyst. Orv. Hetil. 1995, 136, 1171–1174. [Google Scholar]
- Cuoco, J.A.; Rogers, C.M.; Busch, C.M.; Apfel, L.S.; Entwistle, J.J.; Marvin, E.A. Intracranial Squamous Cell Carcinoma Arising From a Cerebellopontine Angle Epidermoid Cyst Remnant Four Decades After Partial Resection. Front. Oncol. 2019, 9, 694. [Google Scholar] [CrossRef]
- Hasegawa, H.; Vakharia, K.; Carlstrom, L.P.; Van Gompel, J.J.; Driscoll, C.L.W.; Carlson, M.L.; Meyer, F.B.; Link, M.J. Long-term surgical outcomes of intracranial epidermoid tumors: Impact of extent of resection on recurrence and functional outcomes in 63 patients. J. Neurosurg. 2022, 136, 1592–1600. [Google Scholar] [CrossRef]
- Gopalakrishnan, C.V.; Ansari, K.A.; Nair, S.; Menon, G. Long term outcome in surgically treated posterior fossa epidermoids. Clin. Neurol. Neurosurg. 2014, 117, 93–99. [Google Scholar] [CrossRef]
- Dienstmann, R.; Rodon, J.; Barretina, J.; Tabernero, J. Genomic medicine frontier in human solid tumors: Prospects and challenges. J. Clin. Oncol. 2013, 31, 1874–1884. [Google Scholar] [CrossRef] [PubMed]
- Li, Y.Y.; Jones, S.J. Drug repositioning for personalized medicine. Genome Med. 2012, 4, 27. [Google Scholar] [CrossRef] [PubMed]
- Kubo, M.; Yamane, M.; Miyatani, K.; Udaka, T.; Mizuta, M.; Shirakawa, K. Familial Epidermoid Cysts of the Spleen: Report of Two Cases. Surg. Today 2006, 36, 853–856. [Google Scholar] [CrossRef] [PubMed]
- Kulkarni, N.N.; Adase, C.A.; Zhang, L.-J.; Borkowski, A.W.; Li, F.; Sanford, J.A.; Coleman, D.J.; Aguilera, C.; Indra, A.K.; Gallo, R.L. IL-1 Receptor–Knockout Mice Develop Epidermal Cysts and Show an Altered Innate Immune Response after Exposure to UVB Radiation. J. Investig. Dermatol. 2017, 137, 2417–2426. [Google Scholar] [CrossRef] [PubMed]
- Bolger, A.M.; Lohse, M.; Usadel, B. Trimmomatic: A flexible trimmer for Illumina sequence data. Bioinformatics 2014, 30, 2114–2120. [Google Scholar] [CrossRef]
- Karolchik, D.; Hinrichs, A.S.; Kent, W.J. The UCSC Genome Browser. Curr. Protoc. Bioinform. 2009, 28, Unit1.4. [Google Scholar] [CrossRef]
- Li, H.; Durbin, R. Fast and accurate short read alignment with Burrows—Wheeler transform. Bioinformatics 2009, 25, 1754–1760. [Google Scholar] [CrossRef]
- Koboldt, D.C.; Chen, K.; Wylie, T.; Larson, D.E.; McLellan, M.D.; Mardis, E.R.; Weinstock, G.M.; Wilson, R.K.; Ding, L. VarScan: Variant detection in massively parallel sequencing of individual and pooled samples. Bioinformatics 2009, 25, 2283–2285. [Google Scholar] [CrossRef]
- Lai, Z.; Markovets, A.; Ahdesmaki, M.; Chapman, B.; Hofmann, O.; McEwen, R.; Johnson, J.; Dougherty, B.; Barrett, J.C.; Dry, J.R. VarDict: A novel and versatile variant caller for next-generation sequencing in cancer research. Nucleic Acids Res. 2016, 44, e108. [Google Scholar] [CrossRef]
- Kim, S.; Scheffler, K.; Halpern, A.L.; Bekritsky, M.A.; Noh, E.; Källberg, M.; Chen, X.; Kim, Y.; Beyter, D.; Krusche, P.; et al. Strelka2: Fast and accurate calling of germline and somatic variants. Nat. Methods 2018, 15, 591–594. [Google Scholar] [CrossRef]
- Liu, Z.-K.; Shang, Y.-K.; Chen, Z.-N.; Bian, H. A three-caller pipeline for variant analysis of cancer whole-exome sequencing data. Mol. Med. Rep. 2017, 15, 2489–2494. [Google Scholar] [CrossRef] [PubMed]
- Wang, K.; Li, M.; Hakonarson, H. ANNOVAR: Functional annotation of genetic variants from high-throughput sequencing data. Nucleic Acids Res. 2010, 38, e164. [Google Scholar] [CrossRef] [PubMed]
- Talevich, E.; Shain, A.H.; Botton, T.; Bastian, B.C. CNVkit: Genome-Wide Copy Number Detection and Visualization from Targeted DNA Sequencing. PLoS Comput. Biol. 2016, 12, 1004873. [Google Scholar] [CrossRef] [PubMed]
- Mermel, C.H.; Schumacher, S.E.; Hill, B.; Meyerson, M.L.; Beroukhim, R.; Getz, G. GISTIC2.0 facilitates sensitive and confident localization of the targets of focal somatic copy-number alteration in human cancers. Genome Biol. 2011, 12, R41. [Google Scholar] [CrossRef] [PubMed]
- Wu, T.; Hu, E.; Xu, S.; Chen, M.; Guo, P.; Dai, Z.; Feng, T.; Zhou, L.; Tang, W.; Zhan, L.; et al. clusterProfiler 4.0: A universal enrichment tool for interpreting omics data. Innovation 2021, 2, 100141. [Google Scholar] [CrossRef] [PubMed]
- Kuleshov, M.V.; Jones, M.R.; Rouillard, A.D.; Fernandez, N.F.; Duan, Q.; Wang, Z.; Koplev, S.; Jenkins, S.L.; Jagodnik, K.M.; Lachmann, A.; et al. Enrichr: A comprehensive gene set enrichment analysis web server 2016 update. Nucleic Acids Res. 2016, 44, W90–W97. [Google Scholar] [CrossRef] [PubMed]
- The Gene Ontology Consortium; A Aleksander, S.; Balhoff, J.; Carbon, S.; Cherry, J.M.; Drabkin, H.J.; Ebert, D.; Feuermann, M.; Gaudet, P.; Harris, N.L.; et al. The Gene Ontology knowledgebase in 2023. Genetics 2023, 224, iyad031. [Google Scholar] [CrossRef]
- Kanehisa, M.; Furumichi, M.; Sato, Y.; Kawashima, M.; Ishiguro-Watanabe, M. KEGG for taxonomy-based analysis of pathways and genomes. Nucleic Acids Res. 2023, 51, D587–D592. [Google Scholar] [CrossRef]
- Croft, D.; O’Kelly, G.; Wu, G.; Haw, R.; Gillespie, M.; Matthews, L.; Caudy, M.; Garapati, P.; Gopinath, G.; Jassal, B.; et al. Reactome: A database of reactions, pathways and biological processes. Nucleic Acids Res. 2011, 39, D691–D697. [Google Scholar] [CrossRef]
- Agrawal, A.; Balcı, H.; Hanspers, K.; Coort, S.L.; Martens, M.; Slenter, D.N.; Ehrhart, F.; Digles, D.; Waagmeester, A.; Wassink, I.; et al. WikiPathways 2024: Next generation pathway database. Nucleic Acids Res. 2024, 52, D679–D689. [Google Scholar] [CrossRef]
- Mayakonda, A.; Lin, D.-C.; Assenov, Y.; Plass, C.; Koeffler, H.P. Maftools: Efficient and comprehensive analysis of somatic variants in cancer. Genome Res. 2018, 28, 1747–1756. [Google Scholar] [CrossRef] [PubMed]
- Lawrence, M.S.; Stojanov, P.; Mermel, C.H.; Robinson, J.T.; Garraway, L.A.; Golub, T.R.; Meyerson, M.; Gabriel, S.B.; Lander, E.S.; Getz, G. Discovery and saturation analysis of cancer genes across 21 tumour types. Nature 2014, 505, 495–501. [Google Scholar] [CrossRef] [PubMed]
- He, Y.; Sun, M.M.; Zhang, G.G.; Yang, J.; Chen, K.S.; Xu, W.W.; Li, B. Targeting PI3K/Akt signal transduction for cancer therapy. Signal Transduct. Target. Ther. 2021, 6, 425. [Google Scholar] [CrossRef]
- Hassanein, S.S.; Abdel-Mawgood, A.L.; Ibrahim, S.A. EGFR-Dependent Extracellular Matrix Protein Interactions Might Light a Candle in Cell Behavior of Non-Small Cell Lung Cancer. Front. Oncol. 2021, 11, 766659. [Google Scholar] [CrossRef] [PubMed]
- Gkouveris, I.; Nikitakis, N.G.; Aseervatham, J.; Ogbureke, K.U.E. The tumorigenic role of DSPP and its potential regulation of the unfolded protein response and ER stress in oral cancer cells. Int. J. Oncol. 2018, 53, 1743–1751. [Google Scholar] [CrossRef] [PubMed]
- Aseervatham, J.; Ogbureke, K.U.E. Effects of DSPP and MMP20 Silencing on Adhesion, Metastasis, Angiogenesis, and Epithelial-Mesenchymal Transition Proteins in Oral Squamous Cell Carcinoma Cells. Int. J. Mol. Sci. 2020, 21, 4734. [Google Scholar] [CrossRef]
- Zhuang, Q.; Shen, A.; Liu, L.; Wu, M.; Shen, Z.; Liu, H.; Cheng, Y.; Lin, X.; Wu, X.; Lin, W.; et al. Prognostic and immunological roles of Fc fragment of IgG binding protein in colorectal cancer. Oncol. Lett. 2021, 22, 526. [Google Scholar] [CrossRef]
- Yan, T.; Tian, D.; Chen, J.; Tan, Y.; Cheng, Y.; Ye, L.; Deng, G.; Liu, B.; Yuan, F.; Zhang, S.; et al. FCGBP Is a Prognostic Biomarker and Associated With Immune Infiltration in Glioma. Front. Oncol. 2021, 11, 769033. [Google Scholar] [CrossRef]
- Ding, Q.; Lin, F.; Huang, Z.; Li, Y.; Cai, S.; Chen, X.; Liu, H.; Qiu, S. Non-coding RNA-related FCGBP downregulation in head and neck squamous cell carcinoma: A novel biomarker for predicting paclitaxel resistance and immunosuppressive microenvironment. Sci. Rep. 2024, 14, 4426. [Google Scholar] [CrossRef]
- Yamada, K.; Ono, M.; Perkins, N.D.; Rocha, S.; Lamond, A.I. Identification and functional characterization of FMN2, a regulator of the cyclin-dependent kinase inhibitor p21. Mol. Cell 2013, 49, 922–933. [Google Scholar] [CrossRef]
- Zhang, X.; Wu, J.; Luo, S.; Lechler, T.; Zhang, J.Y. FRA1 promotes squamous cell carcinoma growth and metastasis through distinct AKT and c-Jun dependent mechanisms. Oncotarget 2016, 7, 34371–34383. [Google Scholar] [CrossRef] [PubMed]
- Fentiman, I.S. Gamma-glutamyl transferase: Risk and prognosis of cancer. Br. J. Cancer 2012, 106, 1467–1468. [Google Scholar] [CrossRef] [PubMed]
- Hong, S.W.; Lee, H.J.; Han, K.; Moon, J.M.; Park, S.; Soh, H.; Kang, E.A.; Chun, J.; Im, J.P.; Kim, J.S. Risk of gastrointestinal cancer in patients with an elevated level of gamma-glutamyltransferase: A nationwide population-based study. PLoS ONE 2021, 16, e0245052. [Google Scholar] [CrossRef] [PubMed]
- Winter, J.; Lenders, M.M.; Gassenmaier, M.; Forschner, A.; Leiter, U.; Weide, B.; Purde, M.-T.; Flatz, L.; Cozzio, A.; Röcken, M.; et al. Prognostic role of gamma-glutamyl transferase in metastatic melanoma patients treated with immune checkpoint inhibitors. Cancer Immunol. Immunother. 2021, 70, 1089–1099. [Google Scholar] [CrossRef]
- Allocati, N.; Masulli, M.; Di Ilio, C.; Federici, L. Glutathione transferases: Substrates, inihibitors and pro-drugs in cancer and neurodegenerative diseases. Oncogenesis 2018, 7, 8. [Google Scholar] [CrossRef]
- Ye, Z.; Song, H. Glutathione s-transferase polymorphisms (GSTM1, GSTP1 and GSTT1) and the risk of acute leukaemia: A systematic review and meta-analysis. Eur. J. Cancer 2005, 41, 980–989. [Google Scholar] [CrossRef]
- Cullen, K.J.; A Newkirk, K.; Schumaker, L.M.; Aldosari, N.; Rone, J.D.; Haddad, B.R. Glutathione S-transferase pi amplification is associated with cisplatin resistance in head and neck squamous cell carcinoma cell lines and primary tumors. Cancer Res. 2003, 63, 8097–8102. [Google Scholar]
- Mock, D.; Whitestone, B.; Freeman, J. Gamma-glutamyl transpeptidase activity in human oral squamous cell carcinoma. Oral Surg. Oral Med. Oral Pathol. 1987, 64, 197–201. [Google Scholar] [CrossRef]
- Noblejas-López, M.d.M.; Nieto-Jiménez, C.; García, S.M.; Pérez-Peña, J.; Nuncia-Cantarero, M.; Andrés-Pretel, F.; Galán-Moya, E.M.; Amir, E.; Pandiella, A.; Győrffy, B.; et al. Expression of MHC class I, HLA-A and HLA-B identifies immune-activated breast tumors with favorable outcome. OncoImmunology 2019, 8, e1629780. [Google Scholar] [CrossRef]
- Michelakos, T.; Kontos, F.; Kurokawa, T.; Cai, L.; Sadagopan, A.; Krijgsman, D.; Weichert, W.; Durrant, L.G.; Kuppen, P.J.K.; Ferrone, C.R.; et al. Differential role of HLA-A and HLA-B, C expression levels as prognostic markers in colon and rectal cancer. J. Immunother. Cancer 2022, 10, e004115. [Google Scholar] [CrossRef]
- Dyckhoff, G.; Herold-Mende, C.; Scherer, S.; Plinkert, P.K.; Warta, R. Human Leucocyte Antigens as Prognostic Markers in Head and Neck Squamous Cell Carcinoma. Cancers 2022, 14, 3828. [Google Scholar] [CrossRef] [PubMed]
- Griffioen, M.; Ouwerkerk, I.J.M.; Harten, V.; Schrier, P.I. HLA-B down-regulation in human melanoma is mediated by sequences located downstream of the transcription-initiation site. Int. J. Cancer 1999, 80, 573–580. [Google Scholar] [CrossRef]
- Deng, H.; Chen, Y.; Wang, J.; An, R. HLA-DRB1: A new potential prognostic factor and therapeutic target of cutaneous melanoma and an indicator of tumor microenvironment remodeling. PLoS ONE 2022, 17, e0274897. [Google Scholar] [CrossRef] [PubMed]
- Lester, D.K.; Burton, C.; Gardner, A.; Innamarato, P.; Kodumudi, K.; Liu, Q.; Adhikari, E.; Ming, Q.; Williamson, D.B.; Frederick, D.T.; et al. Fucosylation of HLA-DRB1 regulates CD4+ T cell-mediated anti-melanoma immunity and enhances immunotherapy efficacy. Nat. Cancer 2023, 4, 222–239. [Google Scholar] [CrossRef] [PubMed]
- Senosain, M.-F.; Zou, Y.; Novitskaya, T.; Vasiukov, G.; Balar, A.B.; Rowe, D.J.; Doxie, D.B.; Lehman, J.M.; Eisenberg, R.; Maldonado, F.; et al. HLA-DR cancer cells expression correlates with T cell infiltration and is enriched in lung adenocarcinoma with indolent behavior. Sci. Rep. 2021, 11, 14424. [Google Scholar] [CrossRef]
- Amrane, K.; Le Meur, C.; Besse, B.; Hemon, P.; Le Noac’h, P.; Pradier, O.; Berthou, C.; Abgral, R.; Uguen, A. HLA-DR expression in melanoma: From misleading therapeutic target to potential immunotherapy biomarker. Front. Immunol. 2023, 14, 1285895. [Google Scholar] [CrossRef]
- Heng, Y.; Zhu, X.; Wu, Q.; Lin, H.; Ding, X.; Tao, L.; Lu, L. High Expression of Tumor HLA-DR Predicts Better Prognosis and Response to Anti-PD-1 Therapy in Laryngeal Squamous Cell Carcinoma. Transl. Oncol. 2023, 33, 101678. [Google Scholar] [CrossRef]
- Ma, Q.; Geng, K.; Xiao, P.; Zeng, L. Identification and Prognostic Value Exploration of Radiotherapy Sensitivity-Associated Genes in Non-Small-Cell Lung Cancer. BioMed Res. Int. 2021, 2021, 5963868. [Google Scholar] [CrossRef]
- Verma, S.P.; Das, P. Novel splicing in IGFN1 intron 15 and role of stable G-quadruplex in the regulation of splicing in renal cell carcinoma. PLoS ONE 2018, 13, e0205660. [Google Scholar] [CrossRef]
- Hoffman, M.; Gillmor, A.H.; Kunz, D.J.; Johnston, M.J.; Nikolic, A.; Narta, K.; Zarrei, M.; King, J.; Ellestad, K.; Dang, N.H.; et al. Intratumoral Genetic and Functional Heterogeneity in Pediatric Glioblastoma. Cancer Res. 2019, 79, 2111–2123. [Google Scholar] [CrossRef]
- Lee, I.; Lee, S.-J.; Kang, T.M.; Kang, W.K.; Park, C. Unconventional role of the inwardly rectifying potassium channel Kir2.2 as a constitutive activator of RelA in cancer. Cancer Res. 2013, 73, 1056–1062. [Google Scholar] [CrossRef] [PubMed]
- Khalilipour, N.; Baranova, A.; Jebelli, A.; Heravi-Moussavi, A.; Bruskin, S.; Abbaszadegan, M.R. Familial Esophageal Squamous Cell Carcinoma with damaging rare/germline mutations in KCNJ12/KCNJ18 and GPRIN2 genes. Cancer Genet. 2018, 221, 46–52. [Google Scholar] [CrossRef] [PubMed]
- Choi, H.; Baek, I.-C.; A Park, S.; Park, J.-S.; Jeun, S.-S.; Kim, T.-G.; Ahn, S. Polymorphisms of Killer Ig-like Receptors and the Risk of Glioblastoma. J. Clin. Med. 2023, 12, 4780. [Google Scholar] [CrossRef] [PubMed]
- Liu, X.; Zuo, F.; Song, J.; Tang, L.; Wang, X.; Liu, X.; Zhang, H.; Yang, Z.; Jing, J.; Ma, X.; et al. Immune checkpoints HLA-E:CD94-NKG2A and HLA-C:KIR2DL1 complementarily shield circulating tumor cells from NK-mediated immune surveillance. Cell Discov. 2024, 10, 16. [Google Scholar] [CrossRef] [PubMed]
- Zou, R.; Zhong, X.; Liang, K.; Zhi, C.; Chen, D.; Xu, Z.; Zhang, J.; Liao, D.; Lai, M.; Weng, Y.; et al. Elevated LILRB1 expression predicts poor prognosis and is associated with tumor immune infiltration in patients with glioma. BMC Cancer 2023, 23, 403. [Google Scholar] [CrossRef]
- Zeller, T.; Münnich, I.A.; Windisch, R.; Hilger, P.; Schewe, D.M.; Humpe, A.; Kellner, C. Perspectives of targeting LILRB1 in innate and adaptive immune checkpoint therapy of cancer. Front. Immunol. 2023, 14, 1240275. [Google Scholar] [CrossRef]
- Xian, M.; Wang, Q.; Xiao, L.; Zhong, L.; Xiong, W.; Ye, L.; Su, P.; Zhang, C.; Li, Y.; Orlowski, R.Z.; et al. Leukocyte immunoglobulin-like receptor B1 (LILRB1) protects human multiple myeloma cells from ferroptosis by maintaining cholesterol homeostasis. Nat. Commun. 2024, 15, 5767. [Google Scholar] [CrossRef]
- Utsunomiya, T.; Inoue, H.; Tanaka, F.; Yamaguchi, H.; Ohta, M.; Okamoto, M.; Mimori, K.; Mori, M. Expression of cancer-testis antigen (CTA) genes in intrahepatic cholangiocarcinoma. Ann. Surg. Oncol. 2004, 11, 934–940. [Google Scholar] [CrossRef]
- Peng, J.-R.; Chen, H.-S.; Mou, D.-C.; Cao, J.; Cong, X.; Qin, L.-L.; Wei, L.; Leng, X.-S.; Wang, Y.; Chen, W.-F. Expression of cancer/testis (CT) antigens in Chinese hepatocellular carcinoma and its correlation with clinical parameters. Cancer Lett. 2005, 219, 223–232. [Google Scholar] [CrossRef]
- Jin, X.; Zhu, L.; Xiao, S.; Cui, Z.; Tang, J.; Yu, J.; Xie, M. MST1 inhibits the progression of breast cancer by regulating the Hippo signaling pathway and may serve as a prognostic biomarker. Mol. Med. Rep. 2021, 23, 1–12. [Google Scholar] [CrossRef]
- Hayashi, Y.; Osanai, M.; Lee, G.-H. NOTCH2 signaling confers immature morphology and aggressiveness in human hepatocellular carcinoma cells. Oncol. Rep. 2015, 34, 1650–1658. [Google Scholar] [CrossRef] [PubMed]
- Dai, K.; Huang, L.; Huang, Y.-B.; Chen, Z.-B.; Yang, L.-H.; Jiang, Y.-A. 1810011o10 Rik Inhibits the Antitumor Effect of Intratumoral CD8+ T Cells through Suppression of Notch2 Pathway in a Murine Hepatocellular Carcinoma Model. Front. Immunol. 2017, 8, 320. [Google Scholar] [CrossRef] [PubMed]
- Demitrack, E.S.; Samuelson, L.C. Notch as a Driver of Gastric Epithelial Cell Proliferation. Cell. Mol. Gastroenterol. Hepatol. 2017, 3, 323–330. [Google Scholar] [CrossRef] [PubMed]
- Gan, R.-H.; Lin, L.-S.; Zheng, D.-P.; Zhao, Y.; Ding, L.-C.; Lu, Y.-G. High expression of Notch2 drives tongue squamous cell carcinoma carcinogenesis. Exp. Cell Res. 2020, 399, 112452. [Google Scholar] [CrossRef] [PubMed]
- Mikheil, D.; Prabhakar, K.; Ng, T.L.; Teertam, S.; Longley, B.J.; Newton, M.A.; Setaluri, V. Notch Signaling Suppresses Melanoma Tumor Development in BRAF/Pten Mice. Cancers 2023, 15, 519. [Google Scholar] [CrossRef]
- Kren, N.P.; Zagon, I.S.; McLaughlin, P.J. Mutations in the opioid growth factor receptor in human cancers alter receptor function. Int. J. Mol. Med. 2015, 36, 289–293. [Google Scholar] [CrossRef]
- Qu, N.; Wang, X.; Meng, Y.; Shan, F. Prospective oncotarget for gynecological cancer: Opioid growth factor (OGF)—Opioid growth factor receptor (OGFr) axis. Int. Immunopharmacol. 2019, 75, 105723. [Google Scholar] [CrossRef]
- McLaughlin, P.J.; Zagon, I.S. Progression of squamous cell carcinoma of the head and neck is associated with down-regulation of the opioid growth factor receptor. Int. J. Oncol. 2006, 28, 1577–1583. [Google Scholar] [CrossRef]
- Maßberg, D.; Simon, A.; Häussinger, D.; Keitel, V.; Gisselmann, G.; Conrad, H.; Hatt, H. Monoterpene (−)-citronellal affects hepatocarcinoma cell signaling via an olfactory receptor. Arch. Biochem. Biophys. 2015, 566, 100–109. [Google Scholar] [CrossRef]
- Weber, L.; Maßberg, D.; Becker, C.; Altmüller, J.; Ubrig, B.; Bonatz, G.; Wölk, G.; Philippou, S.; Tannapfel, A.; Hatt, H.; et al. Olfactory Receptors as Biomarkers in Human Breast Carcinoma Tissues. Front. Oncol. 2018, 8, 33. [Google Scholar] [CrossRef]
- Cao, Y.; Wu, S.; Gu, Y.; Wong, Y.H.; Shi, Y.; Zhang, L. Disulfidptosis-related PABPC3 promotes tumor progression and inhibits immune activity in osteosarcoma. J. Gene Med. 2024, 26, e3641. [Google Scholar] [CrossRef] [PubMed]
- Yao, W.; Yao, Y.; He, W.; Zhao, C.; Liu, D.; Wang, G.; Wang, Z. PABPC1 promotes cell proliferation and metastasis in pancreatic adenocarcinoma by regulating COL12A1 expression. Immun. Inflamm. Dis. 2023, 11, e919. [Google Scholar] [CrossRef] [PubMed]
- Brock, P.; Sevigny, M.; Liyanarachchi, S.; Comiskey, D.F.; Li, W.; Saarinen, S.; Yilmaz, A.S.; Nieminen, A.I.; Ringel, M.D.; Peltomäki, P.; et al. PDPR Gene Variants Predisposing to Papillary Thyroid Cancer. Thyroid 2024, 34, 575–582. [Google Scholar] [CrossRef] [PubMed]
- Sui, L.; Wang, S.; Ganguly, D.; El Rayes, T.P.; Askeland, C.; Børretzen, A.; Sim, D.; Halvorsen, O.J.; Knutsvik, G.; Arnes, J.; et al. PRSS2 remodels the tumor microenvironment via repression of Tsp1 to stimulate tumor growth and progression. Nat. Commun. 2022, 13, 7959. [Google Scholar] [CrossRef] [PubMed]
- Chen, Y.; Wang, B.; Zhao, Z.; Li, M.; Wang, F. PRSS2 overexpression relates to poor prognosis and promotes proliferation, migration and invasion in gastric cancer. Tissue Cell 2022, 79, 101949. [Google Scholar] [CrossRef]
- Yan, Q.; Zeng, P.; Zhou, X.; Zhao, X.; Chen, R.; Qiao, J.; Feng, L.; Zhu, Z.; Zhang, G.; Chen, C. RBMX suppresses tumorigenicity and progression of bladder cancer by interacting with the hnRNP A1 protein to regulate PKM alternative splicing. Oncogene 2021, 40, 2635–2650. [Google Scholar] [CrossRef]
- Tuersun, H.; Liu, L.; Zhang, J.; Maimaitizunong, R.; Tang, X.; Li, H. m6A reading protein RBMX as a biomarker for prognosis and tumor progression in esophageal cancer. Transl. Cancer Res. 2023, 12, 2319–2335. [Google Scholar] [CrossRef]
- Xie, M.; Wang, F.; Chen, B.; Wu, Z.; Chen, C.; Xu, J. Systematic pan-cancer analysis identifies SLC35C1 as an immunological and prognostic biomarker. Sci. Rep. 2023, 13, 5331. [Google Scholar] [CrossRef]
- Ta, H.D.K.; Xuan, D.T.M.; Tang, W.-C.; Anuraga, G.; Ni, Y.-C.; Pan, S.-R.; Wu, Y.-F.; Fitriani, F.; Hermanto, E.M.P.; Athoillah, M.; et al. Novel Insights into the Prognosis and Immunological Value of the SLC35A (Solute Carrier 35A) Family Genes in Human Breast Cancer. Biomedicines 2021, 9, 1804. [Google Scholar] [CrossRef]
- Kuemmel, A.; Simon, P.; Breitkreuz, A.; Röhlig, J.; Luxemburger, U.; Elsäßer, A.; Schmidt, L.H.; Sebastian, M.; Sahin, U.; Türeci, Ö.; et al. Humoral immune responses of lung cancer patients against the Transmembrane Phosphatase with TEnsin homology (TPTE). Lung Cancer 2015, 90, 334–341. [Google Scholar] [CrossRef]
- Zainodini, N.; Abolhasani, M.; Mohsenzadegan, M.; Farajollahi, M.M.; Rismani, E. Overexpression of Transmembrane Phosphatase with Tensin homology (TPTE) in prostate cancer is clinically significant, suggesting its potential as a valuable biomarker. J. Cancer Res. Clin. Oncol. 2024, 150, 165. [Google Scholar] [CrossRef] [PubMed]
- Chen, X.; Chen, C.; He, R.; Huang, Y.; Wang, Y. UBXN11 Predicts as a Poor Index for Colorectal Cancer and Contributes to the Tumorigenesis by Activating NF-κB Signaling. Dig. Dis. Sci. 2024, 69, 2074–2082. [Google Scholar] [CrossRef] [PubMed]
- Xie, F.; Zhou, X.; Li, H.; Su, P.; Liu, S.; Li, R.; Zou, J.; Wei, X.; Pan, C.; Zhang, Z.; et al. USP8 promotes cancer progression and extracellular vesicle-mediated CD8+ T cell exhaustion by deubiquitinating the TGF-β receptor TβRII. EMBO J. 2022, 41, e108791. [Google Scholar] [CrossRef] [PubMed]
- Xiong, W.; Gao, X.; Zhang, T.; Jiang, B.; Hu, M.-M.; Bu, X.; Gao, Y.; Zhang, L.-Z.; Xiao, B.-L.; He, C.; et al. USP8 inhibition reshapes an inflamed tumor microenvironment that potentiates the immunotherapy. Nat. Commun. 2022, 13, 1700. [Google Scholar] [CrossRef] [PubMed]
- Duan, B.; Wang, C.; Liu, Z.; Yang, X. USP8 is a Novel Therapeutic Target in Melanoma Through Regulating Receptor Tyrosine Kinase Levels. Cancer Manag. Res. 2021, 13, 4181–4189. [Google Scholar] [CrossRef] [PubMed]
- Cui, J.; Yin, Y.; Ma, Q.; Wang, G.; Olman, V.; Zhang, Y.; Chou, W.; Hong, C.S.; Zhang, C.; Cao, S.; et al. Comprehensive characterization of the genomic alterations in human gastric cancer. Int. J. Cancer 2015, 137, 86–95. [Google Scholar] [CrossRef]
- Liang, Y.; Jiang, L.; Zhong, X.; Hochwald, S.N.; Wang, Y.; Huang, L.; Nie, Q.; Huang, H.; Xu, J.-F. Discovery of Aberrant Alteration of Genome in Colorectal Cancer by Exome Sequencing. Am. J. Med. Sci. 2019, 358, 340–349. [Google Scholar] [CrossRef]
- Rentzsch, P.; Witten, D.; Cooper, G.M.; Shendure, J.; Kircher, M. CADD: Predicting the deleteriousness of variants throughout the human genome. Nucleic Acids Res. 2019, 47, D886–D894. [Google Scholar] [CrossRef]
- Féral, C.; Guellaën, G.; Pawlak, A. Human testis expresses a specific poly(A)-binding protein. Nucleic Acids Res. 2001, 29, 1872–1883. [Google Scholar] [CrossRef]
- Yan, M.; Zhao, C.; Wei, N.; Wu, X.; Cui, J.; Xing, Y. High Expression of Ubiquitin-Specific Protease 8 (USP8) Is Associated with Poor Prognosis in Patients with Cervical Squamous Cell Carcinoma. Med. Sci. Monit. 2018, 24, 4934–4943. [Google Scholar] [CrossRef]
- Sha, B.; Sun, Y.; Zhao, S.; Li, M.; Huang, W.; Li, Z.; Shi, J.; Han, X.; Li, P.; Hu, T.; et al. USP8 inhibitor–induced DNA damage activates cell cycle arrest, apoptosis, and autophagy in esophageal squamous cell carcinoma. Cell Biol. Toxicol. 2023, 39, 2011–2032. [Google Scholar] [CrossRef] [PubMed]
- Reincke, M.; Sbiera, S.; Hayakawa, A.; Theodoropoulou, M.; Osswald, A.; Beuschlein, F.; Meitinger, T.; Mizuno-Yamasaki, E.; Kawaguchi, K.; Saeki, Y.; et al. Mutations in the deubiquitinase gene USP8 cause Cushing’s disease. Nat. Genet. 2015, 47, 31–38. [Google Scholar] [CrossRef] [PubMed]
- Xiu, M.-X.; Liu, Y.-M. The role of oncogenic Notch2 signaling in cancer: A novel therapeutic target. Am. J. Cancer Res. 2019, 9, 837–854. [Google Scholar] [PubMed]
- Kelliher, M.A.; Roderick, J.E. NOTCH Signaling in T-Cell-Mediated Anti-Tumor Immunity and T-Cell-Based Immunotherapies. Front. Immunol. 2018, 9, 1718. [Google Scholar] [CrossRef] [PubMed]
- Lu, C.-H.; Yeh, D.-W.; Lai, C.-Y.; Liu, Y.-L.; Huang, L.-R.; Lee, A.Y.-L.; Jin, S.-L.C.; Chuang, T.-H. USP17 mediates macrophage-promoted inflammation and stemness in lung cancer cells by regulating TRAF2/TRAF3 complex formation. Oncogene 2018, 37, 6327–6340. [Google Scholar] [CrossRef]
- Ducker, C.; Shaw, P.E. USP17-mediated de-ubiquitination and cancer: Clients cluster around the cell cycle. Int. J. Biochem. Cell Biol. 2021, 130, 105886. [Google Scholar] [CrossRef]
- Wang, B.; Chen, D.; Hua, H. TBC1D3 family is a prognostic biomarker and correlates with immune infiltration in kidney renal clear cell carcinoma. Mol. Ther. Oncolytics 2021, 22, 528–538. [Google Scholar] [CrossRef]
- Wang, B.; Zhao, H.; Zhao, L.; Zhang, Y.; Wan, Q.; Shen, Y.; Bu, X.; Wan, M.; Shen, C. Up-regulation of OLR1 expression by TBC1D3 through activation of TNFα/NF-κB pathway promotes the migration of human breast cancer cells. Cancer Lett. 2017, 408, 60–70. [Google Scholar] [CrossRef]
- Tian, J.; Liang, X.; Wang, D.; Tian, J.; Liang, H.; Lei, T.; Yan, Z.; Wu, D.; Liu, X.; Liu, S.; et al. TBC1D2 Promotes Ovarian Cancer Metastasis via Inducing E-Cadherin Degradation. Front. Oncol. 2022, 12, 766077. [Google Scholar] [CrossRef]
- Ghosh, S.K.; McCormick, T.S.; Weinberg, A. Human Beta Defensins and Cancer: Contradictions and Common Ground. Front. Oncol. 2019, 9, 341. [Google Scholar] [CrossRef]
- Griffith, M.; Griffith, O.L.; Coffman, A.C.; Weible, J.V.; McMichael, J.F.; Spies, N.C.; Koval, J.; Das, I.; Callaway, M.B.; Eldred, J.M.; et al. DGIdb: Mining the druggable genome. Nat. Methods 2013, 10, 1209–1210. [Google Scholar] [CrossRef] [PubMed]
- Cannon, M.; Stevenson, J.; Stahl, K.; Basu, R.; Coffman, A.; Kiwala, S.; McMichael, J.F.; Kuzma, K.; Morrissey, D.; Cotto, K.; et al. DGIdb 5.0: Rebuilding the drug–gene interaction database for precision medicine and drug discovery platforms. Nucleic Acids Res. 2024, 52, D1227–D1235. [Google Scholar] [CrossRef] [PubMed]
- Hanahan, D.; Weinberg, R.A. Hallmarks of cancer: The next generation. Cell 2011, 144, 646–674. [Google Scholar] [CrossRef] [PubMed]
- Melo, C.M.; Vidotto, T.; Chaves, L.P.; Lautert-Dutra, W.; dos Reis, R.B.; Squire, J.A. The Role of Somatic Mutations on the Immune Response of the Tumor Microenvironment in Prostate Cancer. Int. J. Mol. Sci. 2021, 22, 9550. [Google Scholar] [CrossRef] [PubMed]
- Dunn, G.P.; Old, L.J.; Schreiber, R.D. The Immunobiology of cancer immunosurveillance and immunoediting. Immunity 2004, 21, 137–148. [Google Scholar] [CrossRef]
- Milo, I.; Bedora-Faure, M.; Garcia, Z.; Thibaut, R.; Périé, L.; Shakhar, G.; Deriano, L.; Bousso, P. The immune system profoundly restricts intratumor genetic heterogeneity. Sci. Immunol. 2018, 3, eaat1435. [Google Scholar] [CrossRef]
- Forlenza, C.J.; Boudreau, J.E.; Zheng, J.; Le Luduec, J.-B.; Chamberlain, E.; Heller, G.; Cheung, N.-K.V.; Hsu, K.C. KIR3DL1 Allelic Polymorphism and HLA-B Epitopes Modulate Response to Anti-GD2 Monoclonal Antibody in Patients With Neuroblastoma. J. Clin. Oncol. 2016, 34, 2443–2451. [Google Scholar] [CrossRef]
- Varbanova, V.; Naumova, E.; Mihaylova, A. Killer-cell immunoglobulin-like receptor genes and ligands and their role in hematologic malignancies. Cancer Immunol. Immunother. 2016, 65, 427–440. [Google Scholar] [CrossRef]
- Wang, W.; Erbe, A.K.; Gallenberger, M.; Kim, K.; Carmichael, L.; Hess, D.; Mendonca, E.A.; Song, Y.; Hank, J.A.; Cheng, S.-C.; et al. Killer immunoglobulin-like receptor (KIR) and KIR–ligand genotype do not correlate with clinical outcome of renal cell carcinoma patients receiving high-dose IL2. Cancer Immunol. Immunother. 2016, 65, 1523–1532. [Google Scholar] [CrossRef][Green Version]


Disclaimer/Publisher’s Note: The statements, opinions and data contained in all publications are solely those of the individual author(s) and contributor(s) and not of MDPI and/or the editor(s). MDPI and/or the editor(s) disclaim responsibility for any injury to people or property resulting from any ideas, methods, instructions or products referred to in the content. |
© 2024 by the authors. Licensee MDPI, Basel, Switzerland. This article is an open access article distributed under the terms and conditions of the Creative Commons Attribution (CC BY) license (https://creativecommons.org/licenses/by/4.0/).