

Molecular Atlas of HER2+ Breast Cancer Cells Treated with Endogenous Ligands: Temporal Insights into Mechanisms of Trastuzumab Resistance

 , , , , , ,
Abstract
:Simple Summary
Abstract
1. Introduction
2. Materials and Methods
2.1. Single-Molecule Localization Microscopy (SMLM)
2.1.1. Cell Culture and Ligand Treatments for SMLM
2.1.2. Characterizing Photoswitching Behavior of Fluorescently Labeled Antibodies
2.1.3. Qualitative Data Analysis and Statistical Considerations
2.2. Multiomics Measurements and Data Processing
2.2.1. Cell Culture and Ligand Treatment for Omics Data
2.2.2. Reverse Phase Protein Arrays
2.2.3. RNA-Sequencing
2.2.4. Assay for Transposase-Accessible Chromatin (ATAC)-Sequencing
2.3. Mitotracker, Glucose Uptake, and Intracellular Calcium Assays
2.4. Multiomic Data Processing and Analyses
2.4.1. RPPA Data Processing
2.4.2. RNAseq Data Processing
2.4.3. ATACseq Data Processing
2.4.4. RShiny App
2.5. Network Clustering and Analysis
2.6. Functional Annotation and Enrichment
2.7. Differential Correlation Network Analysis
3. Results
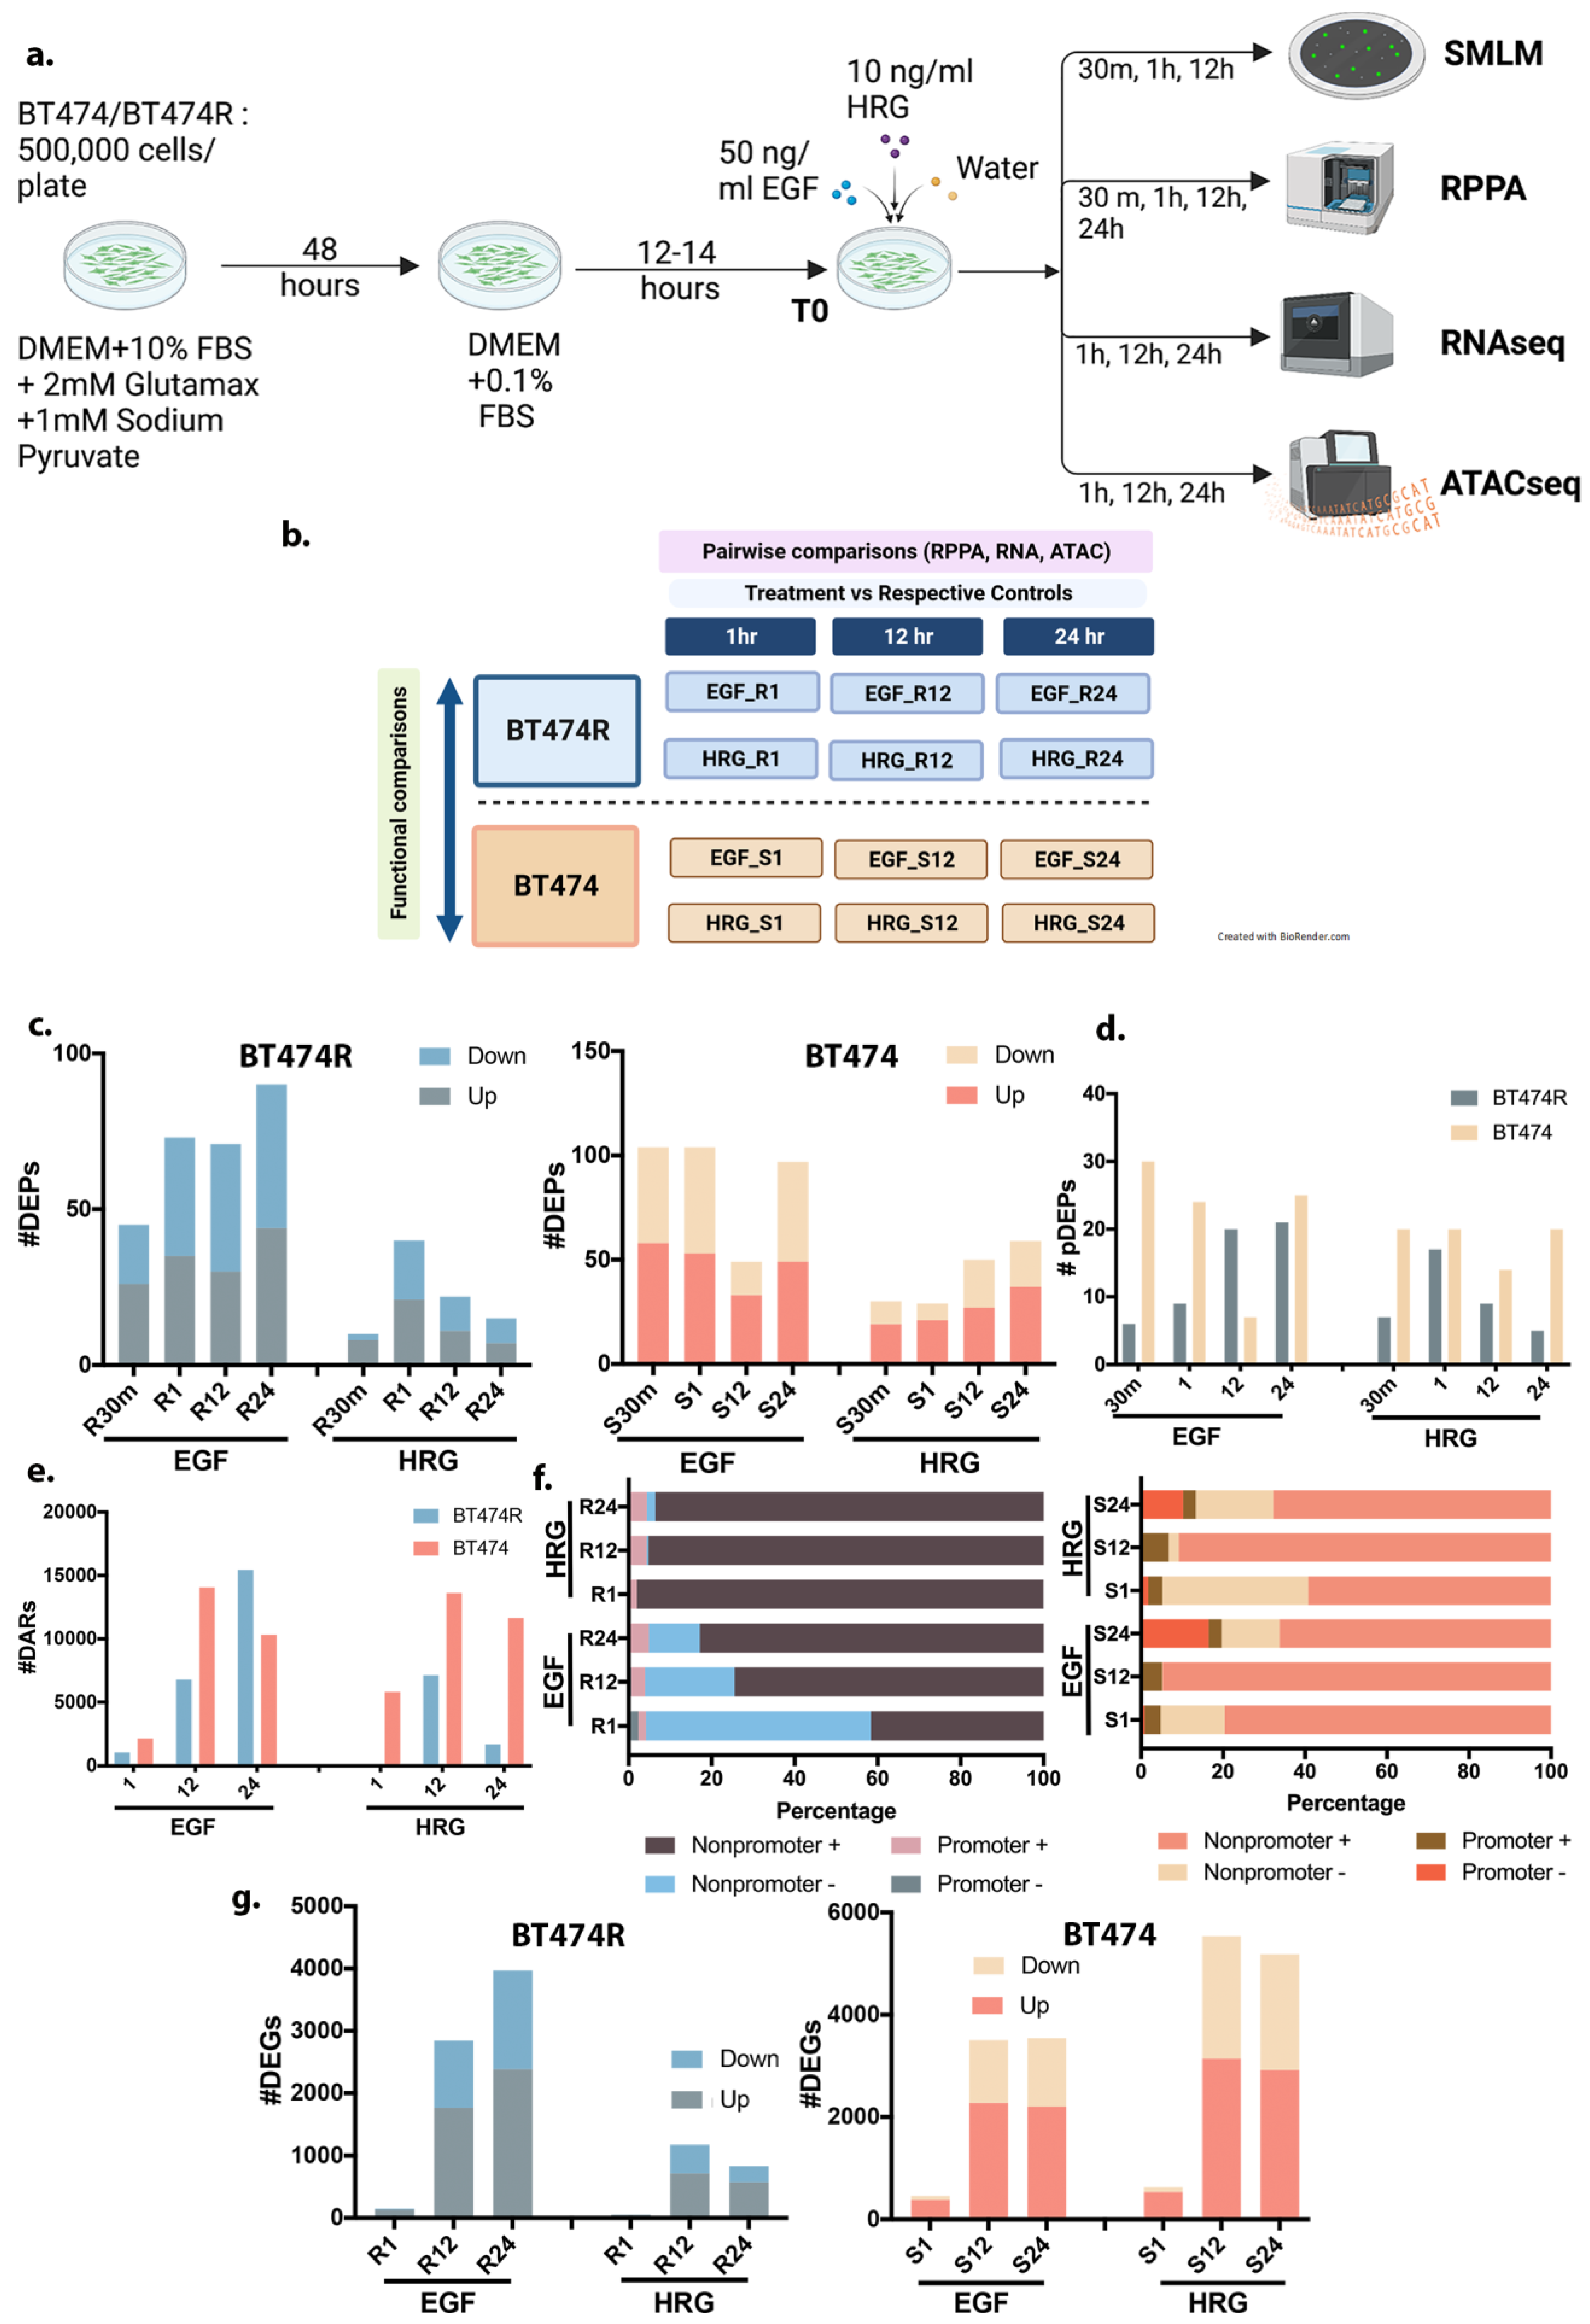
3.1. Study Design
3.2. Processing of Multiomic Measurements from RPPA and RNA- and ATAC-Sequencing
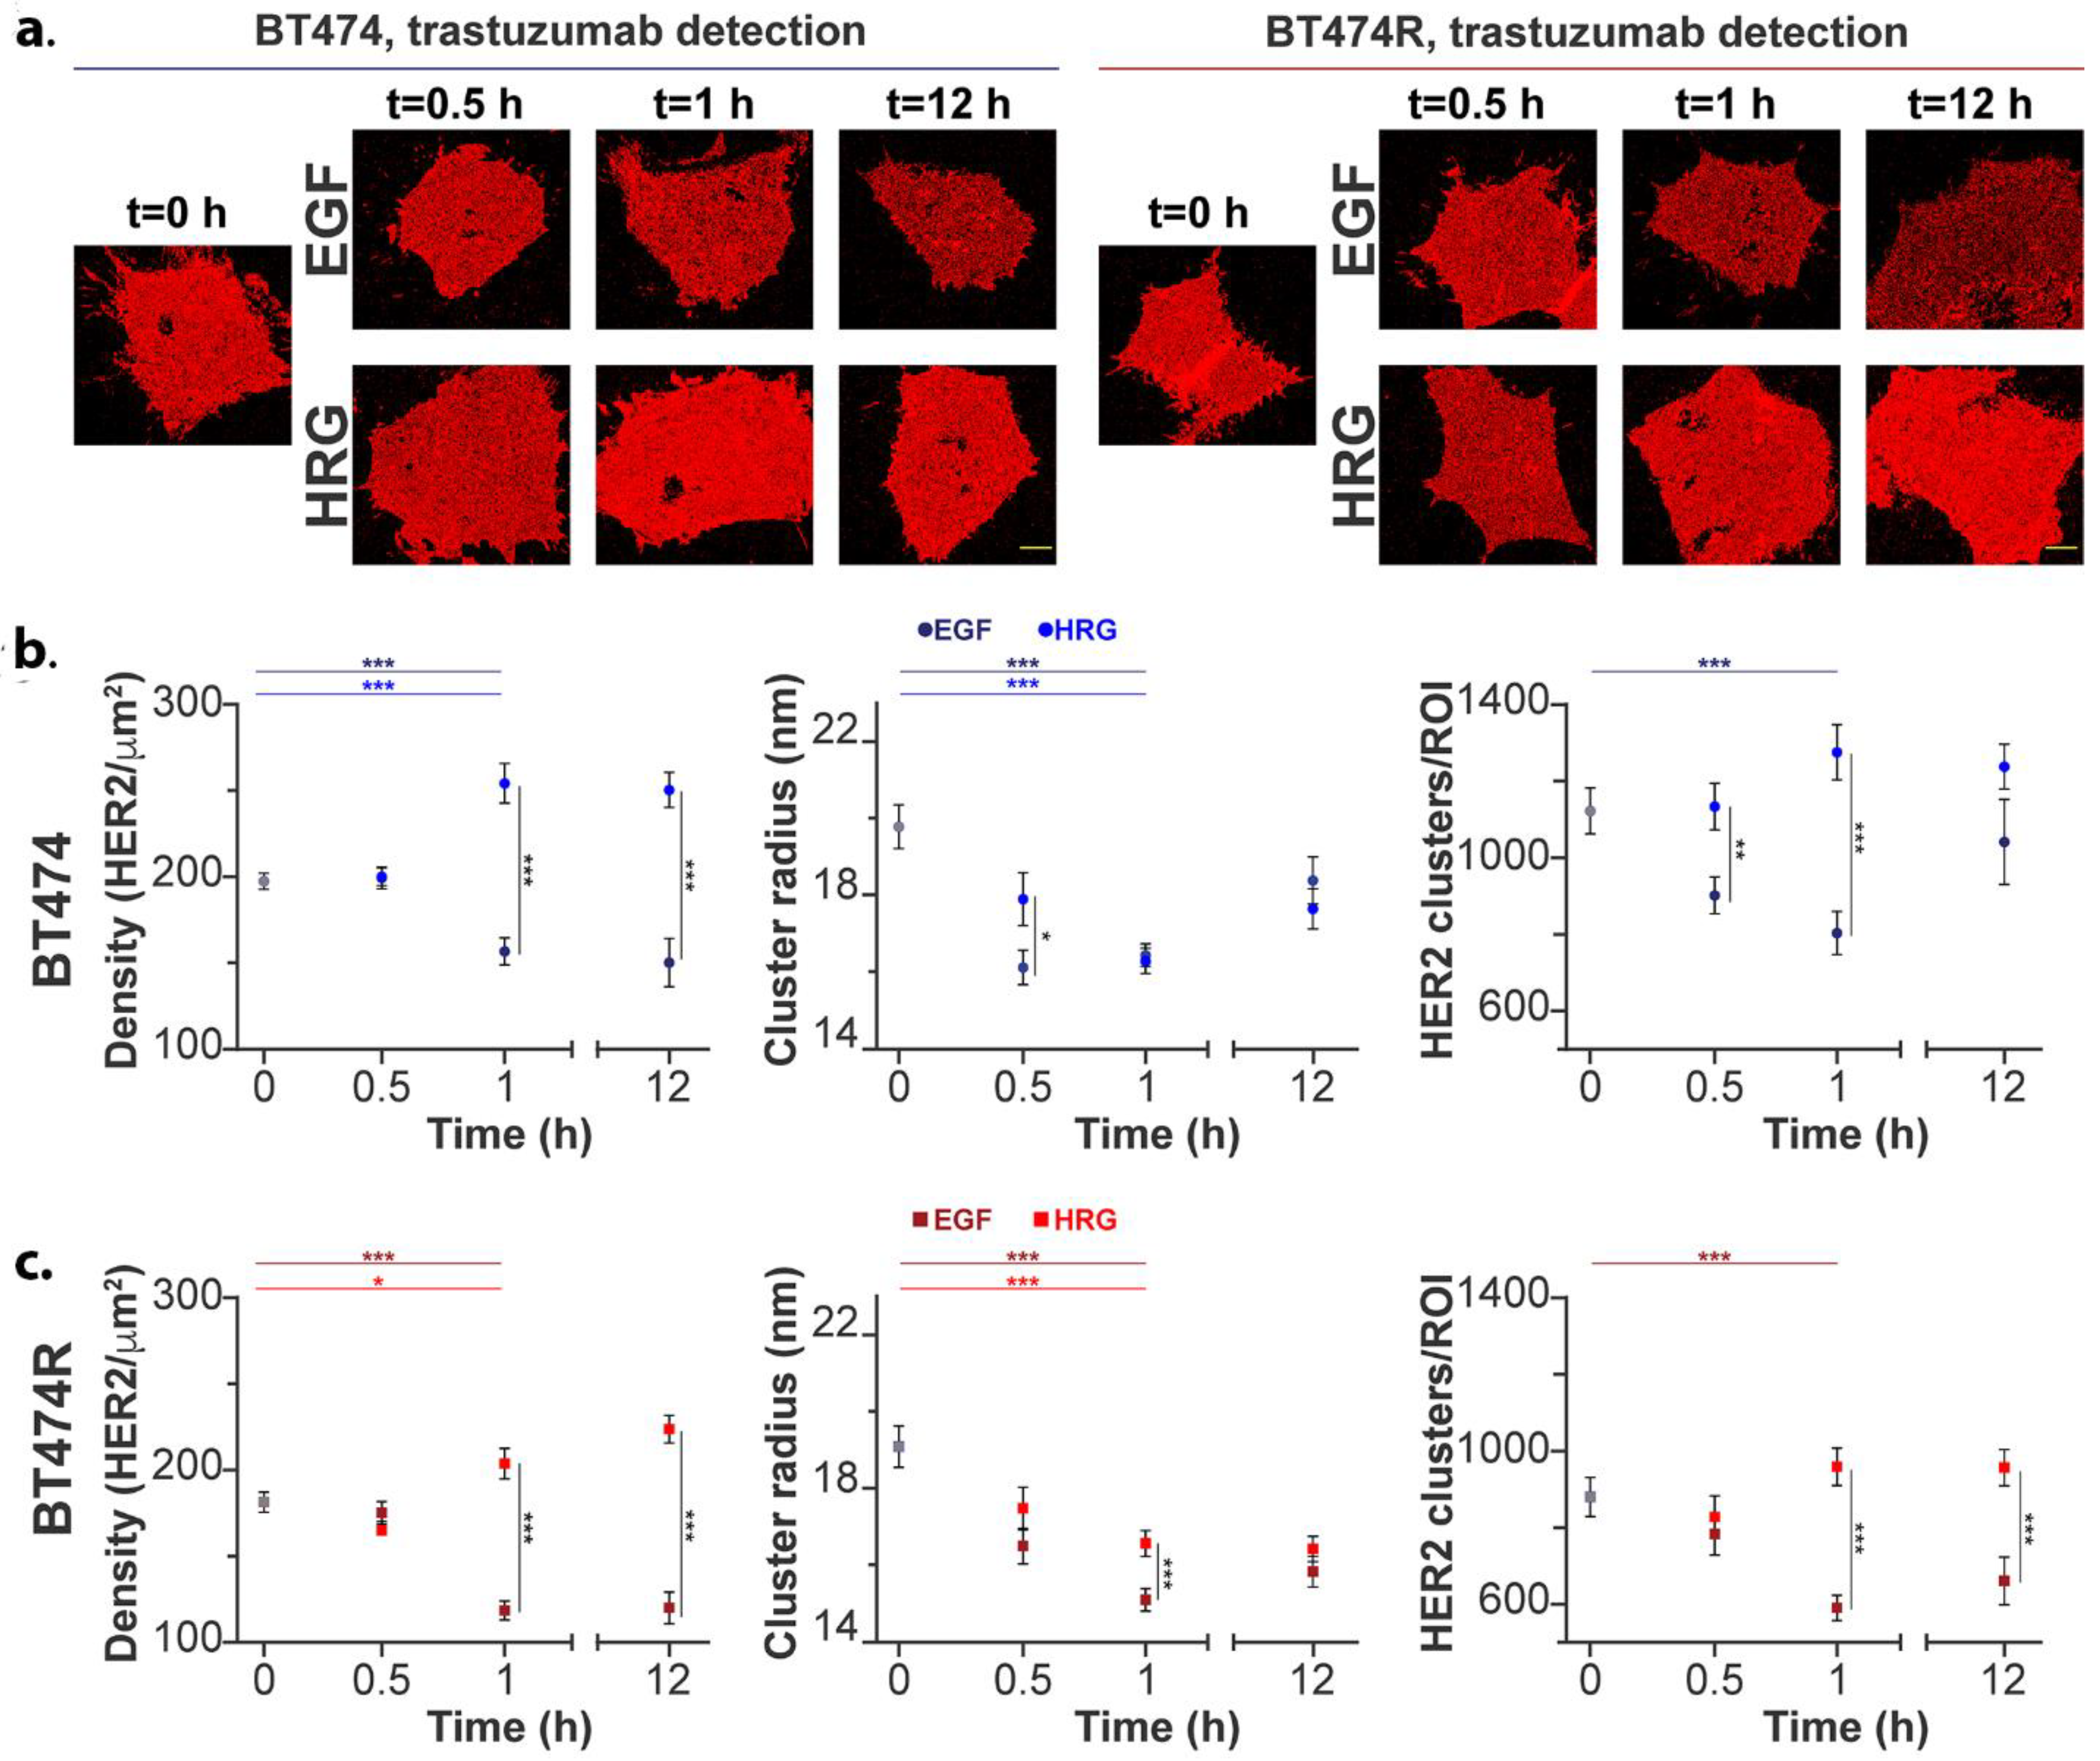
3.3. Plasma Membrane HER2 Clustering Using qSMLM
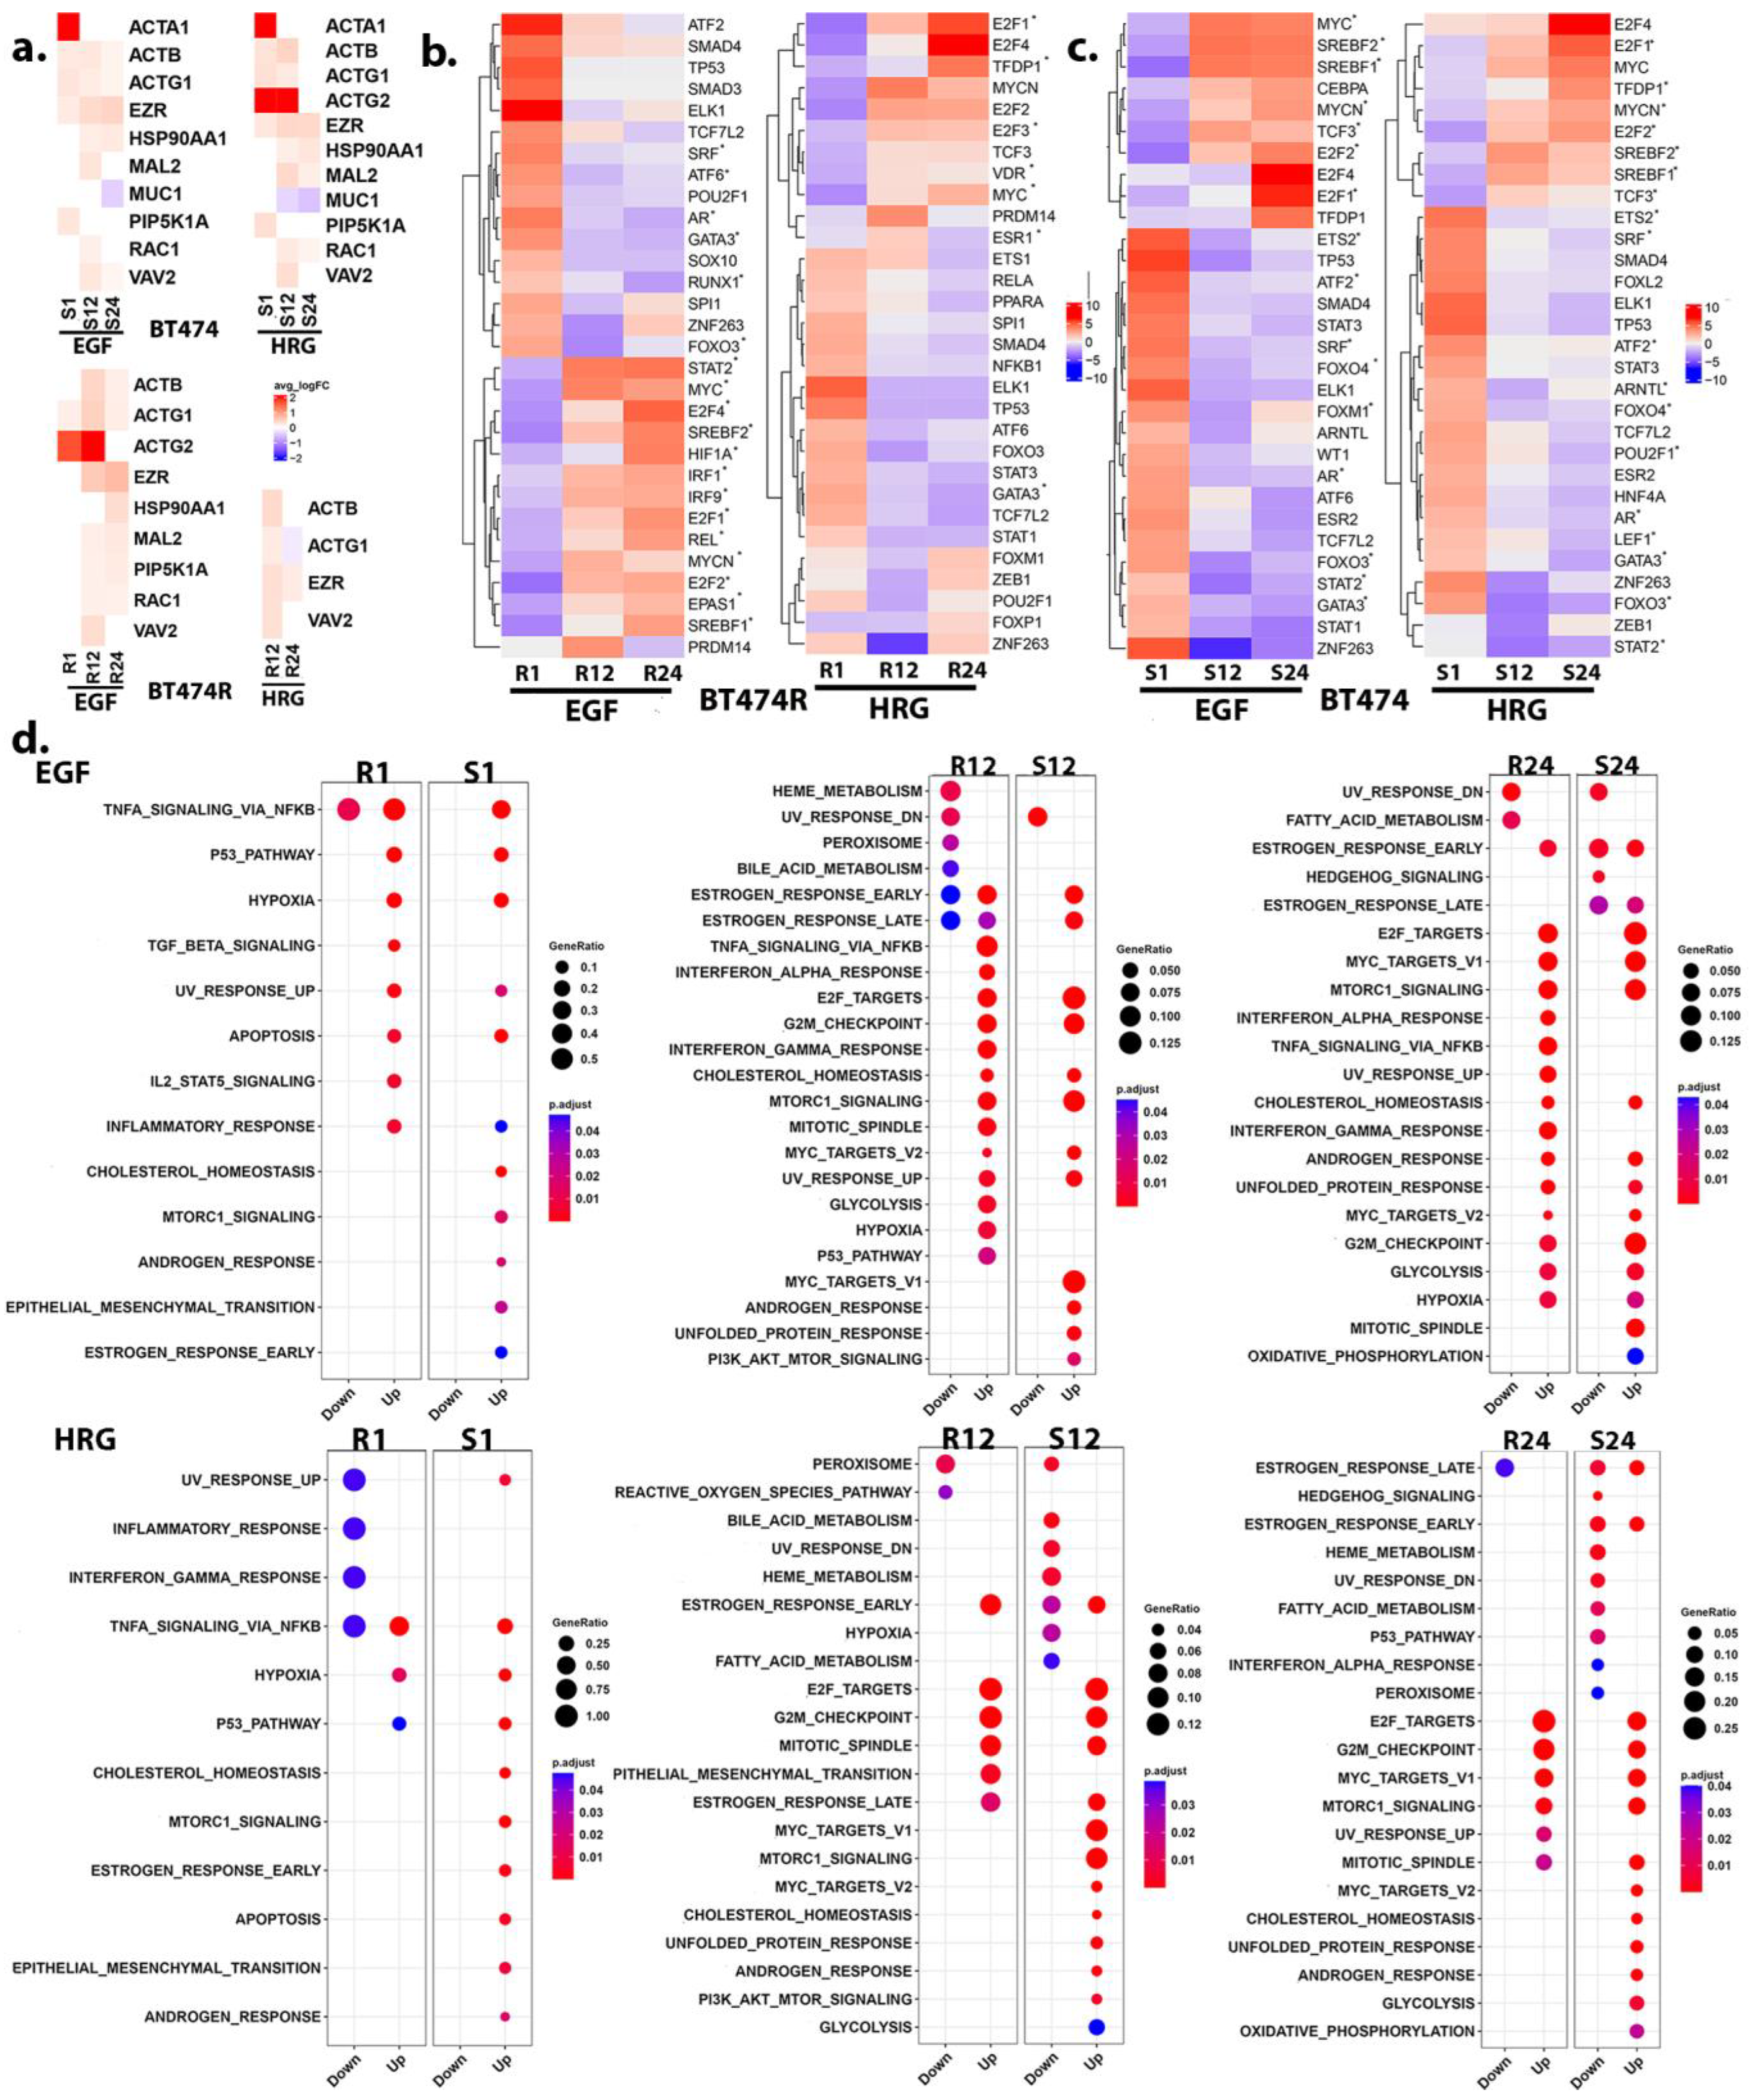
3.4. Receptor Organization and the PI3K/AKT/mTORC1 Signaling
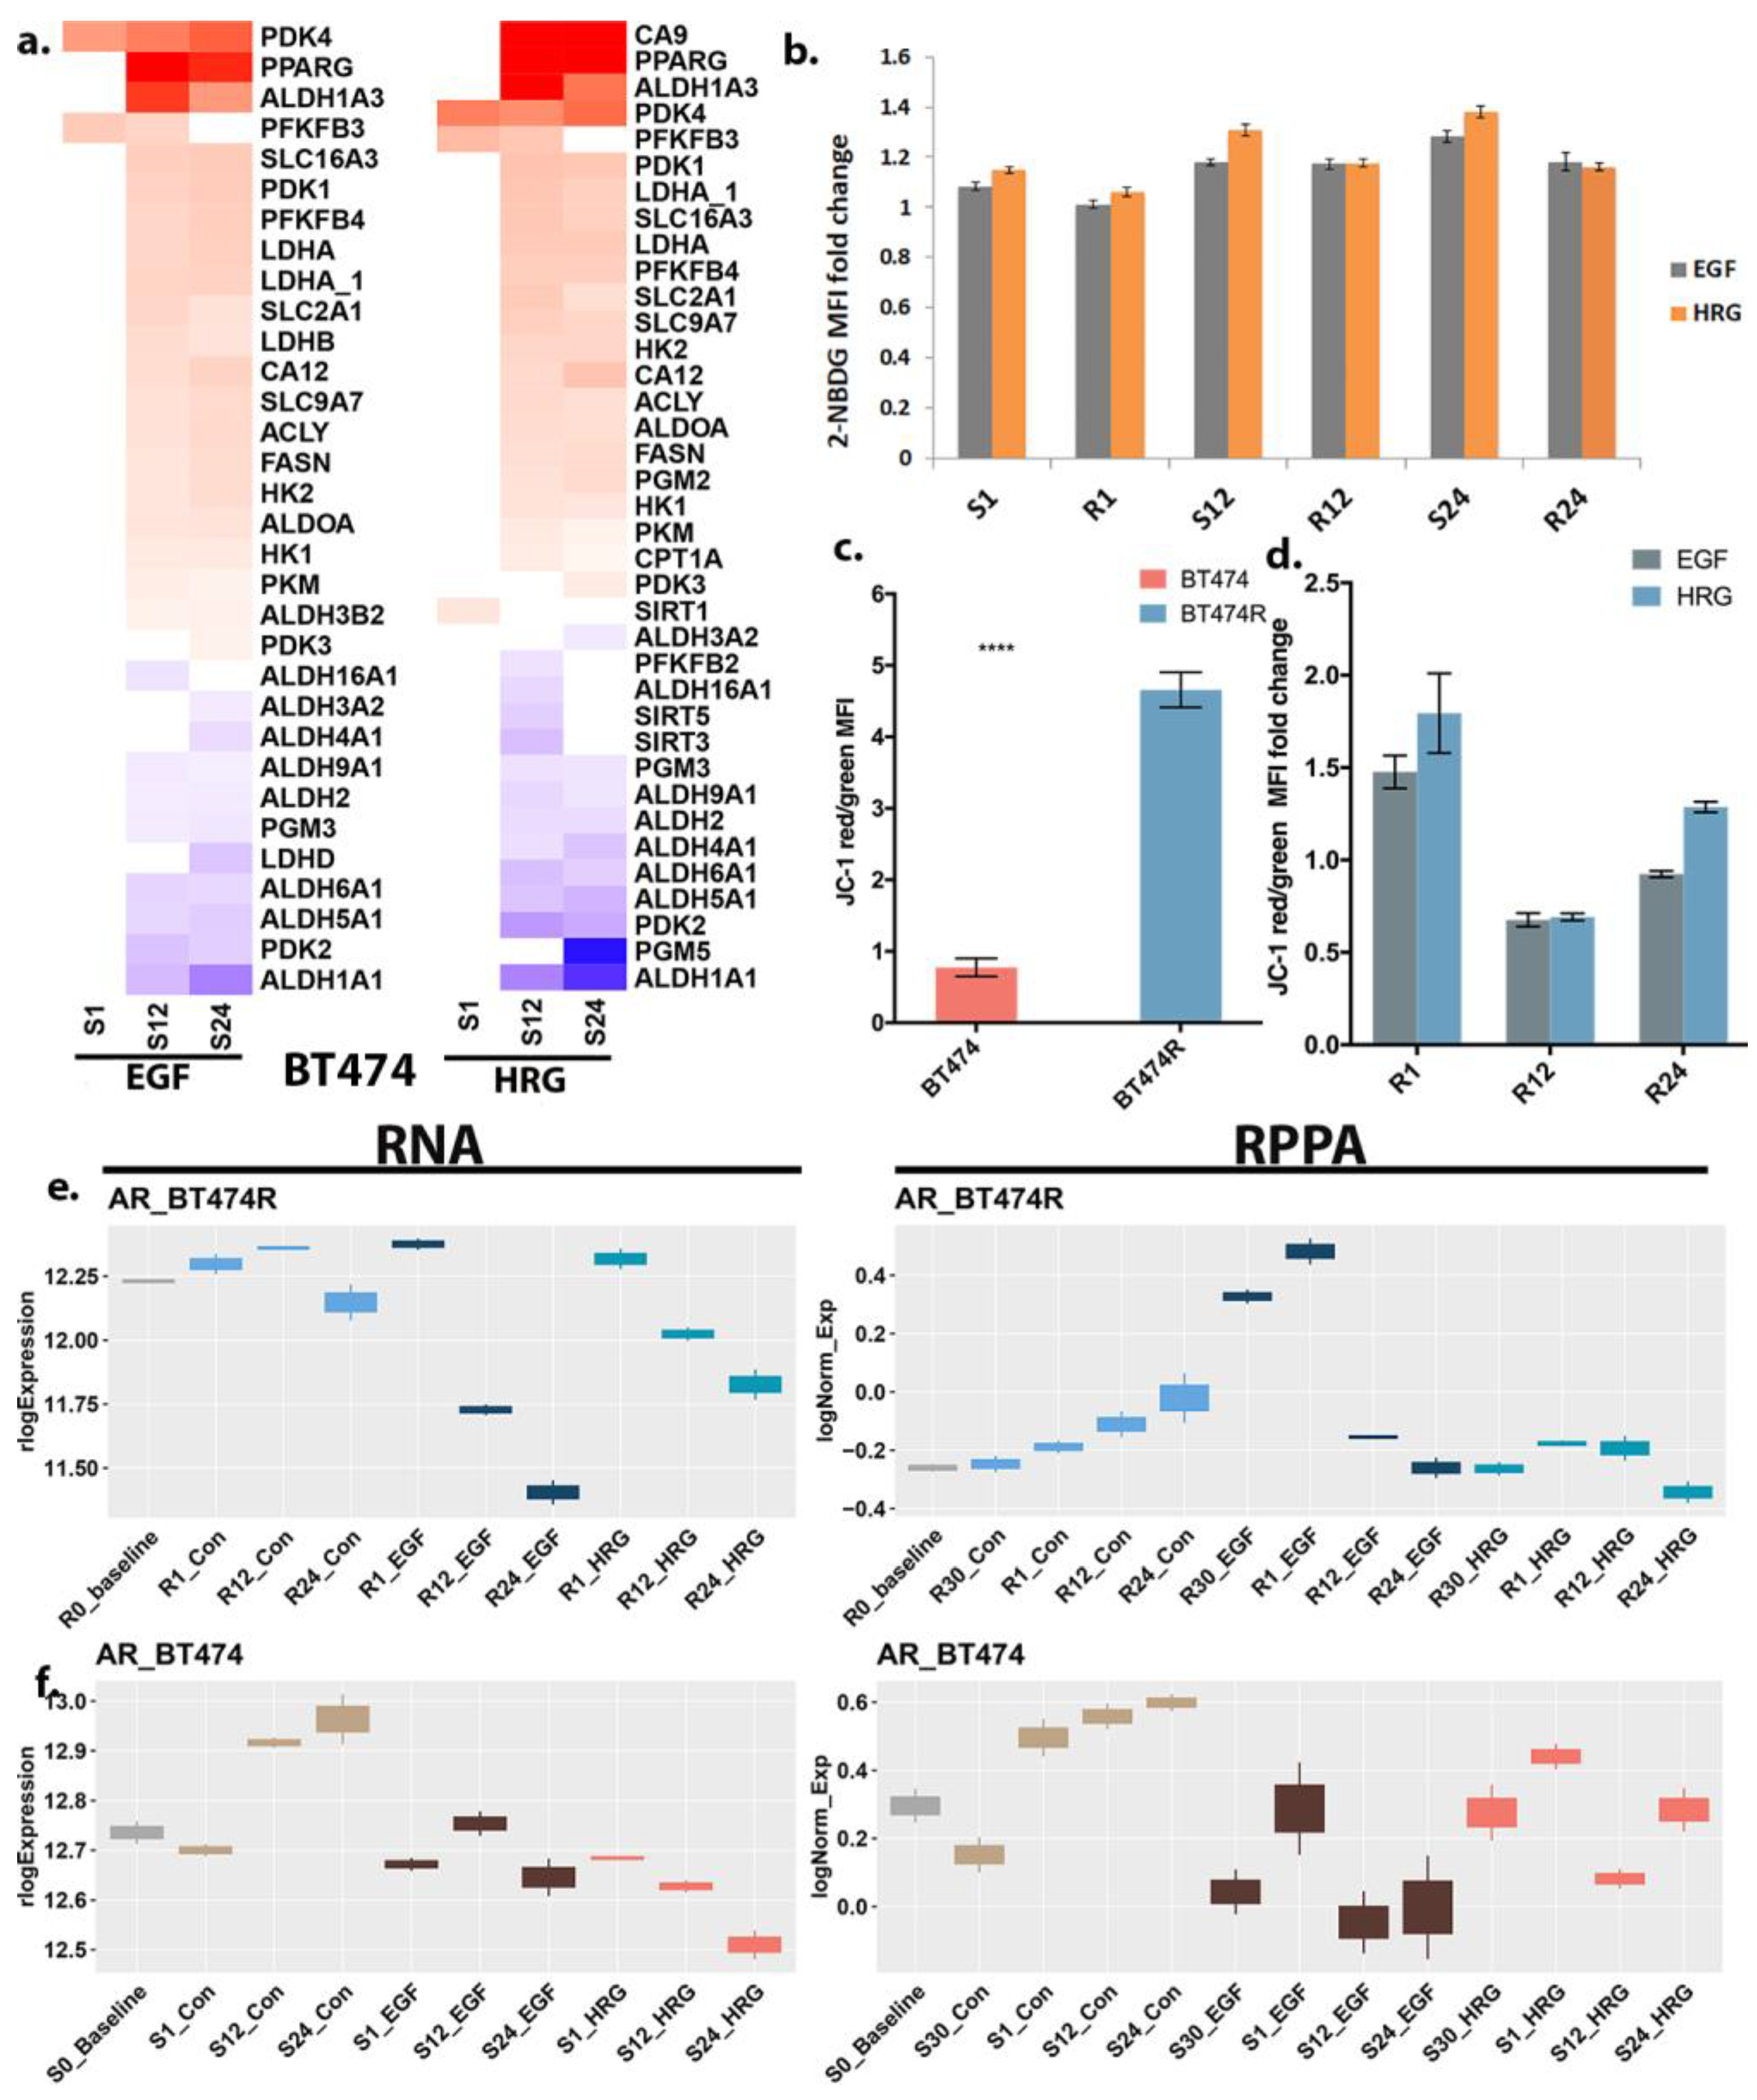
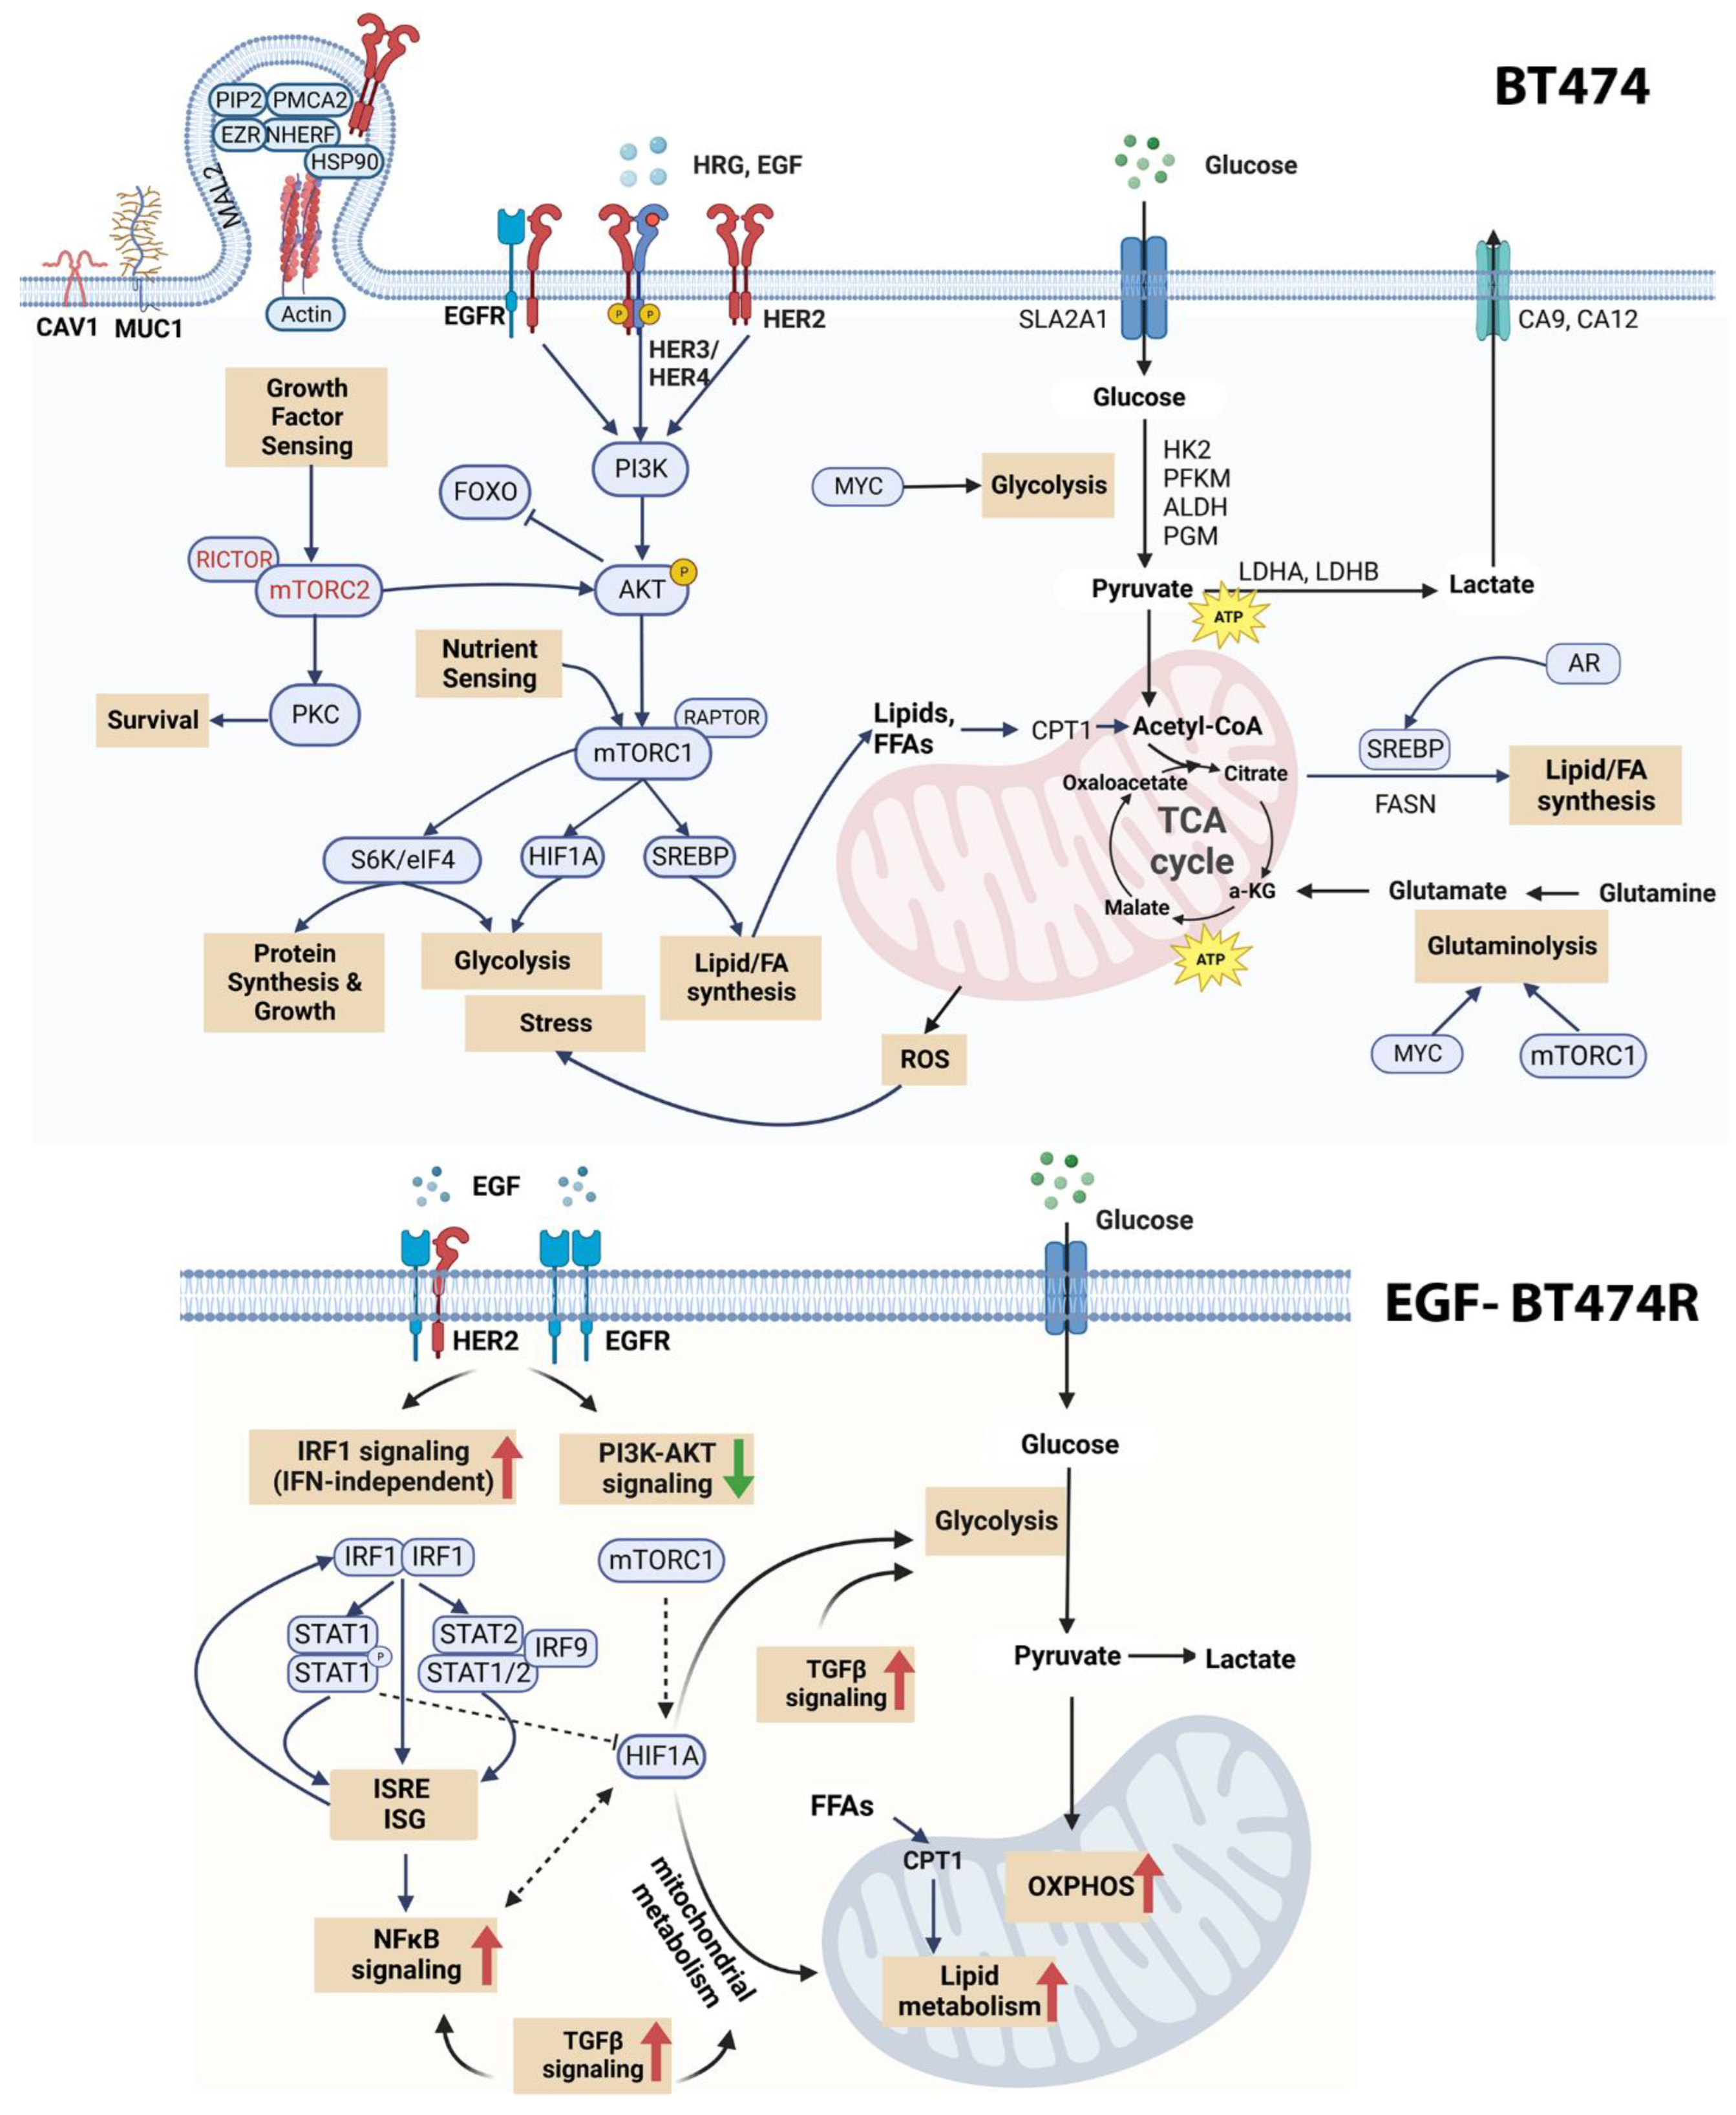
3.5. Differential Bioenergetics in BT474 and BT474R
3.6. Androgen Response in BT474 and BT474R and Its Metabolic Implications in HRG-Treated BT474R
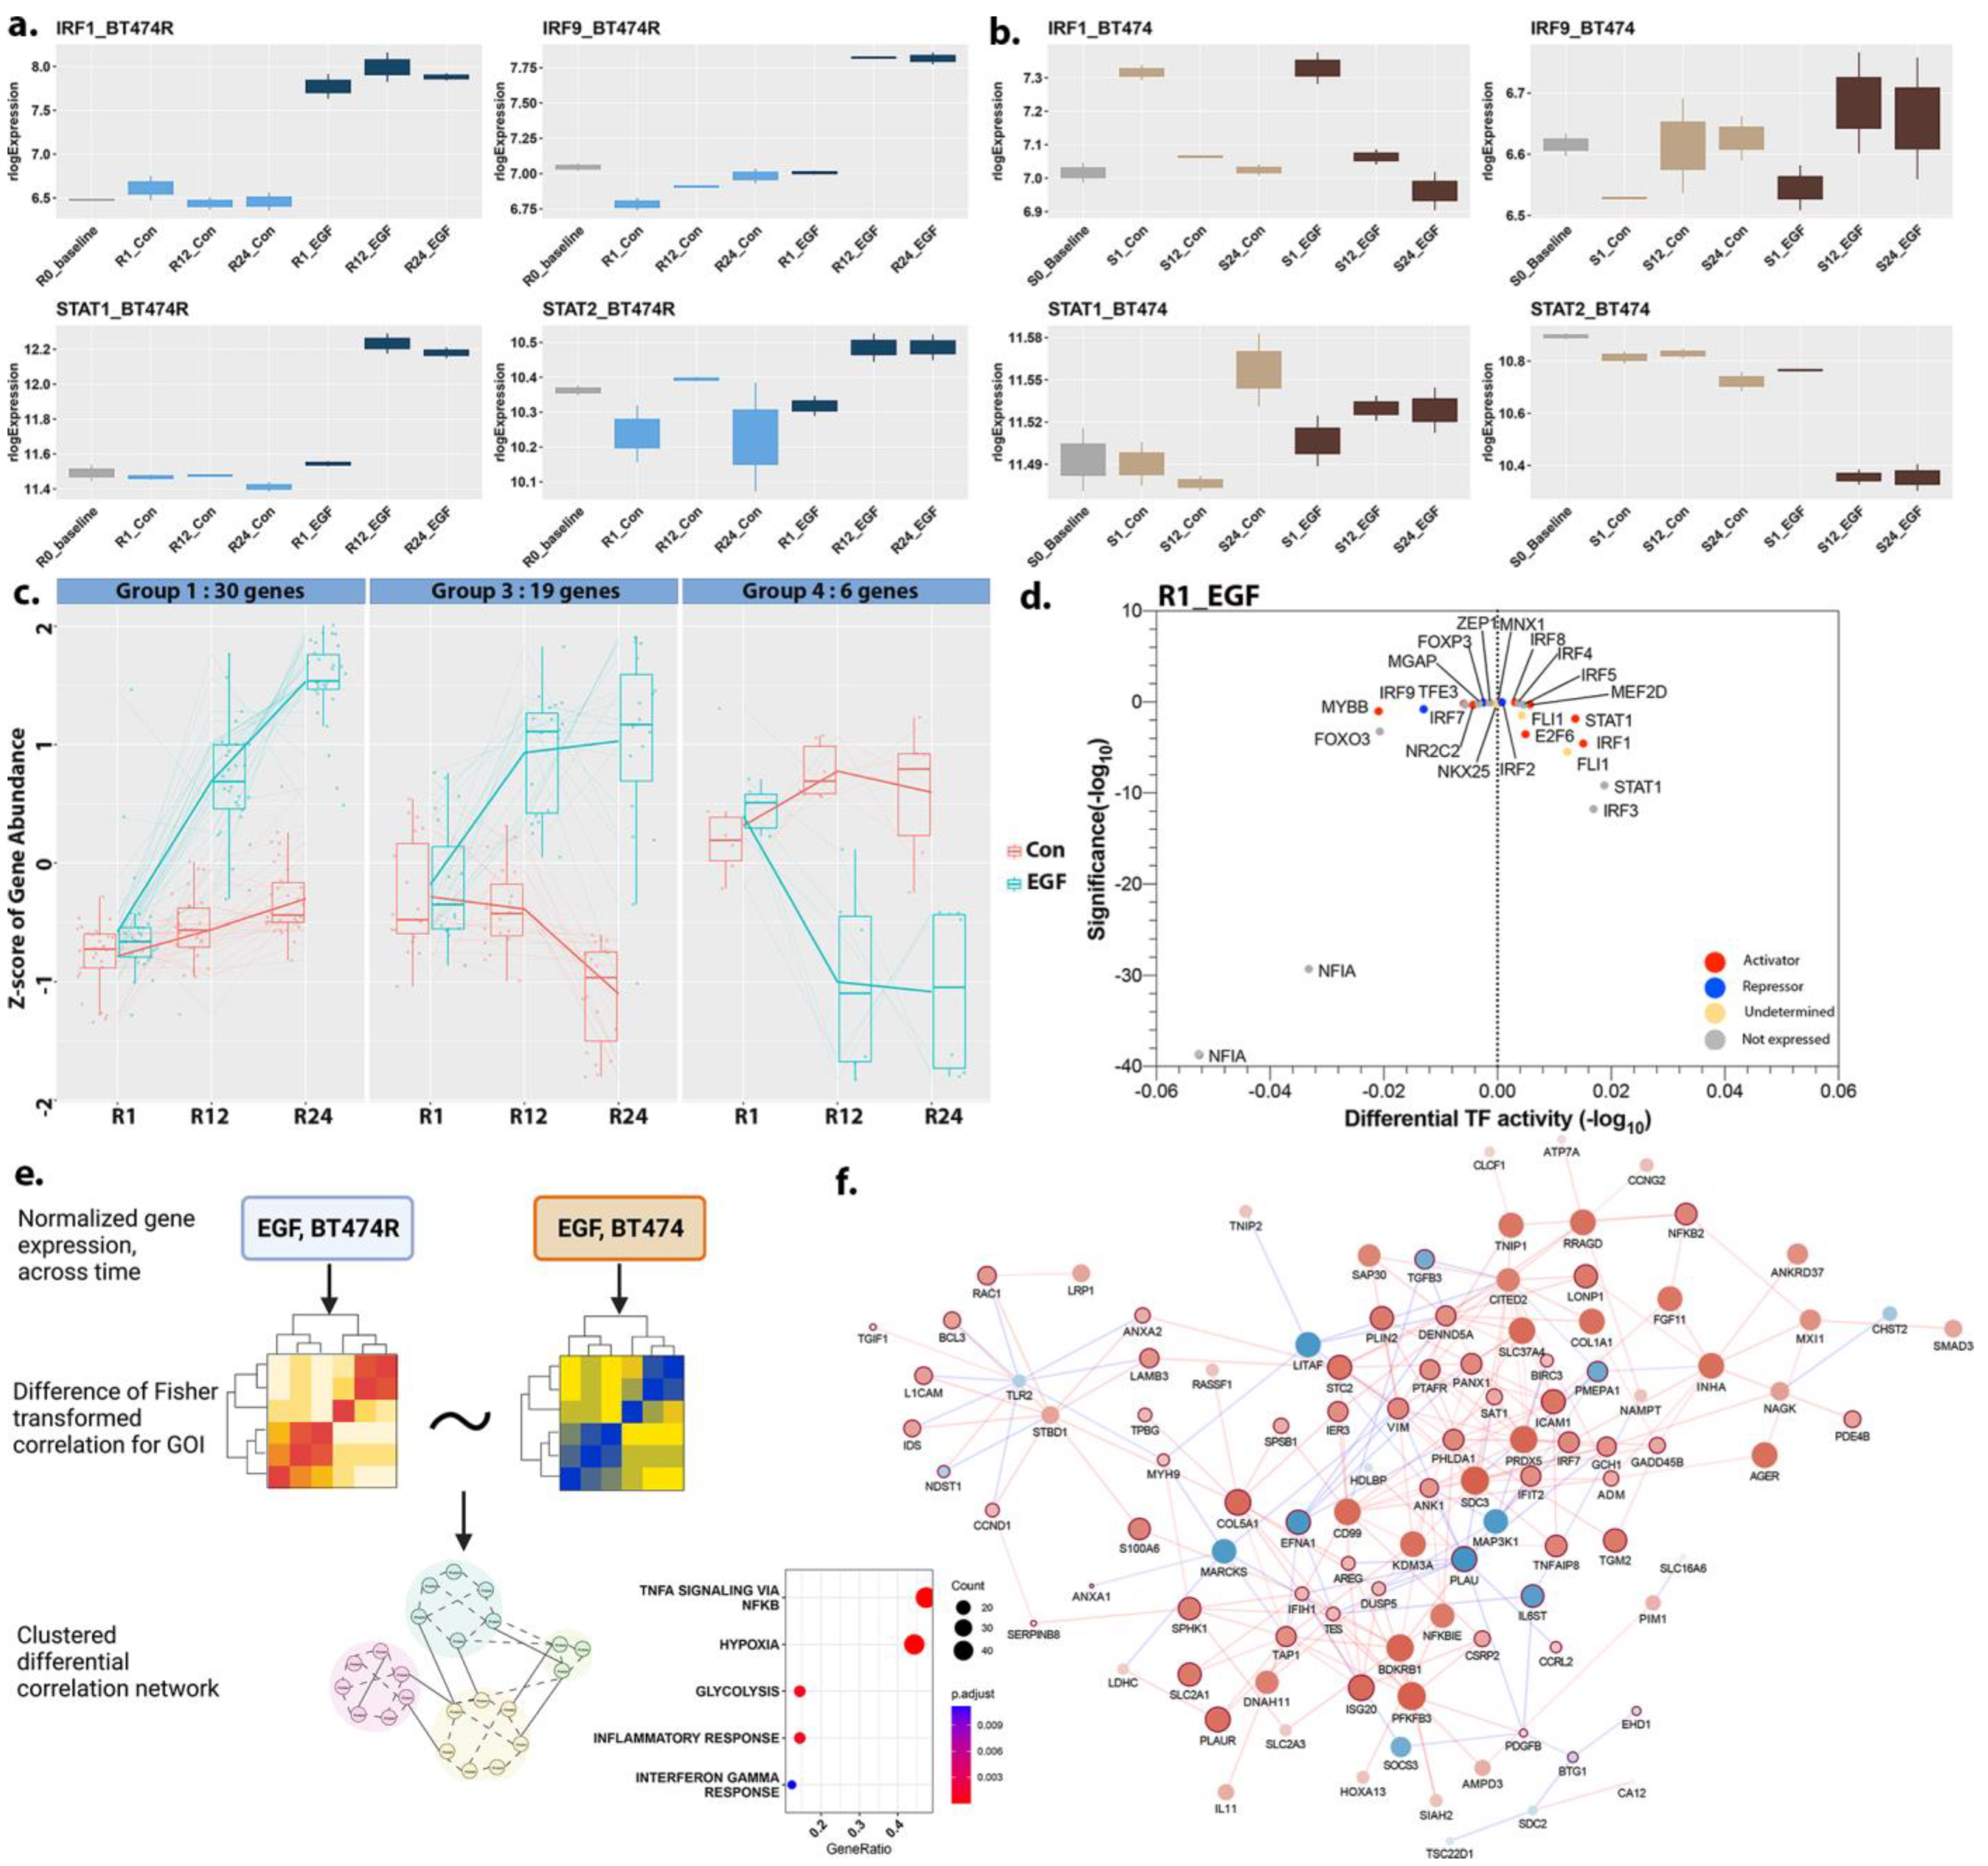
3.7. Activation of the IRF1 Cascade in EGF-Treated BT474R
3.8. A Comparison of Hypoxic Stress Response between BT474R and BT474 after EGF
4. Discussion
5. Conclusions
Supplementary Materials
Author Contributions
Funding
Institutional Review Board Statement
Informed Consent Statement
Data Availability Statement
Acknowledgments
Conflicts of Interest
References
- Lopez-Haber, C.; Barrio-Real, L.; Casado-Medrano, V.; Kazanietz, M.G. Heregulin/ErbB3 Signaling Enhances CXCR4-Driven Rac1 Activation and Breast Cancer Cell Motility via Hypoxia-Inducible Factor 1α. Mol. Cell. Biol. 2016, 36, 2011–2026. [Google Scholar] [CrossRef] [PubMed]
- Al-Akhrass, H.; Conway, J.R.; Poulsen, A.S.A.; Paatero, I.; Kaivola, J.; Padzik, A.; Andersen, O.M.; Ivaska, J. A Feed-Forward Loop between SorLA and HER3 Determines Heregulin Response and Neratinib Resistance. Oncogene 2021, 40, 1300–1317. [Google Scholar] [CrossRef] [PubMed]
- Hutcheson, I.R.; Goddard, L.; Barrow, D.; McClelland, R.A.; Francies, H.E.; Knowlden, J.M.; Nicholson, R.I.; Gee, J.M. Fulvestrant-Induced Expression of ErbB3 and ErbB4 Receptors Sensitizes Oestrogen Receptor-Positive Breast Cancer Cells to Heregulin Β1. Breast Cancer Res. 2011, 13, R29. [Google Scholar] [CrossRef] [PubMed]
- Tang, T.; Zhu, Q.; Li, X.; Zhu, G.; Deng, S.; Wang, Y.; Ni, L.; Chen, X.; Zhang, Y.; Xia, T. Protease Nexin I Is a Feedback Regulator of EGF/PKC/MAPK/EGR1 Signaling in Breast Cancer Cells Metastasis and Stemness. Cell Death Dis. 2019, 10, 649. [Google Scholar] [CrossRef] [PubMed]
- Yao, Y.; Wang, Y.; Wang, S.; Liu, X.; Liu, Z.; Li, Y.; Fang, Z.; Mao, J.; Zheng, Y.; Ye, M. One-Step SH2 Superbinder-Based Approach for Sensitive Analysis of Tyrosine Phosphoproteome. J. Proteome Res. 2019, 18, 1870–1879. [Google Scholar] [CrossRef]
- Bertelsen, V.; Stang, E. The Mysterious Ways of ErbB2/HER2 Trafficking. Membranes 2014, 4, 424–446. [Google Scholar] [CrossRef]
- Kute, T.; Lack, C.M.; Willingham, M.; Bishwokama, B.; Williams, H.; Barrett, K.; Mitchell, T.; Vaughn, J.P. Development of Herceptin Resistance in Breast Cancer Cells. Cytom. Part A J. Int. Soc. Anal. Cytol. 2004, 57, 86–93. [Google Scholar] [CrossRef]
- Maddox, A.L.; Brehove, M.S.; Eliato, K.R.; Saftics, A.; Romano, E.; Press, M.F.; Mortimer, J.; Jones, V.; Schmolze, D.; Seewaldt, V.L. Molecular Assessment of HER2 to Identify Signatures Associated with Therapy Response in HER2-Positive Breast Cancer. Cancers 2022, 14, 2795. [Google Scholar] [CrossRef]
- Tobin, S.J.; Wakefield, D.L.; Jones, V.; Liu, X.; Schmolze, D.; Jovanović-Talisman, T. Single Molecule Localization Microscopy Coupled with Touch Preparation for the Quantification of Trastuzumab-Bound HER2. Sci. Rep. 2018, 8, 15154. [Google Scholar] [CrossRef]
- Corces, M.R.; Trevino, A.E.; Hamilton, E.G.; Greenside, P.G.; Sinnott-Armstrong, N.A.; Vesuna, S.; Satpathy, A.T.; Rubin, A.J.; Montine, K.S.; Wu, B. An Improved ATAC-Seq Protocol Reduces Background and Enables Interrogation of Frozen Tissues. Nat. Methods 2017, 14, 959–962. [Google Scholar] [CrossRef]
- Liao, Y.; Smyth, G.K.; Shi, W. The R Package Rsubread Is Easier, Faster, Cheaper and Better for Alignment and Quantification of RNA Sequencing Reads. Nucleic Acids Res. 2019, 47, e47. [Google Scholar] [CrossRef] [PubMed]
- Love, M.I.; Huber, W.; Anders, S. Moderated Estimation of Fold Change and Dispersion for RNA-Seq Data with DESeq2. Genome Biol. 2014, 15, 550. [Google Scholar] [CrossRef] [PubMed]
- Kolde, R.; Kolde, M.R. R Package; Package ‘pheatmap’. Available online: https://cran.r-project.org/web/packages/pheatmap/index.html (accessed on 1 October 2019).
- Bushnell, B. BBMap: A Fast, Accurate, Splice-Aware Aligner; Lawrence Berkeley National Lab (LBNL): Berkeley, CA, USA, 2014. [Google Scholar]
- Stark, R.; Brown, G. R Package; DiffBind: Differential Binding Analysis of ChIP-Seq Peak Data. Available online: http://bioconductor.org/packages/devel/bioc/vignettes/DiffBind/inst/doc/DiffBind.pdf (accessed on 1 October 2021).
- Yu, G.; Wang, L.-G.; He, Q.-Y. ChIPseeker: An R/Bioconductor Package for ChIP Peak Annotation, Comparison and Visualization. Bioinformatics 2015, 31, 2382–2383. [Google Scholar] [CrossRef] [PubMed]
- Berest, I.; Arnold, C.; Reyes-Palomares, A.; Palla, G.; Rasmussen, K.D.; Giles, H.; Bruch, P.-M.; Huber, W.; Dietrich, S.; Helin, K. Quantification of Differential Transcription Factor Activity and Multiomics-Based Classification into Activators and Repressors: diffTF. Cell Rep. 2019, 29, 3147–3159. [Google Scholar] [CrossRef] [PubMed]
- Mills, C.; Muruganujan, A.; Ebert, D.; Marconett, C.N.; Lewinger, J.P.; Thomas, P.D.; Mi, H. PEREGRINE: A Genome-Wide Prediction of Enhancer to Gene Relationships Supported by Experimental Evidence. PLoS ONE 2020, 15, e0243791. [Google Scholar] [CrossRef] [PubMed]
- Gu, Z.; Eils, R.; Schlesner, M. Complex Heatmaps Reveal Patterns and Correlations in Multidimensional Genomic Data. Bioinformatics 2016, 32, 2847–2849. [Google Scholar] [CrossRef]
- Anand, L.; Rodriguez Lopez, C.M. ChromoMap: An R Package for Interactive Visualization of Multi-Omics Data and Annotation of Chromosomes. BMC Bioinform. 2022, 23, 33. [Google Scholar] [CrossRef]
- Hahne, F.; Ivanek, R. Visualizing Genomic Data Using Gviz and Bioconductor. In Statistical Genomics: Methods and Protocols; Springer: Berlin/Heidelberg, Germany, 2016; pp. 335–351. [Google Scholar]
- Szklarczyk, D.; Gable, A.L.; Lyon, D.; Junge, A.; Wyder, S.; Huerta-Cepas, J.; Simonovic, M.; Doncheva, N.T.; Morris, J.H.; Bork, P. STRING V11: Protein–Protein Association Networks with Increased Coverage, Supporting Functional Discovery in Genome-Wide Experimental Datasets. Nucleic Acids Res. 2019, 47, D607–D613. [Google Scholar] [CrossRef]
- Göös, H.; Kinnunen, M.; Salokas, K.; Tan, Z.; Liu, X.; Yadav, L.; Zhang, Q.; Wei, G.-H.; Varjosalo, M. Human Transcription Factor Protein Interaction Networks. Nat. Commun. 2022, 13, 766. [Google Scholar] [CrossRef]
- Pantano, L. BioC Package, Version 1.32.0; DEGreport: Report of DEG Analysis. Available online: https://www.bioconductor.org/packages/release/bioc/html/DEGreport.html (accessed on 1 July 2020).
- Yu, G.; Wang, L.-G.; Han, Y.; He, Q.-Y. clusterProfiler: An R Package for Comparing Biological Themes Among Gene Clusters. OMICS 2012, 16, 284–287. [Google Scholar] [CrossRef]
- Kuleshov, M.V.; Jones, M.R.; Rouillard, A.D.; Fernandez, N.F.; Duan, Q.; Wang, Z.; Koplev, S.; Jenkins, S.L.; Jagodnik, K.M.; Lachmann, A.; et al. Enrichr: A Comprehensive Gene Set Enrichment Analysis Web Server 2016 Update. Nucleic Acids Res. 2016, 44, W90–W97. [Google Scholar] [CrossRef]
- Fukushima, A. DiffCorr: An R Package to Analyze and Visualize Differential Correlations in Biological Networks. Gene 2013, 518, 209–214. [Google Scholar] [CrossRef] [PubMed]
- Strimmer, K. Fdrtool: A Versatile R Package for Estimating Local and Tail Area-Based False Discovery Rates. Bioinformatics 2008, 24, 1461–1462. [Google Scholar] [CrossRef] [PubMed]
- Langfelder, P.; Horvath, S. WGCNA: An R Package for Weighted Correlation Network Analysis. BMC Bioinform. 2008, 9, 559. [Google Scholar] [CrossRef]
- Sengupta, P.; Jovanovic-Talisman, T.; Skoko, D.; Renz, M.; Veatch, S.L.; Lippincott-Schwartz, J. Probing Protein Heterogeneity in the Plasma Membrane Using PALM and Pair Correlation Analysis. Nat. Methods 2011, 8, 969–975. [Google Scholar] [CrossRef] [PubMed]
- Rogacki, M.K.; Golfetto, O.; Tobin, S.J.; Li, T.; Biswas, S.; Jorand, R.; Zhang, H.; Radoi, V.; Ming, Y.; Svenningsson, P. Dynamic Lateral Organization of Opioid Receptors (Kappa, Muwt and muN40D) in the Plasma Membrane at the Nanoscale Level. Traffic 2018, 19, 690–709. [Google Scholar] [CrossRef] [PubMed]
- Pereira, P.M.; Sharma, S.K.; Carter, L.M.; Edwards, K.J.; Pourat, J.; Ragupathi, A.; Janjigian, Y.Y.; Durack, J.C.; Lewis, J.S. Caveolin-1 Mediates Cellular Distribution of HER2 and Affects Trastuzumab Binding and Therapeutic Efficacy. Nat. Commun. 2018, 9, 5137. [Google Scholar] [CrossRef] [PubMed]
- Wang, S.E.; Shin, I.; Wu, F.Y.; Friedman, D.B.; Arteaga, C.L. HER2/Neu (ErbB2) Signaling to Rac1-Pak1 Is Temporally and Spatially Modulated by Transforming Growth Factor β. Cancer Res. 2006, 66, 9591–9600. [Google Scholar] [CrossRef]
- Jeong, J.; VanHouten, J.N.; Dann, P.; Kim, W.; Sullivan, C.; Yu, H.; Liotta, L.; Espina, V.; Stern, D.F.; Friedman, P.A. PMCA2 Regulates HER2 Protein Kinase Localization and Signaling and Promotes HER2-Mediated Breast Cancer. Proc. Natl. Acad. Sci. USA 2016, 113, E282–E290. [Google Scholar] [CrossRef]
- Jeong, J.; Kim, W.; Kim, L.K.; VanHouten, J.; Wysolmerski, J.J. HER2 Signaling Regulates HER2 Localization and Membrane Retention. PLoS ONE 2017, 12, e0174849. [Google Scholar] [CrossRef]
- Jeong, J.; Choi, J.; Kim, W.; Dann, P.; Takyar, F.; Gefter, J.V.; Friedman, P.A.; Wysolmerski, J.J. Inhibition of Ezrin Causes PKCα-Mediated Internalization of Erbb2/HER2 Tyrosine Kinase in Breast Cancer Cells. J. Biol. Chem. 2019, 294, 887–901. [Google Scholar] [CrossRef]
- Gutierrez, C.; Schiff, R. HER2: Biology, Detection, and Clinical Implications. Arch. Pathol. Lab. Med. 2011, 135, 55–62. [Google Scholar] [CrossRef] [PubMed]
- Ruiz-Saenz, A.; Dreyer, C.; Campbell, M.R.; Steri, V.; Gulizia, N.; Moasser, M.M. HER2 Amplification in Tumors Activates PI3K/Akt Signaling Independent of HER3. Cancer Res. 2018, 78, 3645–3658. [Google Scholar] [CrossRef] [PubMed]
- She, Q.-B.; Chandarlapaty, S.; Ye, Q.; Lobo, J.; Haskell, K.M.; Leander, K.R.; DeFeo-Jones, D.; Huber, H.E.; Rosen, N. Breast Tumor Cells with PI3K Mutation or HER2 Amplification Are Selectively Addicted to Akt Signaling. PLoS ONE 2008, 3, e3065. [Google Scholar] [CrossRef] [PubMed]
- Dibble, C.C.; Cantley, L.C. Regulation of mTORC1 by PI3K Signaling. Trends Cell Biol. 2015, 25, 545–555. [Google Scholar] [CrossRef] [PubMed]
- Jhanwar-Uniyal, M.; Amin, A.G.; Cooper, J.B.; Das, K.; Schmidt, M.H.; Murali, R. Discrete Signaling Mechanisms of mTORC1 and mTORC2: Connected yet Apart in Cellular and Molecular Aspects. Adv. Biol. Regul. 2017, 64, 39–48. [Google Scholar] [CrossRef] [PubMed]
- Qin, X.; Jiang, B.; Zhang, Y. 4E-BP1, a Multifactor Regulated Multifunctional Protein. Cell Cycle 2016, 15, 781–786. [Google Scholar] [CrossRef] [PubMed]
- Dibble, C.C.; Asara, J.M.; Manning, B.D. Characterization of Rictor Phosphorylation Sites Reveals Direct Regulation of mTOR Complex 2 by S6K1. Mol. Cell. Biol. 2009, 29, 5657–5670. [Google Scholar] [CrossRef] [PubMed]
- Jose, C.; Bellance, N.; Rossignol, R. Choosing between Glycolysis and Oxidative Phosphorylation: A Tumor’s Dilemma? Biochim. Biophys. Acta (BBA)-Bioenerg. 2011, 1807, 552–561. [Google Scholar] [CrossRef]
- Yu, L.; Chen, X.; Sun, X.; Wang, L.; Chen, S. The Glycolytic Switch in Tumors: How Many Players Are Involved? J. Cancer 2017, 8, 3430. [Google Scholar] [CrossRef]
- Zwaans, B.M.; Lombard, D.B. Interplay between Sirtuins, MYC and Hypoxia-Inducible Factor in Cancer-Associated Metabolic Reprogramming. Dis. Models Mech. 2014, 7, 1023–1032. [Google Scholar] [CrossRef] [PubMed]
- Zhao, Y.; Liu, H.; Liu, Z.; Ding, Y.; LeDoux, S.P.; Wilson, G.L.; Voellmy, R.; Lin, Y.; Lin, W.; Nahta, R. Overcoming Trastuzumab Resistance in Breast Cancer by Targeting Dysregulated Glucose MetabolismTargeting Glycolysis Sensitizes Breast Cancer to Trastuzumab. Cancer Res. 2011, 71, 4585–4597. [Google Scholar] [CrossRef] [PubMed]
- Gale, M.; Li, Y.; Cao, J.; Liu, Z.Z.; Holmbeck, M.A.; Zhang, M.; Lang, S.M.; Wu, L.; Do Carmo, M.; Gupta, S. Acquired Resistance to HER2-Targeted Therapies Creates Vulnerability to ATP Synthase Inhibition. Cancer Res. 2020, 80, 524–535. [Google Scholar] [CrossRef] [PubMed]
- Chang, J.; Wang, Q.; Bhetuwal, A.; Liu, W. Metabolic Pathways Underlying GATA6 Regulating Trastuzumab Resistance in Gastric Cancer Cells Based on Untargeted Metabolomics. Int. J. Med. Sci. 2020, 17, 3146. [Google Scholar] [CrossRef] [PubMed]
- Subik, K.; Lee, J.-F.; Baxter, L.; Strzepek, T.; Costello, D.; Crowley, P.; Xing, L.; Hung, M.-C.; Bonfiglio, T.; Hicks, D.G. The Expression Patterns of ER, PR, HER2, CK5/6, EGFR, Ki-67 and AR by Immunohistochemical Analysis in Breast Cancer Cell Lines. Breast Cancer Basic Clin. Res. 2010, 4, 117822341000400004. [Google Scholar] [CrossRef]
- Cai, C.; Portnoy, D.C.; Wang, H.; Jiang, X.; Chen, S.; Balk, S.P. Androgen Receptor Expression in Prostate Cancer Cells Is Suppressed by Activation of Epidermal Growth Factor Receptor and ErbB2. Cancer Res. 2009, 69, 5202–5209. [Google Scholar] [CrossRef] [PubMed]
- Lee, D.K.; Chang, C. Expression and Degradation of Androgen Receptor: Mechanism and Clinical Implication. J. Clin. Endocrinol. Metab. 2003, 88, 4043–4054. [Google Scholar] [CrossRef]
- Chetta, P.; Zadra, G. Metabolic Reprogramming as an Emerging Mechanism of Resistance to Endocrine Therapies in Prostate Cancer. Cancer Drug Resist. 2021, 4, 143. [Google Scholar] [CrossRef]
- Menendez, J.A.; Mehmi, I.; Papadimitropoulou, A.; Vander Steen, T.; Cuyàs, E.; Verdura, S.; Espinoza, I.; Vellon, L.; Atlas, E.; Lupu, R. Fatty Acid Synthase Is a Key Enabler for Endocrine Resistance in Heregulin-Overexpressing Luminal b-like Breast Cancer. Int. J. Mol. Sci. 2020, 21, 7661. [Google Scholar] [CrossRef]
- Schwartz-Roberts, J.L.; Cook, K.L.; Chen, C.; Shajahan-Haq, A.N.; Axelrod, M.; Wärri, A.; Riggins, R.B.; Jin, L.; Haddad, B.R.; Kallakury, B.V. Interferon Regulatory Factor-1 Signaling Regulates the Switch between Autophagy and Apoptosis to Determine Breast Cancer Cell Fate. Cancer Res. 2015, 75, 1046–1055. [Google Scholar] [CrossRef]
- Pion, E.; Narayan, V.; Eckert, M.; Ball, K.L. Role of the IRF-1 Enhancer Domain in Signalling Polyubiquitination and Degradation. Cell. Signal. 2009, 21, 1479–1487. [Google Scholar] [CrossRef]
- Andersen, P.; Pedersen, M.W.; Woetmann, A.; Villingshøj, M.; Stockhausen, M.; Ødum, N.; Poulsen, H.S. EGFR Induces Expression of IRF-1 via STAT1 and STAT3 Activation Leading to Growth Arrest of Human Cancer Cells. Int. J. Cancer 2008, 122, 342–349. [Google Scholar] [CrossRef] [PubMed]
- Stewart, M.D.; Choi, Y.; Johnson, G.A.; Yu-Lee, L.; Bazer, F.W.; Spencer, T.E. Roles of Stat1, Stat2, and Interferon Regulatory Factor-9 (IRF-9) in Interferon Tau Regulation of IRF-1. Biol. Reprod. 2002, 66, 393–400. [Google Scholar] [CrossRef]
- Zenke, K.; Muroi, M.; Tanamoto, K. IRF1 Supports DNA Binding of STAT1 by Promoting Its Phosphorylation. Immunol. Cell Biol. 2018, 96, 1095–1103. [Google Scholar] [CrossRef] [PubMed]
- Michalska, A.; Blaszczyk, K.; Wesoly, J.; Bluyssen, H.A. A Positive Feedback Amplifier Circuit That Regulates Interferon (IFN)-Stimulated Gene Expression and Controls Type I and Type II IFN Responses. Front. Immunol. 2018, 9, 1135. [Google Scholar] [CrossRef] [PubMed]
- Daub, H.; Ulrich Weiss, F.; Wallasch, C.; Ullrich, A. Role of Transactivation of the EGF Receptor in Signalling by G-Protein-Coupled Receptors. Nature 1996, 379, 557–560. [Google Scholar] [CrossRef] [PubMed]
- Waugh, D.J.; Wilson, C. The Interleukin-8 Pathway in Cancer. Clin. Cancer Res. 2008, 14, 6735–6741. [Google Scholar] [CrossRef] [PubMed]
- Gales, D.; Clark, C.; Manne, U.; Samuel, T. The Chemokine CXCL8 in Carcinogenesis and Drug Response. Int. Sch. Res. Not. 2013, 2013, 859154. [Google Scholar] [CrossRef]
- D’Ignazio, L.; Batie, M.; Rocha, S. Hypoxia and Inflammation in Cancer, Focus on HIF and NF-κB. Biomedicines 2017, 5, 21. [Google Scholar] [CrossRef]
- Rodríguez-García, A.; Samsó, P.; Fontova, P.; Simon-Molas, H.; Manzano, A.; Castaño, E.; Rosa, J.L.; Martinez-Outshoorn, U.; Ventura, F.; Navarro-Sabaté, À. TGF-Β1 Targets Smad, P38 MAPK, and PI3K/Akt Signaling Pathways to Induce PFKFB3 Gene Expression and Glycolysis in Glioblastoma Cells. FEBS J. 2017, 284, 3437–3454. [Google Scholar] [CrossRef]
- Fernandes, M.T.; Calado, S.M.; Mendes-Silva, L.; Bragança, J. CITED2 and the Modulation of the Hypoxic Response in Cancer. World J. Clin. Oncol. 2020, 11, 260. [Google Scholar] [CrossRef]
- Jiang, Y.-X.; Siu, M.K.; Wang, J.-J.; Leung, T.H.; Chan, D.W.; Cheung, A.N.; Ngan, H.Y.; Chan, K.K. PFKFB3 Regulates Chemoresistance, Metastasis and Stemness via IAP Proteins and the NF-κB Signaling Pathway in Ovarian Cancer. Front. Oncol. 2022, 12, 748403. [Google Scholar] [CrossRef] [PubMed]
- Makena, M.R.; Rao, R. Subtype Specific Targeting of Calcium Signaling in Breast Cancer. Cell Calcium 2020, 85, 102109. [Google Scholar] [CrossRef] [PubMed]
- Jeong, J.; Shin, J.H.; Li, W.; Hong, J.Y.; Lim, J.; Hwang, J.Y.; Chung, J.-J.; Yan, Q.; Liu, Y.; Choi, J. MAL2 Mediates the Formation of Stable HER2 Signaling Complexes within Lipid Raft-Rich Membrane Protrusions in Breast Cancer Cells. Cell Rep. 2021, 37, 110160. [Google Scholar] [CrossRef] [PubMed]
- Liu, H.; Chen, Y.-G. The Interplay between TGF-β Signaling and Cell Metabolism. Front. Cell Dev. Biol. 2022, 10, 846723. [Google Scholar] [CrossRef] [PubMed]
- Wang, S.E.; Xiang, B.; Zent, R.; Quaranta, V.; Pozzi, A.; Arteaga, C.L. Transforming Growth Factor β Induces Clustering of HER2 and Integrins by Activating Src-Focal Adhesion Kinase and Receptor Association to the Cytoskeleton. Cancer Res. 2009, 69, 475–482. [Google Scholar] [CrossRef] [PubMed]
- Ha, H.; Debnath, B.; Neamati, N. Role of the CXCL8-CXCR1/2 Axis in Cancer and Inflammatory Diseases. Theranostics 2017, 7, 1543. [Google Scholar] [CrossRef] [PubMed]
- Xiong, X.; Liao, X.; Qiu, S.; Xu, H.; Zhang, S.; Wang, S.; Ai, J.; Yang, L. CXCL8 in Tumor Biology and Its Implications for Clinical Translation. Front. Mol. Biosci. 2022, 9, 723846. [Google Scholar] [CrossRef] [PubMed]
- Tafani, M.; Pucci, B.; Russo, A.; Schito, L.; Pellegrini, L.; Perrone, G.A.; Villanova, L.; Salvatori, L.; Ravenna, L.; Petrangeli, E. Modulators of HIF1α and NFkB in Cancer Treatment: Is It a Rational Approach for Controlling Malignant Progression? Front. Pharmacol. 2013, 4, 13. [Google Scholar] [CrossRef]
- Zhang, Y.; Zhang, H.; Wang, M.; Schmid, T.; Xin, Z.; Kozhuharova, L.; Yu, W.-K.; Huang, Y.; Cai, F.; Biskup, E. Hypoxia in Breast Cancer—Scientific Translation to Therapeutic and Diagnostic Clinical Applications. Front. Oncol. 2021, 11, 652266. [Google Scholar] [CrossRef]
- Benci, J.L.; Xu, B.; Qiu, Y.; Wu, T.J.; Dada, H.; Twyman-Saint Victor, C.; Cucolo, L.; Lee, D.S.; Pauken, K.E.; Huang, A.C. Tumor Interferon Signaling Regulates a Multigenic Resistance Program to Immune Checkpoint Blockade. Cell 2016, 167, 1540–1554. [Google Scholar] [CrossRef] [PubMed]
- Schwartz, J.; Shajahan, A.; Clarke, R. The Role of Interferon Regulatory Factor-1 (IRF1) in Overcoming Antiestrogen Resistance in the Treatment of Breast Cancer. Int. J. Breast Cancer 2011, 2011, 912102. [Google Scholar] [CrossRef] [PubMed]
- Alsamman, K.; El-Masry, O.S. Interferon Regulatory Factor 1 Inactivation in Human Cancer. Biosci. Rep. 2018, 38, BSR20171672. [Google Scholar] [CrossRef] [PubMed]
Disclaimer/Publisher’s Note: The statements, opinions and data contained in all publications are solely those of the individual author(s) and contributor(s) and not of MDPI and/or the editor(s). MDPI and/or the editor(s) disclaim responsibility for any injury to people or property resulting from any ideas, methods, instructions or products referred to in the content. |
© 2024 by the authors. Licensee MDPI, Basel, Switzerland. This article is an open access article distributed under the terms and conditions of the Creative Commons Attribution (CC BY) license (https://creativecommons.org/licenses/by/4.0/).
Share and Cite
Mukund, K.; Alva-Ornelas, J.A.; Maddox, A.L.; Murali, D.; Veraksa, D.; Saftics, A.; Tomsic, J.; Frankhouser, D.; Razo, M.; Jovanovic-Talisman, T.; et al. Molecular Atlas of HER2+ Breast Cancer Cells Treated with Endogenous Ligands: Temporal Insights into Mechanisms of Trastuzumab Resistance. Cancers 2024, 16, 553. https://doi.org/10.3390/cancers16030553
Mukund K, Alva-Ornelas JA, Maddox AL, Murali D, Veraksa D, Saftics A, Tomsic J, Frankhouser D, Razo M, Jovanovic-Talisman T, et al. Molecular Atlas of HER2+ Breast Cancer Cells Treated with Endogenous Ligands: Temporal Insights into Mechanisms of Trastuzumab Resistance. Cancers. 2024; 16(3):553. https://doi.org/10.3390/cancers16030553
Chicago/Turabian StyleMukund, Kavitha, Jackelyn A. Alva-Ornelas, Adam L. Maddox, Divya Murali, Darya Veraksa, Andras Saftics, Jerneja Tomsic, David Frankhouser, Meagan Razo, Tijana Jovanovic-Talisman, and et al. 2024. "Molecular Atlas of HER2+ Breast Cancer Cells Treated with Endogenous Ligands: Temporal Insights into Mechanisms of Trastuzumab Resistance" Cancers 16, no. 3: 553. https://doi.org/10.3390/cancers16030553