
Anatomical Quantitative Volumetric Evaluation of Liver Segments in Hepatocellular Carcinoma Patients Treated with Selective Internal Radiation Therapy: Key Parameters Influencing Untreated Liver Hypertrophy

 , , , , ,
  ,
,
Abstract
Simple Summary
Abstract
1. Introduction
2. Materials and Methods
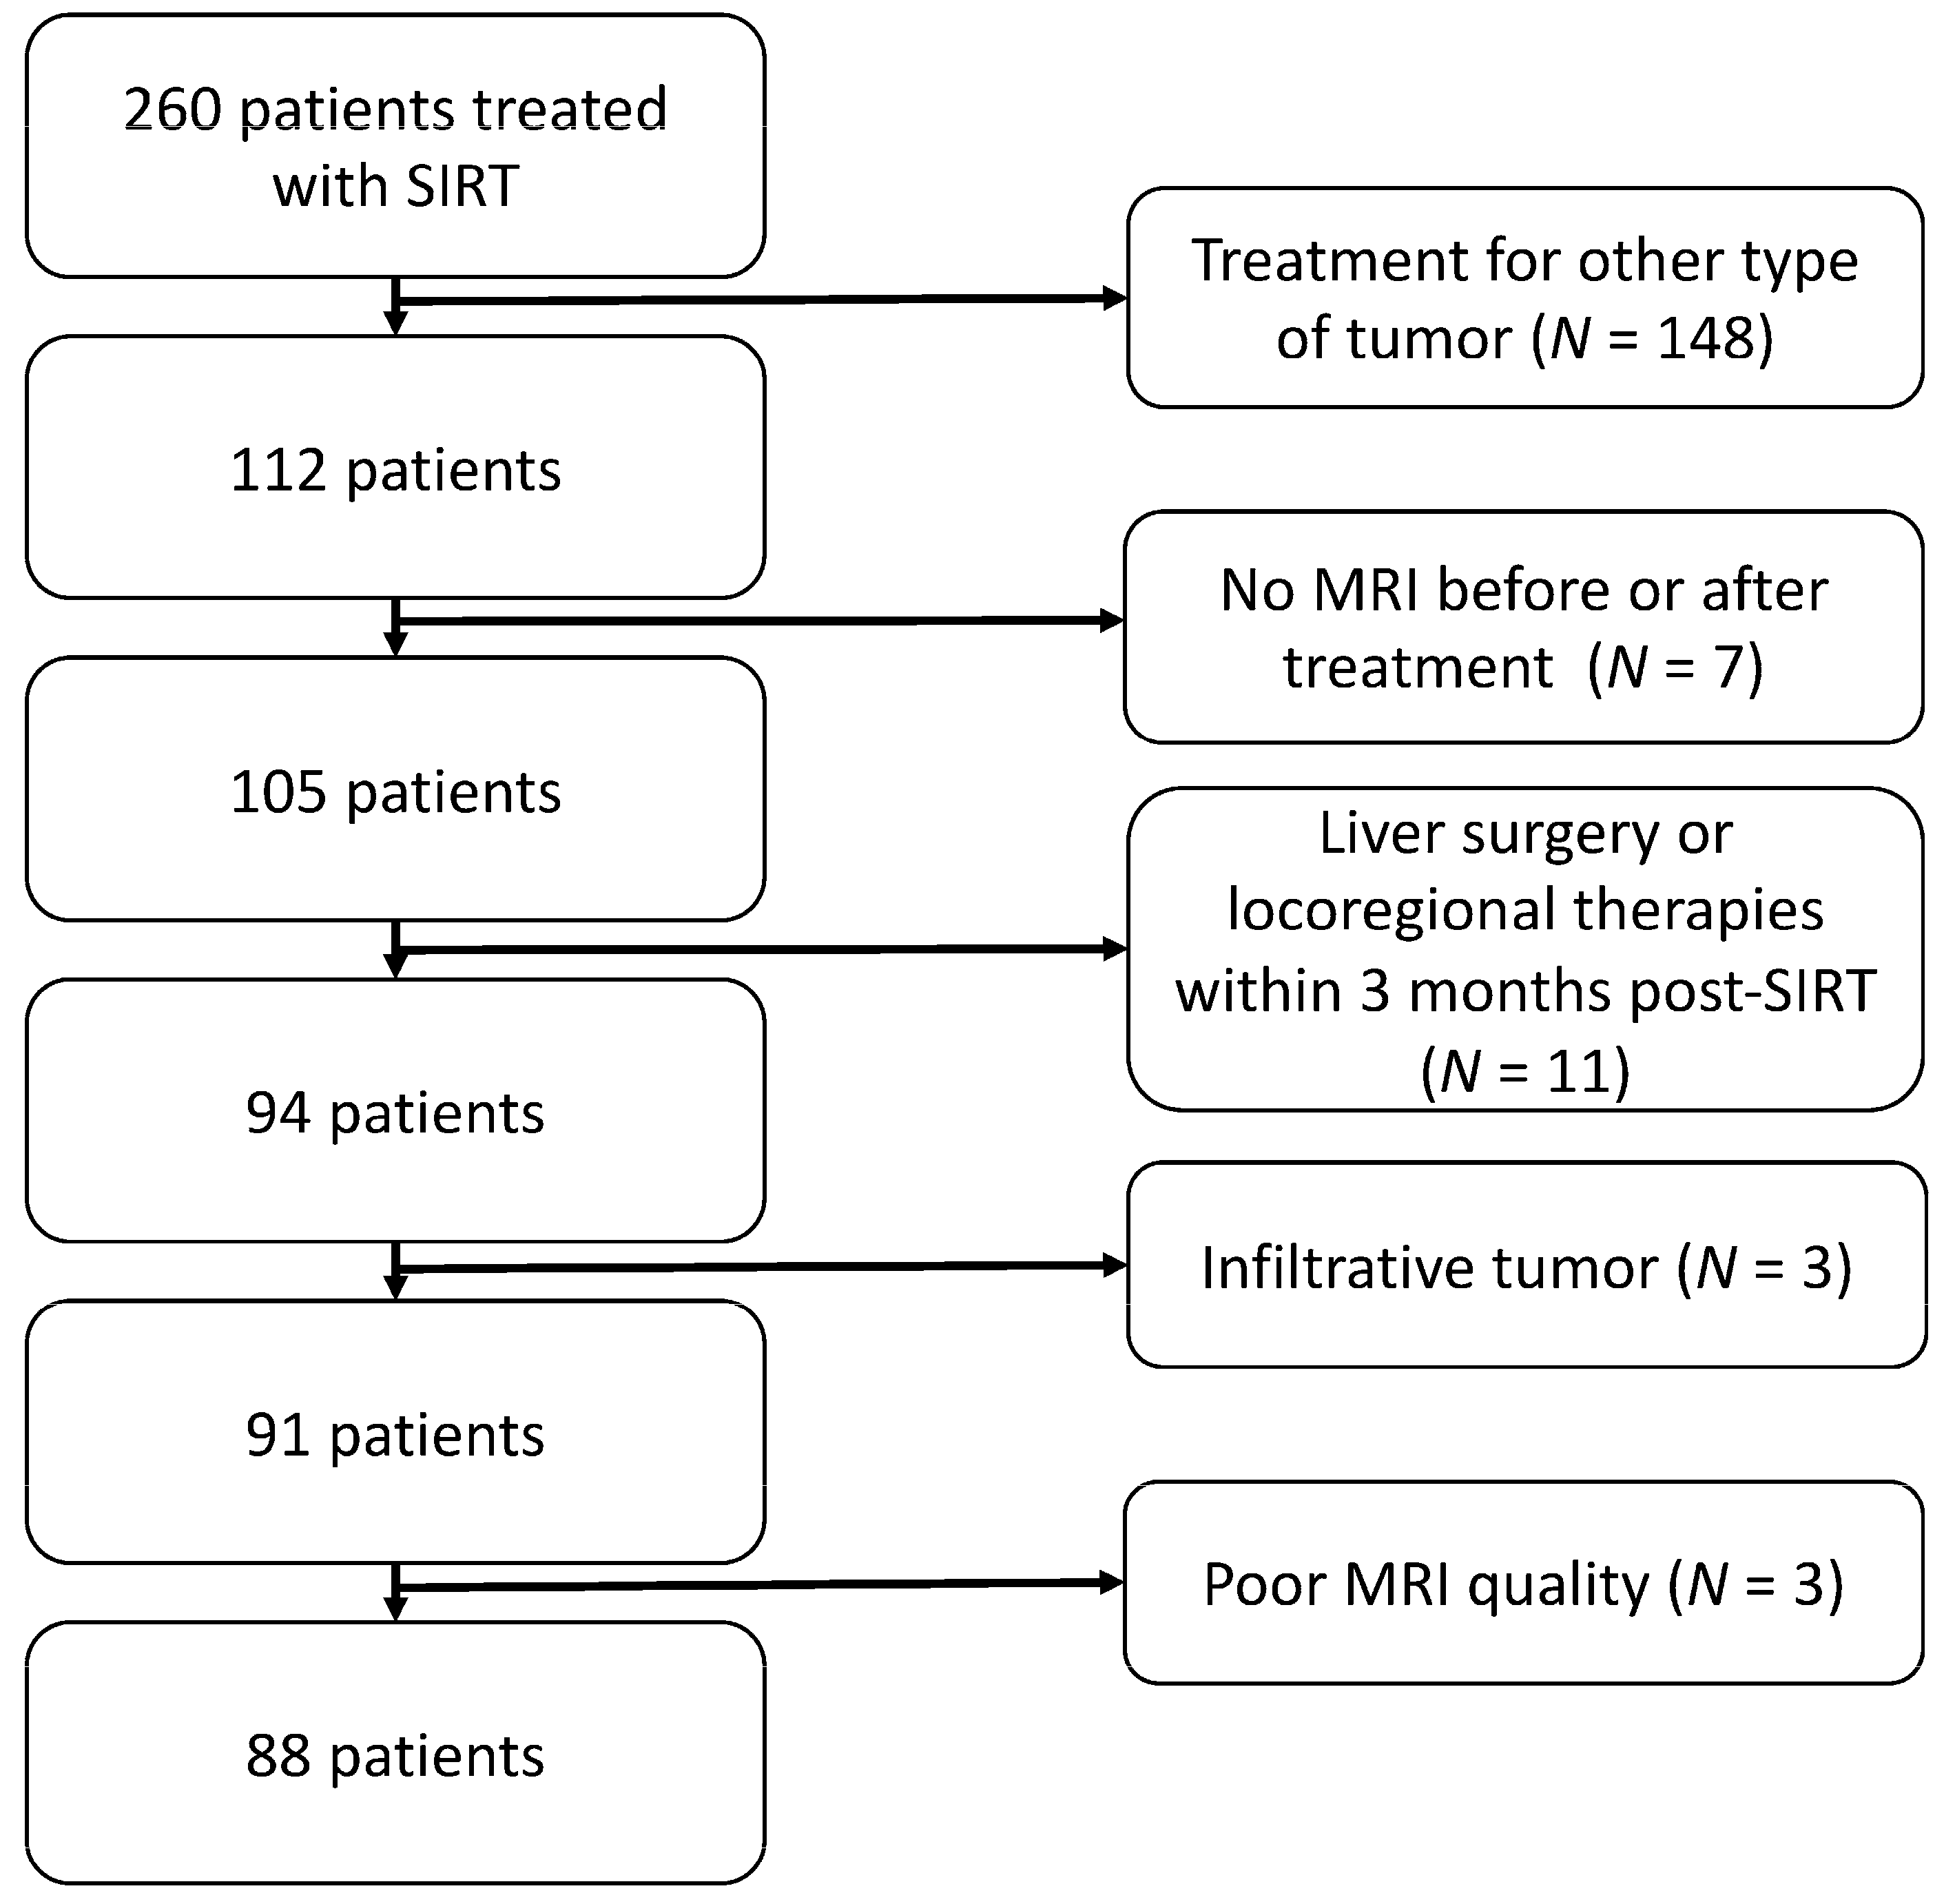
2.1. Study Design
2.2. Data Collection
2.3. Treatment
2.4. MRI
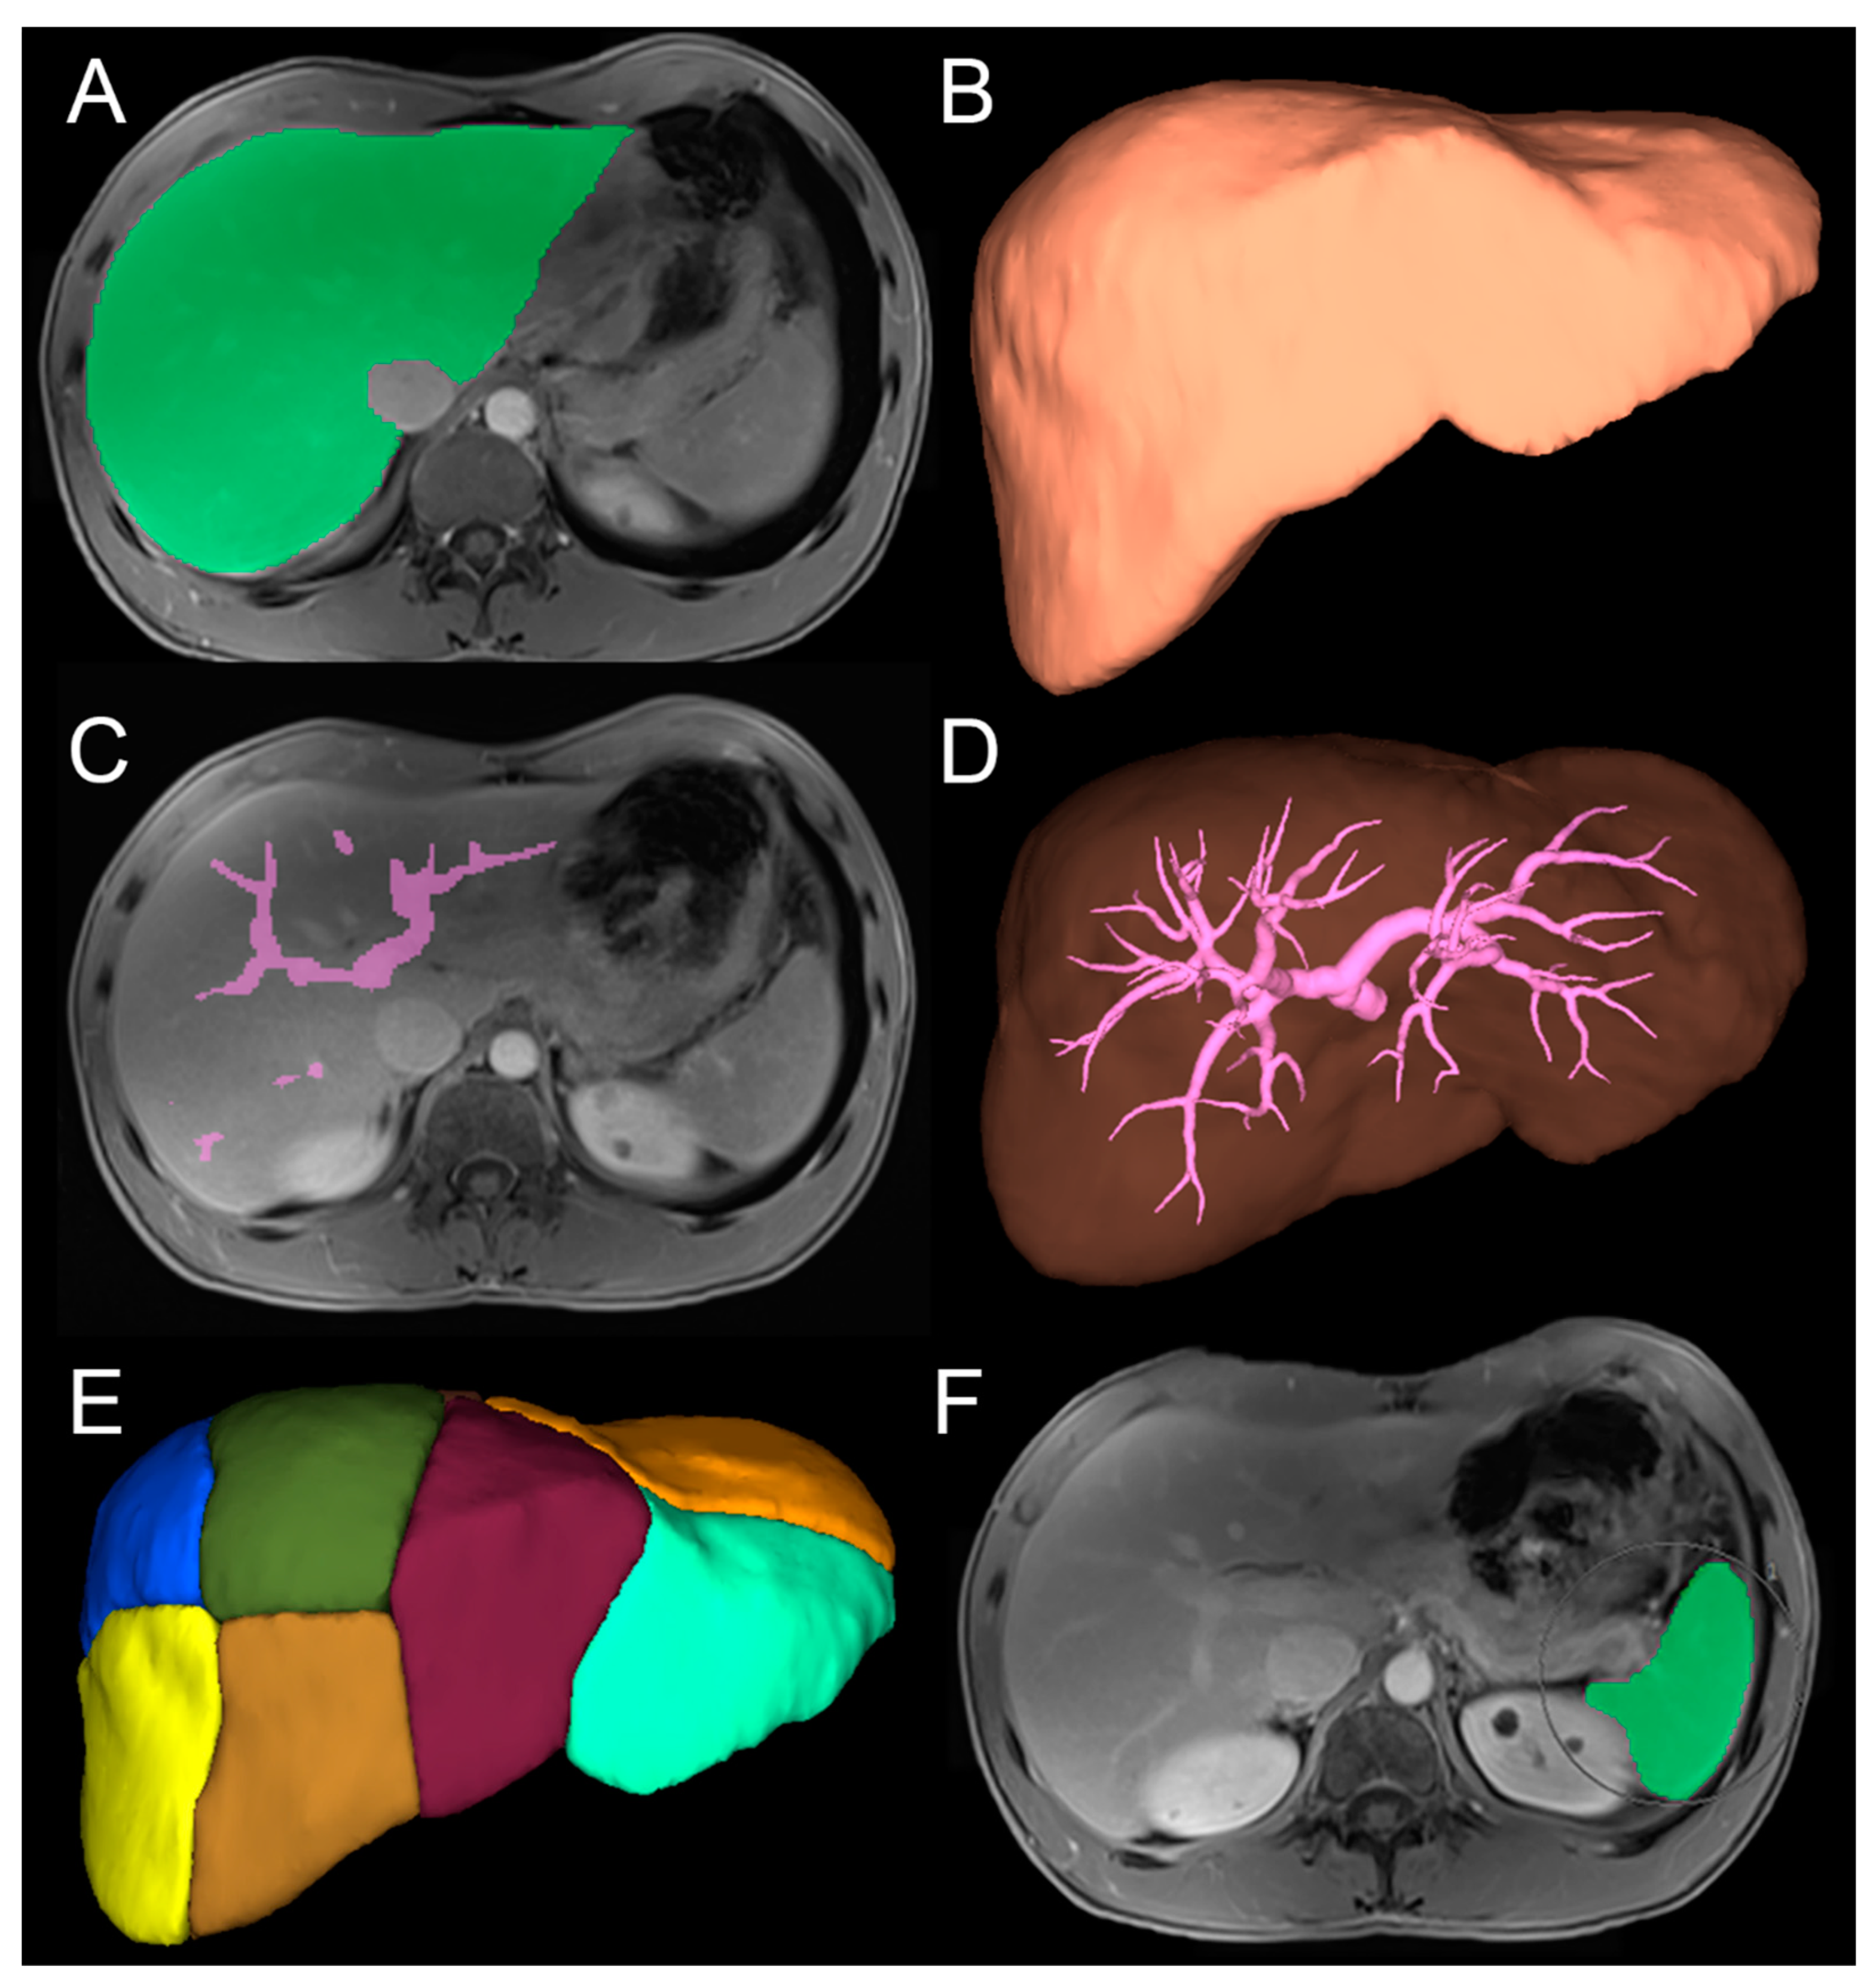
2.5. Image Analysis
2.5.1. Three-Dimensional Quantitative Analysis
2.5.2. Two-Dimensional Qualitative Analysis
2.6. Statistical Analysis
3. Results
3.1. Three-Dimensional Quantitative Analysis of Individual Liver Segments
3.2. Three-Dimensional Quantitative Analysis of Liver, Spleen, and Tumor
3.3. Factors Influencing Volumetric Changes
3.3.1. Clinical Parameters
3.3.2. Liver Function
3.3.3. Dosimetric Parameters
3.3.4. Glass versus Resin Microspheres
3.3.5. Amount of Treated Liver
3.3.6. Portal Vein Thrombosis
3.3.7. Tumor and Spleen
4. Discussion
5. Conclusions
Supplementary Materials
Author Contributions
Funding
Institutional Review Board Statement
Informed Consent Statement
Data Availability Statement
Acknowledgments
Conflicts of Interest
Abbreviations
References
- Gaba, R.C.; Lewandowski, R.J.; Kulik, L.M.; Riaz, A.; Ibrahim, S.M.; Mulcahy, M.F.; Ryu, R.K.; Sato, K.T.; Gates, V.; Abecassis, M.M.; et al. Radiation lobectomy: Preliminary findings of hepatic volumetric response to lobar yttrium-90 radioembolization. Ann. Surg. Oncol. 2009, 16, 1587–1596. [Google Scholar] [CrossRef] [PubMed]
- Edeline, J.; Lenoir, L.; Boudjema, K.; Rolland, Y.; Boulic, A.; Le Du, F.; Pracht, M.; Raoul, J.L.; Clement, B.; Garin, E.; et al. Volumetric changes after (90)y radioembolization for hepatocellular carcinoma in cirrhosis: An option to portal vein embolization in a preoperative setting? Ann. Surg. Oncol. 2013, 20, 2518–2525. [Google Scholar] [CrossRef] [PubMed]
- Vouche, M.; Lewandowski, R.J.; Atassi, R.; Memon, K.; Gates, V.L.; Ryu, R.K.; Gaba, R.C.; Mulcahy, M.F.; Baker, T.; Sato, K.; et al. Radiation lobectomy: Time-dependent analysis of future liver remnant volume in unresectable liver cancer as a bridge to resection. J. Hepatol. 2013, 59, 1029–1036. [Google Scholar] [CrossRef] [PubMed]
- Fernandez-Ros, N.; Silva, N.; Bilbao, J.I.; Inarrairaegui, M.; Benito, A.; D’Avola, D.; Rodriguez, M.; Rotellar, F.; Pardo, F.; Sangro, B. Partial liver volume radioembolization induces hypertrophy in the spared hemiliver and no major signs of portal hypertension. HPB 2014, 16, 243–249. [Google Scholar] [CrossRef] [PubMed]
- Theysohn, J.M.; Ertle, J.; Muller, S.; Schlaak, J.F.; Nensa, F.; Sipilae, S.; Bockisch, A.; Lauenstein, T.C. Hepatic volume changes after lobar selective internal radiation therapy (SIRT) of hepatocellular carcinoma. Clin. Radiol. 2014, 69, 172–178. [Google Scholar] [CrossRef] [PubMed]
- Goebel, J.; Sulke, M.; Lazik-Palm, A.; Goebel, T.; Dechene, A.; Bellendorf, A.; Mueller, S.; Umutlu, L.; Theysohn, J. Factors associated with contralateral liver hypertrophy after unilateral radioembolization for hepatocellular carcinoma. PLoS ONE 2017, 12, e0181488. [Google Scholar] [CrossRef]
- Palard, X.; Edeline, J.; Rolland, Y.; Le Sourd, S.; Pracht, M.; Laffont, S.; Lenoir, L.; Boudjema, K.; Ugen, T.; Brun, V.; et al. Dosimetric parameters predicting contralateral liver hypertrophy after unilobar radioembolization of hepatocellular carcinoma. Eur. J. Nucl. Med. Mol. Imaging 2018, 45, 392–401. [Google Scholar] [CrossRef]
- Orcutt, S.T.; Abuodeh, Y.; Naghavi, A.; Frakes, J.; Hoffe, S.; Kis, B.; Anaya, D.A. Kinetic analysis of contralateral liver hypertrophy after radioembolization of primary and metastatic liver tumors. Surgery 2018, 163, 1020–1027. [Google Scholar] [CrossRef]
- Grisanti, F.; Prieto, E.; Bastidas, J.F.; Sancho, L.; Rodrigo, P.; Beorlegui, C.; Inarrairaegui, M.; Bilbao, J.I.; Sangro, B.; Rodriguez-Fraile, M. 3D voxel-based dosimetry to predict contralateral hypertrophy and an adequate future liver remnant after lobar radioembolization. Eur. J. Nucl. Med. Mol. Imaging 2021, 48, 3048–3057. [Google Scholar] [CrossRef]
- Teo, J.Y.; Allen, J.C., Jr.; Ng, D.C.; Choo, S.P.; Tai, D.W.; Chang, J.P.; Cheah, F.K.; Chow, P.K.; Goh, B.K. A systematic review of contralateral liver lobe hypertrophy after unilobar selective internal radiation therapy with Y90. HPB 2016, 18, 7–12. [Google Scholar] [CrossRef]
- Garlipp, B.; de Baere, T.; Damm, R.; Irmscher, R.; van Buskirk, M.; Stubs, P.; Deschamps, F.; Meyer, F.; Seidensticker, R.; Mohnike, K.; et al. Left-liver hypertrophy after therapeutic right-liver radioembolization is substantial but less than after portal vein embolization. Hepatology 2014, 59, 1864–1873. [Google Scholar] [CrossRef]
- Nosher, J.L.; Ohman-Strickland, P.A.; Jabbour, S.; Narra, V.; Nosher, B. Changes in liver and spleen volumes and liver function after radioembolization with yttrium-90 resin microspheres. J. Vasc. Interv. Radiol. 2011, 22, 1706–1713. [Google Scholar] [CrossRef]
- Ahmadzadehfar, H.; Meyer, C.; Ezziddin, S.; Sabet, A.; Hoff-Meyer, A.; Muckle, M.; Logvinski, T.; Schild, H.H.; Biersack, H.J.; Wilhelm, K. Hepatic volume changes induced by radioembolization with 90Y resin microspheres. A single-centre study. Eur. J. Nucl. Med. Mol. Imaging 2013, 40, 80–90. [Google Scholar] [CrossRef]
- Jakobs, T.F.; Saleem, S.; Atassi, B.; Reda, E.; Lewandowski, R.J.; Yaghmai, V.; Miller, F.; Ryu, R.K.; Ibrahim, S.; Sato, K.T.; et al. Fibrosis, portal hypertension, and hepatic volume changes induced by intra-arterial radiotherapy with 90yttrium microspheres. Dig. Dis. Sci. 2008, 53, 2556–2563. [Google Scholar] [CrossRef]
- Paprottka, P.M.; Schmidt, G.P.; Trumm, C.G.; Hoffmann, R.T.; Reiser, M.F.; Jakobs, T.F. Changes in normal liver and spleen volume after radioembolization with (90)Y-resin microspheres in metastatic breast cancer patients: Findings and clinical significance. Cardiovasc. Intervent. Radiol. 2011, 34, 964–972. [Google Scholar] [CrossRef]
- Teo, J.Y.; Goh, B.K.; Cheah, F.K.; Allen, J.C.; Lo, R.H.; Ng, D.C.; Goh, A.S.; Khor, A.Y.; Sim, H.S.; Ng, J.J.; et al. Underlying liver disease influences volumetric changes in the spared hemiliver after selective internal radiation therapy with 90Y in patients with hepatocellular carcinoma. J. Dig. Dis. 2014, 15, 444–450. [Google Scholar] [CrossRef] [PubMed]
- Chernyak, V.; Fowler, K.J.; Kamaya, A.; Kielar, A.Z.; Elsayes, K.M.; Bashir, M.R.; Kono, Y.; Do, R.K.; Mitchell, D.G.; Singal, A.G.; et al. Liver Imaging Reporting and Data System (LI-RADS) Version 2018: Imaging of Hepatocellular Carcinoma in At-Risk Patients. Radiology 2018, 289, 816–830. [Google Scholar] [CrossRef] [PubMed]
- Kennedy, A.; Nag, S.; Salem, R.; Murthy, R.; McEwan, A.J.; Nutting, C.; Benson, A., 3rd; Espat, J.; Bilbao, J.I.; Sharma, R.A.; et al. Recommendations for radioembolization of hepatic malignancies using yttrium-90 microsphere brachytherapy: A consensus panel report from the radioembolization brachytherapy oncology consortium. Int. J. Radiat. Oncol. Biol. Phys. 2007, 68, 13–23. [Google Scholar] [CrossRef] [PubMed]
- Lau, W.-Y.; Kennedy, A.S.; Kim, Y.H.; Lai, H.K.; Lee, R.-C.; Leung, T.W.T.; Liu, C.-S.; Salem, R.; Sangro, B.; Shuter, B.; et al. Patient Selection and Activity Planning Guide for Selective Internal Radiotherapy With Yttrium-90 Resin Microspheres. Int. J. Radiat. Oncol. Biol. Phys. 2012, 82, 401–407. [Google Scholar] [CrossRef]
- Denys, A.; Pracht, M.; Duran, R.; Guiu, B.; Adib, S.; Boubaker, A.; Bize, P. How to Prepare a Patient for Transarterial Radioembolization? A Practical Guide. Cardiovasc. Intervent. Radiol. 2015, 38, 794–805. [Google Scholar] [CrossRef] [PubMed]
- Weber, M.; Lam, M.; Chiesa, C.; Konijnenberg, M.; Cremonesi, M.; Flamen, P.; Gnesin, S.; Bodei, L.; Kracmerova, T.; Luster, M.; et al. EANM procedure guideline for the treatment of liver cancer and liver metastases with intra-arterial radioactive compounds. Eur. J. Nucl. Med. Mol. Imaging 2022, 49, 1682–1699. [Google Scholar] [CrossRef] [PubMed]
- Salem, R.; Padia, S.A.; Lam, M.; Chiesa, C.; Haste, P.; Sangro, B.; Toskich, B.; Fowers, K.; Herman, J.M.; Kappadath, S.C.; et al. Clinical, dosimetric, and reporting considerations for Y-90 glass microspheres in hepatocellular carcinoma: Updated 2022 recommendations from an international multidisciplinary working group. Eur. J. Nucl. Med. Mol. Imaging 2023, 50, 328–343. [Google Scholar] [CrossRef] [PubMed]
- Ariizumi, S.; Takahashi, Y.; Kotera, Y.; Omori, A.; Yoneda, G.; Mu, H.; Katagiri, S.; Egawa, H.; Yamamoto, M. Novel virtual hepatectomy is useful for evaluation of the portal territory for anatomical sectionectomy, segmentectomy, and hemihepatectomy. J. Hepatobiliary Pancreat. Sci. 2013, 20, 396–402. [Google Scholar] [CrossRef] [PubMed]
- Mise, Y.; Hasegawa, K.; Satou, S.; Shindoh, J.; Miki, K.; Akamatsu, N.; Arita, J.; Kaneko, J.; Sakamoto, Y.; Kokudo, N. How Has Virtual Hepatectomy Changed the Practice of Liver Surgery?: Experience of 1194 Virtual Hepatectomy Before Liver Resection and Living Donor Liver Transplantation. Ann. Surg. 2018, 268, 127–133. [Google Scholar] [CrossRef] [PubMed]
- Tang, C.; Chen, H.; Jiang, L.; Liu, L. Liver Regeneration: Changes in Oxidative Stress, Immune System, Cytokines, and Epigenetic Modifications Associated with Aging. Oxid. Med. Cell. Longev. 2022, 2022, 9018811. [Google Scholar] [CrossRef] [PubMed]
- Fernandez-Ros, N.; Inarrairaegui, M.; Paramo, J.A.; Berasain, C.; Avila, M.A.; Chopitea, A.; Varo, N.; Sarobe, P.; Bilbao, J.I.; Dominguez, I.; et al. Radioembolization of hepatocellular carcinoma activates liver regeneration, induces inflammation and endothelial stress and activates coagulation. Liver Int. 2015, 35, 1590–1596. [Google Scholar] [CrossRef]
- Van Der Gucht, A.; Jreige, M.; Denys, A.; Blanc-Durand, P.; Boubaker, A.; Pomoni, A.; Mitsakis, P.; Silva-Monteiro, M.; Gnesin, S.; Lalonde, M.N.; et al. Resin Versus Glass Microspheres for (90)Y Transarterial Radioembolization: Comparing Survival in Unresectable Hepatocellular Carcinoma Using Pretreatment Partition Model Dosimetry. J. Nucl. Med. 2017, 58, 1334–1340. [Google Scholar] [CrossRef]
- Gabr, A.; Riaz, A.; Mouli, S.; Desai, K.; Thornburg, B.; Salem, R.; Lewandowski, R.J. Modified Radiation Lobectomy: An Evolving Paradigm to Convert Patients to Liver Resection Candidacy. Semin. Intervent. Radiol. 2019, 36, 343–348. [Google Scholar] [CrossRef]

| Characteristic | Number of Patients (%) |
|---|---|
| Sex Male Female | 76 (86) 12 (14) |
| Age | 67 (median, range 17–87) |
| Cirrhosis Present Absent | 81 (92) 7 (8) |
| Cirrhosis Etiology Alcohol consumption Hepatitis C virus (HCV) Hepatitis B virus Non-alcoholic steatohepatitis Alcohol consumption + HCV Miscellaneous Unknown | 33 (38) 13 (15) 3 (3) 7 (8) 12 (14) 16 (18) 4 (4) |
| HCC diagnosis Biopsy Imaging | 44 (50) 44 (50) |
| Portal vein thrombosis Present Main portal Right/left portal Segmental or subsegmental Absent | 42 (48) 8 (9) 13 (15) 21 (24) 46 (52) |
| ECOG Performance Status 0 1 2 | 76 (86) 10 (11) 2 (2) |
| Child-Pugh class A B | 74 (84) 14 (16) |
| Tumor burden Unilobar Bilobar Solitary Multiple | 59 (67) 29 (33) 51 (58) 37 (42) |
| Number of tumors 1 2 ≥3 | 41 (46) 20 (23) 27 (31) |
| SIRT type Whole liver Right/left liver Right/left lobe Anterior/posterior sector Segmental/subsegmental | 11 (13) 38 (43) 11(13) 6 (6) 22 (25) |
| 90Y-microspheres | |
| Glass | 57 (65) |
| Resin Unknown | 30 (34) 1 (1) |
| Administered activity per patient (GBq) | |
| Mean Median | 1.9 (95% CI, 1.7–2.1) 1.5 (range, 0.2–3.5) |
| Activity to tumor (GBq) Mean Median | 1 (95% CI, 0.9–1.1) 1 (range, 0.2–3.1) |
| Dose to tumor (Gy) Mean Median | 329.8 (95% CI, 291.2–368.3) 308.6 (range, 93.5–903) |
| Activity to liver (GBq) Mean Median | 0.9 (95% CI, 0.8–1) 1 (range, 0.2–1.7) |
| Dose to liver (Gy) Mean Median | 98.3 (95% CI, 71.7–125) 50.3 (range, 7.7–597.7) |
| SIRT | Absolute Median Volume in [mL—Range] | p-Value | ||||||||
|---|---|---|---|---|---|---|---|---|---|---|
| Baseline | 3 Months | 6 Months | 12 Months | Baseline–3 Months | Baseline–6 Months | Baseline–12 Months | 3–6 Months | 6–12 Months | ||
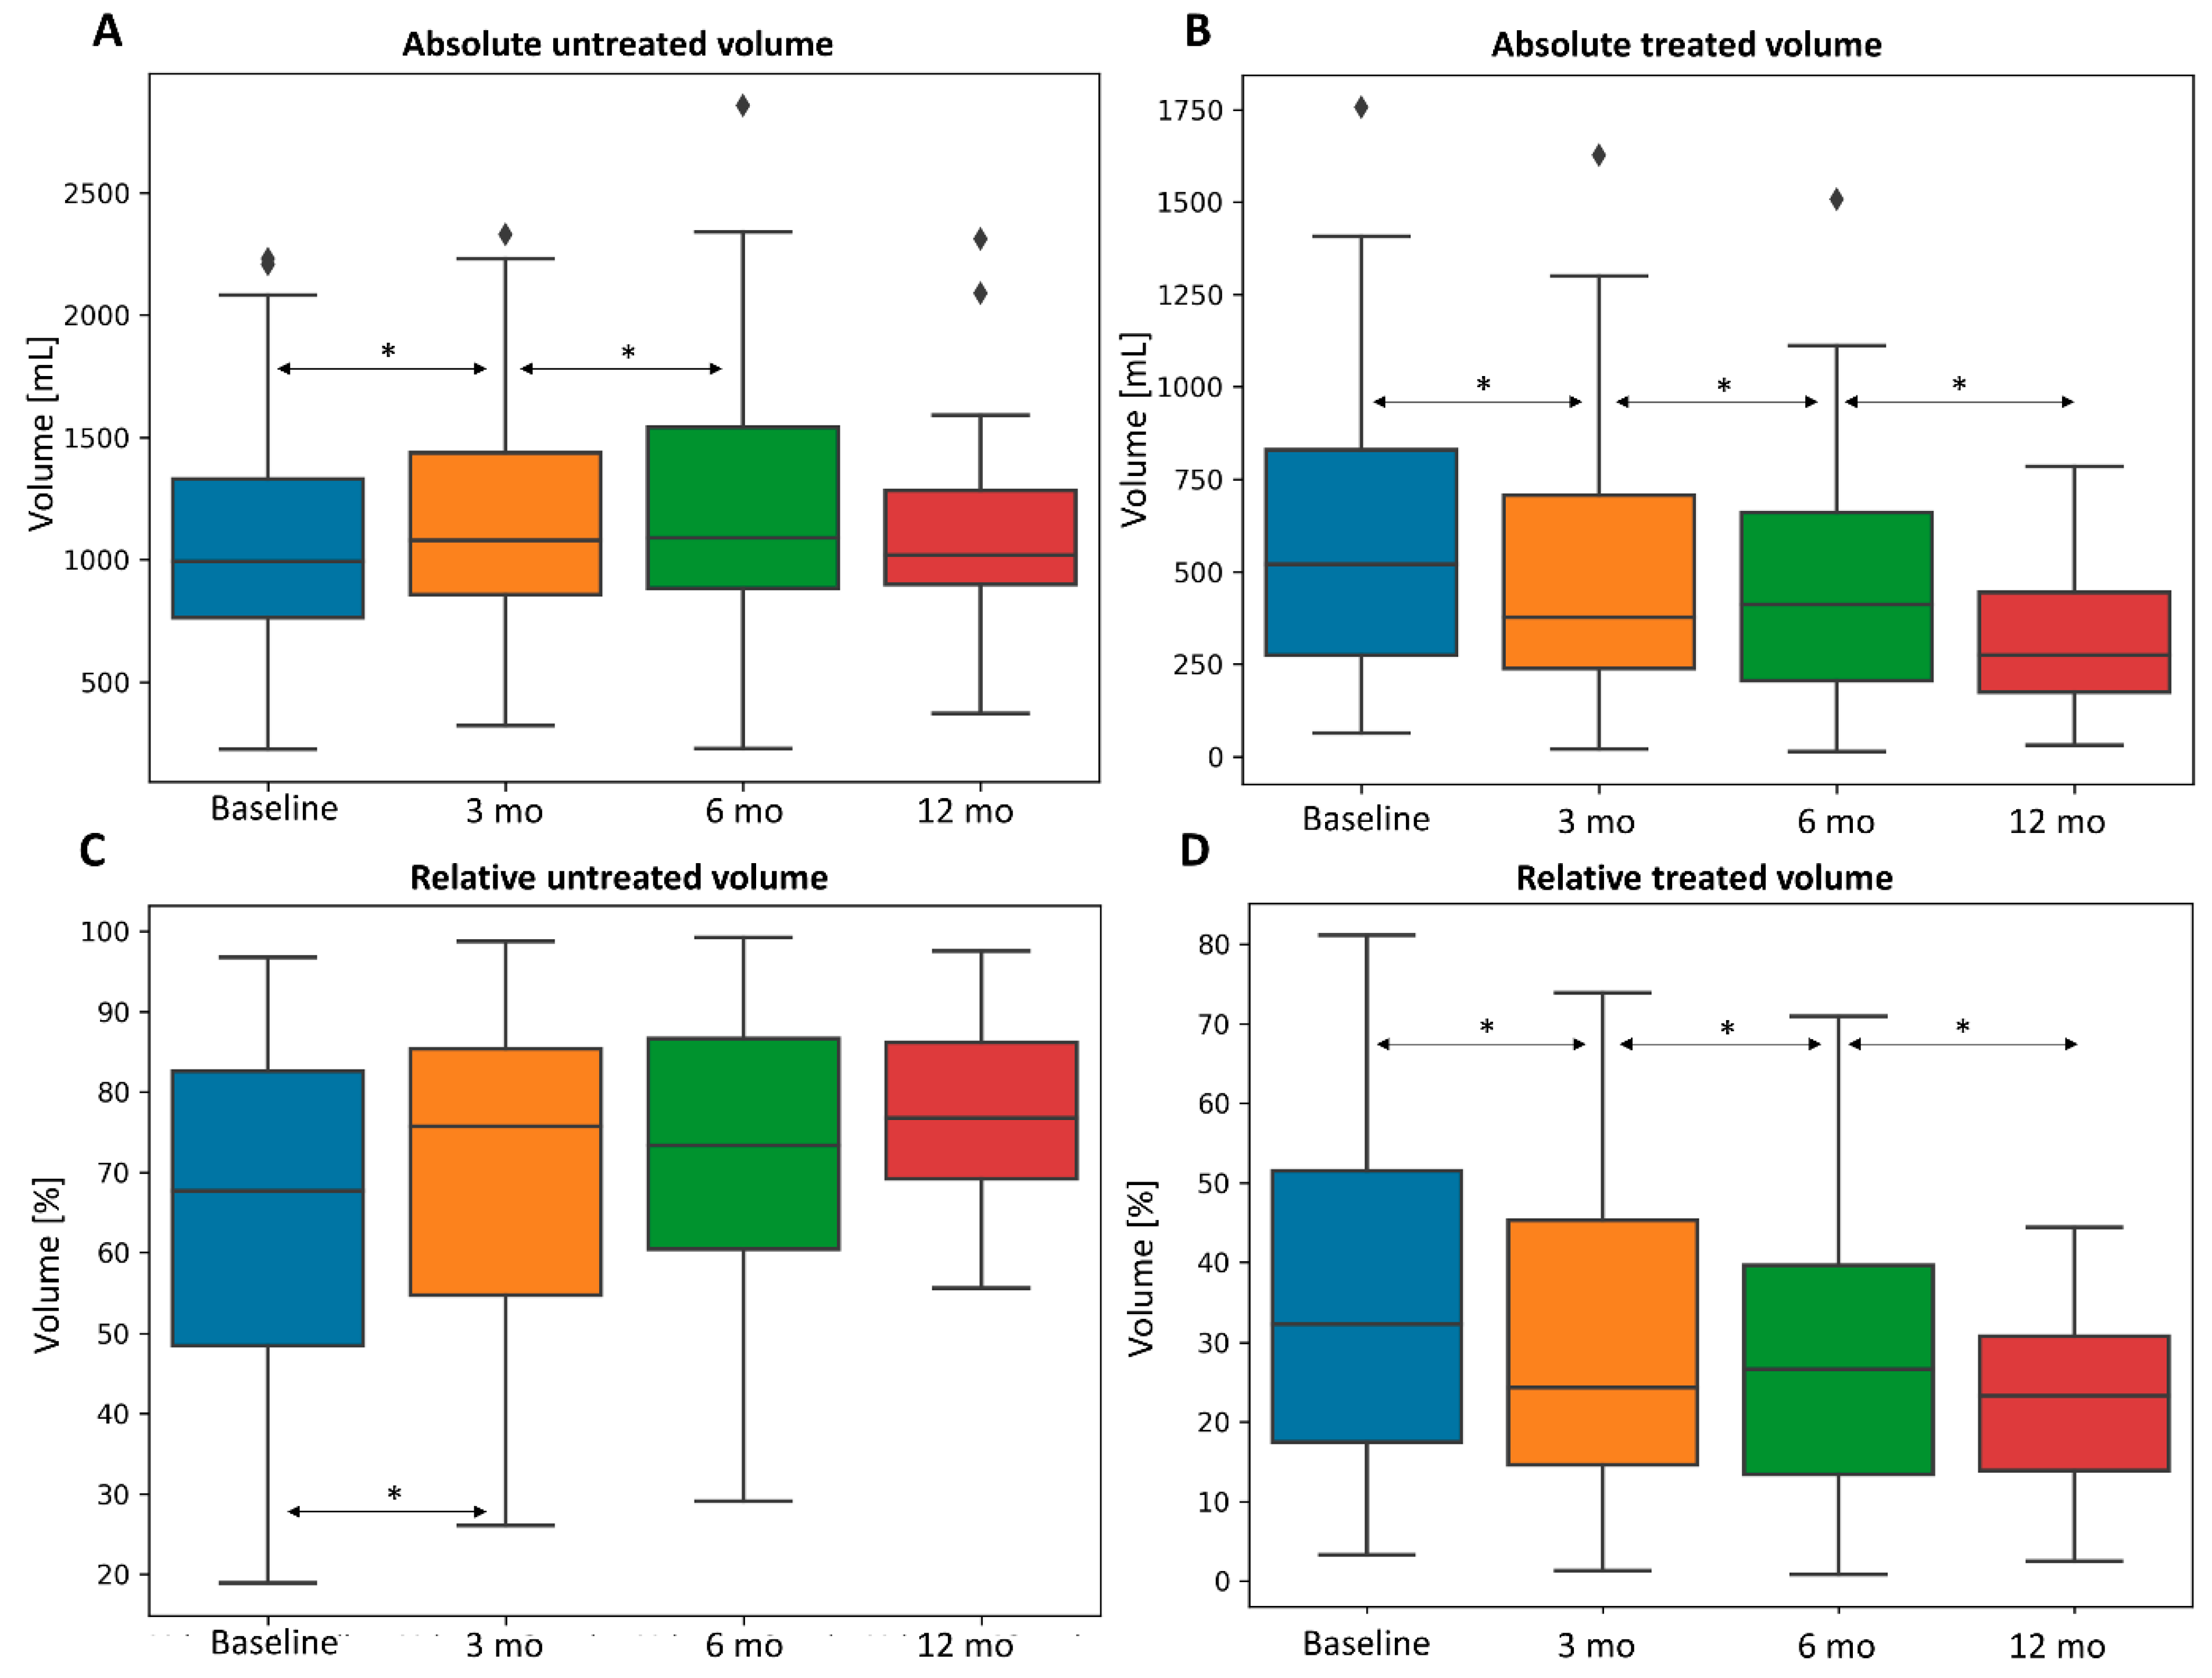
| All (n = 88) | Treated | 610 (63–2749) | 521 (20–2223) | 492 (13–1522) | 278 (30–1206) | <0.001 | <0.001 | <0.001 | <0.001 | <0.001 |
| Untreated | 974 (224–2230) | 1041 (320–2329) | 1082 (227–2857) | 1019 (371–2311 | <0.001 | 0.002 | 0.005 | 0.033 | 0.733 | |
| Spleen | 400 (128–1681) | 454 (156–1673) | 449 (153–1680) | 388 (154–1233) | <0.001 | 0.006 | 0.046 | 0.684 | 0.498 | |
| Tumor | 52 (1–1675) | 48 (1–2264) | 16 (1–1287) | 10 (1–96) | 0.199 | 0.008 | <0.001 | 0.002 | 0.03 | |
| Whole liver(n = 11) | Treated | 1530 (1176–2749) | 1474 (986–2223) | 1396 (1296–1522) | 1206 (1206–1206) | 0.037 | 0.125 | 1 | 0.125 | 1 |
| Spleen | 306 (155–1415) | 539 (188–1138) | 533 (407–711) | 627 (627–627) | 0.193 | 0.625 | 1 | 0.625 | 1 | |
| Tumor | 229 (17–1675) | 114 (1–1508) | 10 (3–63) | 14 (14–14) | 0.02 | 0.25 | 1 | 0.655 | 1 | |
| Right/left liver and lobe (n = 49) | Treated | 788 (246–1756) | 623 (233–1627) | 533 (196–1507) | 395 (172–785) | <0.001 | <0.001 | <0.001 | <0.001 | <0.001 |
| Untreated | 820 (287–1887) | 958 (320–2191) | 1003 (227–2120) | 984 (371–1591) | <0.001 | <0.001 | 0.002 | 0.007 | 0.034 | |
| Spleen | 475 (146–1681) | 478 (181–1673) | 638 (163–1680) | 556 (253–1233) | <0.001 | 0.02 | 0.001 | 0.525 | 0.067 | |
| Tumor | 51 (1–1241) | 27 (1–2264) | 13 (1–1287) | 10 (1–47) | 0.904 | 0.027 | 0.039 | 0.002 | 0.297 | |
| Others * (n = 28) | Treated | 247 (63–1164) | 214 (20–1073) | 189 (13–951) | 159 (30–715) | 0.003 | 0.243 | 0.039 | 0.431 | 0.203 |
| Untreated | 1270 (224–2230) | 1346 (379–2329) | 1366 (390–2857) | 1054 (896–2311) | 0.102 | 0.747 | 0.734 | 1 | 0.25 | |
| Spleen | 391 (128–1041) | 376 (156–1264) | 358 (153–1067) | 233 (154–744) | 0.023 | 0.256 | 1 | 0.039 | 0.312 | |
| Tumor | 48 (4–193) | 49 (1–244) | 38 (4–357) | 8 (7–96) | 0.848 | 0.376 | 0.016 | 0.136 | 0.047 | |
| Parameter | Univariate | Multivariate | ||||||||||
|---|---|---|---|---|---|---|---|---|---|---|---|---|
| All Versus Baseline | 3 Months | 6 Months | 12 Months | 3 Months | 6 Months | 12 Months | ||||||
| t | p-value | t | p-value | t | p-value | f | p-value | f | p-value | f | p-value | |
| Sex | 0.486 | 0.628 | −0.29 | 0.773 | −0.26 | 0.8 | ||||||
| ECOG | −0.3 | 0.761 | 0.161 | 0.873 | 0.484 | 0.632 | ||||||
| Cirrhosis | 0.443 | 0.659 | −0.57 | 0.571 | −1.22 | 0.231 | ||||||
| 90Y-type (resin vs. glass) | 2.058 | 0.043 * | 2.64 | 0.011 * | 0.156 | 0.877 | 1.567 | 0.215 | 3.833 | 0.058 | ||
| Portal vein thrombosis | −0.1 | 0.921 | 0.902 | 0.371 | −1.03 | 0.313 | ||||||
| rho | p-value | rho | p-value | rho | p-value | f | p-value | f | p-value | f | p-value | |
| Age | −0.35 | <0.001 * | −0.27 | 0.043 * | −0.22 | 0.199 | 6.448 | 0.013 * | 8.404 | 0.006 * | ||
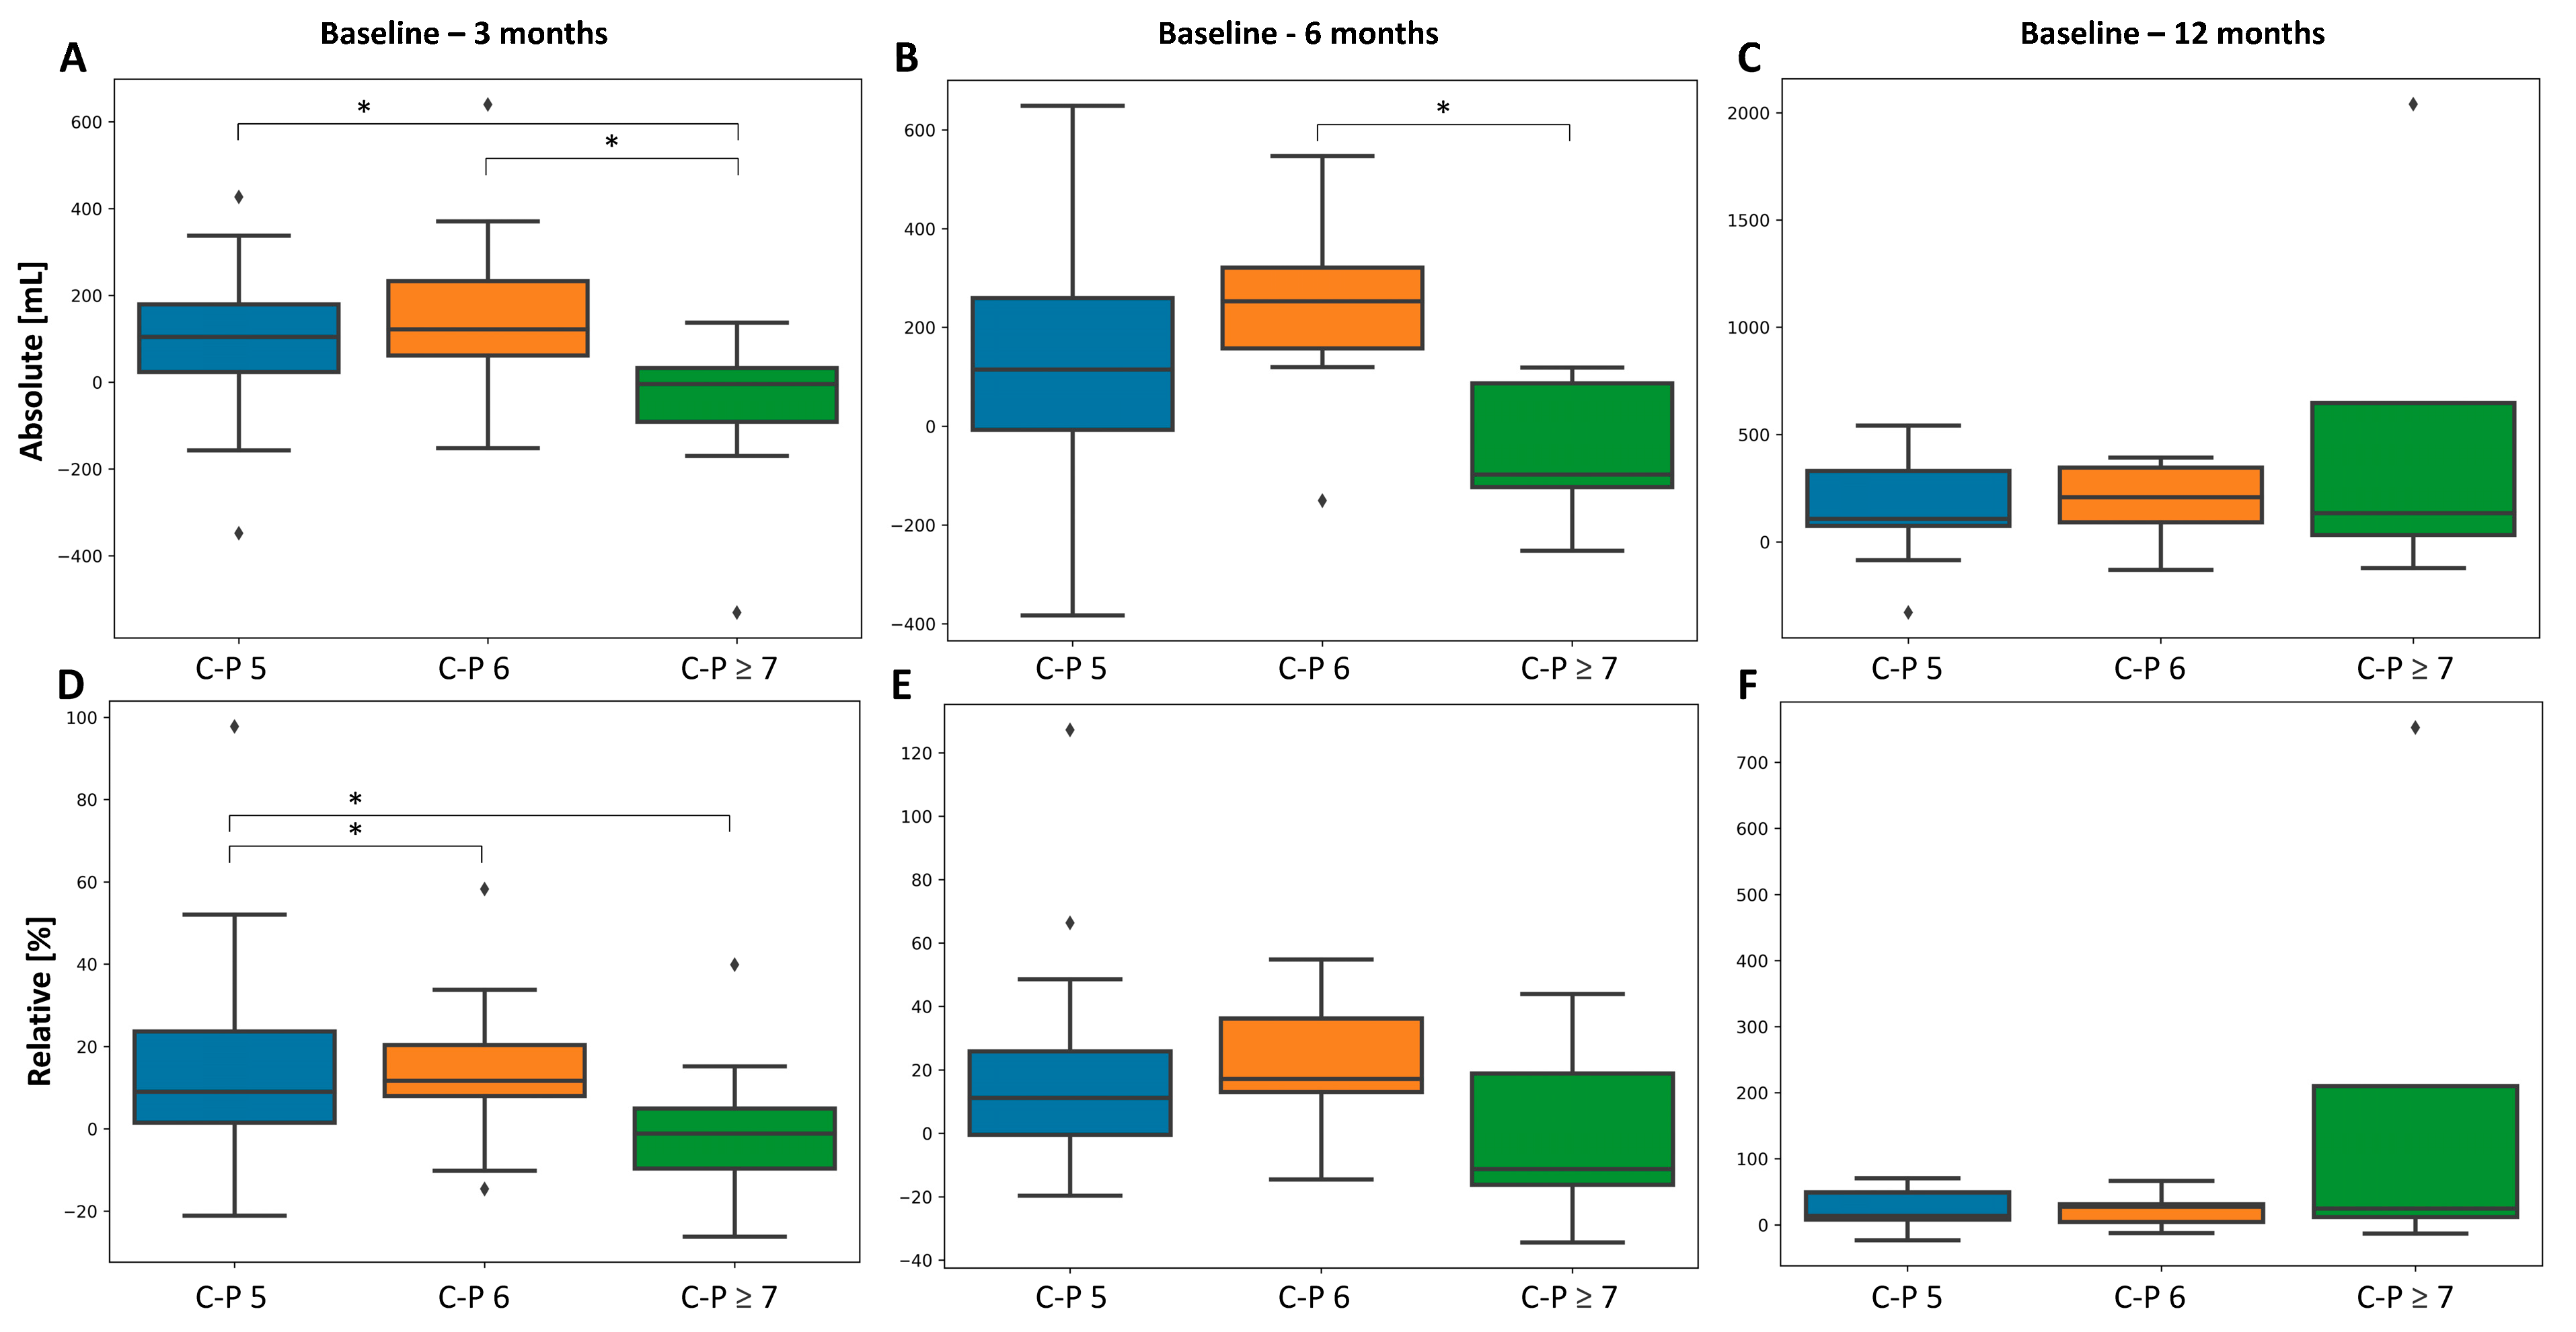
| Child-Pugh score | −0.21 | 0.047 * | −0.11 | 0.416 | 0.063 | 0.714 | 1.337 | 0.251 | ||||
| Administered 90Y-activity | 0.28 | 0.01 * | 0.21 | 0.135 | −0.03 | 0.88 | 9.193 | 0.003 * | ||||
| Non-tumoral liver activity | 0.167 | 0.17 | 0.251 | 0.105 | 0.422 | 0.025 * | 0.905 | 0.351 | ||||
| Non-tumoral liver dose | 0.09 | 0.447 | 0.068 | 0.661 | 0.445 | 0.016 * | 0.179 | 0.676 | ||||
| Tumor activity | 0.096 | 0.432 | 0.038 | 0.811 | −0.27 | 0.174 | ||||||
| Tumor dose | 0.178 | 0.135 | 0.291 | 0.058 * | 0.025 | 0.903 | 0.67 | 0.418 | ||||
| Tumor to liver uptake ratio | 0.076 | 0.516 | 0.156 | 0.306 | −0.34 | 0.069 * | 0.881 | 0.357 | ||||
| Amount of liver treated (% of total liver) | 0.068 | 0.537 | 0.081 | 0.568 | −0.02 | 0.935 | ||||||
| Spleen volume | −0.19 | 0.086 * | −0.04 | 0.801 | 0.064 | 0.733 | 1.684 | 0.198 | ||||
| Tumor volume | 0.035 | 0.747 | 0.076 | 0.59 | −0.018 | 0.321 | ||||||
| Parameter. | Univariate | Multivariate | ||||||||||
|---|---|---|---|---|---|---|---|---|---|---|---|---|
| All Versus Baseline | 3 Months | 6 Months | 12 Months | 3 Months | 6 Months | 12 Months | ||||||
| t | p-value | t | p-value | t | p-value | f | p-value | f | p-value | f | p-value | |
| Sex | 0.911 | 0.365 | −0.017 | 0.986 | 0.291 | 0.774 | ||||||
| ECOG | −0.016 | 0.987 | 0.791 | 0.434 | 0.418 | 0.68 | ||||||
| Cirrhosis | 0.394 | 0.695 | −0.524 | 0.603 | - | - | ||||||
| 90Y-type (resin vs. glass) | 0.005 | 0.996 | 0.682 | 0.499 | −1.303 | 0.207 | ||||||
| Portal vein thrombosis | 0.289 | 0.773 | 0.432 | 0.668 | −1.769 | 0.093 * | 0.824 | 0.378 | ||||
| rho | p-value | rho | p-value | rho | p-value | f | p-value | f | p-value | f | p-value | |
| Age | −0.253 | 0.028 * | −0.283 | 0.069 * | −0.277 | 0.212 | 1.574 | 0.214 | 2.616 | 0.116 | ||
| Child-Pugh score | −0.229 | 0.048 * | −0.116 | 0.464 | 0.052 | 0.819 | 1.466 | 0.23 | ||||
| Administered 90Y-activity | 0.373 | 0.001 * | 0.34 | 0.028 * | 0.272 | 0.22 | 9.609 | 0.003 * | 2.295 | 0.14 | ||
| Non-tumoral liver activity | 0.198 | 0.126 | 0.301 | 0.079 * | 0.432 | 0.057 * | 0.116 | 0.735 | 0.089 | 0.769 | ||
| Non-tumoral liver dose | −0.012 | 0.922 | −0.023 | 0.893 | 0.175 | 0.447 | ||||||
| Tumor activity | 0.084 | 0.52 | 0.059 | 0.742 | −0.146 | 0.552 | ||||||
| Tumor dose | 0.066 | 0.602 | 0.22 | 0.204 | −0.116 | 0.637 | ||||||
| Tumor to liver uptake ratio | 0.055 | 0.654 | 0.106 | 0.534 | −0.27 | 0.237 | ||||||
| Amount of liver treated (% of total liver) | 0.487 | <0.001 * | 0.552 | <0.001 * | 0.829 | <0.001 * | 22.35 | <0.001 * | 14.26 | <0.001 * | 8.407 | 0.01 * |
| Spleen volume | −0.297 | 0.01 * | −0.153 | 0.332 | 0.074 | 0.744 | 5.414 | 0.023 * | ||||
| Tumor volume | 0.194 | 0.096 * | 0.187 | 0.237 | 0.068 | 0.764 | 0.007 | 0.932 | ||||
Disclaimer/Publisher’s Note: The statements, opinions and data contained in all publications are solely those of the individual author(s) and contributor(s) and not of MDPI and/or the editor(s). MDPI and/or the editor(s) disclaim responsibility for any injury to people or property resulting from any ideas, methods, instructions or products referred to in the content. |
© 2024 by the authors. Licensee MDPI, Basel, Switzerland. This article is an open access article distributed under the terms and conditions of the Creative Commons Attribution (CC BY) license (https://creativecommons.org/licenses/by/4.0/).
Share and Cite
Girardet, R.; Knebel, J.-F.; Dromain, C.; Vietti Violi, N.; Tsoumakidou, G.; Villard, N.; Denys, A.; Halkic, N.; Demartines, N.; Kobayashi, K.; et al. Anatomical Quantitative Volumetric Evaluation of Liver Segments in Hepatocellular Carcinoma Patients Treated with Selective Internal Radiation Therapy: Key Parameters Influencing Untreated Liver Hypertrophy. Cancers 2024, 16, 586. https://doi.org/10.3390/cancers16030586
Girardet R, Knebel J-F, Dromain C, Vietti Violi N, Tsoumakidou G, Villard N, Denys A, Halkic N, Demartines N, Kobayashi K, et al. Anatomical Quantitative Volumetric Evaluation of Liver Segments in Hepatocellular Carcinoma Patients Treated with Selective Internal Radiation Therapy: Key Parameters Influencing Untreated Liver Hypertrophy. Cancers. 2024; 16(3):586. https://doi.org/10.3390/cancers16030586
Chicago/Turabian StyleGirardet, Raphaël, Jean-François Knebel, Clarisse Dromain, Naik Vietti Violi, Georgia Tsoumakidou, Nicolas Villard, Alban Denys, Nermin Halkic, Nicolas Demartines, Kosuke Kobayashi, and et al. 2024. "Anatomical Quantitative Volumetric Evaluation of Liver Segments in Hepatocellular Carcinoma Patients Treated with Selective Internal Radiation Therapy: Key Parameters Influencing Untreated Liver Hypertrophy" Cancers 16, no. 3: 586. https://doi.org/10.3390/cancers16030586
APA StyleGirardet, R., Knebel, J.-F., Dromain, C., Vietti Violi, N., Tsoumakidou, G., Villard, N., Denys, A., Halkic, N., Demartines, N., Kobayashi, K., Digklia, A., Schaefer, N., Prior, J. O., Boughdad, S., & Duran, R. (2024). Anatomical Quantitative Volumetric Evaluation of Liver Segments in Hepatocellular Carcinoma Patients Treated with Selective Internal Radiation Therapy: Key Parameters Influencing Untreated Liver Hypertrophy. Cancers, 16(3), 586. https://doi.org/10.3390/cancers16030586