
C-Reactive Protein-to-Albumin Ratio to Predict Tolerability of S-1 as an Adjuvant Chemotherapy in Pancreatic Cancer

 , , , , ,
  and
and
Abstract
Simple Summary
Abstract
1. Introduction
2. Materials and Methods
3. Results
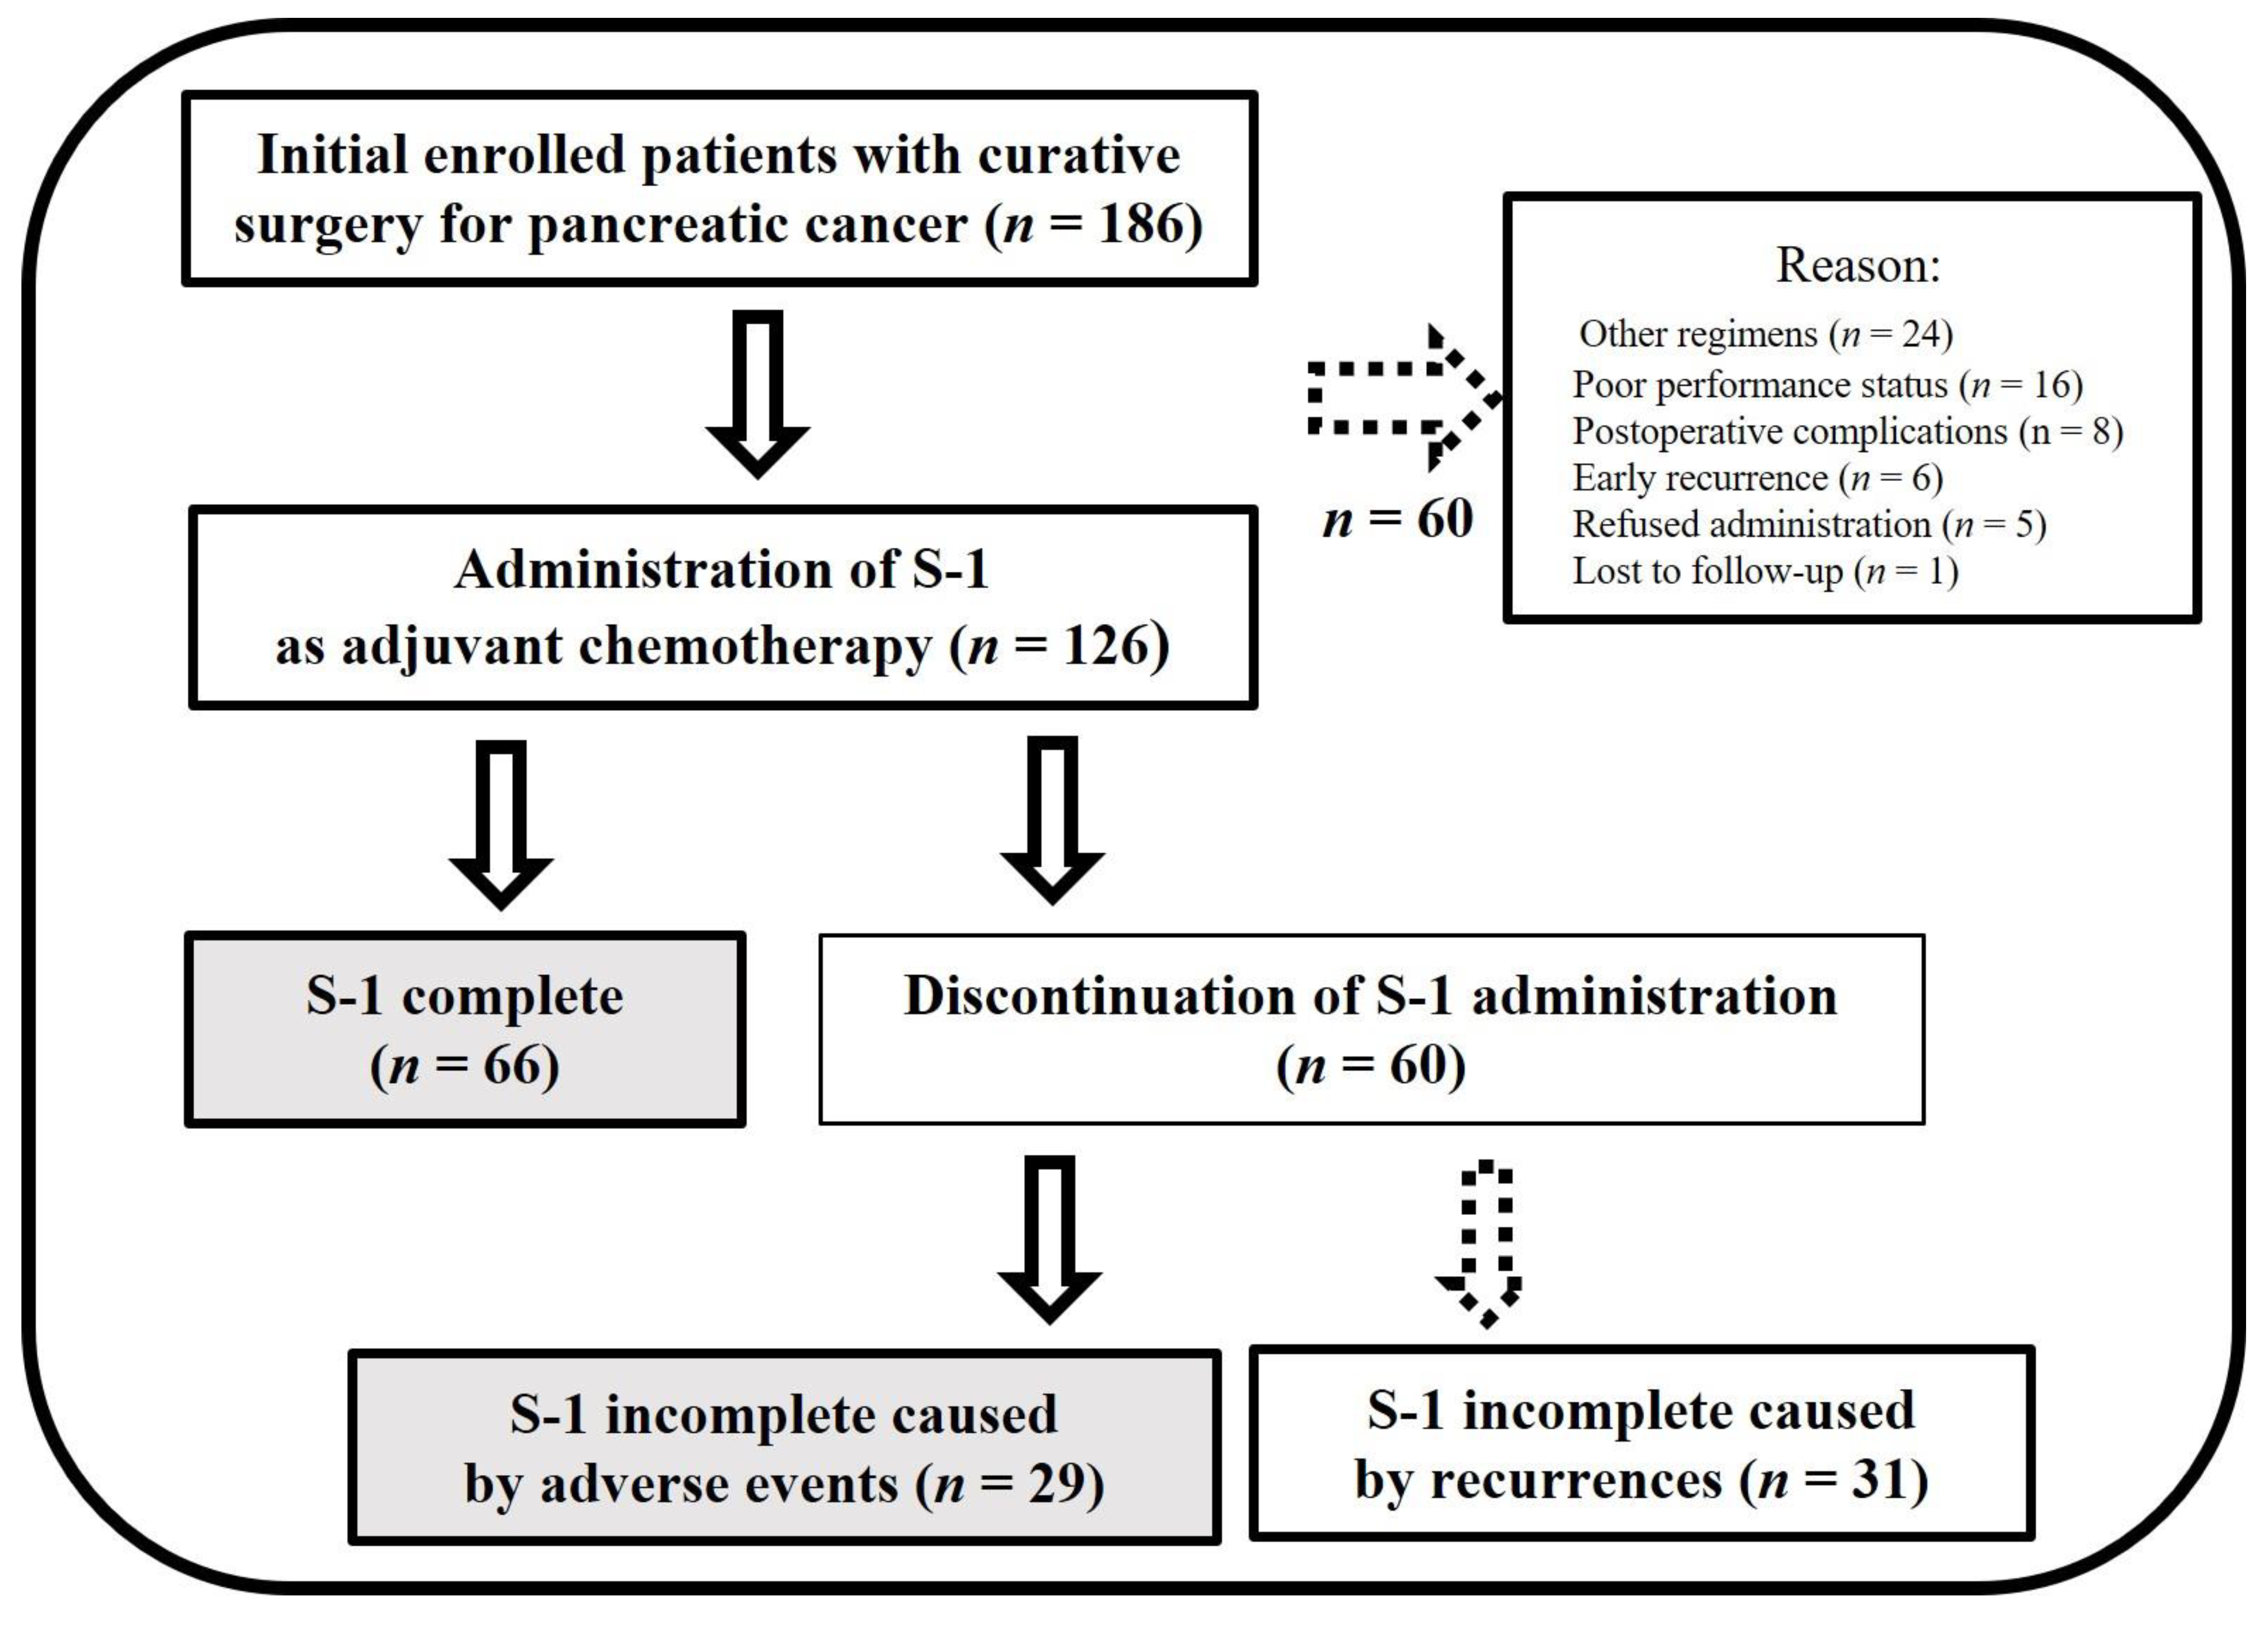
3.1. Patients Characteristics with or without S-1 Completion
3.2. Calculation of the Optimal CAR
3.3. Multivariate Analysis for S-1 Completion
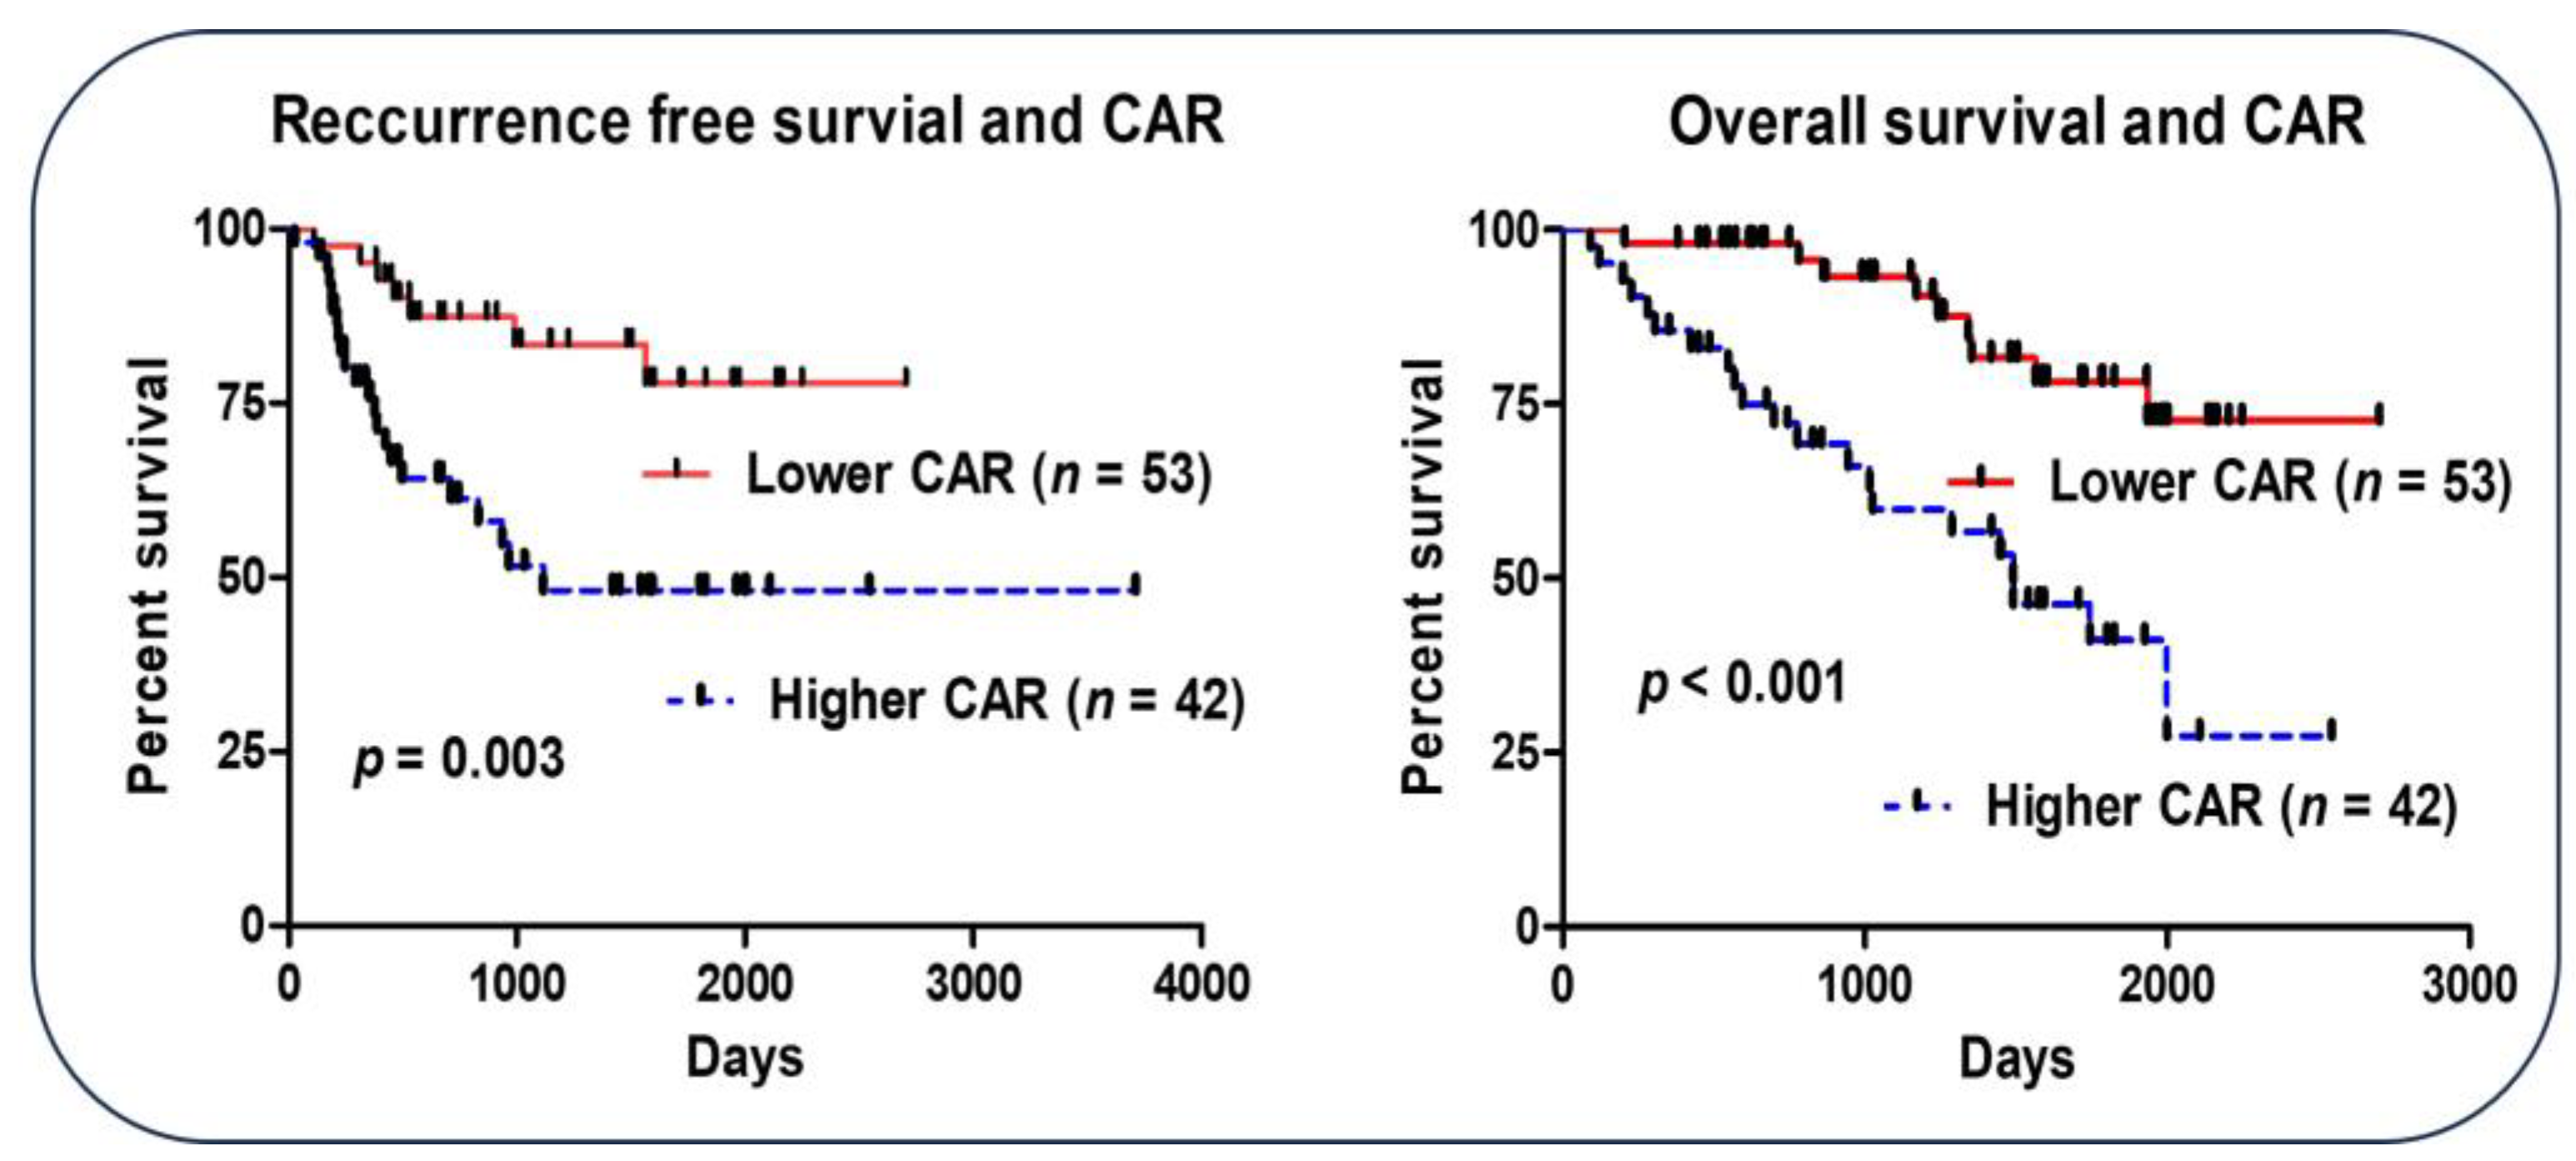
3.4. CAR and Outcome
4. Discussion
5. Conclusions
Author Contributions
Funding
Institutional Review Board Statement
Informed Consent Statement
Data Availability Statement
Conflicts of Interest
Abbreviations
| CAR | C-reactive protein-to-albumin ratio |
| AC | Adjuvant chemotherapy |
| AEs | Adverse events |
| PC | Pancreatic cancer |
| POCs | Postoperative complications |
| CD Classification | Clavien–Dindo classification |
| ROC | Receiver operating characteristic |
| OS | Overall survival |
| RFS | Recurrence-free survival |
| RDI | Relative dose intensity |
References
- Siegel, R.L.; Miller, K.D.; Wagle, N.S.; Jemal, A. Cancer statistics, 2023. CA Cancer J. Clin. 2023, 73, 17–48. [Google Scholar] [CrossRef]
- Neoptolemos, J.P.; Moore, M.J.; Cox, T.F.; Valle, J.W.; Palmer, D.H.; McDonald, A.C.; Carter, R.; Tebbutt, N.C.; Dervenis, C.; Smith, D.; et al. Effect of adjuvant chemotherapy with fluorouracil plus folinic acid or gemcitabine vs observation on survival in patients with resected periampullary adenocarcinoma: The ESPAC-3 periampullary cancer randomized trial. JAMA 2012, 308, 147–156. [Google Scholar] [CrossRef] [PubMed]
- Oettle, H.; Post, S.; Neuhaus, P.; Gellert, K.; Langrehr, J.; Ridwelski, K.; Schramm, H.; Fahlke, J.; Zuelke, C.; Burkart, C.; et al. Adjuvant chemotherapy with gemcitabine vs observation in patients undergoing curative-intent resection of pancreatic cancer: A randomized controlled trial. JAMA 2007, 297, 267–277. [Google Scholar] [CrossRef]
- Oettle, H.; Neuhaus, P.; Hochhaus, A.; Hartmann, J.T.; Gellert, K.; Ridwelski, K.; Niedergethmann, M.; Zülke, C.; Fahlke, J.; Arning, M.B.; et al. Adjuvant chemotherapy with gemcitabine and long-term outcomes among patients with resected pancreatic cancer: The CONKO-001 randomized trial. JAMA 2013, 310, 1473–1481. [Google Scholar] [CrossRef] [PubMed]
- Japan Pancreas Society. Clinical Practice Guidelines For Pancreatic Cancer. 2019. Available online: http://www.suizou.org/pdf/pancreatic_cancer_cpg-2019.pdf (accessed on 5 May 2023). (In Japanese).
- Uesaka, K.; Boku, N.; Fukutomi, A.; Okamura, Y.; Konishi, M.; Matsumoto, I.; Kaneoka, Y.; Shimizu, Y.; Nakamori, S.; Sakamoto, H.; et al. Adjuvant chemotherapy of S-1 versus gemcitabine for resected pancreatic cancer: A phase 3, open-label, randomised, non-inferiority trial (JASPAC 01). Lancet 2016, 388, 248–257. [Google Scholar] [CrossRef] [PubMed]
- Ueno, H.; Kosuge, T.; Matsuyama, Y.; Yamamoto, J.; Nakao, A.; Egawa, S.; Doi, R.; Monden, M.; Hatori, T.; Tanaka, M.; et al. A randomised phase III trial comparing gemcitabine with surgery-only in patients with resected pancreatic cancer: Japanese Study Group of Adjuvant Therapy for Pancreatic Cancer. Br. J. Cancer 2009, 101, 908–915. [Google Scholar] [CrossRef] [PubMed]
- Sakuramoto, S.; Sasako, M.; Yamaguchi, T.; Kinoshita, T.; Fujii, M.; Nashimoto, A.; Furukawa, H.; Nakajima, T.; Ohashi, Y.; Imamura, H.; et al. Adjuvant chemotherapy for gastric cancer with S-1, an oral fluoropyrimidine. N. Engl. J. Med. 2007, 357, 1810–1820. [Google Scholar] [CrossRef] [PubMed]
- Nakachi, K.; Ikeda, M.; Konishi, M.; Nomura, S.; Katayama, H.; Kataoka, T.; Todaka, A.; Yanagimoto, H.; Morinaga, S.; Kobayashi, S.; et al. Adjuvant S-1 compared with observation in resected biliary tract cancer (JCOG1202, ASCOT): A multicentre, open-label, randomised, controlled, phase 3 trial. Lancet 2023, 401, 195–203. [Google Scholar] [CrossRef]
- Yamada, D.; Eguchi, H.; Asaoka, T.; Tomihara, H.; Noda, T.; Wada, H.; Kawamoto, K.; Gotoh, K.; Takeda, Y.; Tanemura, M.; et al. The basal nutritional state of PDAC patients is the dominant factor for completing adjuvant chemotherapy. Surg. Today 2017, 47, 1361–1371. [Google Scholar] [CrossRef]
- Matsumoto, I.; Tanaka, M.; Shirakawa, S.; Shinzeki, M.; Toyama, H.; Asari, S.; Goto, T.; Yamashita, H.; Ishida, J.; Ajiki, T.; et al. Postoperative serum albumin level is a marker of incomplete adjuvant chemotherapy in patients with pancreatic ductal adenocarcinoma. Ann. Surg. Oncol. 2015, 22, 2408–2415. [Google Scholar] [CrossRef]
- Sakamoto, A.; Funamizu, N.; Shine, M.; Uraoka, M.; Nagaoka, T.; Honjo, M.; Tamura, K.; Sakamoto, K.; Ogawa, K.; Takada, Y. Geriatric nutritional risk index predicts tolerability of S-1 as adjuvant chemotherapy for pancreatic ductal adenocarcinoma. Pancreas 2023, 52, e196–e202. [Google Scholar]
- Dindo, D.; Demartines, N.; Clavien, P.A. Classification of surgical complications: A new proposal with evaluation in a cohort of 6336 patients and results of a survey. Ann. Surg. 2004, 240, 205–213. [Google Scholar] [CrossRef]
- Valle, J.W.; Palmer, D.; Jackson, R.; Cox, T.; Neoptolemos, J.P.; Ghaneh, P.; Rawcliffe, C.L.; Bassi, C.; Stocken, D.D.; Cunningham, D.; et al. Optimal duration and timing of adjuvant chemotherapy after definitive surgery for ductal adenocarcinoma of the pancreas: Ongoing lessons from the ESPAC-3 study. J. Clin. Oncol. 2014, 32, 504–512. [Google Scholar] [CrossRef]
- Qi, W.; Wang, X.; Gan, L.; Li, Y.; Li, H.; Cheng, Q. The effect of reduced RDI of chemotherapy on the outcome of breast cancer patients. Sci. Rep. 2020, 10, 13241. [Google Scholar] [CrossRef]
- Yabusaki, N.; Fujii, T.; Yamada, S.; Murotani, K.; Sugimoto, H.; Kanda, M.; Nakayama, G.; Koike, M.; Fujiwara, M.; Kodera, Y.; et al. The significance of relative dose intensity in adjuvant chemotherapy of pancreatic ductal adenocarcinoma-including the analysis of clinicopathological factors influencing relative dose intensity. Medicine 2016, 95, e4282. [Google Scholar] [CrossRef]
- Nielson, C.M.; Bylsma, L.C.; Fryzek, J.P.; Saad, H.A.; Crawford, J. Relative dose intensity of chemotherapy and survival in patients with advanced stage solid tumor cancer: A systematic review and meta-analysis. Oncologist 2021, 26, e1609–e1618. [Google Scholar] [CrossRef]
- U.S. Department of Health and Human Services. Common Terminology Criteria for Adverse Events (CTCAE); Version 5; National Cancer Institute: Bethesda, MD, USA, 2017.
- Fairclough, E.; Cairns, E.; Hamilton, J.; Kelly, C. Evaluation of a modified early warning system for acute medical admissions and comparison with C-reactive protein/albumin ratio as a predictor of patient outcome. Clin. Med. 2009, 9, 30–33. [Google Scholar] [CrossRef] [PubMed]
- Shirasaka, T.; Shimamato, Y.; Ohshimo, H.; Yamaguchi, M.; Kato, T.; Yonekura, K.; Fukushima, M. Development of a novel form of an oral 5-fluorouracil derivative (S-1) directed to the potentiation of the tumor selective cytotoxicity of 5-fluorouracil by two biochemical modulators. Anticancer Drugs 1996, 7, 548–557. [Google Scholar] [CrossRef] [PubMed]
- Chuah, B.; Goh, B.C.; Lee, S.C.; Soong, R.; Lau, F.; Mulay, M.; Dinolfo, M.; Lim, S.E.; Soo, R.; Furuie, T.; et al. Comparison of the pharmacokinetics and pharmacodynamics of S-1 between Caucasian and East Asian patients. Cancer Sci. 2011, 102, 478–483. [Google Scholar] [CrossRef]
- Menozzi, R.; Valoriani, F.; Ballarin, R.; Alemanno, L.; Vinciguerra, M.; Barbieri, R.; Cuoghi Costantini, R.; D’Amico, R.; Torricelli, P.; Pecchi, A. Impact of nutritional status on postoperative outcomes in cancer patients following elective pancreatic surgery. Nutrients 2023, 15, 1958. [Google Scholar] [CrossRef] [PubMed]
- Martínez-Ortega, A.J.; Piñar-Gutiérrez, A.; Serrano-Aguayo, P.; González-Navarro, I.; Remón-Ruíz, P.J.; Pereira-Cunill, J.L.; García-Luna, P.P. Perioperative nutritional support: A review of current literature. Nutrients 2022, 14, 1601. [Google Scholar] [CrossRef]
- Liao, C.K.; Chern, Y.J.; Hsu, Y.J.; Lin, Y.C.; Yu, Y.L.; Chiang, J.M.; Yeh, C.Y.; You, J.F. The clinical utility of the geriatric nutritional risk index in predicting postoperative complications and long-term survival in elderly patients with colorectal cancer after curative surgery. Cancers 2021, 13, 5852. [Google Scholar] [CrossRef]
- Funamizu, N.; Nakabayashi, Y.; Kurihara, K. Lower geriatric nutritional risk index predicts postoperative pancreatic fistula in patients with distal pancreatectomy. Mol. Clin. Oncol. 2020, 12, 134–137. [Google Scholar] [CrossRef]
- Funamizu, N.; Nakabayashi, Y.; Iida, T.; Kurihara, K. Geriatric nutritional risk index predicts surgical site infection after pancreaticoduodenectomy. Mol. Clin. Oncol. 2018, 9, 274–278. [Google Scholar] [CrossRef]
- Hayama, T.; Hashiguchi, Y.; Ozawa, T.; Watanabe, M.; Fukushima, Y.; Shimada, R.; Nozawa, K.; Matsuda, K.; Fujii, S.; Fukagawa, T. The preoperative geriatric nutritional risk index (GNRI) is an independent prognostic factor in elderly patients underwent curative resection for colorectal cancer. Sci. Rep. 2022, 12, 3682. [Google Scholar] [CrossRef]
- Hayama, T.; Ozawa, T.; Okada, Y.; Tsukamoto, M.; Fukushima, Y.; Shimada, R.; Nozawa, K.; Matsuda, K.; Fujii, S.; Hashiguchi, Y. The pretreatment Controlling Nutritional Status (CONUT) score is an independent prognostic factor in patients undergoing resection for colorectal cancer. Sci. Rep. 2020, 10, 13239. [Google Scholar] [CrossRef]
- Trestini, I.; Carbognin, L.; Sperduti, I.; Bonaiuto, C.; Auriemma, A.; Melisi, D.; Salvatore, L.; Bria, E.; Tortora, G. Prognostic impact of early nutritional support in patients affected by locally advanced and metastatic pancreatic ductal adenocarcinoma undergoing chemotherapy. Eur. J. Clin. Nutr. 2018, 72, 772–779. [Google Scholar] [CrossRef] [PubMed]
- Funamizu, N.; Sakamoto, A.; Utsunomiya, T.; Uraoka, M.; Nagaoka, T.; Iwata, M.; Ito, C.; Tamura, K.; Sakamoto, K.; Ogawa, K.; et al. Geriatric nutritional risk index as a potential prognostic marker for patients with resectable pancreatic cancer: A single-center, retrospective cohort study. Sci. Rep. 2022, 12, 13644. [Google Scholar] [CrossRef] [PubMed]
- Andersen, B.L.; Myers, J.; Blevins, T.; Park, K.R.; Smith, R.M.; Reisinger, S.; Carbone, D.P.; Presley, C.J.; Shields, P.G.; Carson, W.E. Depression in association with neutrophil-to-lymphocyte, platelet-to-lymphocyte, and advanced lung cancer inflammation index biomarkers predicting lung cancer survival. PLoS ONE 2023, 18, e0282206. [Google Scholar] [CrossRef] [PubMed]
- Şahin, A.B.; Cubukcu, E.; Ocak, B.; Deligonul, A.; Oyucu Orhan, S.; Tolunay, S.; Gokgoz, M.S.; Cetintas, S.; Yarbas, G.; Senol, K.; et al. Low pan-immune-inflammation-value predicts better chemotherapy response and survival in breast cancer patients treated with neoadjuvant chemotherapy. Sci. Rep. 2021, 11, 14662. [Google Scholar] [CrossRef] [PubMed]
- Platt, J.J.; Ramanathan, M.L.; Crosbie, R.A.; Anderson, J.H.; McKee, R.F.; Horgan, P.G.; McMillan, D.C. C-reactive protein as a predictor of postoperative infective complications after curative resection in patients with colorectal cancer. Ann. Surg. Oncol. 2012, 19, 4168–4177. [Google Scholar] [CrossRef]
- Yamamoto, T.; Fukuda, M.; Okuchi, Y.; Oshimo, Y.; Nishikawa, Y.; Hisano, K.; Kawai, T.; Iguchi, K.; Okuda, Y.; Kamimura, R.; et al. Clinical impact of lymphocyte/C-reactive protein ratio on postoperative outcomes in patients with rectal cancer who underwent curative resection. Sci. Rep. 2022, 12, 17136. [Google Scholar] [CrossRef]
- Huang, Z.; Zheng, Q.; Yu, Y.; Zheng, H.; Wu, Y.; Wang, Z.; Liu, L.; Zhang, M.; Liu, T.; Li, H.; et al. Prognostic significance of platelet-to-albumin ratio in patients with esophageal squamous cell carcinoma receiving definitive radiotherapy. Sci. Rep. 2022, 12, 3535. [Google Scholar] [CrossRef]
- Popowicz, N.; Cheah, H.M.; Gregory, C.; Miranda, A.; Dick, I.M.; Lee, Y.C.G.; Creaney, J. Neutrophil-to-lymphocyte ratio in malignant pleural fluid: Prognostic significance. PLoS ONE 2021, 16, e0250628. [Google Scholar] [CrossRef]
- Shao, B.; Liu, X.; Li, H.; Song, G.; Di, L.; Jiang, H.; Yan, Y.; Zhang, R.; Ran, R.; Zhang, J.; et al. Prognostic value of pretreatment neutrophil-to-lymphocyte ratio in HER2-positive metastatic breast cancer. Curr. Oncol. 2022, 29, 6154–6166. [Google Scholar] [CrossRef]
- Zhang, H.; Gao, L.; Zhang, B.; Zhang, L.; Wang, C. Prognostic value of platelet to lymphocyte ratio in non-small cell lung cancer: A systematic review and meta-analysis. Sci. Rep. 2016, 6, 22618. [Google Scholar] [CrossRef] [PubMed]
- Ishiguro, T.; Aoyama, T.; Ju, M.; Kazama, K.; Fukuda, M.; Kanai, H.; Sawazaki, S.; Tamagawa, H.; Tamagawa, A.; Cho, H.; et al. Prognostic nutritional index as a predictor of prognosis in postoperative patients with gastric cancer. In Vivo 2023, 37, 1290–1296. [Google Scholar] [CrossRef]
- Ichikawa, K.; Mizuno, S.; Hayasaki, A.; Kishiwada, M.; Fujii, T.; Iizawa, Y.; Kato, H.; Tanemura, A.; Murata, Y.; Azumi, Y.; et al. Prognostic nutritional index after chemoradiotherapy was the strongest prognostic predictor among biological and conditional factors in localized pancreatic ductal adenocarcinoma patients. Cancers 2019, 11, 514. [Google Scholar] [CrossRef] [PubMed]
- Funamizu, N.; Utsunomiya, T.; Honjo, M.; Ito, C.; Shine, M.; Uraoka, M.; Nagaoka, T.; Tamura, K.; Sakamoto, K.; Ogawa, K.; et al. Preoperative C-reactive protein-to-albumin ratio predicts postoperative pancreatic fistula following pancreatoduodenectomy: A single-center, retrospective study. Curr. Oncol. 2022, 29, 9867–9874. [Google Scholar] [CrossRef] [PubMed]
- Funamizu, N.; Sogabe, K.; Shine, M.; Honjo, M.; Sakamoto, A.; Nishi, Y.; Matsui, T.; Uraoka, M.; Nagaoka, T.; Iwata, M.; et al. Association between the preoperative C-reactive protein-to-albumin ratio and the risk for postoperative pancreatic fistula following distal pancreatectomy for pancreatic cancer. Nutrients 2022, 14, 5277. [Google Scholar] [CrossRef] [PubMed]
- Utsumi, M.; Aoki, H.; Nagahisa, S. Preoperative C-reactive protein/albumin ratio as a predictive factor for gallbladder carcinoma. In Vivo 2020, 34, 1901–1908. [Google Scholar] [CrossRef] [PubMed]
- Zhou, W.; Zhang, G.L. C-reactive protein to albumin ratio predicts the outcome in renal cell carcinoma: A meta-analysis. PLoS ONE 2019, 14, e0224266. [Google Scholar] [CrossRef] [PubMed]
- Neumann, C.C.M.; Schneider, F.; Hilfenhaus, G.; Vecchione, L.; Felsenstein, M.; Ihlow, J.; Geisel, D.; Sander, S.; Pratschke, J.; Stintzing, S.; et al. Inflammation-based prognostic scores in pancreatic cancer patients—A single-center analysis of 1294 patients within the last decade. Cancers 2023, 15, 2367. [Google Scholar] [CrossRef]
- Haruki, K.; Shiba, H.; Shirai, Y.; Horiuchi, T.; Iwase, R.; Fujiwara, Y.; Furukawa, K.; Misawa, T.; Yanaga, K. The C-reactive protein to albumin ratio predicts long-term outcomes in patients with pancreatic cancer after pancreatic resection. World J. Surg. 2016, 40, 2254–2260. [Google Scholar] [CrossRef] [PubMed]
- Aoyama, T.; Yoshikawa, T.; Shirai, J.; Hayashi, T.; Yamada, T.; Tsuchida, K.; Hasegawa, S.; Cho, H.; Yukawa, N.; Oshima, T.; et al. Body weight loss after surgery is an independent risk factor for continuation of S-1 adjuvant chemotherapy for gastric cancer. Ann. Surg. Oncol. 2013, 20, 2000–2006. [Google Scholar] [CrossRef]
- Miwa, T.; Kanda, M.; Tanaka, C.; Kobayashi, D.; Hayashi, M.; Yamada, S.; Nakayama, G.; Koike, M.; Kodera, Y. Albumin-bilirubin score predicts tolerability to adjuvant S-1 monotherapy after curative gastrectomy. J. Gastric Cancer 2019, 19, 183–192. [Google Scholar] [CrossRef]
- Takagi, K.; Inoue, Y.; Oba, A.; Ono, Y.; Sato, T.; Ito, H.; Saino, Y.; Saiura, A.; Takahashi, Y. Impact of sarcopenia on S1 adjuvant chemotherapy and prognosis in pancreatic cancer patients. BioSci. Trends 2023, 17, 310–317. [Google Scholar] [CrossRef]
- Russell, T.B.; Labib, P.L.; Ausania, F.; Pando, E.; Roberts, K.J.; Kausar, A.; Mavroeidis, V.K.; Marangoni, G.; Thomasset, S.C.; Frampton, A.E.; et al. Serious complications of pancreatoduodenectomy correlate with lower rates of adjuvant chemotherapy: Results from the recurrence after Whipple’s (RAW) study. Eur. J. Surg. Oncol. 2023, 49, 106919. [Google Scholar] [CrossRef]
- Vujic, J.; Marsoner, K.; Wienerroither, V.; Mischinger, H.J.; Kornprat, P. The predictive value of the CRP-to-albumin ratio for patients with pancreatic cancer after curative resection: A retrospective single center study. In Vivo 2019, 33, 2071–2078. [Google Scholar] [CrossRef]
- Murakawa, M.; Yamamoto, N.; Kamioka, Y.; Kamiya, M.; Kobayashi, S.; Ueno, M.; Morimoto, M.; Atsumi, Y.; Aoyama, T.; Tamagawa, H.; et al. Clinical implication of pre-operative C-reactive protein-albumin ratio as a prognostic factor of patients with pancreatic ductal adenocarcinoma: A single-institutional retrospective study. In Vivo 2020, 34, 347–353. [Google Scholar] [CrossRef]
- Morita, Y.; Sakaguchi, T.; Kitajima, R.; Furuhashi, S.; Kiuchi, R.; Takeda, M.; Hiraide, T.; Shibasaki, Y.; Kikuchi, H.; Konno, H.; et al. Body weight loss after surgery affects the continuity of adjuvant chemotherapy for pancreatic cancer. BMC Cancer 2019, 19, 416. [Google Scholar] [CrossRef] [PubMed]


| Patient Characteristics | S-1-Complete Group (n = 66) | S-1-Incomplete Group (n = 29) | p Value |
|---|---|---|---|
| Sex (male) | 26 (39.4) | 17 (58.6) | 0.113 |
| Age (years) | 68.8 (47–84) | 71.3 (56–85) | 0.191 |
| Body mass index (kg/m2) | 22.6 ± 0.4 | 21.6 ± 0.6 | 0.129 |
| ASA-classification | 0.054 | ||
| 1 or 2 | 63 (95.5) | 24 (82.8) | |
| 3 | 3 (4.5) | 5 (17.2) | |
| Neoadjuvant chemotherapy | 24 (36.4) | 9 (31.0) | 0.649 |
| Operation methods | |||
| DP | 27 (40.9) | 9 (31.0) | |
| PD | 35 (53.0) | 14 (65.5) | |
| TP | 4 (6.1) | 1 (3.5) | |
| Operation time (min) | 482.1 ± 20.3 | 533.8 ± 33.6 | 0.17 |
| Estimated blood loss (mL) | 659.6 ± 72.8 | 883.2 ± 126. | 0.116 |
| CD classification grade ≥3 | 20 (30.3) | 5 (17.2) | 0.183 |
| Postoperative hospital stay (days) | 30.0 ± 2.5 | 29.9 ± 4.5 | 0.979 |
| Pathological stage | |||
| 1 | 11 (16.7) | 3 (10.3) | |
| 2 | 53 (80.3) | 25 (86.2) | |
| 3 | 1 (1.5) | 0 (0.0) | |
| 4 | 1 (1.5) | 1 (3.4) |
| Variables | S-1-Complete Group (n = 66) | S-1-Incomplete Group (n = 29) | p Value |
|---|---|---|---|
| Duration to AC initiation (days) | 51.5 ± 4.6 | 49.3 ± 4.5 | 0.777 |
| Data at the onset of AC | |||
| Body mass index (kg/m2) | 21.2 ± 0.3 | 19.8 ± 0.6 | 0.026 |
| Alb (mg/dL) | 3.8 ± 0.0 | 3.3 ± 0.1 | 0.002 |
| CRP (mg/dL) | 0.2 ± 0.2 | 1.0 ± 0.3 | <0.001 |
| CEA (ng/mL) | 2.5 ± 0.2 | 2.8 ± 0.4 | 0.438 |
| CA19-9 (U/mL) | 57.8 ± 29.7 | 45.2 ± 14.2 | 0.784 |
| CAR | 0.04 ± 0.01 | 0.31 ± 0.10 | <0.001 |
| Severe AEs | 5 (7.6%) | 14 (48.3%) | <0.001 |
| Recurrence after S-1 treatment | 29 (43.9%) | 17 (58.6%) | 0.265 |
| Variables | CAR < 0.05 (n = 53) | CAR ≥ 0.05 (n = 42) | p Value |
|---|---|---|---|
| Sex (male) | 17 (32.1) | 26 (61.9) | 0.007 |
| Age (years) | 69.6 ± 1.2 | 69.6 ± 1.4 | 0.937 |
| POCs (CD classification grade ≥3) | 10 (18.9) | 15 (35.7) | 0.064 |
| Data at the onset of AC | 25 (46.3) | 5 (21.7) | |
| Alb (mg/dL) | 3.8 ± 0.1 | 3.4 ± 0.1 | <0.001 |
| CRP (mg/dL) | 0.06 ± 0.01 | 0.84 ± 0.20 | <0.001 |
| CA19-9 (U/mL) | 78.3 ± 38.0 | 24.7 ± 5.6 | 0.204 |
| AC completion rate (%) | 48 (90.6) | 18 (42.9) | <0.001 |
| Pathological stage | |||
| 1 | 11 (20.8) | 3 (7.1) | |
| 2 | 41 (77.4) | 37 (88.1) | |
| 3 | 0 (0.0) | 1 (2.4) | |
| 4 | 1 (1.9) | 1 (2.4) | |
| Severe AEs | 7 (13.2) | 12 (28.6) | 0.075 |
| Variables | Hazard Ratio (95% Confidence Interval) | p Value |
|---|---|---|
| BMI < 20.0 | 1.322 (1.041–1.680) | 0.022 |
| Albumin < 3.4 | 3.282 (1.041–1.680) | 0.13 |
| CRP > 0.18 | 1.322 (0.704–15.304) | 0.891 |
| Severe AEs | 19.897 (3.660–108.157) | <0.001 |
| CAR > 0.05 | 12.734 (2.064–79.253) | 0.006 |
Disclaimer/Publisher’s Note: The statements, opinions and data contained in all publications are solely those of the individual author(s) and contributor(s) and not of MDPI and/or the editor(s). MDPI and/or the editor(s) disclaim responsibility for any injury to people or property resulting from any ideas, methods, instructions or products referred to in the content. |
© 2024 by the authors. Licensee MDPI, Basel, Switzerland. This article is an open access article distributed under the terms and conditions of the Creative Commons Attribution (CC BY) license (https://creativecommons.org/licenses/by/4.0/).
Share and Cite
Funamizu, N.; Sakamoto, A.; Hikida, T.; Ito, C.; Shine, M.; Nishi, Y.; Uraoka, M.; Nagaoka, T.; Honjo, M.; Tamura, K.; et al. C-Reactive Protein-to-Albumin Ratio to Predict Tolerability of S-1 as an Adjuvant Chemotherapy in Pancreatic Cancer. Cancers 2024, 16, 922. https://doi.org/10.3390/cancers16050922
Funamizu N, Sakamoto A, Hikida T, Ito C, Shine M, Nishi Y, Uraoka M, Nagaoka T, Honjo M, Tamura K, et al. C-Reactive Protein-to-Albumin Ratio to Predict Tolerability of S-1 as an Adjuvant Chemotherapy in Pancreatic Cancer. Cancers. 2024; 16(5):922. https://doi.org/10.3390/cancers16050922
Chicago/Turabian StyleFunamizu, Naotake, Akimasa Sakamoto, Takahiro Hikida, Chihiro Ito, Mikiya Shine, Yusuke Nishi, Mio Uraoka, Tomoyuki Nagaoka, Masahiko Honjo, Kei Tamura, and et al. 2024. "C-Reactive Protein-to-Albumin Ratio to Predict Tolerability of S-1 as an Adjuvant Chemotherapy in Pancreatic Cancer" Cancers 16, no. 5: 922. https://doi.org/10.3390/cancers16050922
APA StyleFunamizu, N., Sakamoto, A., Hikida, T., Ito, C., Shine, M., Nishi, Y., Uraoka, M., Nagaoka, T., Honjo, M., Tamura, K., Sakamoto, K., Ogawa, K., & Takada, Y. (2024). C-Reactive Protein-to-Albumin Ratio to Predict Tolerability of S-1 as an Adjuvant Chemotherapy in Pancreatic Cancer. Cancers, 16(5), 922. https://doi.org/10.3390/cancers16050922