
Imaging of Peritoneal Metastases in Ovarian Cancer Using MDCT, MRI, and FDG PET/CT: A Systematic Review and Meta-Analysis


 ,
,
Abstract
Simple Summary
Abstract
1. Introduction
2. Materials and Methods
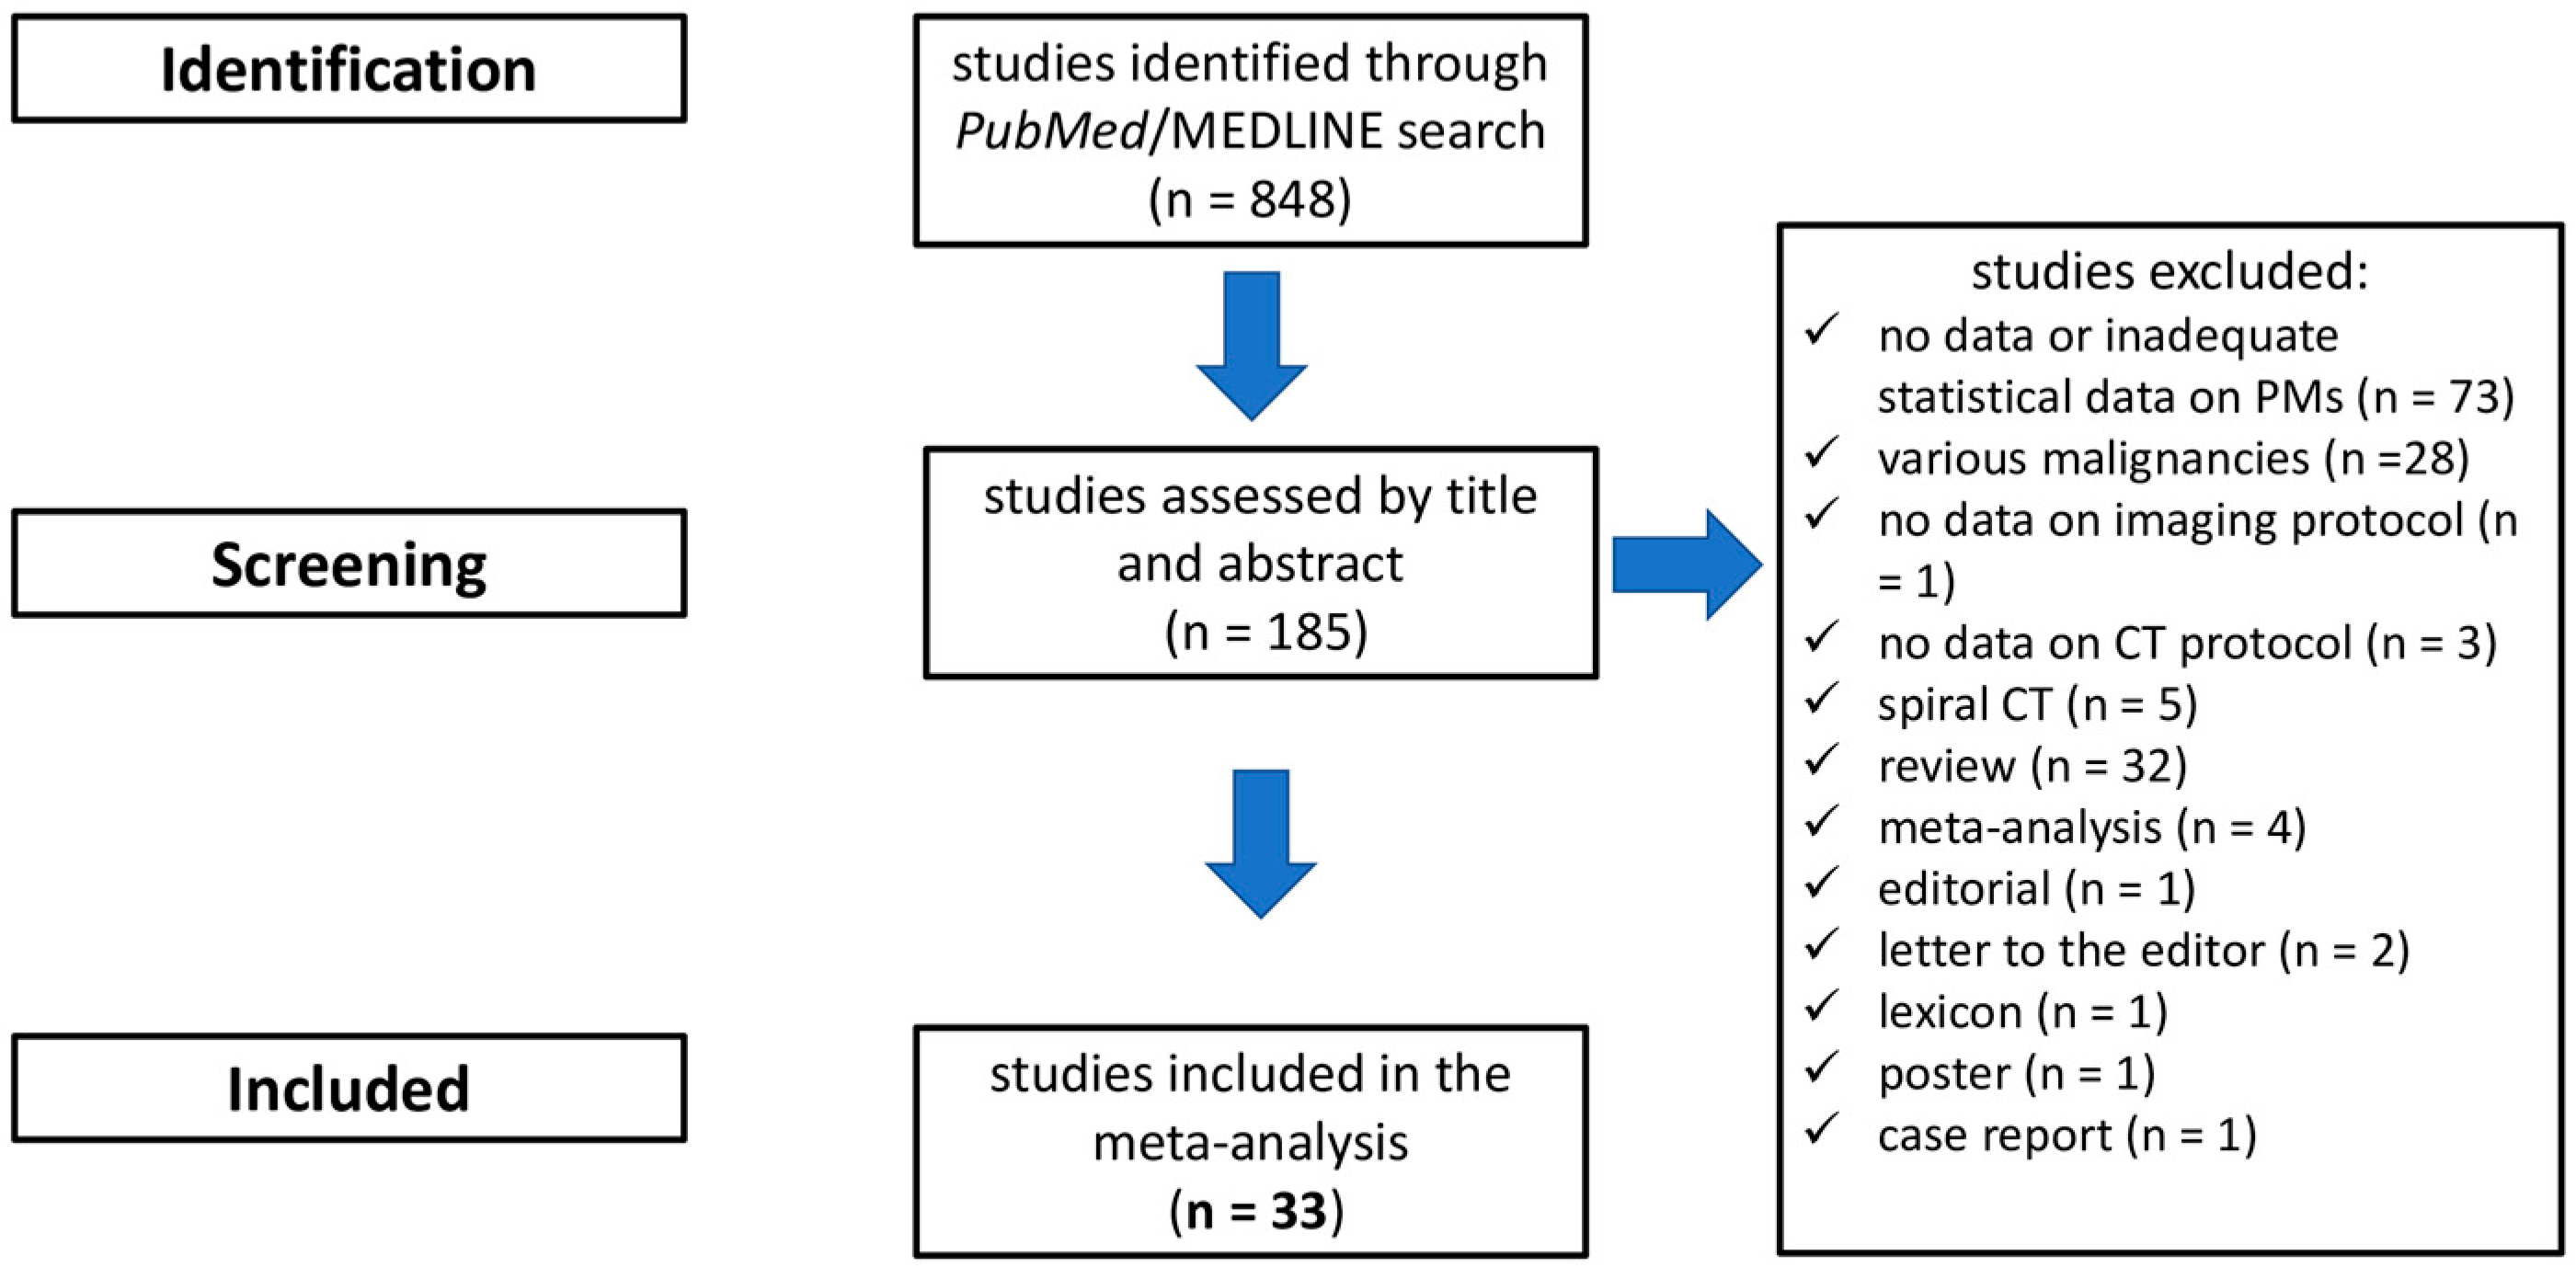
2.1. Search Strategy
2.2. Eligibility Criteria
2.3. Data Extraction
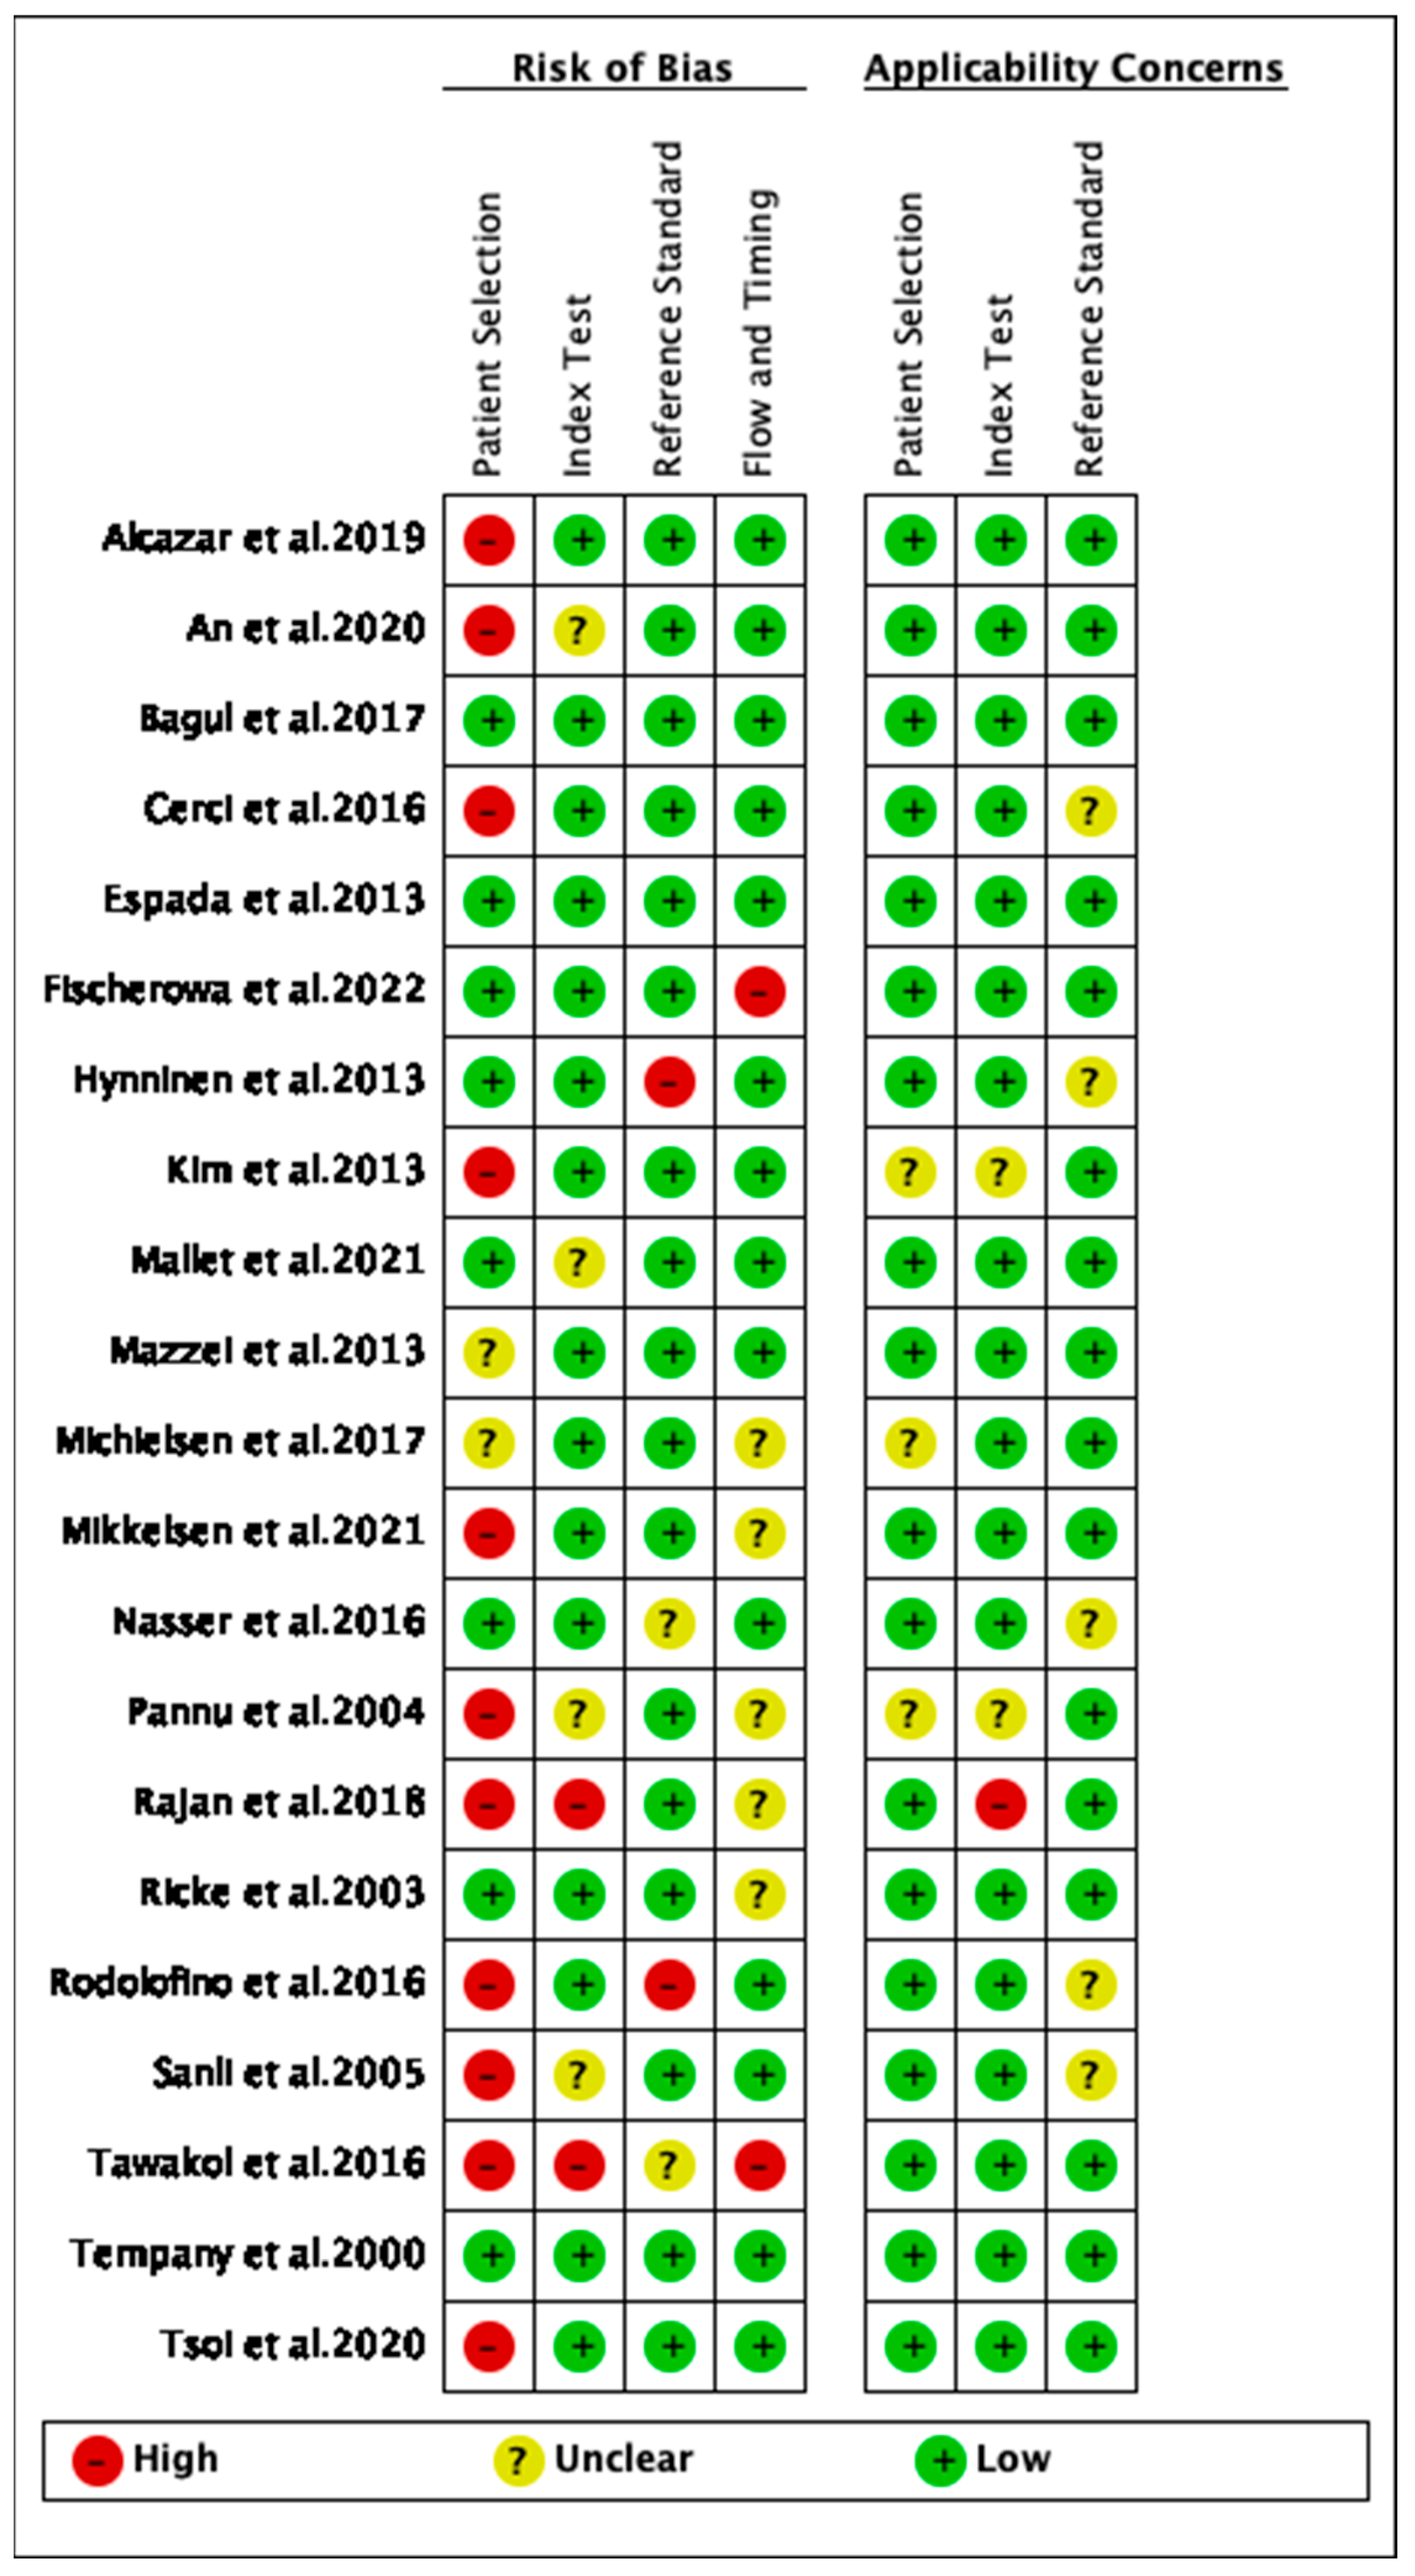
2.4. Quality Assessment
3. Results
3.1. Study Characteristics
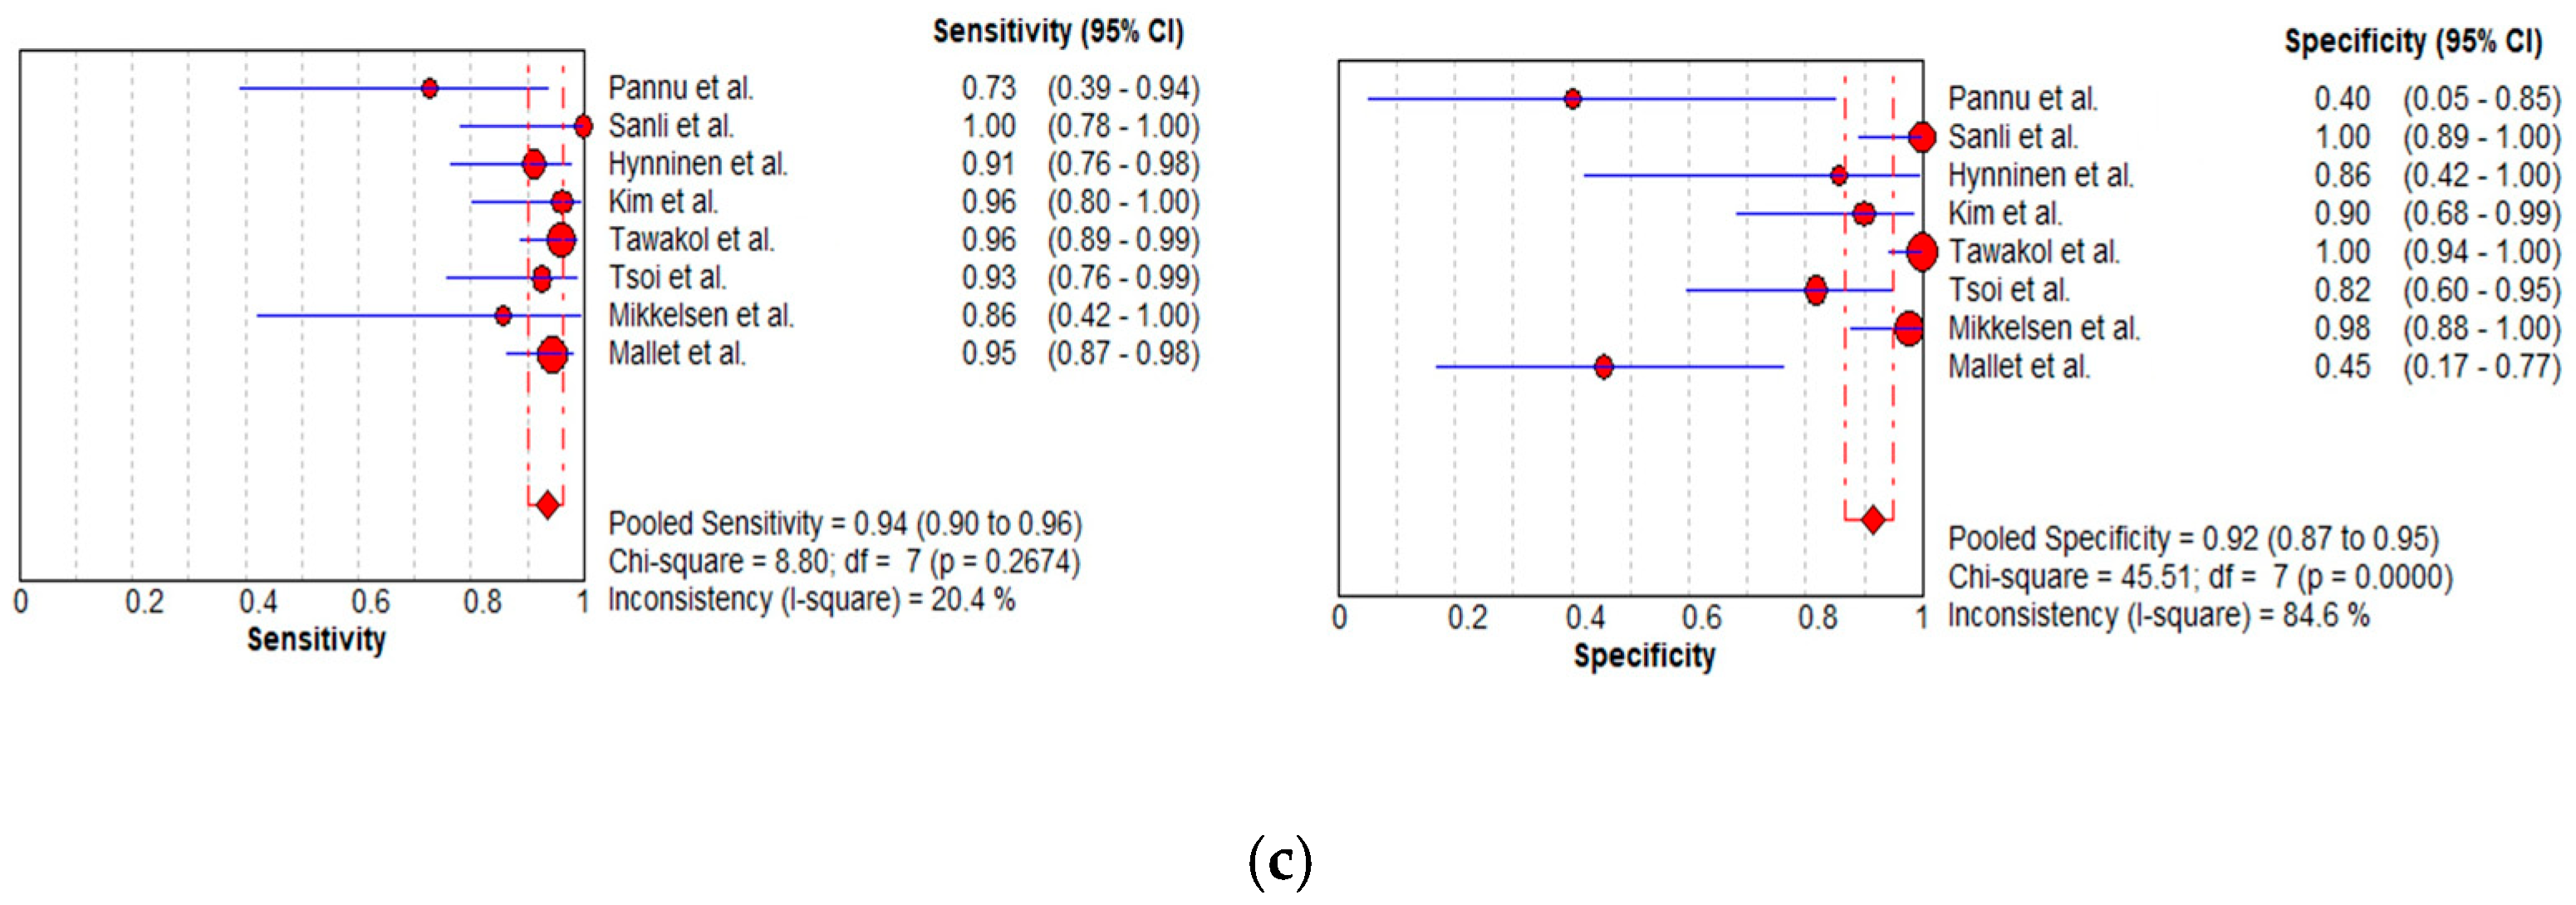
3.2. Quality Assessment
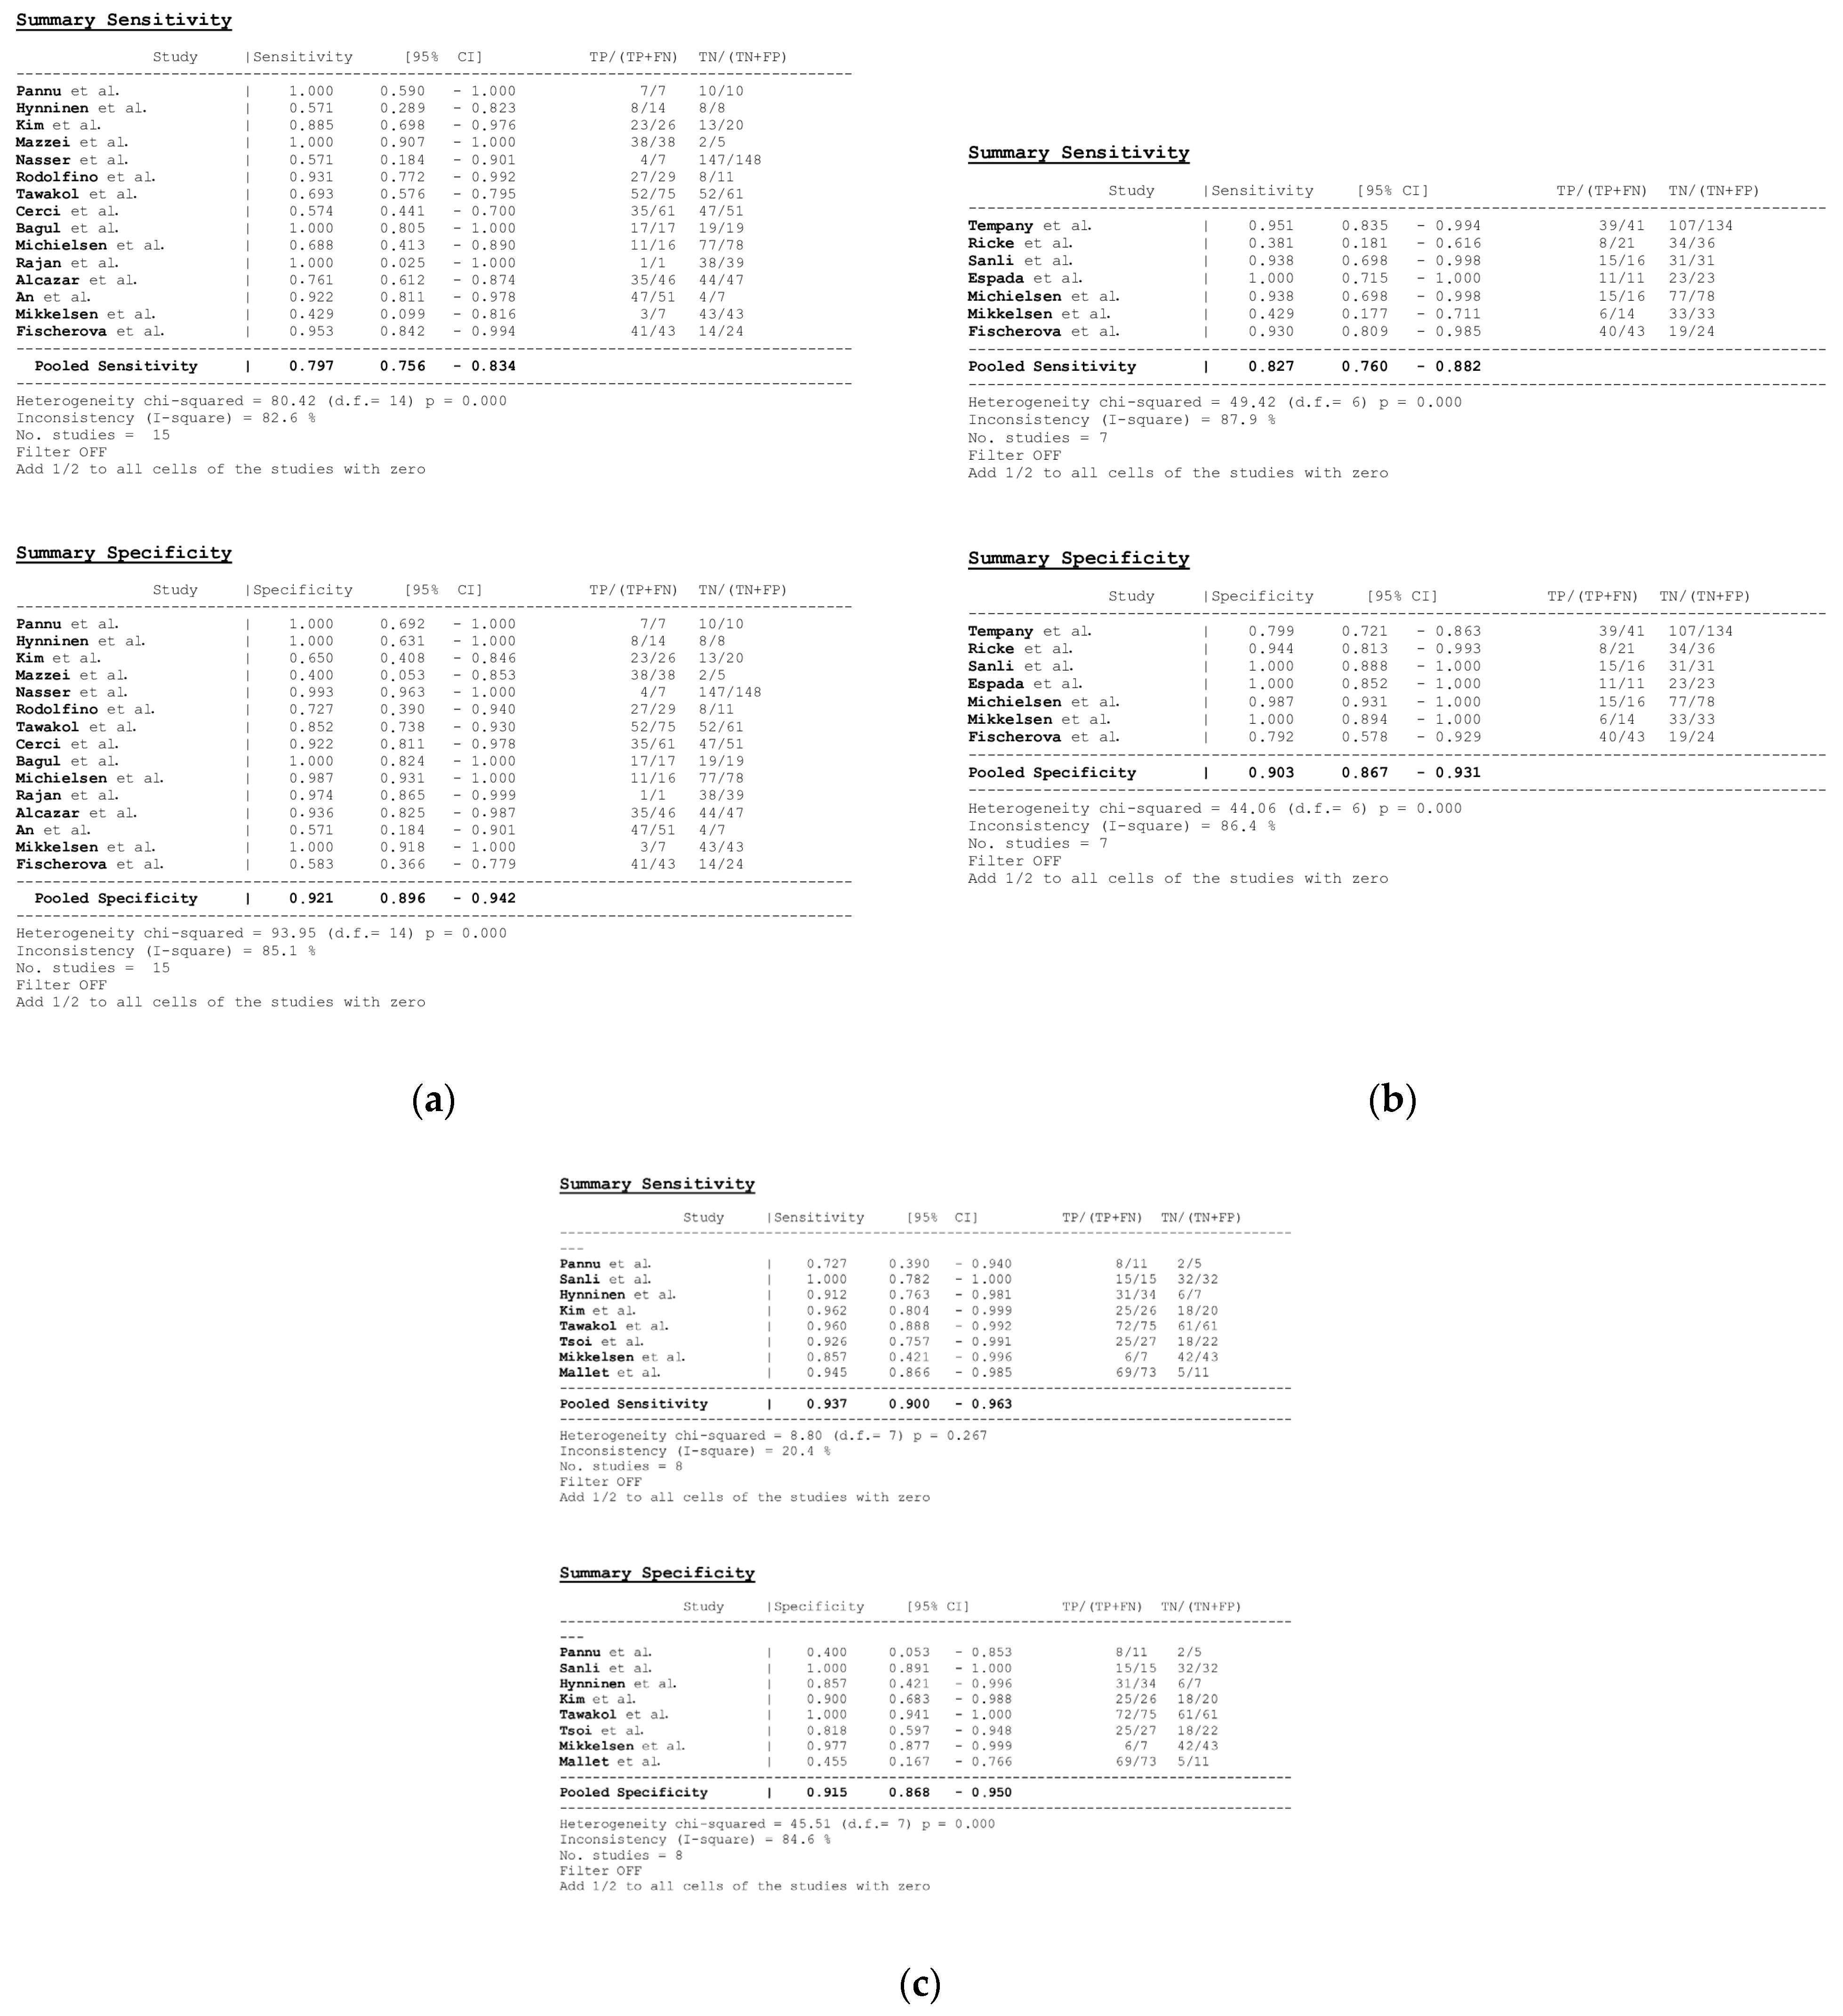
3.3. Diagnostic Performance
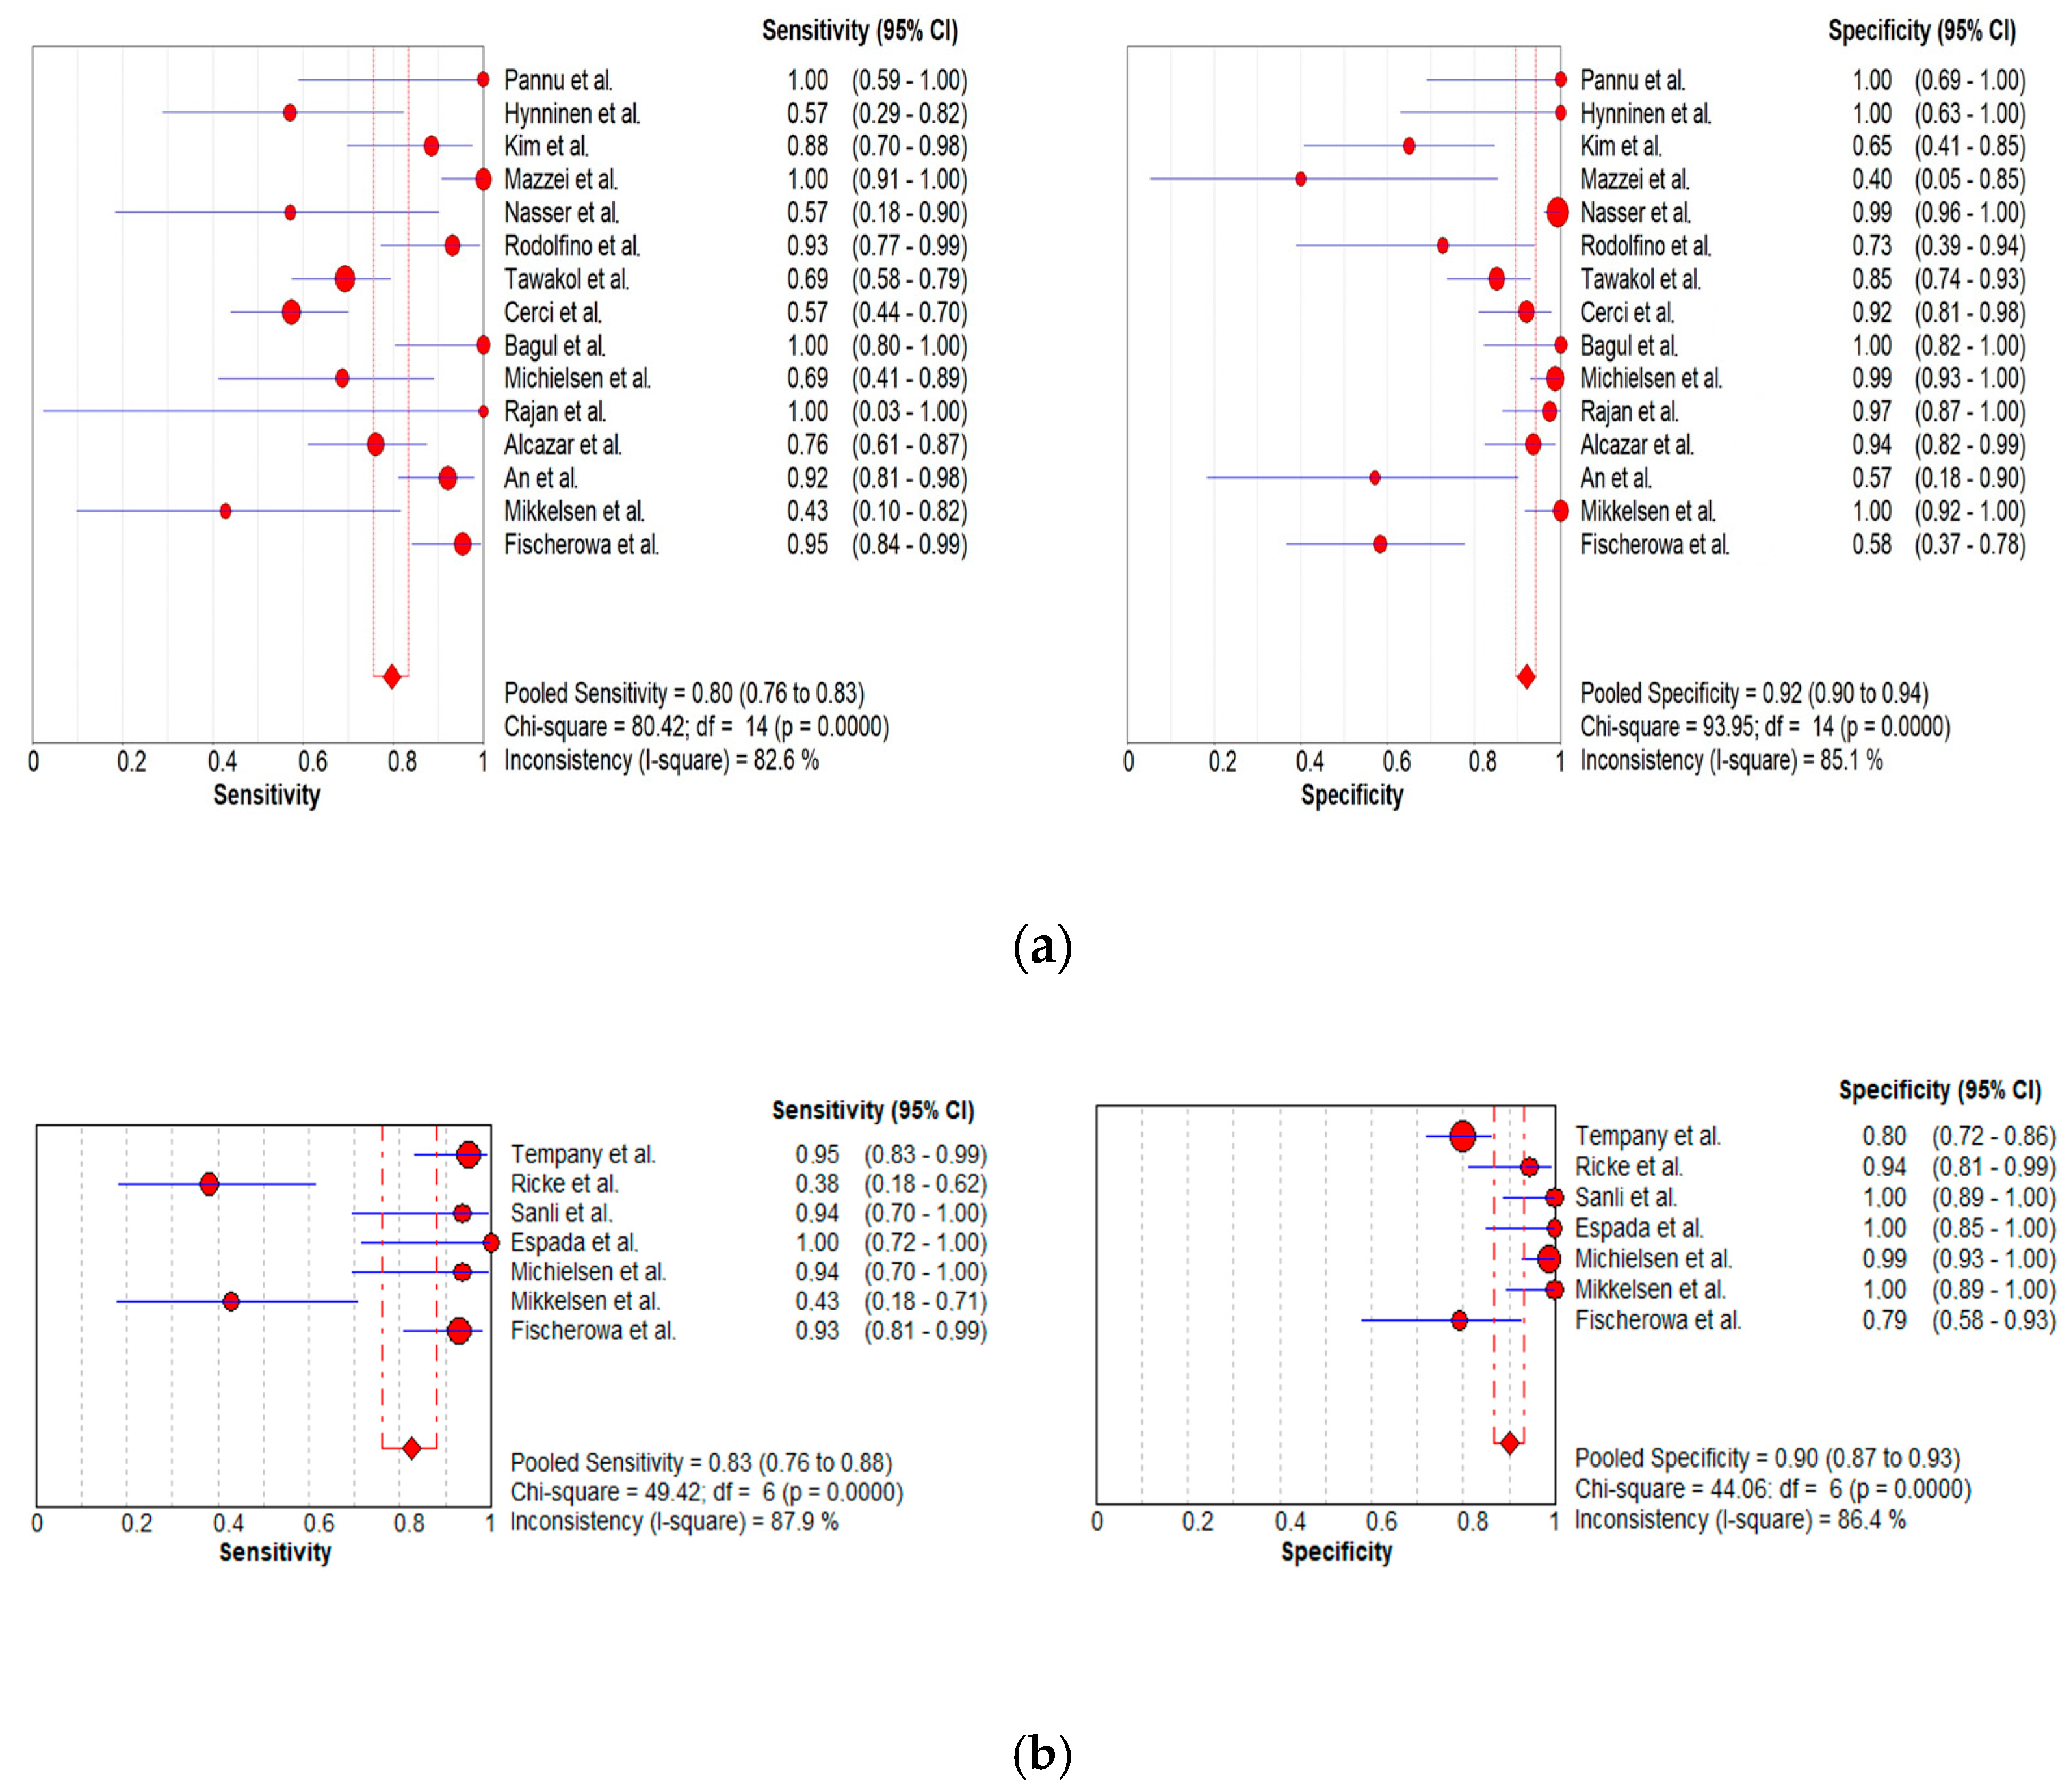
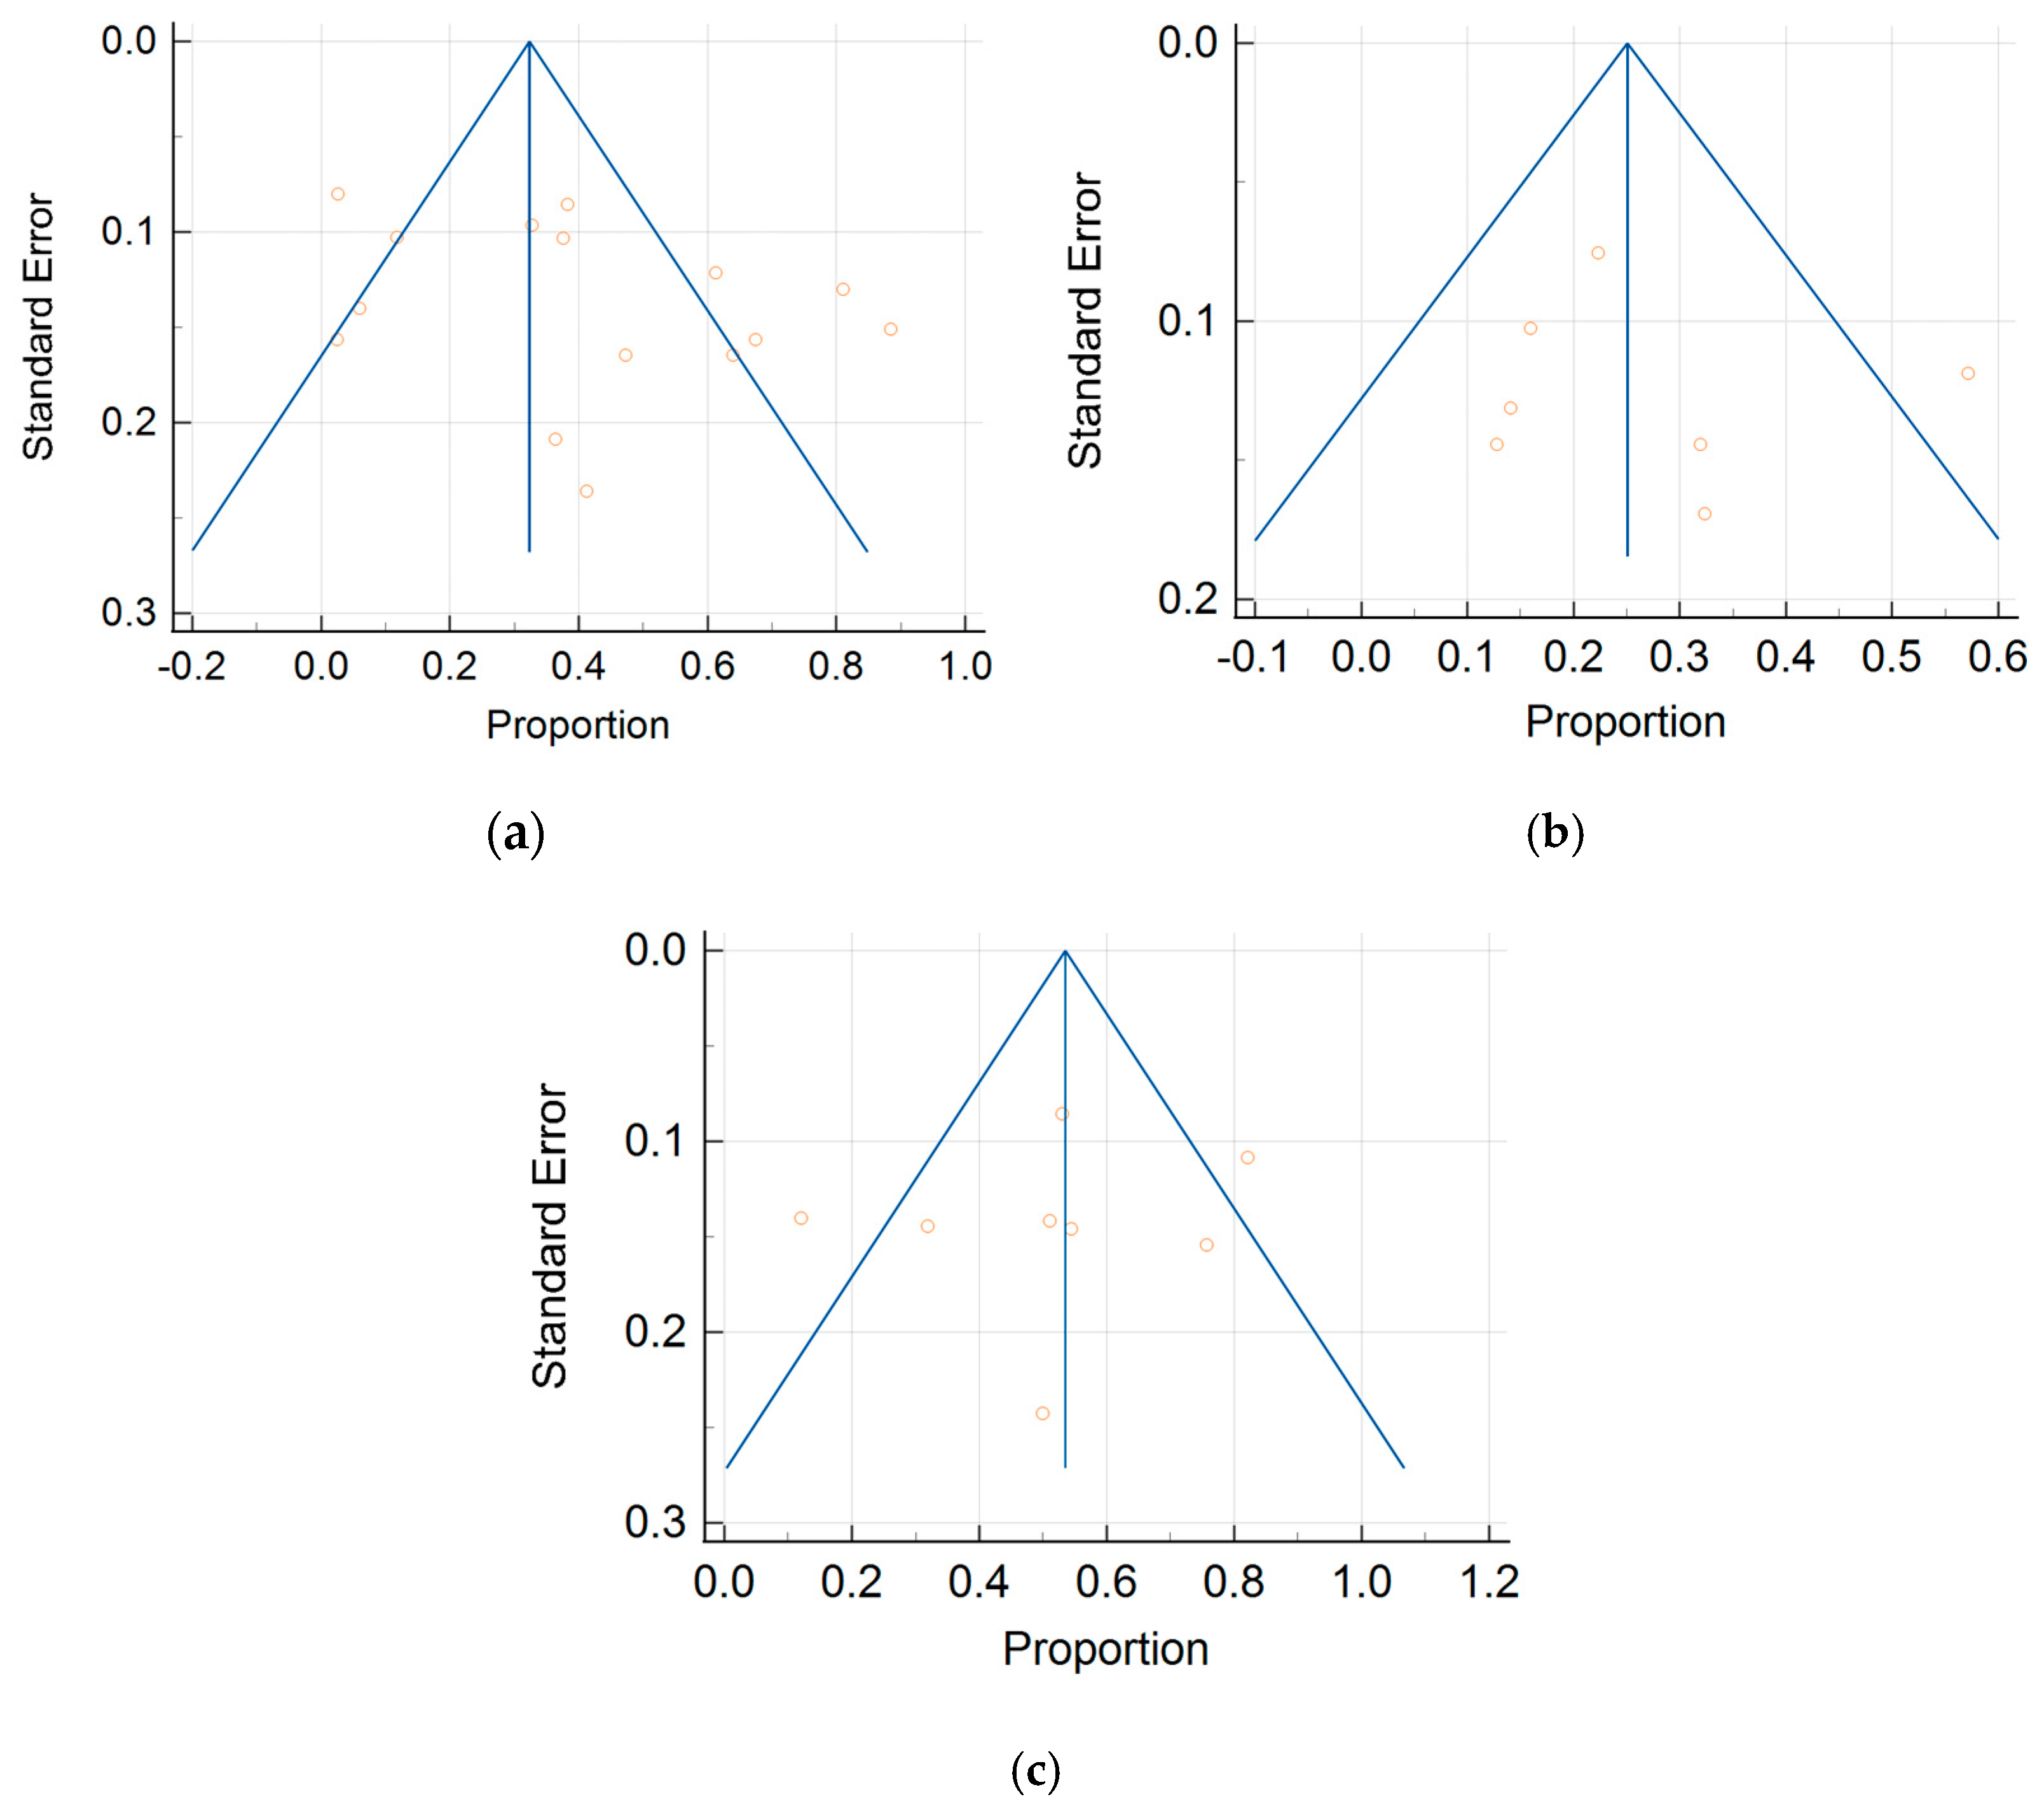
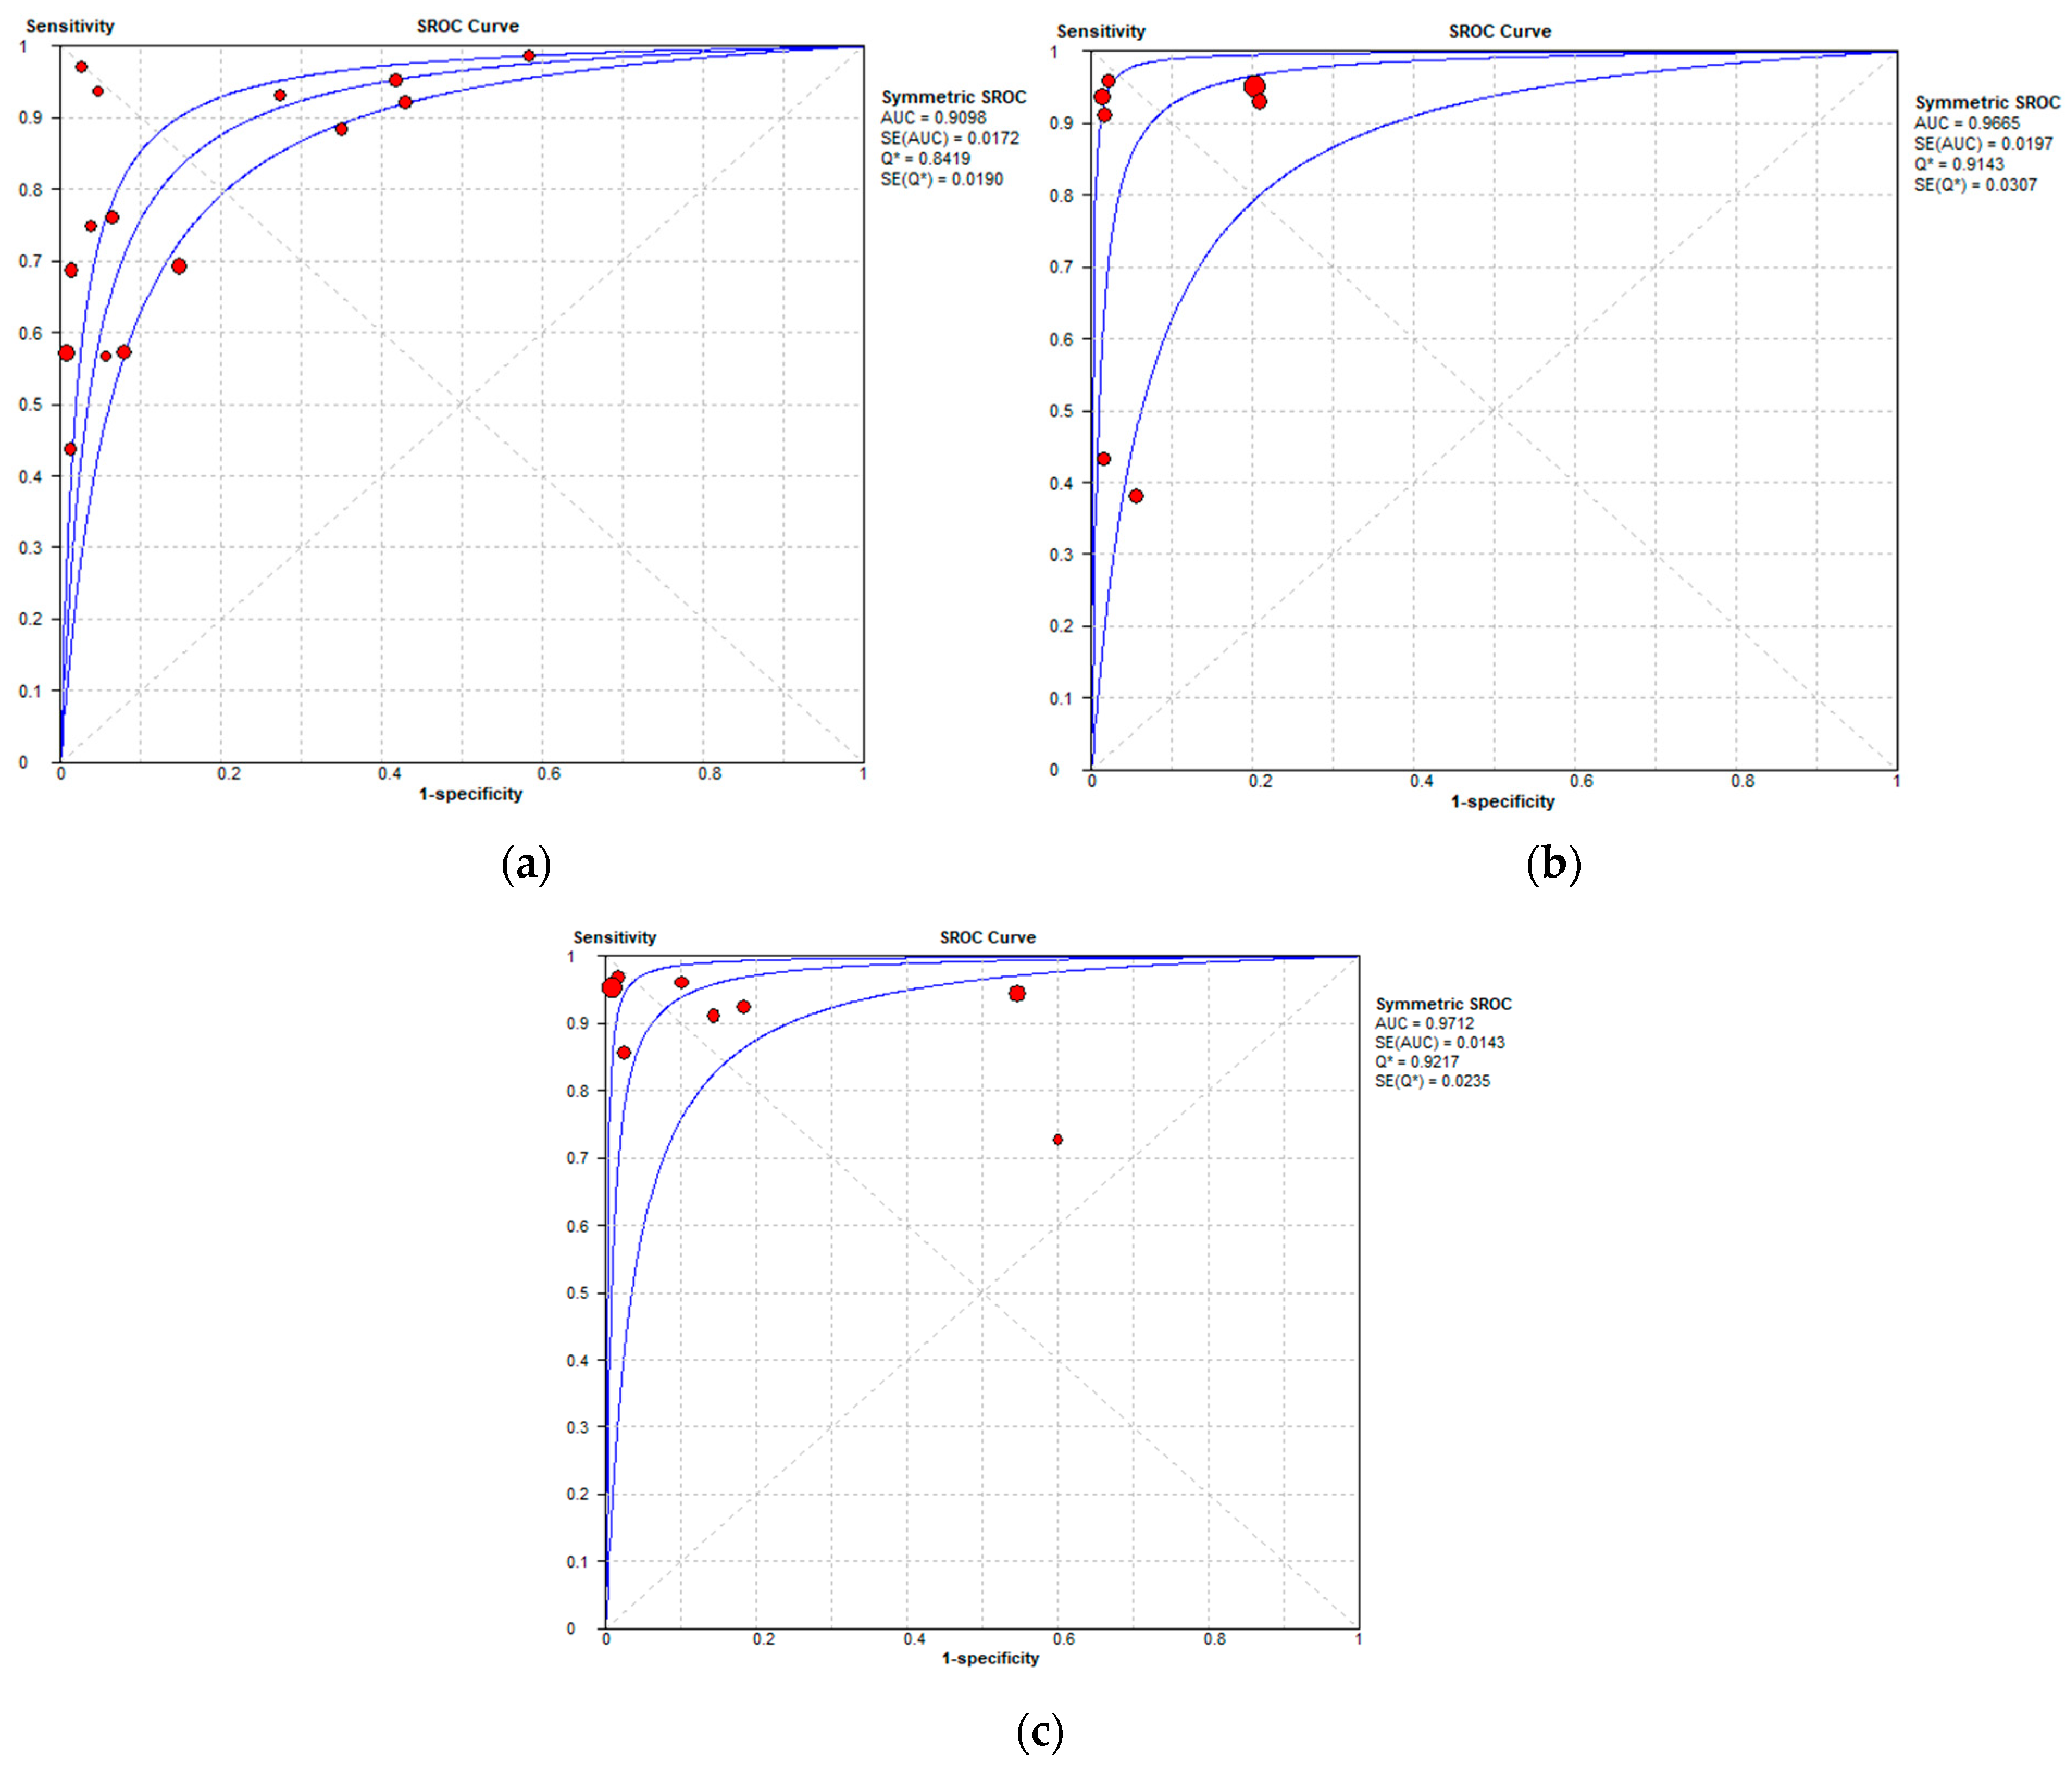
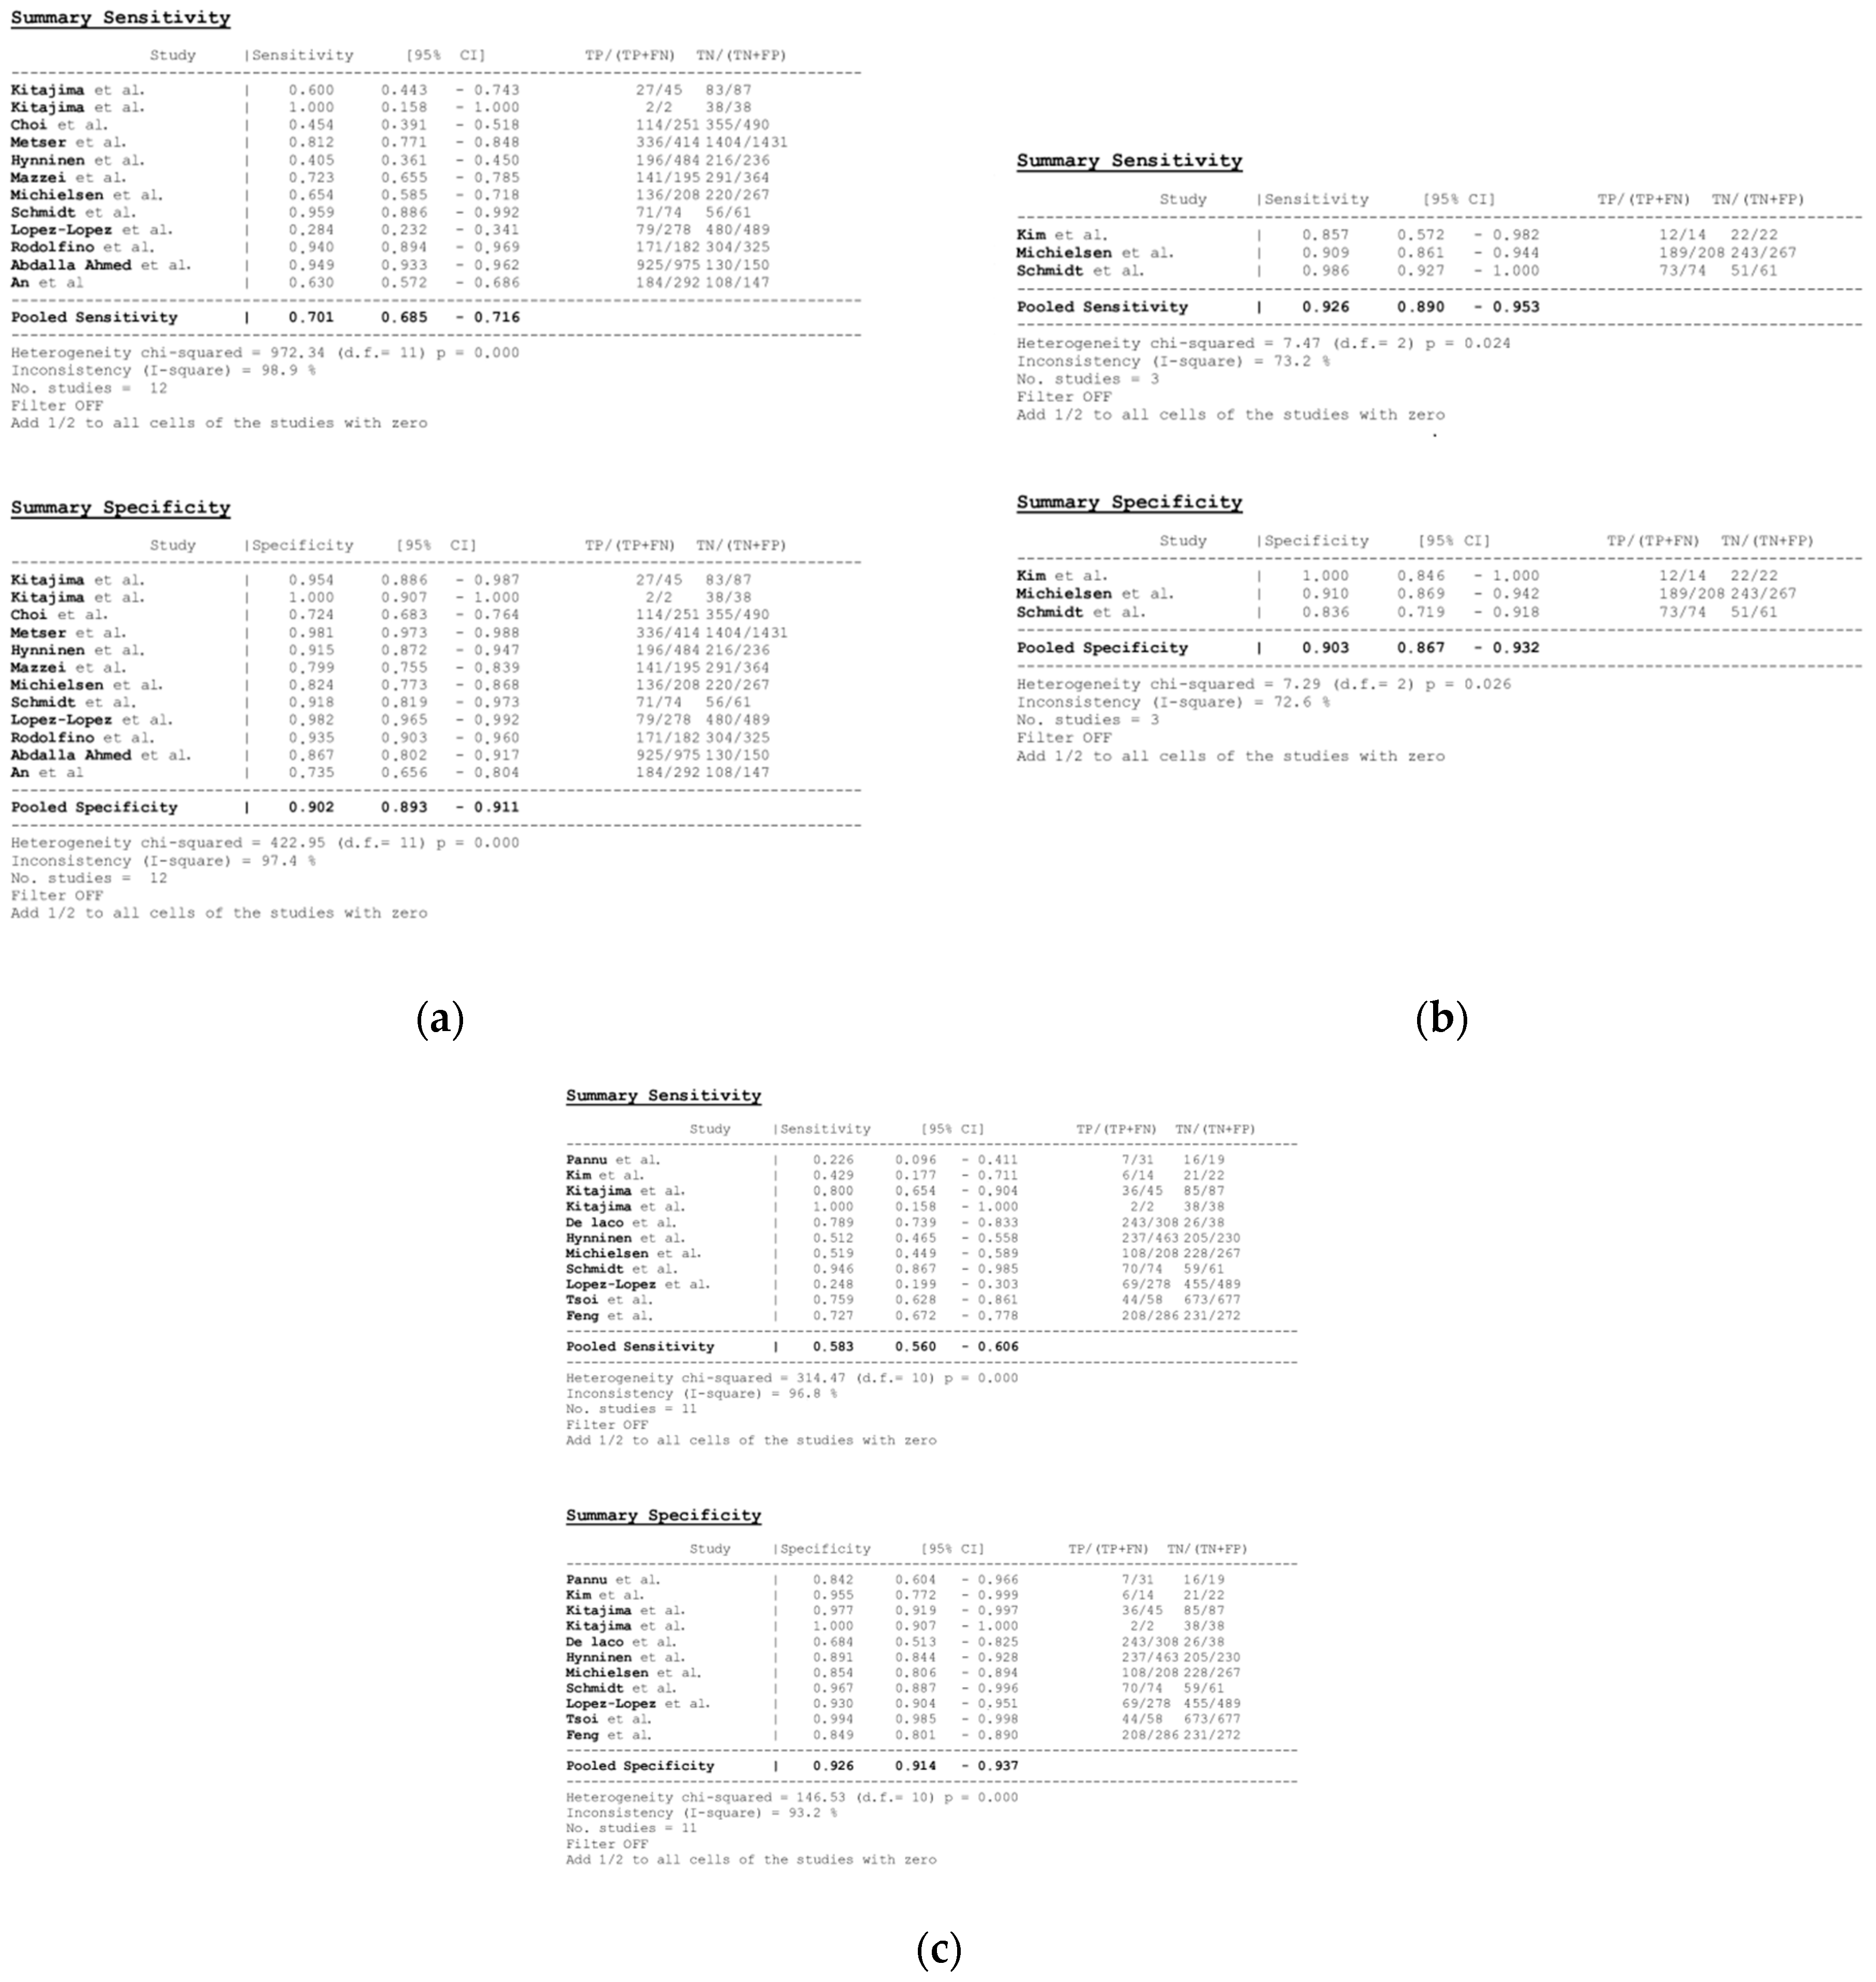
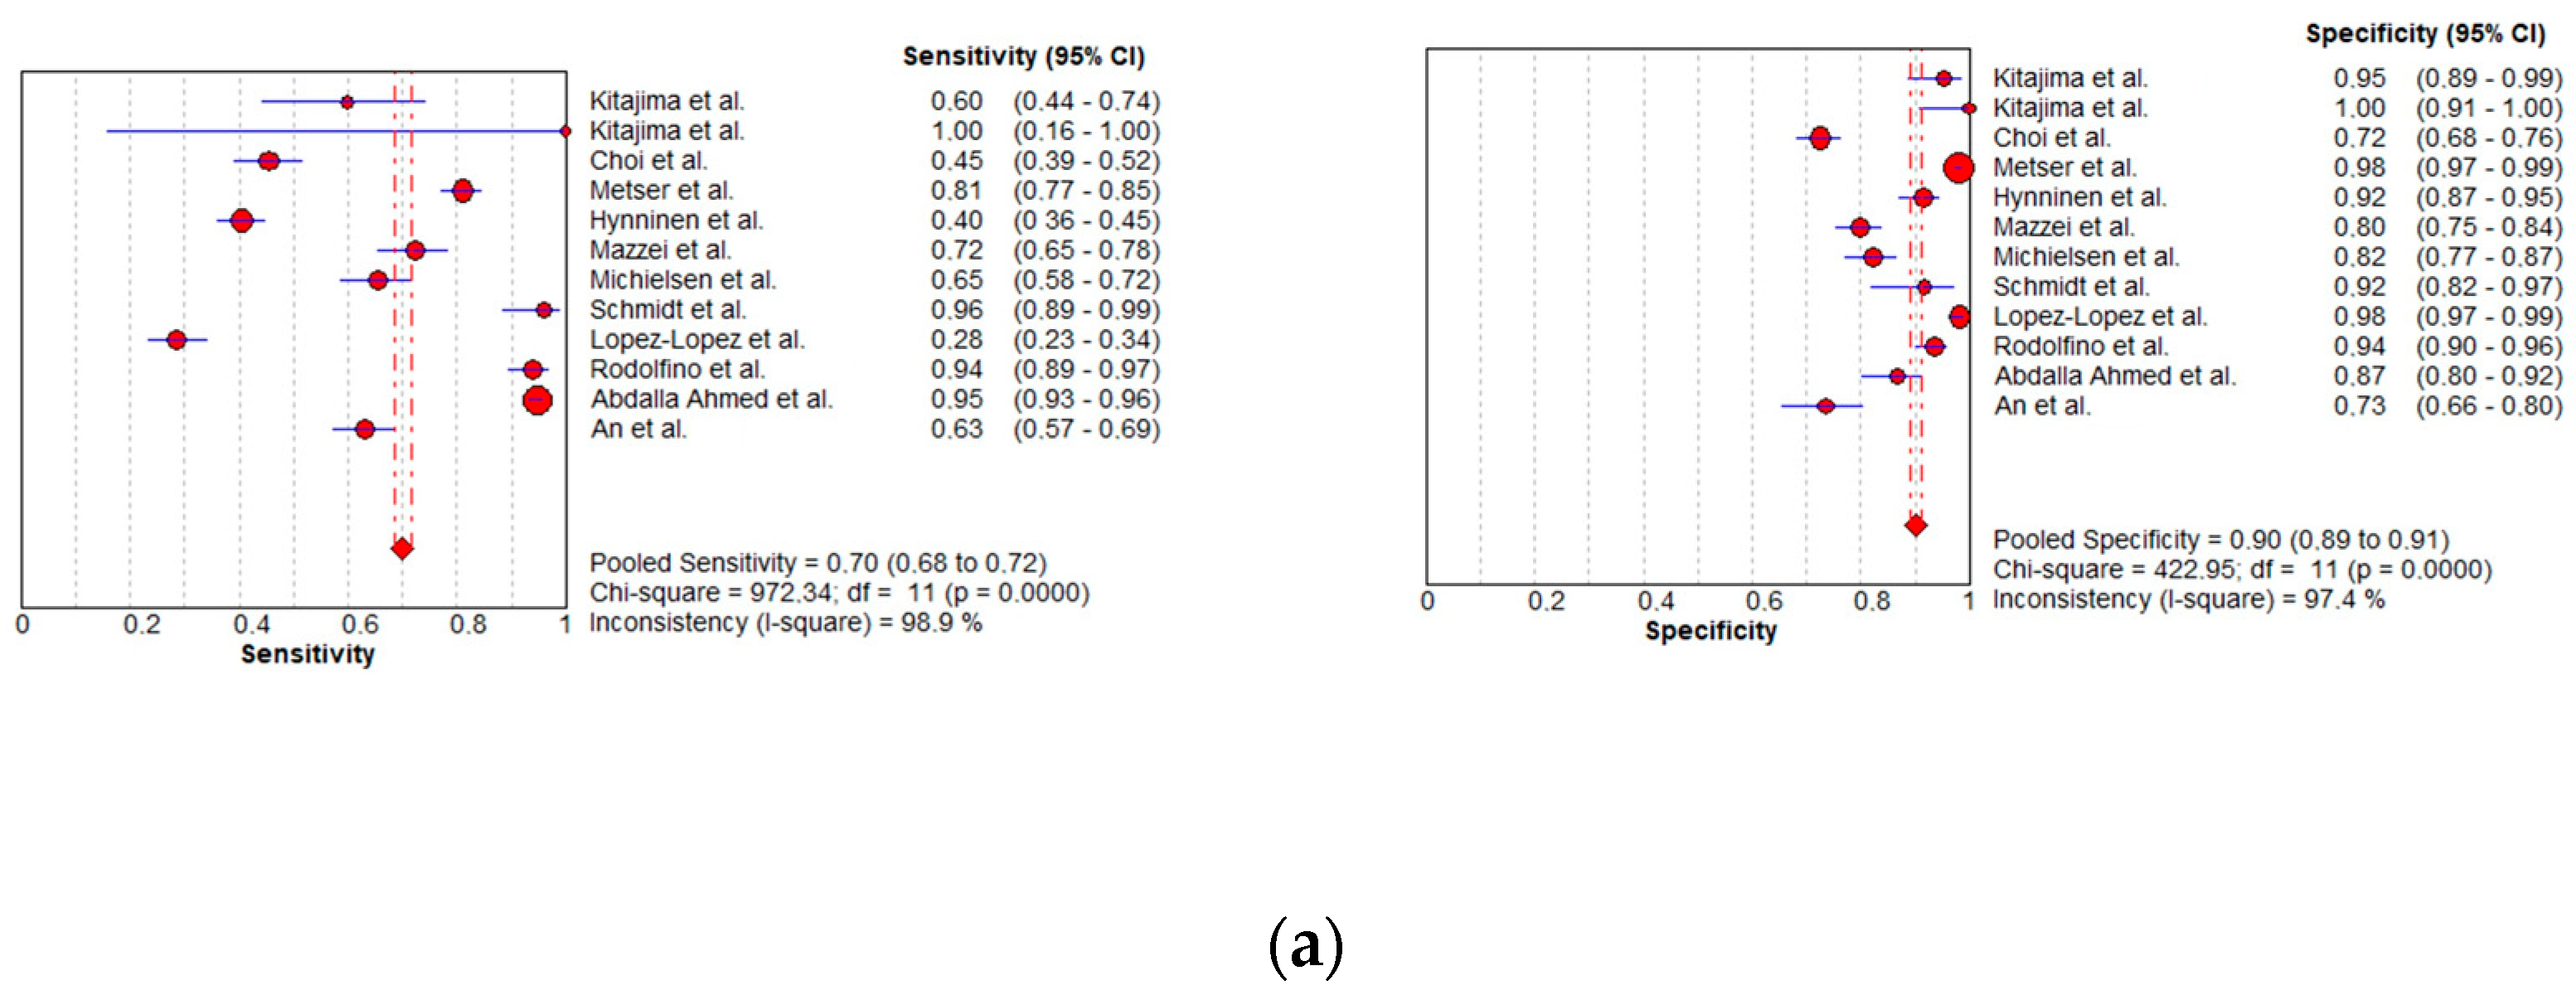
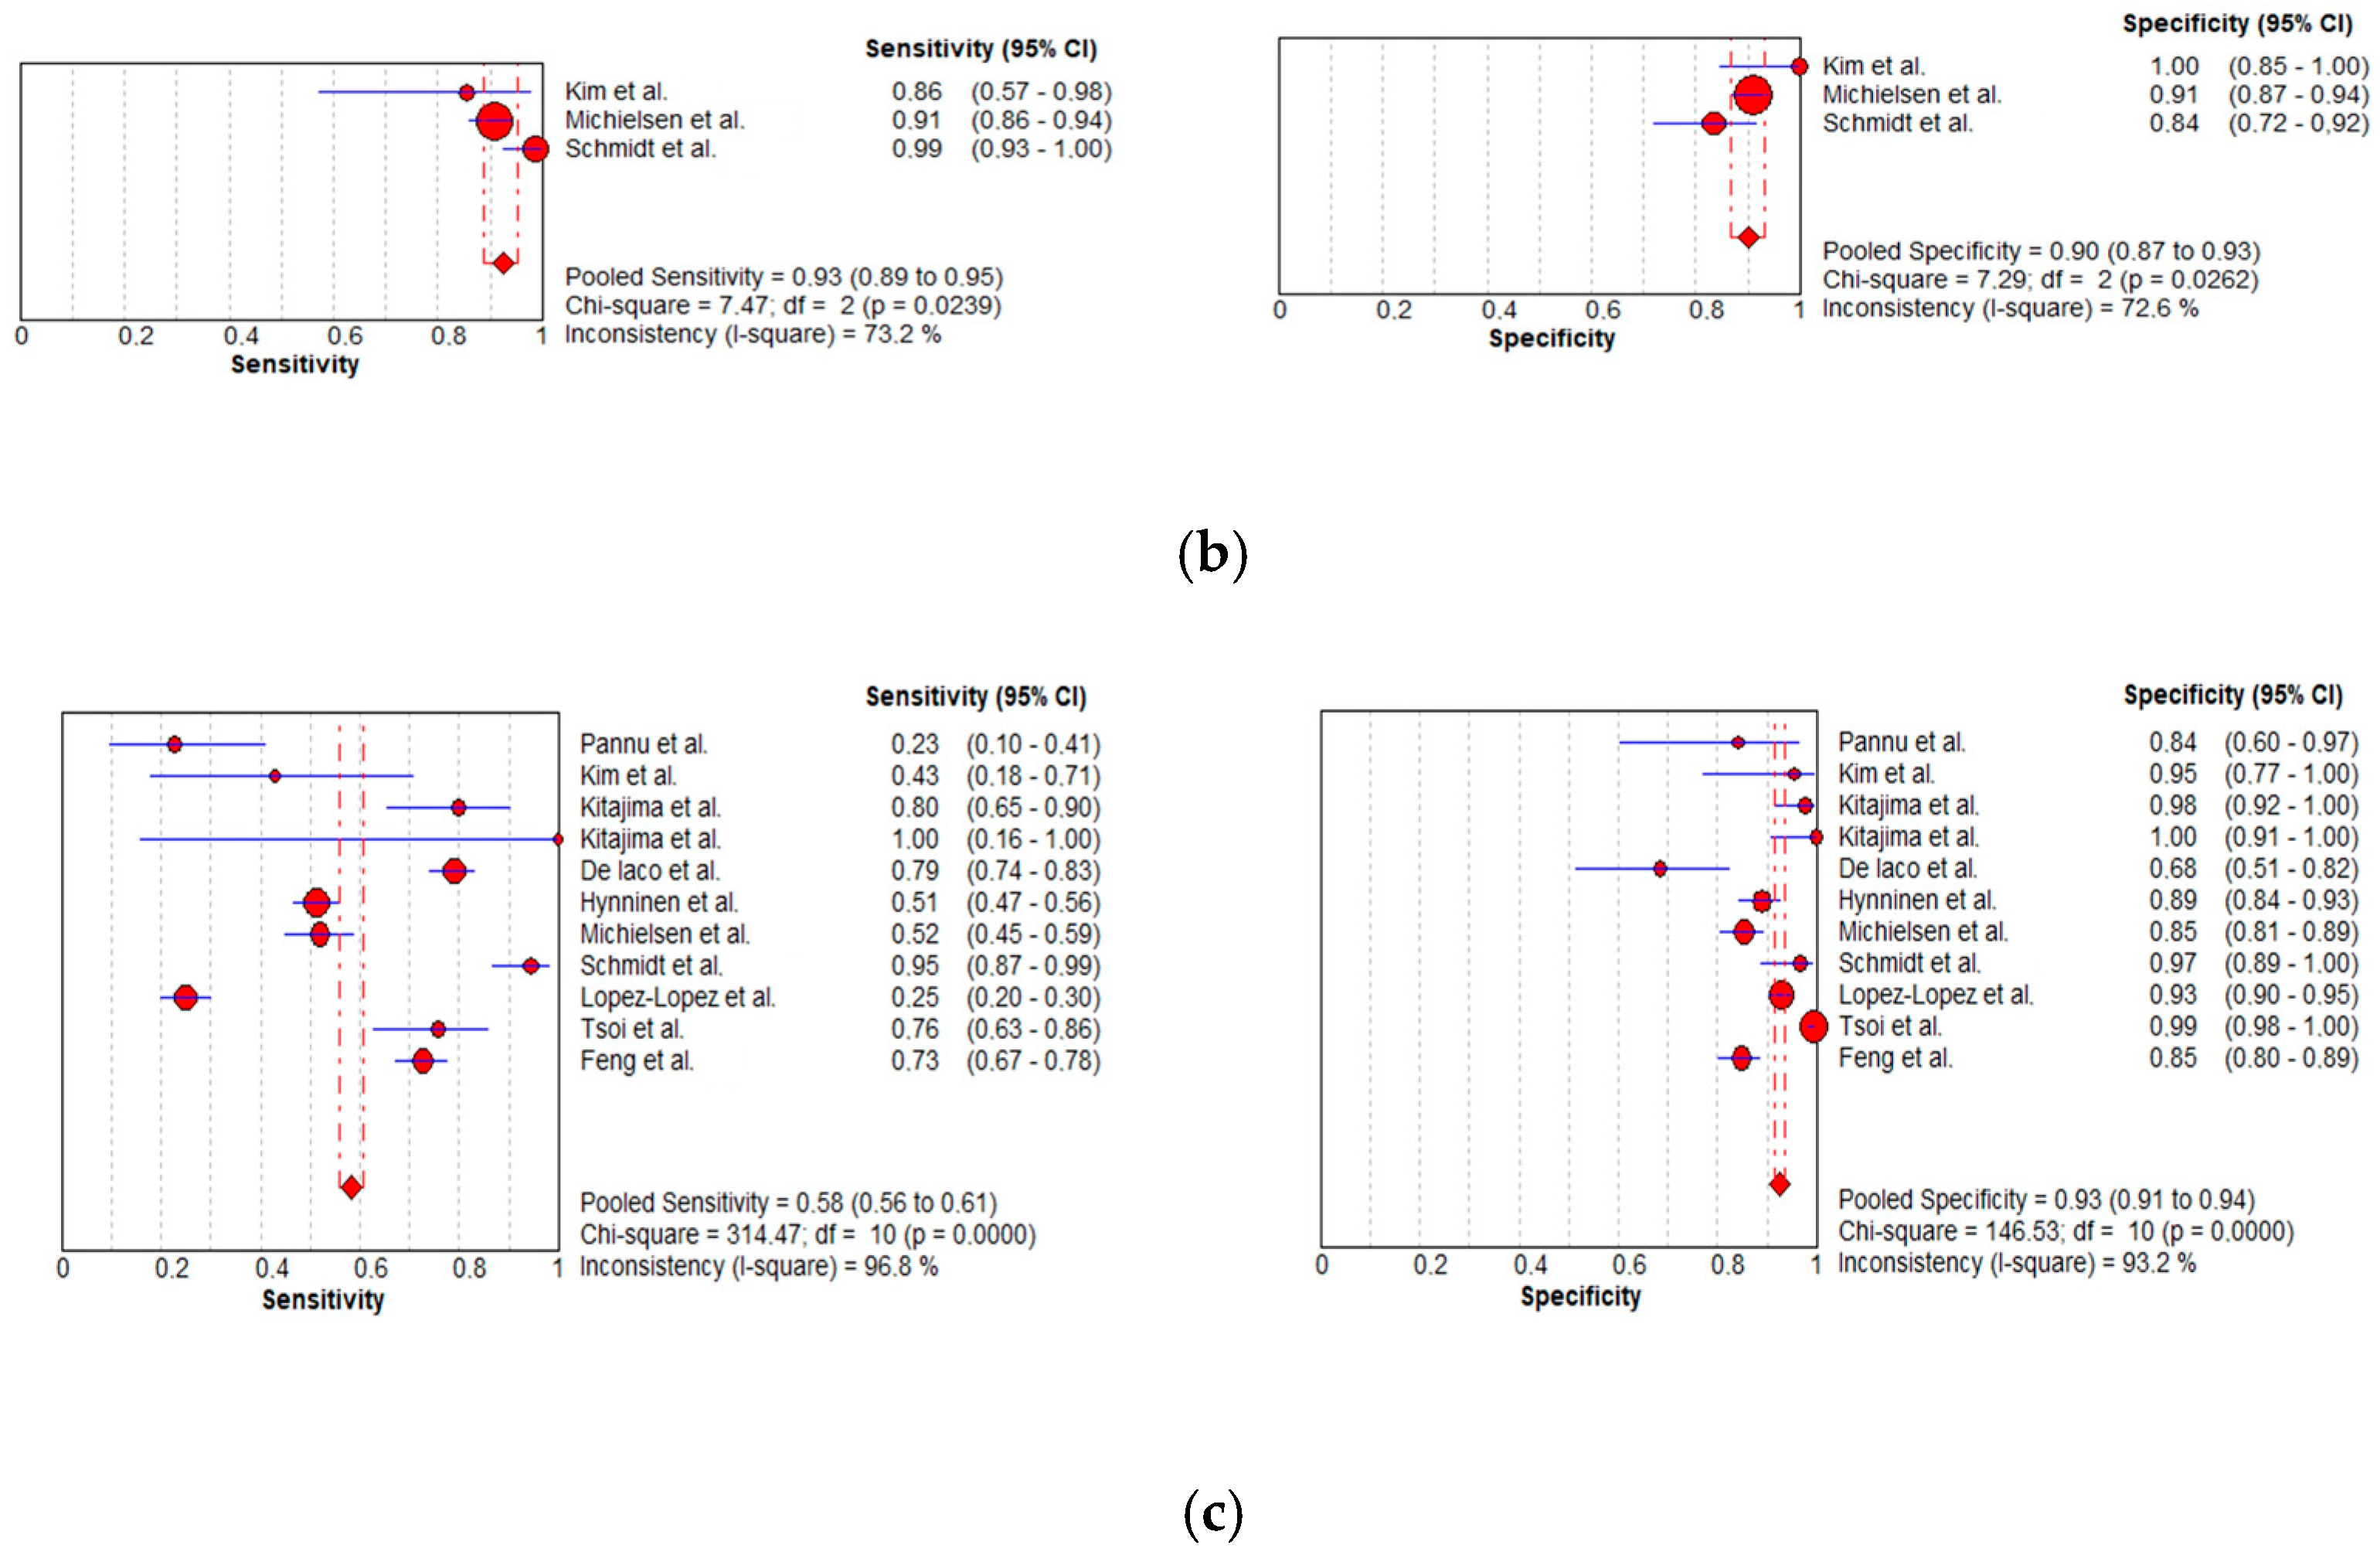
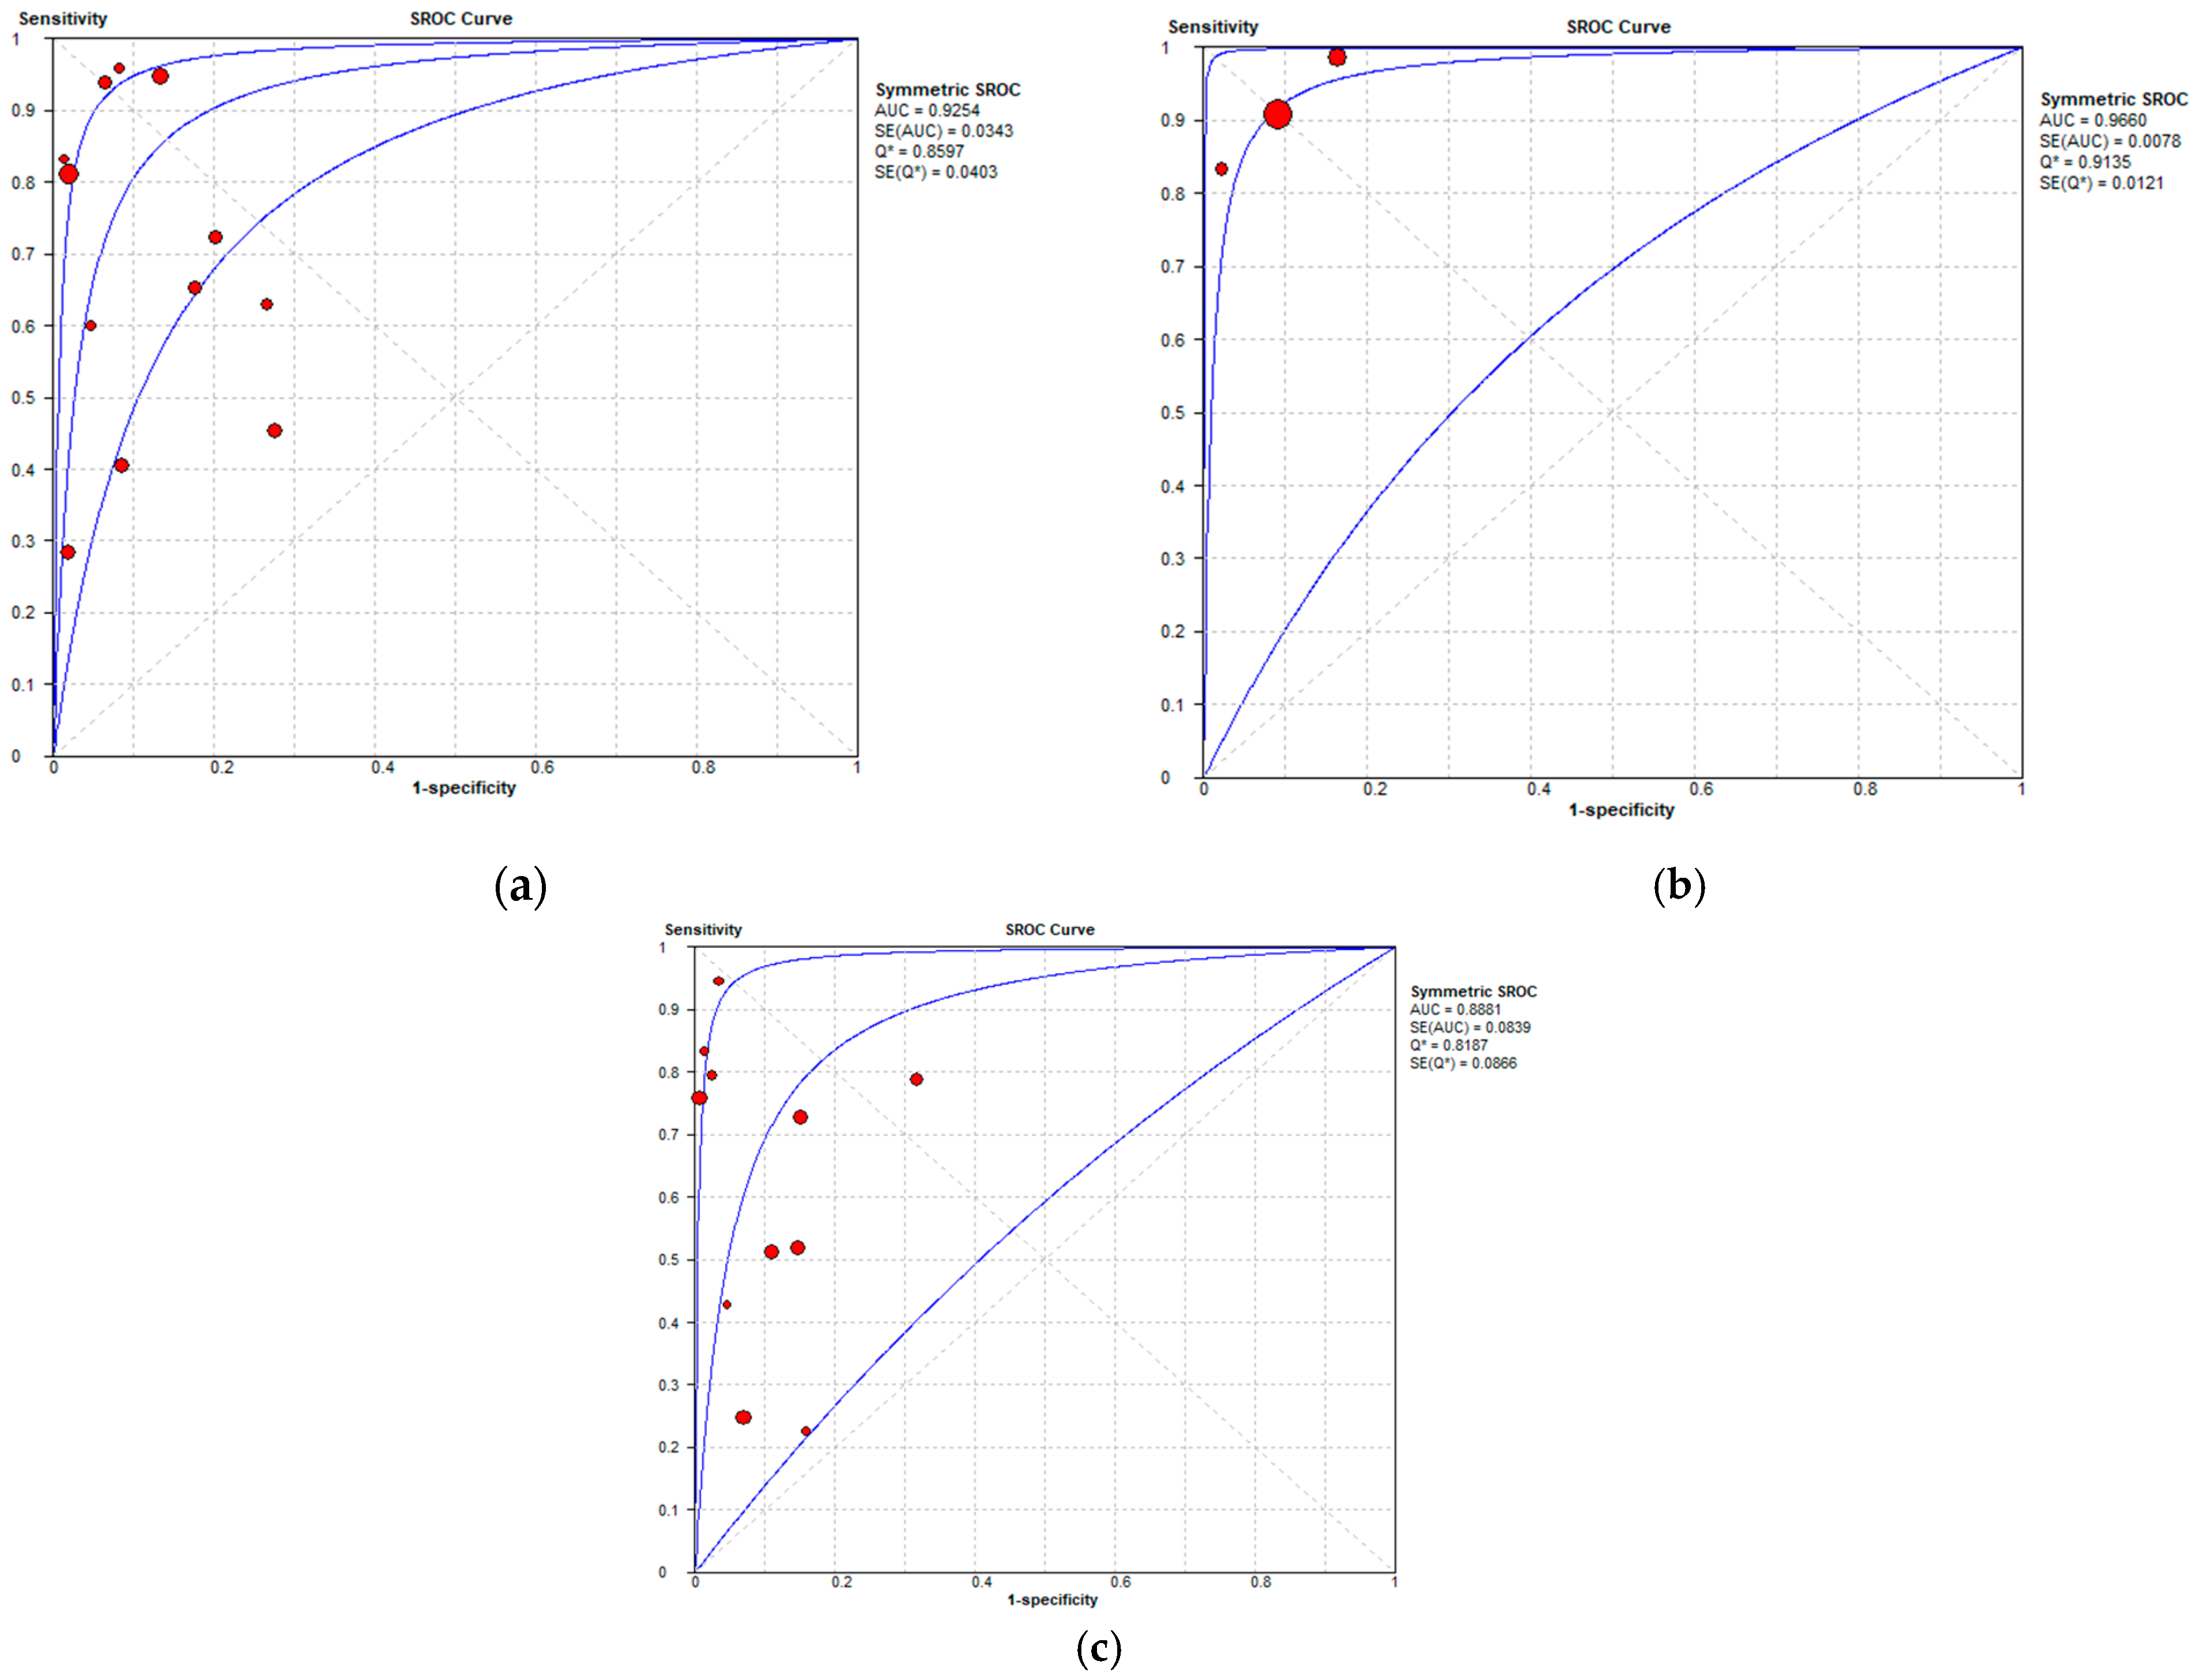
3.3.1. Per-Patient Analysis
3.3.2. Per-Region Analysis
3.3.3. Subgroup Analysis: Abdominopelvic Regions
Per-Patient Analysis
Per-Region Analysis
4. Discussion
5. Conclusions
Supplementary Materials
Author Contributions
Funding
Data Availability Statement
Conflicts of Interest
Abbreviations
| OC | ovarian cancer |
| PDS | primary debulking surgery |
| IDS | interval debulking surgery |
| NAC | neoadjuvant chemotherapy |
| PMs | peritoneal metastases |
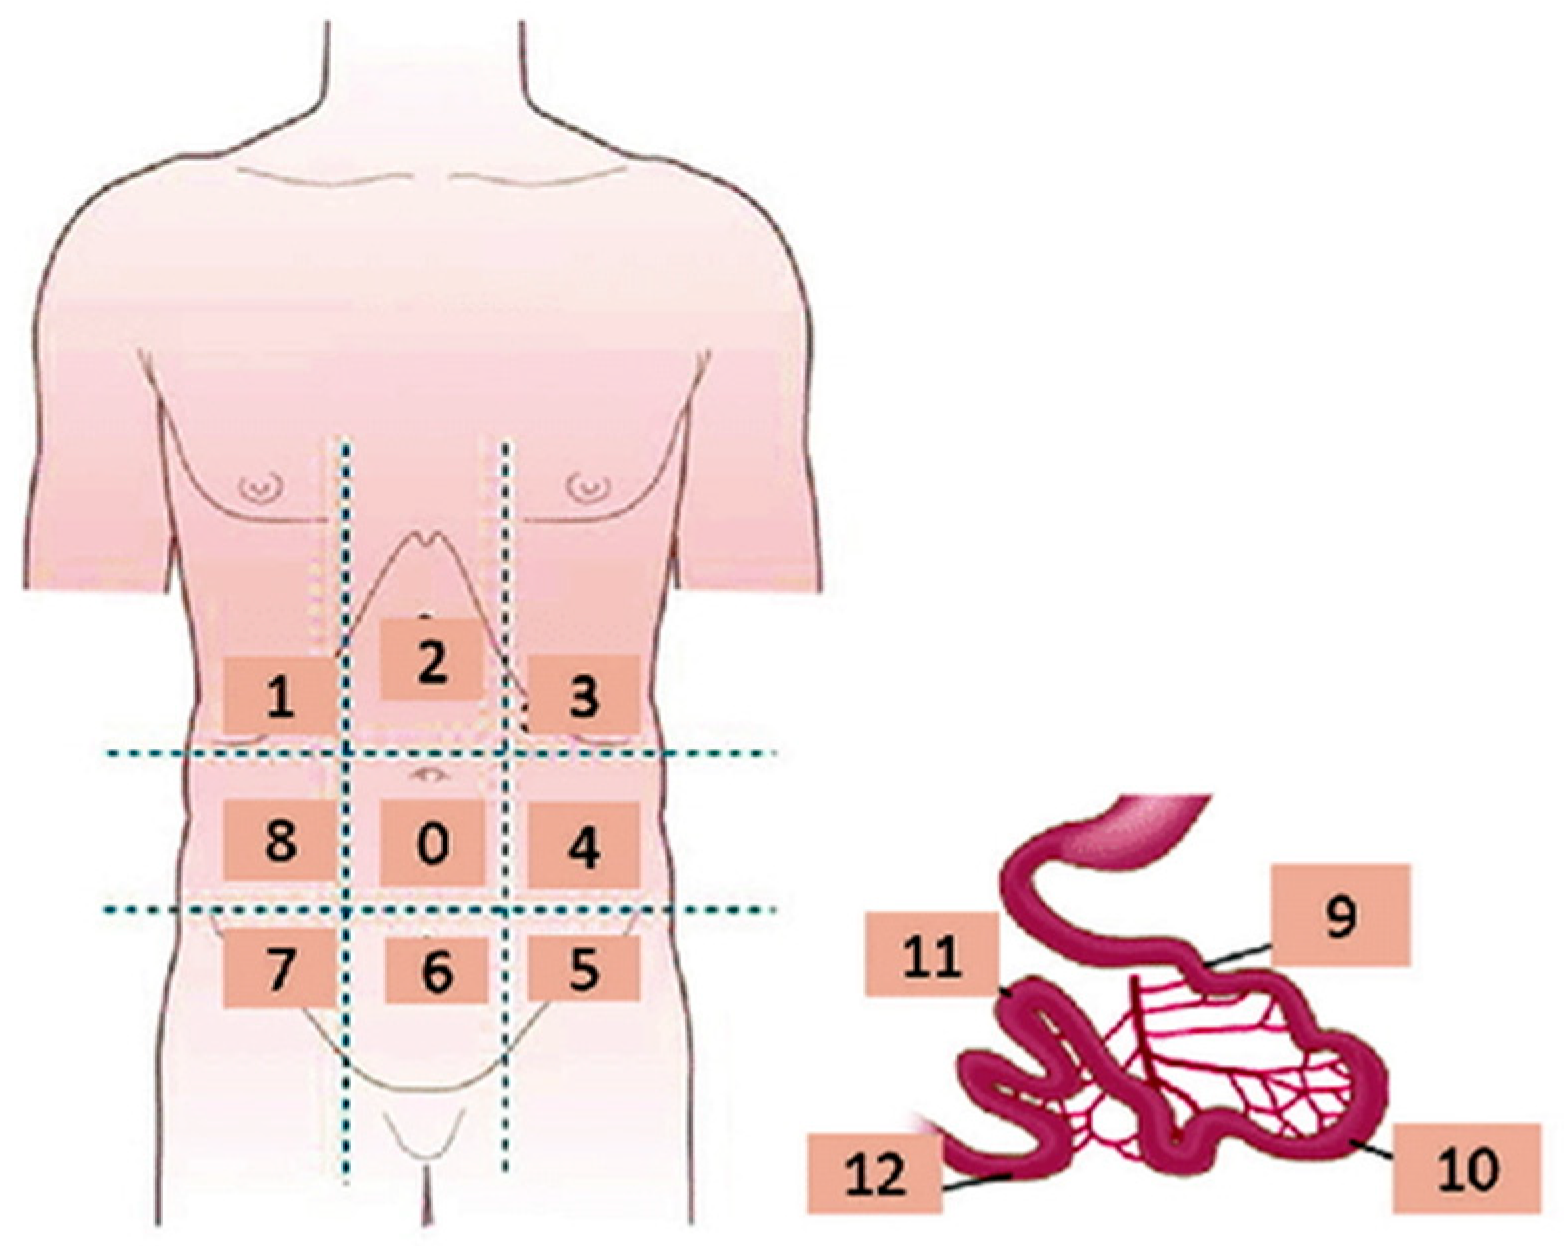
| PCI | peritoneal carcinomatosis index |
| ARs | abdominopelvic regions |
| PC | peritoneal carcinomatosis |
| MDCT | multidetector CT |
| DWI | diffusion-weighted imaging |
| PRISMA | preferred reporting items for systematic reviews and meta-analysis |
| FDG | fluorodeoxyglucose |
| PET | positron emission tomography |
| TP | true-positive |
| FN | false-negative |
| FP | false-positive |
| TN | true-negative |
| QUADAS | quality assessment of diagnostic accuracy studies |
| MPR | multiplanar reformation |
| WB-DWI | whole-body DWI |
| CECT | contrast-enhanced CT |
| CI | confidence interval |
| PPV | positive predictive value |
| NPV | negative predictive value |
| AUC | area under the curve |
| DOR | diagnostic odds ratio |
| SROC | summary receiver operating characteristic curve |
References
- Expert Panel on Women’s Imaging; Kang, S.K.; Reinhold, C.; Atri, M.; Benson, C.B.; Bhosale, P.R.; Jhingran, A.; Lakhman, Y.; Maturen, K.E.; Nicola, R.; et al. ACR Appropriateness Criteria® Staging and Follow-Up of Ovarian Cancer. J. Am. Coll. Radiol. 2018, 15, S198–S207. [Google Scholar] [CrossRef] [PubMed]
- American Cancer Society. Cancer Facts & Figures 2024. Available online: https://www.cancer.org/content/dam/cancer-org/research/cancer-facts-and-statistics/annual-cancer-facts-and-figures/2024/2024-cancer-facts-and-figures-acs.pdf (accessed on 4 April 2024).
- Nougaret, S.; Addley, H.C.; Colombo, P.E.; Fujii, S.; Al Sharif, S.S.; Tirumani, S.H.; Jardon, K.; Sala, E.; Reinhold, C. Ovarian carcinomatosis: How the radiologist can help plan the surgical approach. Radiographics 2012, 32, 1775–1800. [Google Scholar] [CrossRef] [PubMed]
- Nam, E.J.; Yun, M.J.; Oh, Y.T.; Kim, J.W.; Kim, J.H.; Kim, S.; Jung, Y.W.; Kim, S.W.; Kim, Y.T. Diagnosis and staging of primary ovarian cancer: Correlation between PET/CT, Doppler US, and CT or MRI. Gynecol. Oncol. 2010, 116, 389–394. [Google Scholar] [CrossRef] [PubMed]
- An, H.; Lee, E.Y.P.; Chiu, K.; Chang, C. The emerging roles of functional imaging in ovarian cancer with peritoneal carcinomatosis. Clin. Radiol. 2018, 73, 597–609. [Google Scholar] [CrossRef] [PubMed]
- Forstner, R.; Meissnitzer, M.; Cunha, T.M. Update on Imaging of Ovarian Cancer. Curr. Radiol. Rep. 2016, 4, 31. [Google Scholar] [CrossRef] [PubMed]
- Forstner, R.; Sala, E.; Kinkel, K.; Spencer, J.A. European Society of Urogenital Radiology, ESUR guidelines: Ovarian cancer staging and follow-up. Eur. Radiol. 2010, 20, 2773–2780. [Google Scholar] [CrossRef] [PubMed]
- Shinagare, A.B.; Sadowski, E.A.; Park, H.; Brook, O.R.; Forstner, R.; Wallace, S.K.; Horowitz, J.M.; Horowitz, N.; Javitt, M.; Jha, P.; et al. Ovarian cancer reporting lexicon for computed tomography (CT) and magnetic resonance (MR) imaging developed by the SAR Uterine and Ovarian Cancer Disease-Focused Panel and the ESUR Female Pelvic Imaging Working Group. Eur. Radiol. 2022, 32, 3220–3235. [Google Scholar] [CrossRef] [PubMed]
- Javadi, S.; Ganeshan, D.M.; Qayyum, A.; Iyer, R.B.; Bhosale, P. Ovarian Cancer, the Revised FIGO Staging System, and the Role of Imaging. AJR Am. J. Roentgenol. 2016, 206, 1351–1360. [Google Scholar] [CrossRef] [PubMed]
- Ghirardi, V.; Fagotti, A.; Ansaloni, L.; Valle, M.; Roviello, F.; Sorrentino, L.; Accarpio, F.; Baiocchi, G.; Piccini, L.; De Simone, M.; et al. Diagnostic and Therapeutic Pathway of Advanced Ovarian Cancer with Peritoneal Metastases. Cancers 2023, 15, 407. [Google Scholar] [CrossRef] [PubMed]
- Armbrust, R.; Ledwon, P.; Von Rüsten, A.; Schneider, C.; Sehouli, J. Primary Treatment Results in Patients with Ovarian, Fallopian or Peritoneal Cancer-Results of a Clinical Cancer Registry Database Analysis in Germany. Cancers 2022, 24, 4638. [Google Scholar] [CrossRef] [PubMed]
- Pasqual, E.M.; Londero, A.P.; Robella, M.; Tonello, M.; Sommariva, A.; De Simone, M.; Bacchetti, S.; Baiocchi, G.; Asero, S.; Coccolini, F.; et al. Repeated Cytoreduction Combined with Hyperthermic Intraperitoneal Chemotherapy (HIPEC) in Selected Patients Affected by Peritoneal Metastases: Italian PSM Oncoteam Evidence. Cancers 2023, 15, 607. [Google Scholar] [CrossRef] [PubMed]
- Kyriazi, S.; Kaye, S.B.; DeSouza, N.M. Imaging ovarian cancer and peritoneal metastases-current and emerging techniques. Nat. Rev. Clin. Oncol. 2010, 7, 381–393. [Google Scholar] [CrossRef] [PubMed]
- Rizzo, S.; Del Grande, M.; Manganaro, L.; Papadia, A.; Del Grande, F. Imaging before cytoreductive surgery in advanced ovarian cancer patients. Int. J. Gynecol. Cancer 2020, 30, 133–138. [Google Scholar] [CrossRef] [PubMed]
- Nougaret, S.; Sadowski, E.; Lakhman, Y.; Rousset, P.; Lahaye, M.; Worley, M.; Sgarbura, O.; Shinagare, A.B. The BUMPy road of peritoneal metastases in ovarian cancer. Diagn. Interv. Imaging 2022, 103, 448–459. [Google Scholar] [CrossRef]
- Gagliardi, T.; Adejolu, M.; DeSouza, N.M. Diffusion-Weighted Magnetic Resonance Imaging in Ovarian Cancer: Exploiting Strengths and Understanding Limitations. J. Clin. Med. 2022, 11, 1524. [Google Scholar] [CrossRef] [PubMed]
- Lee, E.Y.P.; An, H.; Tse, K.Y.; Khong, P.L. Molecular Imaging of Peritoneal Carcinomatosis in Ovarian Carcinoma. AJR Am. J. Roentgenol. 2020, 215, 305–312. [Google Scholar] [CrossRef]
- Coakley, F.V.; Choi, P.H.; Gougoutas, C.A.; Pothuri, B.; Venkatraman, E.; Chi, D.; Bergman, A.; Hricak, H. Peritoneal metastases: Detection with spiral CT in patients with ovarian cancer. Radiology 2002, 223, 495–499. [Google Scholar] [CrossRef] [PubMed]
- Tsili, A.C.; Naka, C.; Argyropoulou, M.I. Multidetector computed tomography in diagnosing peritoneal metastases in ovarian carcinoma. Acta Radiol. 2021, 62, 1696–1706. [Google Scholar] [CrossRef] [PubMed]
- Patel, C.M.; Sahdev, A.; Reznek, R.H. CT, MRI and PET imaging in peritoneal malignancy. Cancer Imaging 2011, 11, 123–139. [Google Scholar] [CrossRef] [PubMed]
- Iafrate, F.; Ciolina, M.; Sammartino, P.; Baldassari, P.; Rengo, M.; Lucchesi, P.; Sibio, S.; Accarpio, F.; Di Giorgio, A.; Laghi, A. Peritoneal carcinomatosis: Imaging with 64-MDCT and 3T MRI with diffusion-weighted imaging. Abdom. Imaging 2012, 37, 616–627. [Google Scholar] [CrossRef] [PubMed]
- Qayyum, A.; Coakley, F.V.; Westphalen, A.C. Role of CT and MR imaging in predicting optimal cytoreduction of newly diagnosed primary epithelial ovarian cancer. Gynecol. Oncol. 2005, 96, 301–306. [Google Scholar] [CrossRef] [PubMed]
- Jacquet, P.; Sugarbaker, P.H. Clinical research methodologies in diagnosis and staging of patients with peritoneal carcinomatosis. In Peritoneal Carcinomatosis: Principles of Management; Sugarbaker, P.H., Ed.; Kluwer Academic Publishers: Boston, MA, USA, 1996; Volume 82, pp. 359–374. [Google Scholar]
- Abdalla Ahmed, S.; Abou-Taleb, H.; Ali, N.; Badary, D.M. Accuracy of radiologic- laparoscopic peritoneal carcinomatosis categorization in the prediction of surgical outcome. Br. J. Radiol. 2019, 92, 20190163. [Google Scholar] [CrossRef]
- Rutten, I.J.; Van de Laar, R.; Kruitwagen, R.F.; Bakers, F.C.; Ploegmakers, M.J.; Pappot, T.W.; Beets-Tan, R.G.H.; Massuger, L.F.A.G.; Zusterzeel, P.L.M.; Gorp, T.V. Prediction of incomplete primary debulking surgery in patients with advanced ovarian cancer: An external validation study of three models using computed tomography. Gynecol. Oncol. 2016, 140, 22–28. [Google Scholar] [CrossRef]
- Nasser, S.; Lazaridis, A.; Evangelou, M.; Jones, B.; Nixon, K.; Kyrgiou, M.; Gabra, H.; Rockall, A.; Fotopoulou, C. Correlation of pre-operative CT findings with surgical & histological tumor dissemination patterns at cytoreduction for primary advanced and relapsed epithelial ovarian cancer: A retrospective evaluation. Gynecol. Oncol. 2016, 143, 264–269. [Google Scholar] [PubMed]
- An, H.; Chiu, K.W.H.; Tse, K.Y.; Ngan, H.Y.S.; Khong, P.L.; Lee, E.Y.P. The Value of Contrast-Enhanced CT in the Detection of Residual Disease After Neo-Adjuvant Chemotherapy in Ovarian Cancer. Acad. Radiol. 2020, 27, 951–957. [Google Scholar] [CrossRef]
- Tozzi, R.; Traill, Z.; Valenti, G.; Ferrari, F.; Gubbala, K.; Campanile, R.G. A prospective study on the diagnostic pathway of patients with stage IIIC-IV ovarian cancer: Exploratory laparoscopy (EXL) + CT scan VS. CT scan. Gynecol. Oncol. 2021, 161, 188–193. [Google Scholar] [CrossRef] [PubMed]
- Onda, T.; Tanaka, Y.O.; Kitai, S.; Manabe, T.; Ishikawa, M.; Hasumi, Y.; Miyamoto, K.; Ogawa, G.; Satoh, T.; Saito, T.; et al. Stage III disease of ovarian, tubal and peritoneal cancers can be accurately diagnosed with pre-operative CT. Japan Clinical Oncology Group Study JCOG0602. Jpn. J. Clin. Oncol. 2021, 51, 205–212. [Google Scholar] [CrossRef] [PubMed]
- Mikkelsen, M.S.; Petersen, L.K.; Blaakaer, J.; Marinovskij, E.; Rosenkilde, M.; Andersen, G.; Bouchelouche, K.; Iversen, L.H. Assessment of peritoneal metastases with DW-MRI, CT, and FDG PET/CT before cytoreductive surgery for advanced stage epithelial ovarian cancer. Eur. J. Surg. Oncol. 2021, 47, 2134–2141. [Google Scholar] [CrossRef] [PubMed]
- Fehniger, J.; Thomas, S.; Lengyel, E.; Liao, C.; Tenney, M.; Oto, A.; Yamada, S.D. A prospective study evaluating diffusion weighted magnetic resonance imaging (DW-MRI) in the detection of peritoneal carcinomatosis in suspected gynecologic malignancies. Gynecol. Oncol. 2016, 142, 169–175. [Google Scholar] [CrossRef] [PubMed]
- Kyriazi, S.; Collins, D.J.; Morgan, V.A.; Giles, S.L.; DeSouza, N.M. Diffusion-weighted imaging of peritoneal disease for noninvasive staging of advanced ovarian cancer. Radiographics 2010, 30, 1269–1285. [Google Scholar] [CrossRef]
- Sala, E.; Kataoka, M.Y.; Priest, A.N.; Gill, A.B.; McLean, M.A.; Joubert, I.; Graves, M.J.; Crawford, R.A.F.; Jimenez-Linan, M.; Earl, H.M.; et al. Advanced ovarian cancer: Multiparametric MR imaging demonstrates response- and metastasis-specific effects. Radiology 2012, 263, 149–159. [Google Scholar] [CrossRef] [PubMed]
- Low, R.N.; Barone, R.M. Combined diffusion-weighted and gadolinium-enhanced MRI can accurately predict the peritoneal cancer index preoperatively in patients being considered for cytoreductive surgical procedures. Ann. Surg. Oncol. 2012, 19, 1394–1401. [Google Scholar] [CrossRef] [PubMed]
- Engbersen, M.P.; Van’ T Sant, I.; Lok, C.; Lambregts, D.M.J.; Sonke, G.S.; Beets-Tan, R.G.H.; Van Driel, W.J.; Lahaye, M.J. MRI with diffusion-weighted imaging to predict feasibility of complete cytoreduction with the peritoneal cancer index (PCI) in advanced stage ovarian cancer patients. Eur. J. Radiol. 2019, 114, 146–151. [Google Scholar] [CrossRef]
- Pannu, H.K.; Bristow, R.E.; Cohade, C.; Fishman, E.K.; Wahl, R.L. PET-CT in recurrent ovarian cancer: Initial observations. Radiographics 2004, 24, 209–223. [Google Scholar] [CrossRef] [PubMed]
- Risum, S.; Høgdall, C.; Loft, A.; Berthelsen, A.K.; Høgdall, E.; Nedergaard, L.; Lundvall, L.; Engelholm, S.A. The diagnostic value of PET/CT for primary ovarian cancer-A prospective study. Gynecol. Oncol. 2007, 105, 145–149. [Google Scholar] [CrossRef] [PubMed]
- Thrall, M.M.; DeLoia, J.A.; Gallion, H.; Avril, N. Clinical use of combined positron emission tomography and computed tomography (FDG-PET/CT) in recurrent ovarian cancer. Gynecol. Oncol. 2007, 105, 17–22. [Google Scholar] [CrossRef] [PubMed]
- Soussan, M.; Wartski, M.; Cherel, P.; Fourme, E.; Goupil, A.; Le Stanc, E.; Callet, N.; Alexandre, J.; Pecking, A.; Alberini, J. Impact of FDG PET-CT imaging on the decision making in the biologic suspicion of ovarian carcinoma recurrence. Gynecol. Oncol. 2008, 108, 160–165. [Google Scholar] [CrossRef] [PubMed]
- Fulham, M.J.; Carter, J.; Baldey, A.; Hicks, R.J.; Ramshaw, J.E.; Gibson, M. The impact of PET-CT in suspected recurrent ovarian cancer: A prospective multi-centre study as part of the Australian PET Data Collection Project. Gynecol. Oncol. 2009, 112, 462–468. [Google Scholar] [CrossRef] [PubMed]
- Boria, F.; Chiva, L.; Carbonell, M.; Gutierrez, M.; Sancho, L.; Alcazar, A.; Coronado, M.; Hernández Gutiérrez, A.; Zapardiel, I. 18F-fluorodeoxyglucose positron emission tomography/computed tomography (18F-FDG PET/CT) predictive score for complete resection in primary cytoreductive surgery. Int. J. Gynecol. Cancer 2022, 32, 1427–1432. [Google Scholar] [CrossRef] [PubMed]
- Feng, Z.; Liu, S.; Ju, X.; Chen, X.; Li, R.; Bi, R.; Wu, X. Diagnostic accuracy of 18F-FDG PET/CT scan for peritoneal metastases in advanced ovarian cancer. Quant. Imaging Med. Surg. 2021, 11, 3392–3398. [Google Scholar] [CrossRef]
- Delvallée, J.; Rossard, L.; Bendifallah, S.; Touboul, C.; Collinet, P.; Bricou, A.; Huchon, C.; Lavoue, V.; Body, G.; Ouldamer, L. Accuracy of peritoneal carcinomatosis extent diagnosis by initial FDG PET CT in epithelial ovarian cancer: A multicentre study of the FRANCOGYN research group. J. Gynecol. Obstet. Hum. Reprod. 2020, 49, 101867. [Google Scholar] [CrossRef] [PubMed]
- Mallet, E.; Angeles, M.A.; Cabarrou, B.; Chardin, D.; Viau, P.; Frigenza, M.; Navarro, A.S.; Ducassou, A.; Betrian, S.; Martínez-Gómez, C.; et al. Performance of Multiparametric Functional Imaging to Assess Peritoneal Tumor Burden in Ovarian Cancer. Nucl. Med. 2021, 46, 797–806. [Google Scholar] [CrossRef] [PubMed]
- Wang, X.; Yang, L.; Wang, Y. Meta-analysis of the diagnostic value of 18F-FDG PET/CT in the recurrence of epithelial ovarian cancer. Front. Oncol. 2022, 12, 1003465. [Google Scholar] [CrossRef] [PubMed]
- Laghi, A.; Bellini, D.; Rengo, M.; Accarpio, F.; Caruso, D.; Biacchi, D.; Di Giorgio, A.; Sammartino, P. Diagnostic performance of computed tomography and magnetic resonance imaging for detecting peritoneal metastases: Systematic review and meta-analysis. Radiol. Med. 2017, 122, 1–15. [Google Scholar] [CrossRef] [PubMed]
- Van ‘t Sant, I.; Engbersen, M.P.; Bhairosing, P.A.; Lambregts, D.M.J.; Beets-Tan, R.G.H.; Van Driel, W.J.; Aalbers, A.G.J.; Kok, N.F.M.; Lahaye, M.J. Diagnostic performance of imaging for the detection of peritoneal metastases: A meta-analysis. Eur. Radiol. 2020, 30, 3101–3112. [Google Scholar] [CrossRef] [PubMed]
- Gu, P.; Pan, L.L.; Wu, S.Q.; Sun, L.; Huang, G. CA 125, PET alone, PET-CT, CT and MRI in diagnosing recurrent ovarian carcinoma: A systematic review and meta-analysis. Eur. J. Radiol. 2009, 71, 164–174. [Google Scholar] [CrossRef]
- Page, M.J.; McKenzie, J.E.; Bossuyt, P.M.; Boutron, I.; Hoffmann, T.C.; Mulrow, C.D.; Shamseer, L.; Tetzlaff, J.M.; Akl, E.A.; Brennan, S.E.; et al. The PRISMA 2020 statement: An updated guideline for reporting systematic reviews. BMJ 2021, 372, n71. [Google Scholar] [CrossRef] [PubMed]
- Whiting, P.F.; Rutjes, A.W.; Westwood, M.E.; Mallett, S.; Deeks, J.J.; Reitsma, J.B.; Leeflang, M.M.; Sterne, J.A.; Bossuyt, P.M. QUADAS-2 Group, QUADAS-2: A Revised Tool for the Quality Assessment of Diagnostic Accuracy Studies. Ann. Intern. Med. 2011, 155, 529–536. [Google Scholar] [CrossRef] [PubMed]
- Tempany, C.M.; Zou, K.H.; Silverman, S.G.; Brown, D.L.; Kurtz, A.B.; McNeil, B.J. Staging of advanced ovarian cancer: Comparison of imaging modalities-report from the Radiological Diagnostic Oncology Group. Radiology 2000, 215, 761–767. [Google Scholar] [CrossRef] [PubMed]
- Pannu, H.K.; Horton, K.M.; Fishman, E.K. Thin section dual-phase multidetector-row computed tomography detection of peritoneal metastases in gynecologic cancers. J. Comput. Assist. Tomogr. 2003, 27, 333–340. [Google Scholar] [CrossRef] [PubMed]
- Ricke, J.; Sehouli, J.; Hach, C.; Hänninen, E.L.; Lichtenegger, W.; Felix, R. Prospective evaluation of contrast-enhanced MRI in the depiction of peritoneal spread in primary or recurrent ovarian cancer. Eur. Radiol. 2003, 13, 943–949. [Google Scholar] [CrossRef] [PubMed]
- Pannu, H.K.; Cohade, C.; Bristow, R.E.; Fishman, E.K.; Wahl, R.L. PET-CT detection of abdominal recurrence of ovarian cancer: Radiologic-surgical correlation. Abdom. Imaging 2004, 29, 398–403. [Google Scholar] [CrossRef] [PubMed]
- Kim, C.K.; Park, B.K.; Choi, J.Y.; Kim, B.G.; Han, H.J. Detection of recurrent ovarian cancer at MRI: Comparison with integrated PET/CT. Comput. Assist. Tomogr. 2007, 31, 868–875. [Google Scholar] [CrossRef]
- Kitajima, K.; Murakami, K.; Yamasaki, E.; Kaji, Y.; Fukasawa, I.; Inaba, N.; Sugimura, K. Diagnostic accuracy of integrated FDG-PET/contrast-enhanced CT in staging ovarian cancer: Comparison with enhanced CT. Eur. J. Nucl. Med. Mol. Imaging 2008, 35, 1912–1920. [Google Scholar] [CrossRef] [PubMed]
- Kitajima, K.; Murakami, K.; Yamasaki, E.; Domeki, Y.; Kaji, Y.; Fukasawa, I.; Inaba, N.; Suganuma, N.; Sugimura, K. Performance of integrated FDG-PET/contrast-enhanced CT in the diagnosis of recurrent ovarian cancer: Comparison with integrated FDG-PET/non-contrast-enhanced CT and enhanced CT. Eur. J. Nucl. Med. Mol. Imaging 2008, 35, 1439–1448. [Google Scholar] [CrossRef] [PubMed]
- Choi, H.J.; Lim, M.C.; Bae, J.; Cho, K.S.; Jung, D.C.; Kang, S.; Yoo, C.W.; Seo, S.S.; Park, S.Y. Region-based diagnostic performance of multidetector CT for detecting peritoneal seeding in ovarian cancer patients. Arch. Gynecol. Obstet. 2011, 283, 353–360. [Google Scholar] [CrossRef] [PubMed]
- Metser, U.; Jones, C.; Jacks, L.M.; Bernardini, M.Q.; Ferguson, S. Identification and quantification of peritoneal metastases in patients with ovarian cancer with multidetector computed tomography: Correlation with surgery and surgical outcome. Int. J. Gynecol. Cancer 2011, 21, 1391–1398. [Google Scholar] [CrossRef] [PubMed]
- De Iaco, P.; Musto, A.; Orazi, L.; Zamagni, C.; Rosati, M.; Allegri, V.; Cacciari, N.; Al-Nahhas, A.; Rubello, D.; Venturoli, S.; et al. FDG-PET/CT in Advanced Ovarian Cancer Staging: Value and Pitfalls in Detecting Lesions in Different Abdominal and Pelvic Quadrants Compared with Laparoscopy. Eur. J. Radiol. 2011, 80, e98–e103. [Google Scholar] [CrossRef] [PubMed]
- Sanli, Y.; Turkmen, C.; Bakir, B.; Iyibozkurt, C.; Ozel, S.; Has, D.; Yilmaz, E.; Topuz, S.; Yavuz, E.; Unal, S.N.; et al. Diagnostic value of PET/CT is similar to that of conventional MRI and even better for detecting small peritoneal implants in patients with recurrent ovarian cancer. Nucl. Med. Commun. 2012, 33, 509–515. [Google Scholar] [CrossRef]
- Espada, M.; Garcia-Flores, J.R.; Jimenez, M.; Alvarez-Moreno, E.; De Haro, M.; Gonzalez-Cortijo, L.; Hernandez-Cortes, G.; Martinez-Vega, V.; De La Cuesta, R.S. Diffusion-weighted magnetic resonance imaging evaluation of intra-abdominal sites of implants to predict likelihood of suboptimal cytoreductive surgery in patients with ovarian carcinoma. Eur. Radiol. 2013, 23, 2636–2642. [Google Scholar] [CrossRef]
- Hynninen, J.; Kemppainen, J.; Lavonius, M.; Virtanen, J.; Matomäki, J.; Oksa, S.; Carpén, O.; Grénman, S.; Seppänen, M.; Auranen, A. A prospective comparison of integrated FDG-PET/contrast-enhanced CT and contrast-enhanced CT for pretreatment imaging of advanced epithelial ovarian cancer. Gynecol. Oncol. 2013, 131, 389–394. [Google Scholar] [CrossRef]
- Kim, W.H.; Won, K.S.; Zeon, S.K.; Ahn, B.C.; Gayed, I.W. Peritoneal carcinomatosis in patients with ovarian cancer. Enhanced CT versus 18F-FDG PET/CT. Clin. Nucl. Med. 2013, 38, 93–97. [Google Scholar]
- Mazzei, M.A.; Khader, L.; Cirigliano, A.; Cioffi Squitieri, N.; Guerrini, S.; Forzoni, B.; Marrelli, D.; Roviello, F.; Mazzei, F.G.; Volterrani, L. Accuracy of MDCT in the preoperative definition of Peritoneal Cancer Index (PCI) in patients with advanced ovarian cancer who underwent peritonectomy and hyperthermic intraperitoneal chemotherapy (HIPEC). Abdom. Imaging 2013, 38, 1422–1430. [Google Scholar] [CrossRef] [PubMed]
- Michielsen, K.; Vergote, I.; Op de Beeck, K.; Amant, F.; Leunen, K.; Moerman, P.; Deroose, C.; Souverijns, G.; Dymarkowski, S.; De Keyzer, F.; et al. Whole-body MRI with diffusion-weighted sequence for staging of patients with suspected ovarian cancer: A clinical feasibility study in comparison to CT and FDG-PET/CT. Eur. Radiol. 2014, 24, 889–901. [Google Scholar] [CrossRef] [PubMed]
- Schmidt, S.; Meuli, R.A.; Achtari, C.; Prior, J.O. Peritoneal carcinomatosis in primary ovarian cancer staging: Comparison between MDCT, MRI, and 18F-FDG PET/CT. Clin. Nucl. Med. 2015, 40, 371–377. [Google Scholar] [CrossRef] [PubMed]
- Lopez-Lopez, V.; Cascales-Campos, P.A.; Gil, J.; Frutos, L.; Andrade, R.J.; Fuster-Quiñonero, M.; Feliciangeli, E.; Gil, E.; Parrilla, P. Use of (18)F-FDG PET/CT in the preoperative evaluation of patients diagnosed with peritoneal carcinomatosis of ovarian origin, candidates to cytoreduction and hipec. A pending issue. Eur. J. Radiol. 2016, 85, 1824–1828. [Google Scholar] [CrossRef] [PubMed]
- Rodolfino, E.; Devicienti, E.; Miccò, M.; Del Ciello, A.; Di Giovanni, S.E.; Giuliani, M.; Conte, C.; Gui, B.; Valentini, A.L.; Bonomo, L. Diagnostic accuracy of MDCT in the evaluation of patients with peritoneal carcinomatosis from ovarian cancer: Is delayed enhanced phase really effective? Eur. Rev. Med. Pharmacol. Sci. 2016, 20, 4426–4434. [Google Scholar]
- Tawakol, A.; Abdelhafez, Y.G.; Osama, A.; Hamada, E.; El Refaei, S. Diagnostic performance of 18F-FDG PET/contrast-enhanced CT versus contrast-enhanced CT alone for post-treatment detection of ovarian malignancy. Nucl. Med. Commun. 2016, 37, 453–460. [Google Scholar] [CrossRef] [PubMed]
- Cerci, Z.C.; Sakarya, D.K.; Yetimalar, M.H.; Bezircioglu, I.; Kasap, B.; Baser, E.; Yucel, K. Computed tomography as a predictor of the extent of the disease and surgical outcomes in ovarian cancer. Ginekol. Pol. 2016, 87, 326–332. [Google Scholar] [CrossRef] [PubMed][Green Version]
- Bagul, K.; Vijaykumar, D.K.; Rajanbabu, A.; Antony, M.A.; Ranganathan, V. Advanced Primary Epithelial Ovarian and Peritoneal Carcinoma-Does Diagnostic Accuracy of Preoperative CT Scan for Detection of Peritoneal Metastatic Sites Reflect into Prediction of Suboptimal Debulking? A Prospective Study. Indian J. Surg. Oncol. 2017, 8, 98–104. [Google Scholar] [CrossRef]
- Michielsen, K.; Dresen, R.; Vanslembrouck, R.; De Keyzer, F.; Amant, F.; Mussen, E.; Leunen, K.; Berteloot, P.; Moerman, P.; Vergote, I.; et al. Diagnostic value of whole-body diffusion-weighted MRI compared to computed tomography for pre-operative assessment of patients suspected for ovarian cancer. Eur. J. Cancer 2017, 83, 88–98. [Google Scholar] [CrossRef] [PubMed]
- Rajan, J.; Kuriakose, S.; Rajendran, V.R.; Sumangaladevi, D. Radiological and surgical correlation of disease burden in advanced ovarian cancer using peritoneal carcinomatosis index. Indian. J. Gynecol. Oncol. 2018, 16, 7. [Google Scholar] [CrossRef]
- Alcázar, J.L.; Caparros, M.; Arraiza, M.; Mínguez, J.A.; Guerriero, S.; Chiva, L.; Jurado, M. Pre-operative Assessment of Intra-Abdominal Disease Spread in Epithelial Ovarian Cancer: A Comparative Study between Ultrasound and Computed Tomography. Int. J. Gynecol. Cancer 2019, 29, 227–233. [Google Scholar] [CrossRef] [PubMed]
- Ahmed, S.A.; Abou-Taleb, H.; Yehia, A.; El Malek, N.A.A.; Siefeldein, G.S.; Badary, D.M.; Jabir, M.A. The accuracy of multi-detector computed tomography and laparoscopy in the prediction of peritoneal carcinomatosis index score in primary ovarian cancer. Acad. Radiol. 2019, 26, 1650–1658. [Google Scholar] [CrossRef] [PubMed]
- Tsoi, T.T.; Chiu, K.W.H.; Chu, M.Y.; Ngan, H.Y.S.; Lee, E.Y.P. Metabolic active peritoneal sites affect tumor debulking in ovarian and peritoneal cancers. J. Ovarian Res. 2020, 13, 61. [Google Scholar] [CrossRef] [PubMed]
- Fischerova, D.; Pinto, P.; Burgetova, A.; Masek, M.; Slama, J.; Kocian, R.; Frühauf, F.; Zikan, M.; Dusek, L.; Dundr, P.; et al. Preoperative staging of ovarian cancer: Comparison between ultrasound, CT and whole-body diffusion-weighted MRI (ISAAC study). Ultrasound Obstet. Gynecol. 2022, 59, 248–262. [Google Scholar] [CrossRef] [PubMed]
- Colombo, N.; Sessa, C.; du Bois, A.; Ledermann, J.; McCluggage, W.G.; McNeish, I.; Morice, P.; Pignata, S.; Ray-Coquard, I.; Vergote, I.; et al. ESMO-ESGO consensus conference recommendations on ovarian cancer: Pathology and molecular biology, early and advanced stages, borderline tumours and recurrent disease. Ann. Oncol. 2019, 30, 672–705. [Google Scholar] [CrossRef] [PubMed]
- Bae, H.; Jung, D.C.; Lee, J.Y.; Nam, E.J.; Kang, W.J.; Oh, Y.T. Patterns of initially overlooked recurrence of peritoneal lesions in patients with advanced ovarian cancer on postoperative multi-detector row CT. Acta Radiol. 2019, 60, 1713–1720. [Google Scholar] [CrossRef] [PubMed]
- Gadelhak, B.; Tawfik, A.M.; Saleh, G.A.; Batouty, N.M.; Sobh, D.M.; Hamdy, O.; Refky, B. Extended abdominopelvic MRI versus CT at the time of adnexal mass characterization for assessing radiologic peritoneal cancer index (PCI) prior to cytoreductive surgery. Abdom. Radiol. 2019, 44, 2254–2261. [Google Scholar] [CrossRef] [PubMed]
- Forstner, R. Radiological staging of ovarian cancer: Imaging findings and contribution of CT and MRI. Eur. Radiol. 2007, 17, 3223–3335. [Google Scholar] [CrossRef] [PubMed]
- Pannu, H.K.; Bristow, R.E.; Montz, F.J.; Fishman, E.K. Multidetector CT of peritoneal carcinomatosis from ovarian cancer. Radiographics 2003, 23, 687–701. [Google Scholar] [CrossRef] [PubMed]
- Franiel, T.; Diederichs, G.; Engelken, F.; Elgeti, T.; Rost, J.; Rogalla, P. Multi-detector CT in peritoneal carcinomatosis: Diagnostic role of thin slices and multiplanar reconstructions. Abdom. Imaging 2009, 34, 49–54. [Google Scholar] [CrossRef]
- Marin, D.; Catalano, C.; Baski, M.; De Martino, M.; Geiger, D.; Di Giorgio, A.; Sibio, S.; Passariello, R. 64-Section multi-detector row CT in the preoperative diagnosis of peritoneal carcinomatosis: Correlation with histopathological findings. Abdom. Imaging 2010, 35, 694–700. [Google Scholar] [CrossRef]
- Low, R.N.; Sebrechts, C.P.; Barone, R.M.; Muller, W. Diffusion-weighted MRI of peritoneal tumors: Comparison with conventional MRI and surgical and histopathologic findings: A feasibility study. AJR Am. J. Roentgenol. 2009, 193, 461–470. [Google Scholar] [CrossRef] [PubMed]
- Namimoto, T.; Awai, K.; Nakaura, T.; Yanaga, Y.; Hirai, T.; Yamashita, Y. Role of diffusion-weighted imaging in the diagnosis of gynecological diseases. Eur. Radiol. 2009, 19, 745–760. [Google Scholar] [CrossRef] [PubMed]
- Priest, A.N.; Gill, A.B.; Kataoka, M.; McLean, M.A.; Joubert, I.; Graves, M.J.; Griffiths, J.R.; Crawford, R.A.F.; Earl, H.; Brenton, J.D.; et al. Dynamic contrast-enhanced MRI in ovarian cancer: Initial experience at 3 tesla in primary and metastatic disease. Magn. Reson. Med. 2010, 63, 1044–1049. [Google Scholar] [CrossRef] [PubMed]
- Low, R.N.; Barone, R.M. Imaging for Peritoneal Metastases. Surg. Oncol. Clin. N. Am. 2018, 27, 425–442. [Google Scholar] [CrossRef]
- Guo, H.L.; He, L.; Zhu, Y.C.; Wu, K.; Yuan, F. Comparison between multi-slice spiral CT and magnetic resonance imaging in the diagnosis of peritoneal metastasis in primary ovarian carcinoma. Oncol. Targets Ther. 2018, 11, 1087–1094. [Google Scholar] [CrossRef] [PubMed]
- Satoh, Y.; Ichikawa, T.; Motosugi, U.; Kimura, K.; Sou, H.; Sano, K.; Araki, T. Diagnosis of peritoneal dissemination: Comparison of 18F-FDG PET/CT, diffusion-weighted MRI, and contrast-enhanced MDCT. AJR Am. J. Roentgenol. 2001, 196, 447–453. [Google Scholar] [CrossRef] [PubMed]
- Torkzad, M.R.; Casta, N.; Bergman, A.; Ahlström, H.; Påhlman, L.; Mahteme, H. Comparison between MRI and CT in prediction of peritoneal carcinomatosis index (PCI) in patients undergoing cytoreductive surgery in relation to the experience of the radiologist. J. Surg. Oncol. 2015, 111, 746–751. [Google Scholar] [CrossRef] [PubMed]
- Sironi, S.; Messa, C.; Mangili, G.; Zangheri, B.; Aletti, G.; Garavaglia, E.; Vigano, R.; Picchio, M.; Taccagni, G.; Del Maschio, A.; et al. Integrated FDG PET/CT in patients with persistent ovarian cancer: Correlation with histologic findings. Radiology 2004, 233, 433–440. [Google Scholar] [CrossRef] [PubMed]
- Hauth, E.A.; Antoch, G.; Stattaus, J.; Kuehl, H.; Veit, P.; Bockisch, A.; Kimmig, R.; Forsting, M. Evaluation of integrated whole-body PET/CT in the detection of recurrent ovarian cancer. Eur. J. Radiol. 2005, 56, 263–268. [Google Scholar] [CrossRef]
- Nanni, C.; Rubello, D.; Farsad, M.; De Iaco, P.; Sansovini, M.; Erba, P.; Rampin, L.; Mariani, G.; Fanti, S. (18)F-FDG PET/CT in the evaluation of recurrent ovarian cancer: A prospective study on forty-one patients. Eur. J. Surg. Oncol. 2005, 31, 792–797. [Google Scholar] [CrossRef] [PubMed]
- Mangili, G.; Picchio, M.; Sironi, S.; Vigano, R.; Rabaiotti, E.; Bornaghi, D.; Bettinardi, V.; Crivellaro, C.; Messa, C.; Fazio, F. Integrated PET/CT as a first-line re-staging modality in patients with suspected recurrence of ovarian cancer. Eur. J. Nucl. Med. Mol. Imaging 2007, 34, 658–666. [Google Scholar] [CrossRef] [PubMed]
- Castellucci, P.; Perrone, A.M.; Picchio, M.; Ghi, T.; Farsad, M.; Nanni, C.; Messa, C.; Meriggiola, M.C.; Pelusi, G.; Al-Nahhas, A.; et al. Diagnostic accuracy of 18F-FDG PET/CT in characterizing ovarian lesions and staging ovarian cancer: Correlation with transvaginal ultrasonography, computed tomography, and histology. Nucl. Med. Commun. 2007, 28, 589–595. [Google Scholar] [CrossRef]
- Sebastian, S.; Lee, S.I.; Horowitz, N.S.; Scott, J.A.; Fischman, A.J.; Simeone, J.F.; Fuller, A.F.; Hahn, P.F. PET-CT vs. CT alone in ovarian cancer recurrence. Abdom. Imaging 2008, 33, 112–118. [Google Scholar] [CrossRef] [PubMed]
- Pfannenberg, C.; Konigsrainer, I.; Aschoff, P.; Oksüz, M.O.; Zieker, D.; Beckert, S.; Symons, S.; Nieselt, K.; Glatzle, J.; Weyhern, C.V.; et al. (18)F-FDG-PET/CT to select patients with peritoneal carcinomatosis for cytoreductive surgery and hyperthermic intraperitoneal chemotherapy. Ann. Surg. Oncol. 2009, 16, 1295–1303. [Google Scholar] [CrossRef] [PubMed]
- Kumar Dhingra, V.; Kand, P.; Basu, S. Impact of FDG-PET and PET/CT imaging in the clinical decision-making of ovarian carcinoma: An evidence-based approach. Womens Health 2012, 8, 191–203. [Google Scholar] [CrossRef] [PubMed]
- Rubini, G.; Altini, C.; Notaristefano, A.; Merenda, N.; Rubini, D.; Ianora, A.A.; Asabella, A.N. Role of 18F-FDG PET/CT in diagnosing peritoneal carcinomatosis in the restaging of patient with ovarian cancer as compared to contrast enhanced CT and tumor marker Ca-125. Rev. Esp. Med. Nucl. Imagen Mol. 2014, 33, 22–27. [Google Scholar] [PubMed]
- Miceli, V.; Gennarini, M.; Tomao, F.; Cupertino, A.; Lombardo, D.; Palaia, I.; Curti, F.; Riccardi, S.; Ninkova, R.; Maccioni, F.; et al. Imaging of peritoneal carcinomatosis in advanced ovarian cancer: CT, MRI, radiomics features and resectability criteria. Cancers 2023, 15, 5827. [Google Scholar] [CrossRef] [PubMed]
- Nougaret, S.; Tardieu, M.; Vargas, H.A.; Reinhold, C.; Vande Perre, S.; Bonanno, N.; Sala, E.; Thomassin-Naggara, I. Ovarian cancer: An update on imaging in the era of radiomics. Diagn. Interv. Imaging 2019, 100, 647–655. [Google Scholar] [CrossRef] [PubMed]
- Nougaret, S.; McCague, C.; Tibermacine, H.; Vargas, H.A.; Rizzo, S.; Sala, E. Radiomics and radiogenomics in ovarian cancer: A literature review. Abdom. Radiol. 2021, 46, 2308–2322. [Google Scholar] [CrossRef] [PubMed]
- Panico, C.; Avesani, G.; Zormpas-Petridis, K.; Rundo, L.; Nero, C.; Sala, E. Radiomics and Radiogenomics of Ovarian Cancer: Implications for Treatment Monitoring and Clinical Management. Radiol. Clin. N. Am. 2023, 61, 749–760. [Google Scholar] [CrossRef]
- Beer, L.; Sahin, H.; Bateman, N.W.; Blazic, I.; Vargas, H.A.; Veeraraghavan, H.; Kirby, J.; Fevrier-Sullivan, B.; Freymann, J.B.; Jaffeet, C.C.; et al. Integration of proteomics with CT-based qualitative and radiomic features in high-grade serous ovarian cancer patients: An exploratory analysis. Eur. Radiol. 2020, 30, 4306–4316. [Google Scholar] [CrossRef] [PubMed]
- Song, X.L.; Ren, J.L.; Yao, T.Y.; Zhao, D.; Niu, J. Radiomics based on multisequence magnetic resonance imaging for the preoperative prediction of peritoneal metastasis in ovarian cancer. Eur. Radiol. 2021, 31, 8438–8446. [Google Scholar] [CrossRef] [PubMed]
- Wei, M.; Zhang, Y.; Ding, C.; Jia, J.; Xu, H.; Dai, Y.; Feng, G.; Qin, C.; Bai, G.; Chen, S.; et al. Associating peritoneal metastasis with T2-weighted MRI images in epithelial ovarian cancer using deep learning and radiomics: A multicenter study. Magn. Reson. Imaging 2024, 59, 122–131. [Google Scholar] [CrossRef] [PubMed]
- Guo, Q.; Lin, Z.; Lu, J.; Li, R.; Wu, L.; Deng, L.; Qiang, J.; Wu, X.; Gu, Y.; Li, H. Preoperative prediction of miliary changes in the small bowel mesentery in advanced high-grade serous ovarian cancer using MRI radiomics nomogram. Abdom. Radiol. 2023, 48, 1119–1130. [Google Scholar] [CrossRef]
- Li, J.; Zhang, J.; Wang, F.; Ma, J.; Cui, S.; Ye, Z. CT-based radiomics for the preoperative prediction of occult peritoneal metastasis in epithelial ovarian cancers. Acad. Radiol. 2023. [CrossRef] [PubMed]


| ARs | Sugarbaker’s PCI |
|---|---|
| AR0 | midline abdominal incision, greater omentum, and transverse colon |
| AR1 | superior surface of the right lobe of the liver, undersurface of the right hemidiaphragm, and right retrohepatic space |
| AR2 | epigastric fat pad, left lobe of the liver, lesser omentum, and falciform ligament |
| AR3 | undersurface of the left hemidiaphragm, spleen, pancreatic tail, and anterior and posterior surfaces of the stomach |
| AR4 | descending colon and left paracolic gutter |
| AR5 | pelvic side wall lateral to the sigmoid colon and sigmoid colon |
| AR6 | female internal genitalia with ovaries, tubes and uterus, urinary bladder, cul-de-sac of Douglas, and rectosigmoid colon |
| AR7 | right pelvic side wall and base of the cecum, including the appendix |
| AR8 | right paracolic gutter and ascending colon |
| AR9–12 | small bowel (AR9: upper jejunum; AR10: lower jejunum; AR11: upper ileum; and AR12: lower ileum) |
| Author | Year | Type of Study | Primary Outcome | No of pts with OC | Mean Age/Age Range (Years) | FIGO Stage (No. of pts) | No. of pts with PMs | No. of ARs with PMs | Mean Size-Size Range of PMs (cm) (No. of PMs) |
|---|---|---|---|---|---|---|---|---|---|
| Tempany et al. [51] | 2000 | prospective | suspected advanced OC | 118 | 57 (19–79) | III and IV (73) | 70 | 250 | <2 (8) >2 (57) n/a (5) |
| Pannu et al. [52] | 2003 | retrospective | suspected primary or recurrent OC/ peritoneal cancer | 17 | 58.1 (41–84) | IB (1) III (13) IV (3) | 13 | 63 | n/a |
| Ricke et al. [53] | 2003 | prospective | suspected primary or recurrent OC | 57 | 58 (35–90) | I (11) II (2) III (36) IV (4) n/a (4) | n/a | 204 | n/a |
| Pannu et al. [54] | 2004 | retrospective | suspected recurrent OC | 16 | 50.8 (17–77) | n/a | 11 | 31 | <1 (23) >1 (8) |
| Kim et al. [55] | 2007 | retrospective | suspected recurrent OC | 36 | 51.3 (25–75) | I (2) II (5) III (27) IV (2) | n/a | 14 | 2.2 (0.4–3.5) |
| Kitajima et al. [56] | 2008 | retrospective | suspected recurrent OC | 132 | 56 (34–79) | Ι (20) II (10) III (81) IV (21) | n/a | 45 | n/a |
| Kitajima et al. [57] | 2008 | retrospective | primary OC | 40 | 55.4 (38–77) | Ι (18) II (7) III (14) IV (1) | n/a | 46 | 0.2–2.3 |
| Choi et al. [58] | 2011 | prospective | primary OC | 57 | 53.1 (30–72) | I (6) II (5) III (38) IV (8) | 50 | 251 | <1 >1 |
| Metser et al. [59] | 2011 | retrospective | primary OC | 76 | 58.2 (24–87) | I (11) II (3) III (55) IV (7) | n/a | 414 | <1 (142) ≥1 (272) |
| De laco et al. [60] | 2011 | retrospective | suspected OC | 40 | 65 ± 7.9 (46–78) | III (22) IV (18) | 40 | 308 | ≤0.5 (135) 0.5–5 (38) >5 (135) |
| Sanli et al. [61] | 2012 | retrospective | suspected recurrent OC | 47 | 57.5 ± 8.4 (38–78) | n/a | n/a | n/a | <0.5 0.5–1 1–2 2–3 >3 |
| Espada et al. [62] | 2013 | prospective | suspected advanced OC | 34 | 53.08 ± 11.9 | III (28) IV (6) | n/a | n/a | n/a |
| Hynninen et al. [63] | 2013 | prospective | suspected advanced ovarian/ fallopian/ peritoneal cancer | 41 | 65 (45–79) | I (2) II (2) III (21) IV (16) | 41 | 246 | n/a |
| Kim et al. [64] | 2013 | retrospective | suspected primary or recurrent OC | 46 | 54 (29–80) | I (12) II (4) III (28) IV (2) | 26 | n/a | n/a |
| Mazzei et al. [65] | 2013 | retrospective | advanced primary or recurrent OC | 43 | 58.5 (30–72) | III (42) IV (1) | 43 | 195 | <0.5 0.5–5 >5 |
| Michielsen et al. [66] | 2014 | prospective | suspected OC | 32 | 61.9 (20–83) | n/a | 32 | 208 | <1 (75) >1 (60) confluent disease (73) |
| Schmidt et al. [67] | 2015 | prospective | suspected OC | 15 | 65 (31–89) | III (4) IV (6) | 10 | 74 | ≤0.5 (13) 0.5–5 (40) >5 cm (21) |
| Lopez-Lopez et al. [68] | 2016 | retrospective | suspected primary or recurrent OC | 59 | 54 (27–78) | I (3) II (44) III (12) | 55 | 278 | <0.5 (110) ≥0.5–5 (53) >5 cm or confluent (115) |
| Nasser et al. [26] | 2016 | retrospective | suspected primary or recurrent OC | 155 | 62.5 (31–85) | I (4) II (3) III (106) IV (42) | n/a | n/a | n/a |
| Rodolfino et al. [69] | 2016 | retrospective | suspected recurrent OC | 40 | 48.5 (32–73) | III (33) IV (7) | 29 | 182 | <0.5 (38) ≥0.5–5 (81) >5 cm or confluent (63) |
| Tawakol et al. [70] | 2016 | prospective | suspected recurrent OC | 111 | 54 (13–76) | n/a | n/a | 75 | n/a |
| Cerci et al. [71] | 2016 | retrospective | primary OC | 114 | 59 (28–91) | I (21) II (4) III (47) IV (39) | n/a | n/a | n/a |
| Bagul et al. [72] | 2017 | prospective | suspected advanced ovarian/ fallopian tube/primary peritoneal cancer | 36 | 51 (39–74) | IIIc | n/a | n/a | n/a |
| Michielsen et al. [73] | 2017 | prospective | suspected OC | 94 | 61 (14–88) | I (19) II (2) III (38) IV (35) | n/a | n/a | n/a |
| Rajan et al. [74] | 2018 | prospective | advanced OC | 40 | 59.5 (43–87) | IIIc IV | 40 | 115 | <0.5 0.5–5 >5 |
| Alcazar et al. [75] | 2019 | retrospective | suspected OC | 93 | 57.6 ± 11.4 (18–84) | I (26) II (11) IIIA (1) IIIB (6) IIIC (40) IVA (6) IVB (3) | n/a | n/a | n/a |
| Abdalla Ahmed et al. [76] | 2019 | prospective | primary OC | 85 | 55 (27–82) | II (5) III (80) | n/a | 930 | 8.4 (1–13) <0.5 (280) 0.5–5 (605) >5 (45) |
| Tsoi et al. [77] | 2020 | retrospective | primary or recurrent ovarian/peritoneal cancer | 49 | 49 ± 15 | I (15) II (12) III (18) IV (1) n/a (3) | 27 | 58 | <1 (9) ≥1 (44) |
| An et al. [27] | 2020 | retrospective | recurrent advanced OC | 58 | 57 (23–84) | III (31) IV (27) | n/a | 315 | 3.7 (1–15) |
| Mikkelsen et al. [30] | 2021 | prospective | advanced OC | 50 | 65 (32–78) | III (32) IV (18) | n/a | n/a | n/a |
| Feng et al. [42] | 2021 | prospective | advanced OC | 43 | 57 (38–76) | III (32) IV (11) | n/a | 286 | n/a |
| Mallet et al. [44] | 2021 | retrospective | advanced OC | 84 | 65 (44–89) | III (28) IV (56) | n/a | n/a | <0.5 0.5–5 >5 |
| Fischerova et al. [78] | 2022 | prospective | suspected primary advanced ovarian/tubal/peritoneal cancer | 67 | 61.4 ± 10.5 | I (14) II (2) III (44) IV (7) | n/a | n/a | n/a |
| Study | Location of PMs (n = Number of Patients or ARs with PMs) |
|---|---|
| Tempany et al. [51] (n = number of ARs) | anterior part of the abdomen (37) RT, LT paracolic gutters AR4,8 (35) RT, LT subdiaphragmatic spaces AR1,3 (45) mesentery (small bowel/transverse/sigmoid colon) (38) hepatic surface AR1,2 (25) omentum (gastrocolic and infracolic) AR0 (70) |
| Pannu et al. [52] (n = number of patients) | diaphragm AR1,3 (11) liver AR1,2 (6) splenic surface AR3 (2) porta hepatis/gallbladder fossa AR1 (4) stomach AR3 (2) lesser sac AR2 (3) mesenteric root (3) infracolic omentum AR0 (7) paracolic gutters AR4,8 (8) bowel (5) pelvis AR5–7 (12) |
| Ricke et al. [53] (n = number of ARs) | pouch of Douglas AR6 (18) cervix/vaginal stump AR6 (9) uterus AR6 (11) bladder/ureter AR6 (10) pelvic wall AR5,7 (23) abdominal wall (18) small bowel/mesentery (22) large bowel (39) greater omentum AR0 (21) lesser sac AR2 (7) stomach AR3 (6) diaphragm AR1,3 (15) liver capsule AR1,2 (5) |
| Pannu et al. [54] (n = number of ARs) | pelvis AR5–7 (17) bowel/omentum (7) LT upper quadrant AR3 (2) paracolic gutters AR4,8 (4) RT upper quadrant AR1 (1) |
| Kim et al. [55] (n = number of ARs) | cul de sac AR6 (4) paracolic gutter AR4,8 (3) subphrenic/perihepatic/perisplenic (6) bowel (1) |
| Kitajima et al. [56] (n/a) | cul de sac AR6 paracolic gutter AR4,8 mesentery serosa of large and small bowel anterior part of the abdomen hepatic surface AR1,2 splenic hilum AR3 diaphragm AR1,3 |
| Kitajima et al. [57] (n = number of ARs) | cul de sac AR6 (8) urinary bladder AR6 (2) rectosigmoid colon AR6 (4) peritoneum of anterior abdomen (6) paracolic gutter AR4,8 (3) diaphragm AR1,3 (1) omentum AR0 (9) mesentery (7) serous membrane of large and small bowel (4) liver surface AR1,2 (2) |
| Choi et al. [58] (n = number of ARs) | RT subdiaphragmatic area AR1 (35) LT subdiaphragmatic area AR3 (34) porta hepatis AR1 (10) lesser sac AR2 (18) small bowel mesentery (14) splenic hilar area AR3 (38) omentum AR0 (20) RT paracolic gutter AR8 (22) LT paracolic gutter AR4 (20) RT pelvic cavity AR7 (4) LT pelvic cavity AR5 (8) sigmoid mesentery (12) bladder dome area AR6 (16) |
| Metser et al. [59] (n/a) | RT diaphragm AR1 liver capsule AR1,2 liver parenchymal invasion gallbladder fossa AR1 RT paracolic gutter AR8 LT diaphragm AR3 omentum AR0 LT paracolic gutter AR4 bladder peritoneum AR6 porta hepatis AR1 root of small bowel mesentery mesentery ascending colon, serosa AR8 cecum, serosa AR7 appendix AR7 stomach, serosa AR3 small bowel, serosa transverse colon, serosa AR0 descending colon, serosa AR4 spleen, capsule AR3 spleen, hilum AR3 spleen, parenchymal invasion rectosigmoid mesentery RT pelvic sidewall AR7 LT pelvic sidewall AR5 cul-de-sac, posterior AR6 rectosigmoid, serosa AR6 rectosigmoid, invasion AR6 |
| De laco et al. [60] (n = number of ARs) | central AR0 (37) RT upper AR1 (34) epigastrium AR2 (26) LT upper AR3 (28) LT flank AR4 (35) LT lower AR5 (36) pelvis AR6 (40) RT lower AR7 (38) RT flank AR8 (34) |
| Espada et al. [62] (n/a) | small and/or large bowel mesentery (8) hepatic parenchyma, hepatic hilum or surface implants > 2 cm AR1,2 (10) omental extension: spleen parenchyma, splenic hilum, stomach, lesser sac AR2,3 (11) diaphragm AR1,3 (5) peritoneal |
| Hynninen et al. [63] (n = number of patients) | diaphragm AR1,3 (34) omentum AR0 (34) small bowel mesentery (25) large bowel mesentery (30) small bowel serosae AR9–12 (14) large bowel serosae (64) RT ‘high risk upper abdomen’: dorsal subdiaphragmatic peritoneum, dorsal liver surface AR1 (31) LT ‘high risk upper abdomen’: ventricle, bursa omentalis, spleen, tail of pancreas AR3 (14) |
| Mazzei et al. [65] (n/a) | central AR0 RT upper AR1 epigastrium AR2 LT upper AR3 LT flank AR4 LT left AR5 pelvis AR6 RT lower AR7 RT flank AR8 upper jejunum AR9 lower jejunum AR10 upper ileum AR11 lower ileum AR12 |
| Michielsen et al. [66] (n = number of ARs) | bladder peritoneal surface AR6 (17) Douglas pouch AR6 (19) RT peritoneal pelvic surface AR7 (20) RT lateroconal area AR8 (15) subhepatic space/Morrison’s pouch AR1 (10) RT diaphragm AR1 (12) hepatic surface AR1,2 (4) LT diaphragm AR3 (9) splenic surface AR3 (1) LT lateroconal area AR4 (16) LT peritoneal pelvic surface AR5 (21) omentum AR0 (23) small bowel serosa AR9–12 (6) small bowel mesentery (12) colonic serosa (11) colonic mesentery (12) |
| Schmidt et al. [67] (n/a) | central AR0 RT upper AR1 epigastrium AR2 LT upper AR3 LT flank AR4 LT lower AR5 pelvis AR6 RT lower AR7 RT flank AR8 |
| Lopez-Lopez et al. [68] (n/a) | upper region middle region lower region small intestine |
| Nasser et al. [26] (n = number of patients) | diaphragmatic involvement AR1,3 (55) splenic involvement AR3 (19) large bowel involvement (37) small bowel involvement (15) rectal involvement AR6 (38) porta hepatis involvement AR1 (6) mesenteric involvement (35) |
| Rodolfino et al. [69] (n/a) | central AR0 RT upper AR1 epigastrium AR2 LT upper AR3 LT flank AR4 LT lower AR5 pelvis AR6 RT lower AR7 RT flank AR8 upper jejunum AR9 lower jejunum AR10 upper ileum AR11 lower ileum AR12 |
| Cerci et al. [71] (n = number of patients) | peritoneal carcinomatosis (61) omentum AR0 (53) ascites (61) perivesical-perirectal fat AR6 (54) diaphragm AR1,3 (20) liver AR1,2 (30) bladder AR6 (22) small and large bowel (47) mesentery (49) |
| Bagul et al. [72] (n = number of patients) | diffuse peritoneal thickening (17) RT subdiaphragm AR1 (35) LT subdiaphragm AR3 (27) porta hepatis AR1 (24) liver AR1,2 (25) spleen AR3 (11) lesser sac AR2 (15) omentum AR0 (35) omental cake extension (to splenic hilum, stomach, colon, or lesser sac) (24) RT paracolic region AR8 (33) LT paracolic region AR4 (27) small bowel serosa (20) large bowel serosa (29) small bowel mesentery (21) large bowel mesentery (32) uterus and ovary AR6 (34) pelvic peritoneum AR5–7 (34) urinary bladder peritoneum AR6 (32) parietal peritoneum (19) |
| Michielsen et al. [73] (n = number of patients) | duodenum, stomach, celiac trunk carcinomatosis AR2 (16) diffuse serosal carcinomatosis (34) superior mesenteric artery, mesenteric root (8) |
| Rajan et al. [74] (n = number of patients) | central AR0 (24) RT upper AR1 (4) epigastrium AR2 (6) LT upper AR3 (1) LT flank AR4 (7) LT lower AR5 (12) pelvis AR6 (36) RT lower AR7 (5) RT flank AR8 (8) upper jejunum AR9 (3) lower jejunum AR10 (2) upper ileum AR11 (2) lower ileum AR12 (5) |
| Alcazar et al. [75] (n = number of patients) | rectosigmoid AR6 (27) pelvic peritoneum AR5–7 (59) major omentum AR0 (46) upper abdominal peritoneum (43) small bowel (12) mesentery (4) mesogastrium AR2 (12) hepatic hilum AR1 (10) spleen AR3 (5) |
| Abdalla Ahmed et al. [76] (n/a) | central AR0 RT upper AR1 LT upper AR3 LT flank AR4 LT lower AR5 pelvis AR6 Douglas pouch, rectosigmoid colon AR6 RT lower AR7 RT flank AR8 upper jejunum AR9 lower jejunum AR10 upper ileum AR11 lower ileum AR12 |
| Tsoi et al. [77] (n = number of patients) | RT subphrenic space AR1 (3) RT subhepatic space AR1 (2) gastric serosa AR2 (1) lesser sac AR2 (0) LT subphrenic space AR3 (1) LT perihepatic space AR2 (0) RT paracolic gutter AR8 (2) LT paracolic gutter AR4 (2) pouch of Douglas AR6 (6) bladder flap AR6 (6) mesentery (5) omentum AR0 (6) large bowel serosa (9) small bowel serosa (1) pelvis AR5–7 (14) |
| An et al. [27] (n = number of ARs) | subdiaphragmatic space AR1,3 (24) perihepatic space/Morrison pouch AR1 (24) porta hepatis AR1 (2) upper abdominal peritoneum/stomach serosa, lesser sac AR2 (33) splenic hilum AR3 (2) paracolic gutters AR4,8 (27) bowel serosa (45) bowel mesentery (35) omentum AR0 (48) pelvic peritoneum AR5–7 (75) |
| Mikkelsen et al. [30] (n = number of patients) | liver/duodenum/pancreas/gastric ventricle (7) porta hepatis/hepatoduodenal ligament AR1 (17) celiac trunk/superior mesenteric artery/bowel mesentery root (47) |
| Feng et al. [42] (n = number of ARs) | central AR0 (29) RT upper AR1 (31) epigastrium AR2 (11) LT upper AR3 (16) LT flank AR4 (19) LT lower AR5 (32) pelvis AR6 (43) RT lower AR7 (29) RT flank AR8 (21) upper jejunum AR9 (10) lower jejunum AR10 (10) upper ileum AR11 (18) lower ileum AR12 (17) |
| Mallet et al. [44] (n = number of patients) | central AR0 (73) RT upper AR1 (67) epigastrium AR2 (58) LT upper AR3 (56) LT flank AR4 (58) LT lower AR5 (77) pelvis AR6 (78) RT lower AR7 (71) RT flank AR8 (62) upper jejunum AR9 (19) lower jejunum AR10 (22) upper ileum AR11 (31) lower ileum AR12 (35) |
| Fischerova et al. [78] (n/a) | pelvic involvement: anterior and posterior compartment AR5–7 rectosigmoid AR6 upper abdominal involvement: LT diaphragm, spleen, RT diaphragm, liver, and lesser omentum greater omentum: supracolic and infracolic omentum AR0 colon infiltration by omentum RT and LT paracolic gutter AR4,8 anterior abdominal wall bowel serosal and mesenterial peritoneal involvement: small and large bowel serosa and small and large bowel mesentery |
| Study | Standard of Reference | MDCT (n = 23) | MRI (n = 4) | DWI (n = 6) | 18F FDG-PET/CT (n = 16) | Mean Time Interval between Imaging Modalities/Range (Days) | Mean Time Interval between Imaging and Surgery/Range (Days) |
|---|---|---|---|---|---|---|---|
| Tempany et al. [51] | surgical (PDS) and histopathologic findings | YES | - | 28 | |||
| Pannu et al. [52] | surgical findings (PDS or SLL) | YES | - | 16 (2–108) | |||
| Ricke et al. [53] | surgical (laparotomy) and histopathologic findings | YES | - | 56 | |||
| Pannu et al. [54] | surgical (laparotomy) and histopathologic findings | YES | - | 31.7 (6–110) | |||
| Kim et al. [55] | surgical and/or histopathologic findings (SLL or biopsy), radiological and clinical follow-up | YES | YES | 10 (1–20) | 18 (2–35) | ||
| Kitajima et al. [56] | surgical and/or histopathologic findings (SLL or biopsy), radiological and clinical follow-up of at least 6 months | YES | YES (CECT) | concurrent | n/a | ||
| Kitajima et al. [57] | surgical (PDS) and histopathologic findings | YES | YES (CECT) | concurrent | 14 | ||
| Choi et al. [58] | surgical findings (PDS) | YES | - | 17.6 (2–44) | |||
| Metser et al. [59] | surgical (PDS or IDS) and histopathologic findings, follow-up (mean time: 19 months) | YES | - | 24 (1–67) | |||
| De laco et al. [60] | surgical (laparoscopy) and histopathologic findings | YES | - | n/a | |||
| Sanli et al. [61] | surgical and histopathologic findings (surgical exploration or biopsy), clinical follow-up of at least 6 months | YES | YES | ≤30 | n/a | ||
| Espada et al. [62] | surgical (EL) and histopathologic findings | YES | - | 15 | |||
| Hynninen et al. [63] | surgical (PDS, laparotomy or laparoscopy + IDS) and histopathologic findings | YES | YES (CECT) | concurrent | 14 | ||
| Kim et al. [64] | surgical (PDS or IDS) and histopathologic findings | YES | YES | 17 (1–60) | PET/CT: 23 (1–54) MDCT: 26 (4–61) | ||
| Mazzei et al. [65] | surgical (PDS) and histopathologic findings | YES | - | 45 | |||
| Michielsen et al. [66] | surgical (PDS or IDS) and histopathologic findings, imaging follow-up | YES | YES (WB-MRI) | YES (CECT) | n/a | n/a | |
| Schmidt et al. [67] | surgical and histopathologic findings | YES | YES | YES | 1 ± 4 (0–14) | 8.1 ± 2.4 (1–29) | |
| Lopez-Lopez et al. [68] | surgical findings | YES | YES | n/a | <42 | ||
| Nasser et al. [26] | surgical (debulking surgery) and histopathologic findings | YES | - | n/a | |||
| Rodolfino et al. [69] | imaging follow-up for a minimum of 12 months | YES | - | n/a | |||
| Tawakol et al. [70] | surgical and histopathologic findings (surgical exploration, biopsy), imaging and clinical follow-up for at least 6 months | YES | YES (CECT) | concurrent | n/a | ||
| Cerci et al. [71] | surgical and histopathologic findings | YES | - | 28 | |||
| Bagul et al. [72] | surgical (PDS) and histopathologic findings | YES | - | 14 | |||
| Michielsen et al. [73] | surgical (PDS or IDS) and histopathologic findings, imaging follow-up | YES | YES (WB-MRI) | n/a | n/a | ||
| Rajan et al. [74] | surgical (PDS or IDS) and histopathologic findings | YES | - | n/a | |||
| Alcazar et al. [75] | surgical and histopathologic findings (surgical exploration, biopsy) | YES | - | 15 | |||
| Abdalla Ahmed et al. [76] | surgical (laparoscopy and laparotomy, PDS) and histopathologic findings | YES | - | 10 (12 ± 5) | |||
| Tsoi et al. [77] | surgical (debulking surgery) and histopathologic findings | YES (CECT) | - | 19 ± 16 | |||
| An et al. [27] | surgical (IDS) and histopathologic findings or imaging follow-up in 6–12 months | YES | - | 13 (2–43) | |||
| Mikkelsen et al. [30] | surgical (PDS) and histopathologic findings | YES (PET/CT) | YES | YES (CECT) | n/a | DWI: 15 (6–28) PET/CT: 14 (1–27) | |
| Feng et al. [42] | surgical (PDS) and histopathologic findings | YES | - | 14 | |||
| Mallet et al. [44] | surgical (laparoscopy) and histopathologic findings | YES | - | 28 | |||
| Fischerova et al. [78] | surgical (laparoscopy or laparotomy, PDS) and histopathologic findings | YES | YES (WB-MRI) | few | 28 |
| Summary of MDCT Features | |||||||||
|---|---|---|---|---|---|---|---|---|---|
| Study | Number of Rows | Type of Intravenous cm (mgI/mL) | Amount of cm | Type of Luminal cm | Phases | Slice Thickness (mm) | Slice Reconstruction (mm) | kV | MPRs |
| Pannu et al. [52] | 4 | non-ionic | 120 mL | 750–1000 mL H2O | arterial, portal | 3 | 2 | n/a | coronal, sagittal, oblique |
| Kitajima et al. [PET/CECT] [56] | 16 | Iomeprole 300 | 2 mL/kg (150 mL max) | No | portal | 2 | n/a | 140 | coronal, sagittal |
| Kitajima et al. PET/CECT] [57] | 16 | Iomeprole 300 | 2 mL/kg (150 mL max) | No | portal | 2 | n/a | 140 | coronal, sagittal |
| Choi et al. [58] | 4 | Ultravist 300 | 140 mL | n/a | portal | 3.2 | 3 | n/a | n/a |
| Metser et al. [59] | 64 | Omnipaque 300 | 2 mL/kg (180 mL max) | n/a | portal | 5 | 2 | 120 | coronal |
| Hynninen et al. [PET/CECT] [63] | 64 | Yes, n/a | n/a | n/a | n/a | n/a | n/a | 120 | n/a |
| Kim et al. [64] | 16 or 64 | Yes, n/a | 130 mL | 450 mL n/a | n/a | n/a | 3 | 120 | n/a |
| Mazzei et al. [65] | 4 or 16 or 64 | Iopamiro 370 | 2 mL/kg | H2O + Macrogol (7 patients) | late arterial, portal | 3.75 (4-row) 3.75/2.5 (16-row) 3.75/1.25/2.5 (64-row) | 1.5 (4-row) 0.8 (16-row) 0.8 (64-row) | 120–140 | coronal, sagittal, oblique |
| Michielsen et al. [66] | 16 or 64 | Visipaque 320 | 120 mL | 30 mL Telebrix + 900 mL H2O | portal | 5 | n/a | 120 | n/a |
| Schmidt et al. [67] | 64 | Iohexol 300 | body weight + 30 mL | 1 L H2O (rectal enema) | portal | 2 | 2 | 120 | Yes, n/a |
| Lopez-Lopez et al. [68] | n/a | Yes, n/a | 130 mL | 450 mL n/a | portal | n/a | 3 | 120 | n/a |
| Nasser et al. [26] | n/a | n/a | n/a | n/a | n/a | n/a | n/a | n/a | n/a |
| Rodolfino et al. [69] | n/a | Iopromide 370 | 2 mL/kg | Gastrografin 15 mL + 300 mL H2O | portal, delayed | 1 | n/a | n/a | Yes, n/a |
| Tawakol et al. [PET/CECT] [70] | 64 | non-ionic | 1–2 mL/kg (150 mL max) | 400–600 mL diluted mannitol | n/a | 1.5 | n/a | 120 | axial, coronal, sagittal, MIP |
| Cerci et al. [71] | n/a | Yes, n/a | n/a | Yes, n/a | n/a | n/a | n/a | n/a | n/a |
| Bagul et al. [72] | 64 | non-ionic | 80 mL | Gastrografin 2%, 40 mL + 2 L H2O | arterial | 3–5 | n/a | n/a | n/a |
| Michielsen et al. [73] | 16 or 64 | Yes, n/a | n/a | Yes, n/a | portal | n/a | 3–5 | n/a | transverse, coronal |
| Rajan et al. [74] | 16 | non-ionic | 50 mL | 1000 mL diluted contrast 2% | arterial, portal | 5 | 2–3 | n/a | n/a |
| Alcazar et al. [75] | 64 | n/a | n/a | n/a | n/a | n/a | n/a | n/a | n/a |
| Abdalla Ahmed et al. [76] | 16 or 64 | Ultravist 300 | 140 mL | 500–750 mL n/a | arterial, portal | 1.25 | 0.8 | 120 | n/a |
| An et al. [27] | 64 | n/a | 1.5 mL/kg | No | portal | 2.5 | 2.5 | 120 | coronal, sagittal |
| Mikkelsen et al. [30] | 64 | Iomeron | 0.8 mL/kg | diluted Omnipaque | n/a | n/a | 2.5 mm | n/a | n/a |
| Fischerova et al. [78] | n/a | non-ionic | n/a | 1 L H2O or diluted iodine contrast | portal | n/a | n/a | n/a | coronal, sagittal, axial |
| Summary of MRI Features | |||||||||
|---|---|---|---|---|---|---|---|---|---|
| Study | Magnetic Field Strength (T) | Type of Coil | Type of Intravenous cm (mg/mL) | Amount of cm | Phases | Type of Luminal Contrast | Bowel Preparation | Section Thickness (mm) | b-Value (s/mm2) |
| Tempany et al. [51] | 1.5 | multicoil array or body | Gadolinium | n/a | n/a | n/a | 1 mg GlucaGen (im) | 8–10 | No |
| Ricke et al. [53] | 1.5 | body | Magnevist | 0.2 mL/kg | n/a | n/a | 2 × 20 mg Buscopan (iv) | 8 | No |
| Kim et al. [55] | 1.5 | phased array or body | Magnevist | 0.1 mmol/kg | n/a | No | 20 mg Buscopan (im) | 5–8 | No |
| Sanli et al. [61] | 1.5 | phased array | n/a | n/a | arterial, venous, delayed | n/a | n/a | 4–8 | No |
| Espada et al. [62] | 3 | phased array | Gadolinium | n/a | n/a | n/a | n/a | 5 | 600 |
| Michielsen et al. [66] | 3 | phased array | Gadolinium-DOTA | 15 mL | portal | 1 L pineapple juice | 20 mg Buscopan (iv) | 1.5–6 | WB-DWI 0, 1000 |
| Schmidt et al. [67] | 3 | phased array + spine clusters | Gadolinium-DOTA | 0.2 mmol/kg | portal | 1 L H2O rectal enema | 20 mg Buscopan/1 mg GlucaGen (iv) | 3–6 | 0, 300, 600 |
| Michielsen et al. [73] | 3 | phased array | Gadolinium | n/a | n/a | 1 L pineapple juice | 20 mg Buscopan (iv) | 2.5–6 | WB-DWI 0, 1000 |
| Mikkelsen et al. [30] | 1.5 | multi-channel | No | n/a | n/a | No | 1 mg glucagon im | 5–8 | 0, 1000 |
| Fischerova et al. [78] | 3 | phased array | Gadolinium | n/a | n/a | 1 L pineapple juice or H2O | Buscopan (iv) | 5 | WB-DWI 50, 1000 |
| Summary of FDG PET/CT Features | |||||||||
|---|---|---|---|---|---|---|---|---|---|
| PET | CT | ||||||||
| Study | System (Covered Area) | Tracer Amount | Scanning Time (min) | Scanning Time (min) per Bed Position | Number of Rows | Slice Thickness (mm) | Type of Intravenous cm (mgI/mL) | Type of Luminal cm | kV |
| Pannu et al. [54] | caudal to cranial direction | 0.22 mCi/kg | n/a | 5 | 4 | n/a | No | Readi-cat 1.3% | 140 |
| Kim et al. [55] | head-pelvic floor | 260–485 MBq | n/a | 5 | 8 | 5 | No | No | 140 |
| Kitajima et al. [56] | ear-mid thigh | 4 MBq/kg | 18–21 | 3 | 16 | 2 | Iomeprole 300, 2 mL/kg (150 mL max) | No | 140 |
| Kitajima et al. [57] | ear-mid thigh | 4 MBq/kg | 18–21 | 3 | 16 | 2 | Iomeprole 300, 2 mL/kg (150 mL max) | No | 140 |
| De laco et al. [60] | n/a | 5.3 MBq/kg | n/a | 4 | n/a | 5 | No | n/a | 120 |
| Sanli et al. [61] | skull-upper thigh | 370–550 MBq | 18–24 | 3 | n/a | n/a | No | Yes, n/a | 140 |
| Hynninen et al. [63] | skull-mid thigh | 4 MBq/kg | n/a | n/a | 64 | n/a | Yes, n/a | n/a | 120 |
| Kim et al. [64] | skull to upper thigh | 350 MBq | n/a | 3 | 16 | 3.75 | No | No | 120 |
| Michielsen et al. [66] | whole-body | 303 MBq (220–388) | n/a | n/a | spiral | 5 | Yes, n/a | Yes, n/a | 120 |
| Schmidt et al. [67] | skull base-mid thigh | 5.5 MBq/kg | n/a | n/a | 16 | 5 | No | n/a | 140 |
| Lopez-Lopez et al. [68] | skull base-upper thigh | 370 MBq | n/a | 3 | 16 | 5 | No | No | 120 |
| Tawakol et al. [70] | skull base-mid thigh | 3.7–5.2 MBq/kg | 18 | 2 | 64 | 5 | non-ionic, 1–2 mL/kg, 150 mL max | 400–600 mL mannitol | 120 |
| Tsoi et al. [77] | skull base-proximal thigh | 298 + 53 MBq | 15 | 2.5 | 64 | 2.5 | ±iodinated | No | 120 |
| Mikkelsen et al. [30] | n/a | 4 MBq/kg | n/a | n/a | 64 | 2.5 | Iomeron 0.8 mL/kg | dilute Omnipaque | n/a |
| Feng et al. [42] | inguinal region-head | 7.4 MBq/kg | n/a | 2–3 | 16 | n/a | n/a | n/a | 120 |
| Mallet et al. [44] | head to midthighs | 2–4 MBq/kg | n/a | n/a | n/a | n/a | n/a | n/a | n/a |
| ARs | Pooled Sensitivity (%CI) | Pooled Specificity (%CI) | AUC |
|---|---|---|---|
| AR0 | 80.1 (74.5–84.9) | 89 (83.1–93.3) | 0.91 |
| AR1 | 62.5 (54.1–70.4) | 97.1 (94.8–98.6) | 0.86 |
| AR2 | 53.1 (34.7–70.9) | 92.8 (86.8–96.7) | 0.72 |
| AR3 | 61.8 (50.9–71.9) | 97.9 (95.8–99.2) | 0.93 |
| AR4 | 73 (60.3–83.4) | 86.3 (76.7–92.9) | 0.92 |
| AR5–7 | 64.1 (58.4–69.4) | 95.1 (91.6–97.4) | 0.90 |
| AR6 | 66.2 (59.7–72.3) | 93.3 (89.7–95.9) | 0.92 |
| AR8 | 71 (58.8–81.3) | 86.3 (76.2–93.2) | 0.74 |
| diaphragm | 49.7 (42.6–56.9) | 97.7 (94.8–99.3) | 0.91 |
| small bowel (AR9–12) | 45.5 (35.4–55.8) | 94.9 (92.2–96.9) | 0.80 |
| colon | 30.5 (23.2–38.5) | 95.8 (92.2–98.1) | 0.36 |
| mesentery | 33.8 (27.2–41) | 96.9 (94.9–98.3) | 0.66 |
| ARs | Pooled Sensitivity (%CI) | Pooled Specificity (%CI) | AUC (SE) |
|---|---|---|---|
| AR0 | 64.7 (55.9–72.7) | 67.2 (61.2–72.7) | 0.82 |
| diaphragm | 67.3 (57.3–76.3) | 66.5 (61.2–71.5) | 0.66 |
| mesentery | 59.2 (48.8–69) | 75.7 (71.3–79.7) | 0.90 |
| ARs | Pooled Sensitivity (%CI) | Pooled Specificity (%CI) | AUC (SE) |
|---|---|---|---|
| AR0 | 92.9 (86.5–96.9) | 85.2 (73.8–93) | 0.95 |
| AR1 | 73.5 (64.5–81.2) | 92.1 (85–96.5) | 0.83 |
| AR3 | 70.4 (58.4–80.7) | 86.9 (77.8–93.3) | 0.78 |
| AR5–7 | 91.5 (85–95.9) | 87.5 (74.8–95.3) | 0.94 |
| mesentery | 45.5 (30.4–61.2) | 98.9 (94–100) | 0.9 |
| ARs | Pooled Sensitivity (%CI) | Pooled Specificity (%CI) | AUC |
|---|---|---|---|
| AR0 | 60.7 (49.7–70.9) | 77 (66.8–85.4) | 0.72 |
| AR5–7 | 46.6 (35.9–57.5) | 88.7 (81.4–93.8) | 0.78 |
| AR6 | 24.4 (12.4–40.3) | 96.4 (89.9–99.3) | 0.99 |
| diaphragm | 40.7 (28.1–54.3) | 86 (73.3–94.2) | 0.89 |
| mesentery | 43.4 (29.8–57.7) | 90.7 (83.6–95.5) | 0.68 |
| ARs | Pooled Sensitivity (%CI) | Pooled Specificity (%CI) | AUC |
|---|---|---|---|
| AR0 | 83.7 (74.8–90.4) | 89.3 (78.1–96) | 0.90 |
| AR1 | 66.7 (54.8–77.1) | 81.8 (69.1–90.9) | 0.99 |
| AR3 | 74.5 (59.7–86.1) | 82.5 (70.1–91.3) | 0.88 |
| AR4 | 75.7 (64–85.2) | 80.5 (65.1–91.2) | 0.81 |
| AR5–7 | 57.1 (47.4–66.5) | 91.8 (81.9–97.3) | 0.74 |
| AR8 | 77.1 (65.6–86.3) | 82.5 (67.2–92.7) | 0.86 |
Disclaimer/Publisher’s Note: The statements, opinions and data contained in all publications are solely those of the individual author(s) and contributor(s) and not of MDPI and/or the editor(s). MDPI and/or the editor(s) disclaim responsibility for any injury to people or property resulting from any ideas, methods, instructions or products referred to in the content. |
© 2024 by the authors. Licensee MDPI, Basel, Switzerland. This article is an open access article distributed under the terms and conditions of the Creative Commons Attribution (CC BY) license (https://creativecommons.org/licenses/by/4.0/).
Share and Cite
Tsili, A.C.; Alexiou, G.; Tzoumpa, M.; Siempis, T.; Argyropoulou, M.I. Imaging of Peritoneal Metastases in Ovarian Cancer Using MDCT, MRI, and FDG PET/CT: A Systematic Review and Meta-Analysis. Cancers 2024, 16, 1467. https://doi.org/10.3390/cancers16081467
Tsili AC, Alexiou G, Tzoumpa M, Siempis T, Argyropoulou MI. Imaging of Peritoneal Metastases in Ovarian Cancer Using MDCT, MRI, and FDG PET/CT: A Systematic Review and Meta-Analysis. Cancers. 2024; 16(8):1467. https://doi.org/10.3390/cancers16081467
Chicago/Turabian StyleTsili, Athina C., George Alexiou, Martha Tzoumpa, Timoleon Siempis, and Maria I. Argyropoulou. 2024. "Imaging of Peritoneal Metastases in Ovarian Cancer Using MDCT, MRI, and FDG PET/CT: A Systematic Review and Meta-Analysis" Cancers 16, no. 8: 1467. https://doi.org/10.3390/cancers16081467
APA StyleTsili, A. C., Alexiou, G., Tzoumpa, M., Siempis, T., & Argyropoulou, M. I. (2024). Imaging of Peritoneal Metastases in Ovarian Cancer Using MDCT, MRI, and FDG PET/CT: A Systematic Review and Meta-Analysis. Cancers, 16(8), 1467. https://doi.org/10.3390/cancers16081467