Abstract
Data on the soil nutrient content are required to calculate fertilizer rate recommendations. The soil laboratory determines these soil properties, yet the measurement is time-consuming and costly. Meanwhile, portable devices to assess the soil nutrient content in real-time are limited. However, a proprietary and low-cost NPK sensor is available and commonly used in IoT for agriculture. This study aimed to assemble and test a portable, NPK sensor-based device in irrigated and rainfed paddy soils from Java, Indonesia. The device development followed a prototyping approach. The device building included market surveys and opted for an inexpensive, light, and compact soil sensor, power storage, monitor, and wire connectors. Arduino programming language was used to write scripts for data display and sub-device communication. The result is a real-time, portable soil nutrient detector that measures the soil temperature, moisture, pH, electrical conductivity, and N, P, and K contents. Field tests show that the device is sensitive to soil properties and location. The portable soil nutrient detector may be an alternative tool for the real-time measurement of soil nutrients in paddy fields in Indonesia.
1. Introduction
Soil N, P, and K are the primary soil macronutrients essential for crop growth and production. NPK fertilization of 16-16-16 with a dose of 400 kg/ha can increase rice yields from 1.69 to 4.04 t/ha [1]. NPK fertilization increased paddy rice yield by 35.20% [2] and 57.72% [3]. In precision farming, fertilizer application should consider the soil nutrient status and crop requirements. Accordingly, the contents of these nutrients in the soil are routinely measured as input data in formulating fertilizer rate recommendations for a given crop and as baseline data in soil nutrient management. Meanwhile, soil pH and electrical conductivity (EC) control these nutrient dynamics and availability; hence, both are routinely measured. The soil pH and EC data are input data to opt for soil conditioners for effective and efficient fertilizer application.
In smart farming, fertilizers are the right type and rate, and the right crop is promoted to achieve balanced and eco-friendly fertilizer application. Balanced fertilizer application needs a precise rate, considering the soil nutrient content, crop requirements, and other soil properties. Overdose fertilizer applications increase farming costs, soil pollution, and eutrophication in the water body, causing a nutrient imbalance. Contrastingly, underrate fertilizer application leads to ineffective application and limits crop growth and yield. Balanced fertilizer can increase yield by 3–7% and decrease NPK application by 35–93% [4]. Farm-level fertilizer recommendations calculated by web-based software based on location-specific soil test values in Bangladesh can increase rice yields by 7–22% [5].
However, farmers still apply N, P, and K fertilizers regardless of the soil nutrient status and rice requirements and without an economic calculation for the additional fertilizer cost and expected yields [6]. Farmers usually apply NPK compound fertilizer along with P fertilizer (SP-36). If such a practice is applied in soil that contains a low soil organic carbon level, such as in Java [7,8], it causes a nutrient imbalance and nutrient (P and K) accumulation in the soils [9]. Such action occurs due to limited soil information, low insights into balanced fertilizer application for high yield, and a poor understanding of sustainable soil nutrient management. Precision fertilization of food crops requires accurate data obtained from sophisticated equipment. Hyperspectral imaging using machines can support accurate N nutrient management [10]. Tools should be developed so farmers obtain soil information and create information quickly and cheaply.
Primary soil macronutrients (N, P, and K) are usually determined in two ways, namely, laboratory procedures and field quick tests. Determining the soil nutrient content in the soil laboratory begins with sending soil samples to the laboratory, preparing the sample for analysis (drying, grinding, and sieving), and using analytical standard procedures to determine the content. However, this analytical process consumes more time (>two months) and uses chemical materials, an expensive apparatus, and equipment. Accordingly, the analytical results have been received lately and are outdated, although soil properties are dynamic. Interpreting data to determine the correct fertilizer dosage according to soil characteristics requires expertise and experience. In the field, a soil test kit could be used for soil extraction and soil nutrient determination using a color change and visual observation [11]. This technique results in qualitative data. In addition, this method also consumes a lot of time for a given test, and more tests need more time. The reagent liquid is also limited to a given sample number and could expire; hence, it needs refilling, but a replacement is not always available. Bringing liquid to air transportation was also forbidden, limiting the use of these soil test kits.
Meanwhile, revolutionary sensor technology has been developing, including soil moisture and soil nutrient sensors [12,13], using indirect contact proximal sensing or direct contact probe sensing. Proximal sensing captures soil reflectance by a low-cost NIR spectrometer, where the tool does not contact the soil. Based on the built spectral library, the soil properties are determined using deep learning or machine learning [14]. This technique is used worldwide but is inefficient for moist soil, such as in the field condition. In Indonesia, the proximal sensing approach has been studied by [14]. Vicarra Rossel et al. [15] provide an overview of methods and techniques in proximal soil sensing, namely, using field-based sensors to obtain signals from the soil when the sensor’s detector is in contact with or close to (within 2 m) the soil. Another technique uses the probe-based soil sensor. Capacitance probes must be inserted into the soils and in contact with the soils. This technique does not use any chemicals.
Presently, soil sensors are affordable and can measure soil moisture, soil temperature, EC, pH, and N, P, and K contents. For example, the soil sensor 7-in-1 (CWT Co., Limited, Shenzhen, China) can measure these properties simultaneously. In digital agriculture, especially IoT development, soil sensors are the main component in developing equipment sets to automate soil and crop management. For example, Lavanya et al. [16] developed soil sensors integrated into an IoT-based fertilizer intimation system for smart agriculture. However, soil sensors can also be used to develop a portable tool for detecting soil properties, including the soil nutrient content, by a specific design and combined with other display components, connection wires, power storage, and a toolbox.
The portable soil nutrient detector can assist extension workers, farmers, researchers, and other field practitioners in determining soil properties, contents and statuses, including soil nutrients. The remaining question is how to create this portable device to determine real-time soil nutrients and properties in the field. Hence, this study aimed (i) to design and assemble a portable soil nutrient detector using available and affordable sensors and other components and (ii) to evaluate the device’s performance in the field, considering the variation of paddy soils and landscape settings. The resulting device must be portable, use various transport systems, be sensitive to soils and locations, and be user-friendly. The device is used to measure N, P, K, pH, EC, moisture, and temperature of soils in the field quickly and easily.
2. Materials and Methods
2.1. Device Development
This study used a prototyping approach, starting with the initial investigation, requirement analysis, system design, coding, and testing (Figure 1). In the first step, the initial investigation, available tools were surveyed and evaluated for advantages and weaknesses and compared to the need for a low-cost, portable device. The initial investigation covered a system requirement analysis using a need and opportunities analysis and gap analysis, namely, listing existing systems and identifying what is needed. Moreover, it compared available material by assessing technological advances, current usage, and potential future development.
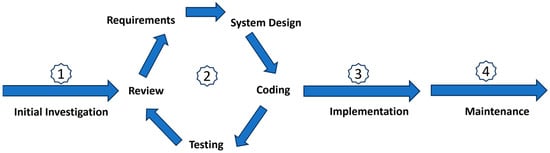
Figure 1.
The steps for the device to develop a portable soil nutrient detector in rice fields start from the initial investigation, requirement analysis, system design, coding, testing, and maintenance.
After that, in step 2, we listed the requirements of components for creating a device by considering available and low-cost components (Table 1). Then, we drafted a design covering power needs (storage capacity and dimension), wire types to connect among components, layout of component positions (display, buttons, and boards), and toolbox (dimension, weight, and material). Then, we coded and tested the device system, including field testing. In step 2, we experimented to obtain an agreeable prototype. Subsequently, in step 3, we implemented the results of step 2 and performed maintenance for errors and bugs.

Table 1.
The device components, functions, and requirements.
2.2. Hardware Survey and Selection
Hardware became the main component of this device, as presented in Table 1. The used hardware was available in the market with cutting-edge technologies and was low-cost; hence, it could reduce production costs. A survey and selection of software was helpful for many product catalogs on digital platforms.
This study used 7-in-1 integrated soil sensors (ComWinTop (CWT) Co. Limited, Shenzhen, China) that simultaneously measure soil EC, pH, N, P, K, moisture, and temperature. This sensor uses Modbus RS485/4G/NB-IoT/LORA, with the specifications in Table 2.
Table 2.
Sensor specification used in this study.
2.3. Wiring, Coding, and Testing
This research used the Arduino programming language. The Arduino IDE version 2.21 (https://www.arduino.cc/en/software (accessed on 5 June 2024)) was used to write, edit, and manage libraries. The Arduino IDE 2 is a versatile editor with many features. Arduino is open source software, and its source code is posted on Github website (www.github.org).
Coding for this sensor has been developed; hence, we modified it from the existing ones. The created features in this device were coding to class the nutrient status based on the criteria from Husnain et al. [18], coding to calculate the fertilizer need, and coding for display adjustments.
Wiring and assembling were performed after all components and computer modules were available. The connection test was performed to ascertain that every component connected and ran well. Subsequently, the sensitivity test was conducted after the device was established to ascertain that sensors were sensitive to tropical, monsoon soil conditions.
2.4. Field Testing
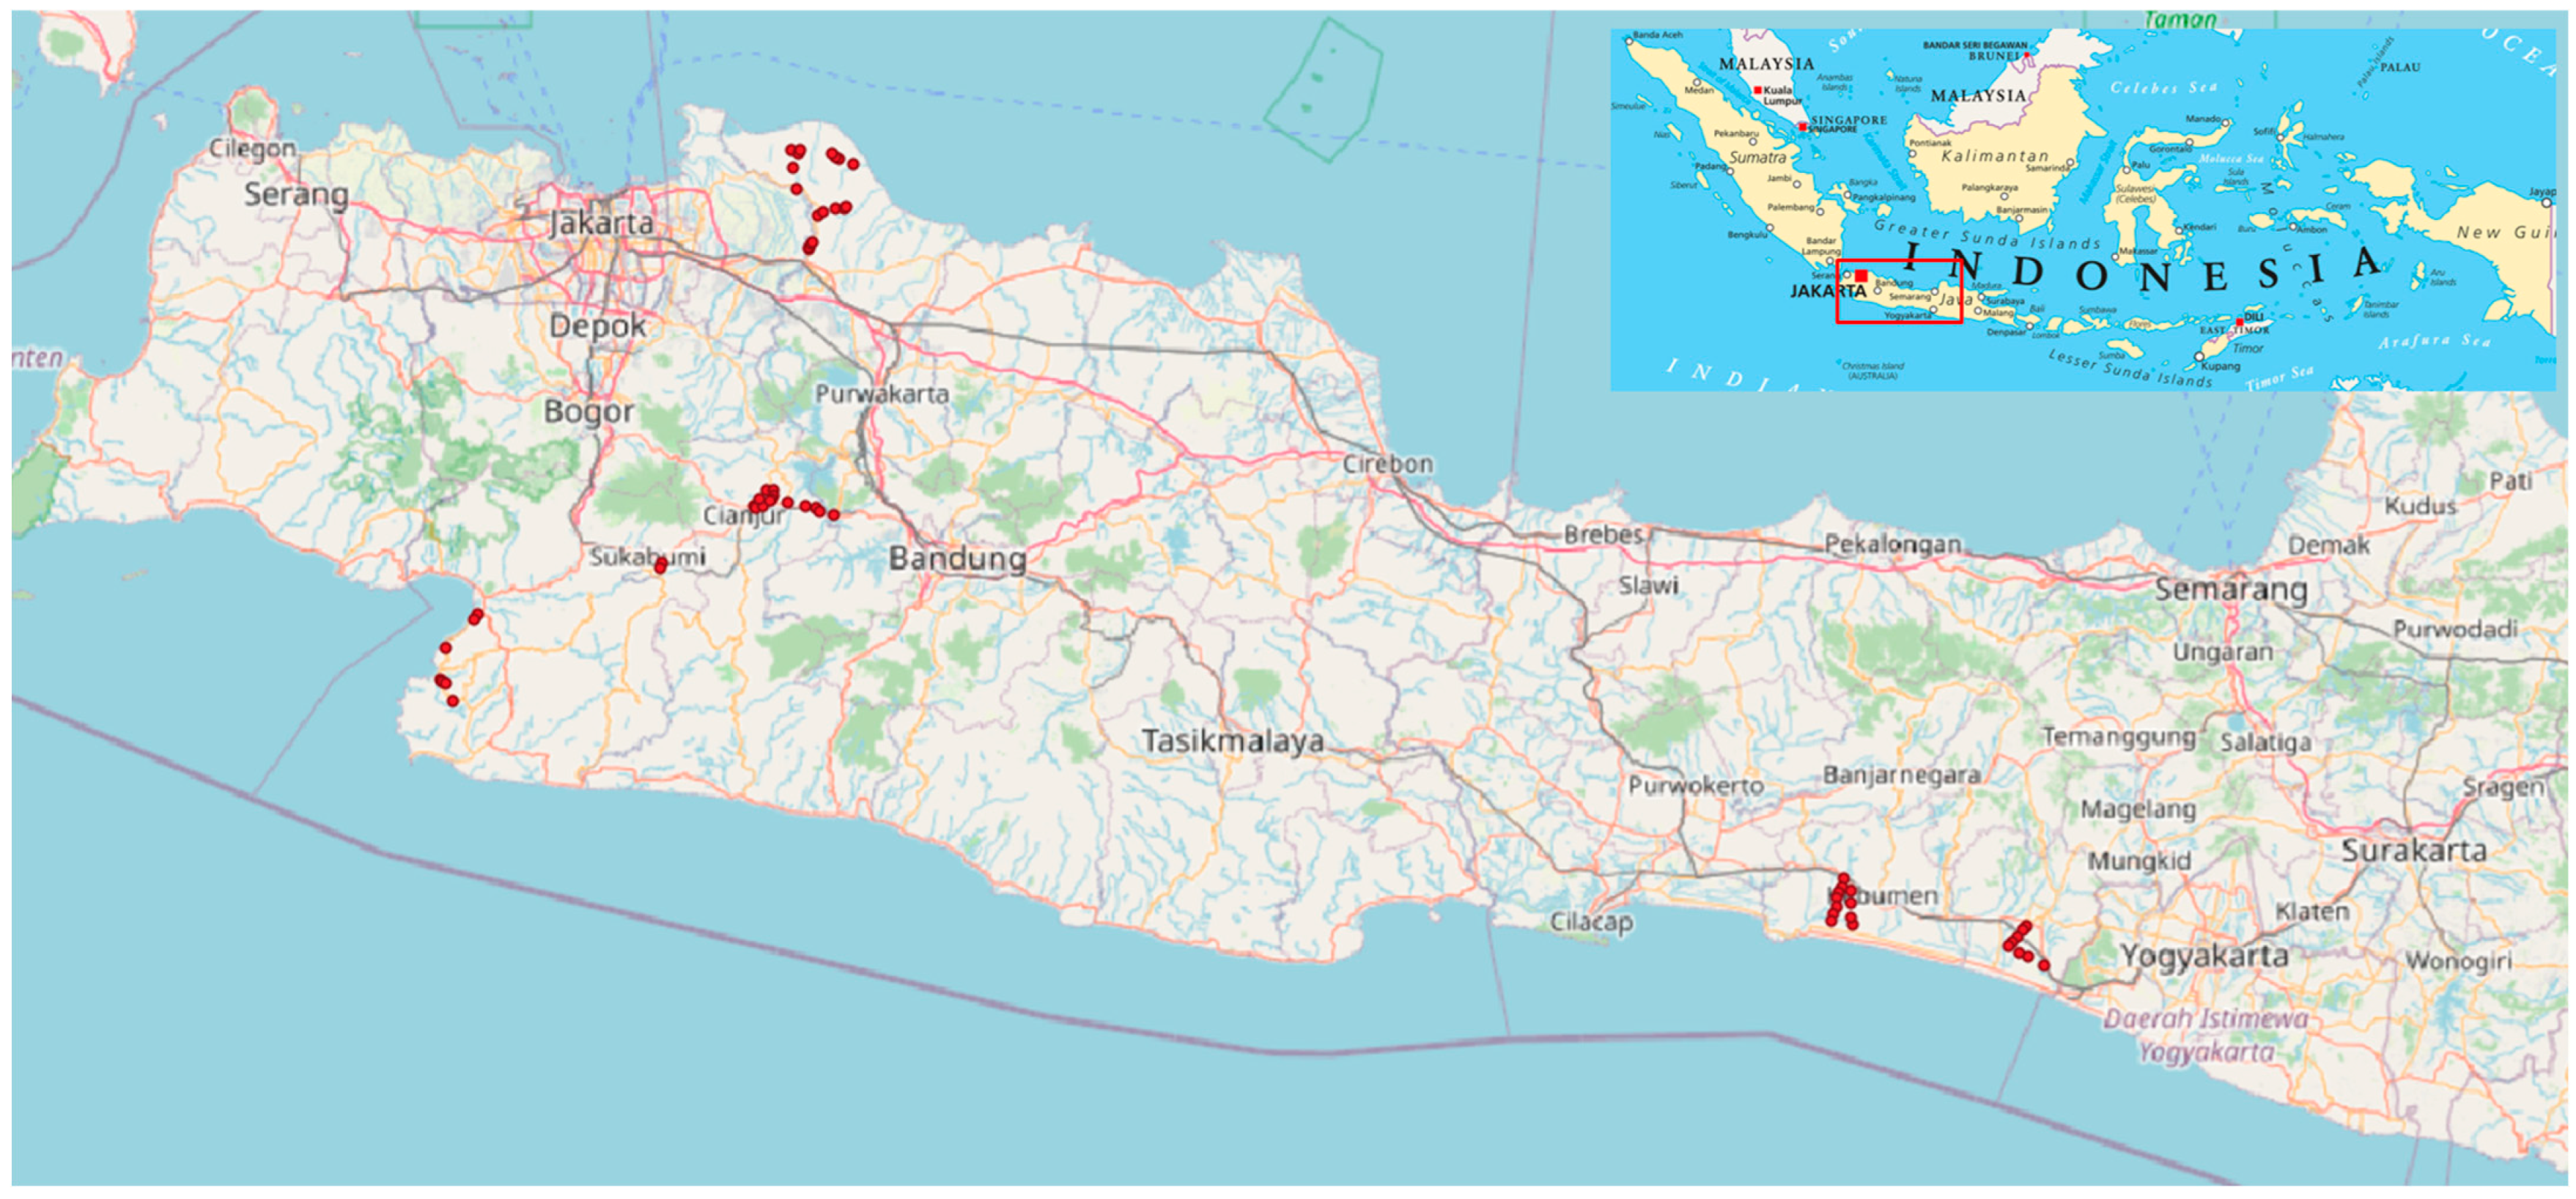
We evaluated the performance of soil nutrient detectors in 60 sites located in irrigated and rainfed paddy fields that represent rice production centers in Java, Indonesia (Figure 2). As many 18 sites in Karawang Regency representing hot lowland, sediment irrigated paddy soils in the northern coast region of Java, 14 sites in Cianjur representing highland and volcanic rainfed paddy soils, and nine sites in Sukabumi regency representing middleland and volcanic rainfed paddy soils. Karawang, Cianjur, and Sukabumi Regency are from the West Java Province. The detector was also tested in the southern coast region of Java, namely 11 sites in Kebumen Regency and eight sites in Purworejo Regency of Central Java Province, all representing irrigated paddy soils.

Figure 2.
The test locations, presented in red dots, of the portable soil nutrient detector in paddy fields represent the northern and southern coastal areas of Java, as well as the highland areas of the rice production centers. Testing sites are plotted on the OpenStreetMap.
Site selection was made randomly, considering landscape variation, mainly the slope position, administrative position, and distance to the previous site. The sensor was inserted into the top soils (0–25 cm depth) in the field study. In addition to recording the coordinate position, recorded soil properties covered soil temperature, moisture, pH, EC, N, P, and K. Readings were performed five times for each sample.
2.5. Statistical Analysis
Measured soil data were analyzed for a brief statistical summary using exploratory data analysis. Regression analysis was performed to assess the relationships between soil properties, and an F-test at an alpha of 0.05 was conducted to evaluate the significance level of regressed equations. Statistical analyses were assisted by JMP Pro. 14.3 [19].
3. Results
3.1. Device Specification
This real-time portable soil nutrient detector can measure the contents of N, P, and K in the soil and other important soil properties in soil nutrient management, namely, soil pH, electrical conductivity (EC), moisture, and temperature. This device is the combination of four sub-components, namely, a sensor, power supply, display, and computer modules, to process measurement results into fertilizer recommendations for rice (Oryza sative), maize (Zea mays), soybean (Glycine max), mungbean (Vigna radiata), and sweet potato (Ipomea batatas). The crops are generally grown in rotation in the Java paddy fields in Indonesia. Yearly, farmers plant rice as the main crop, followed by either maize, soybean, mungbean, or sweet potato, depending on water availability, market need, and price level. Results of the connectivity test show that every component connects well with each other. Figure 3 shows the components of the portable soil nutrient detector.

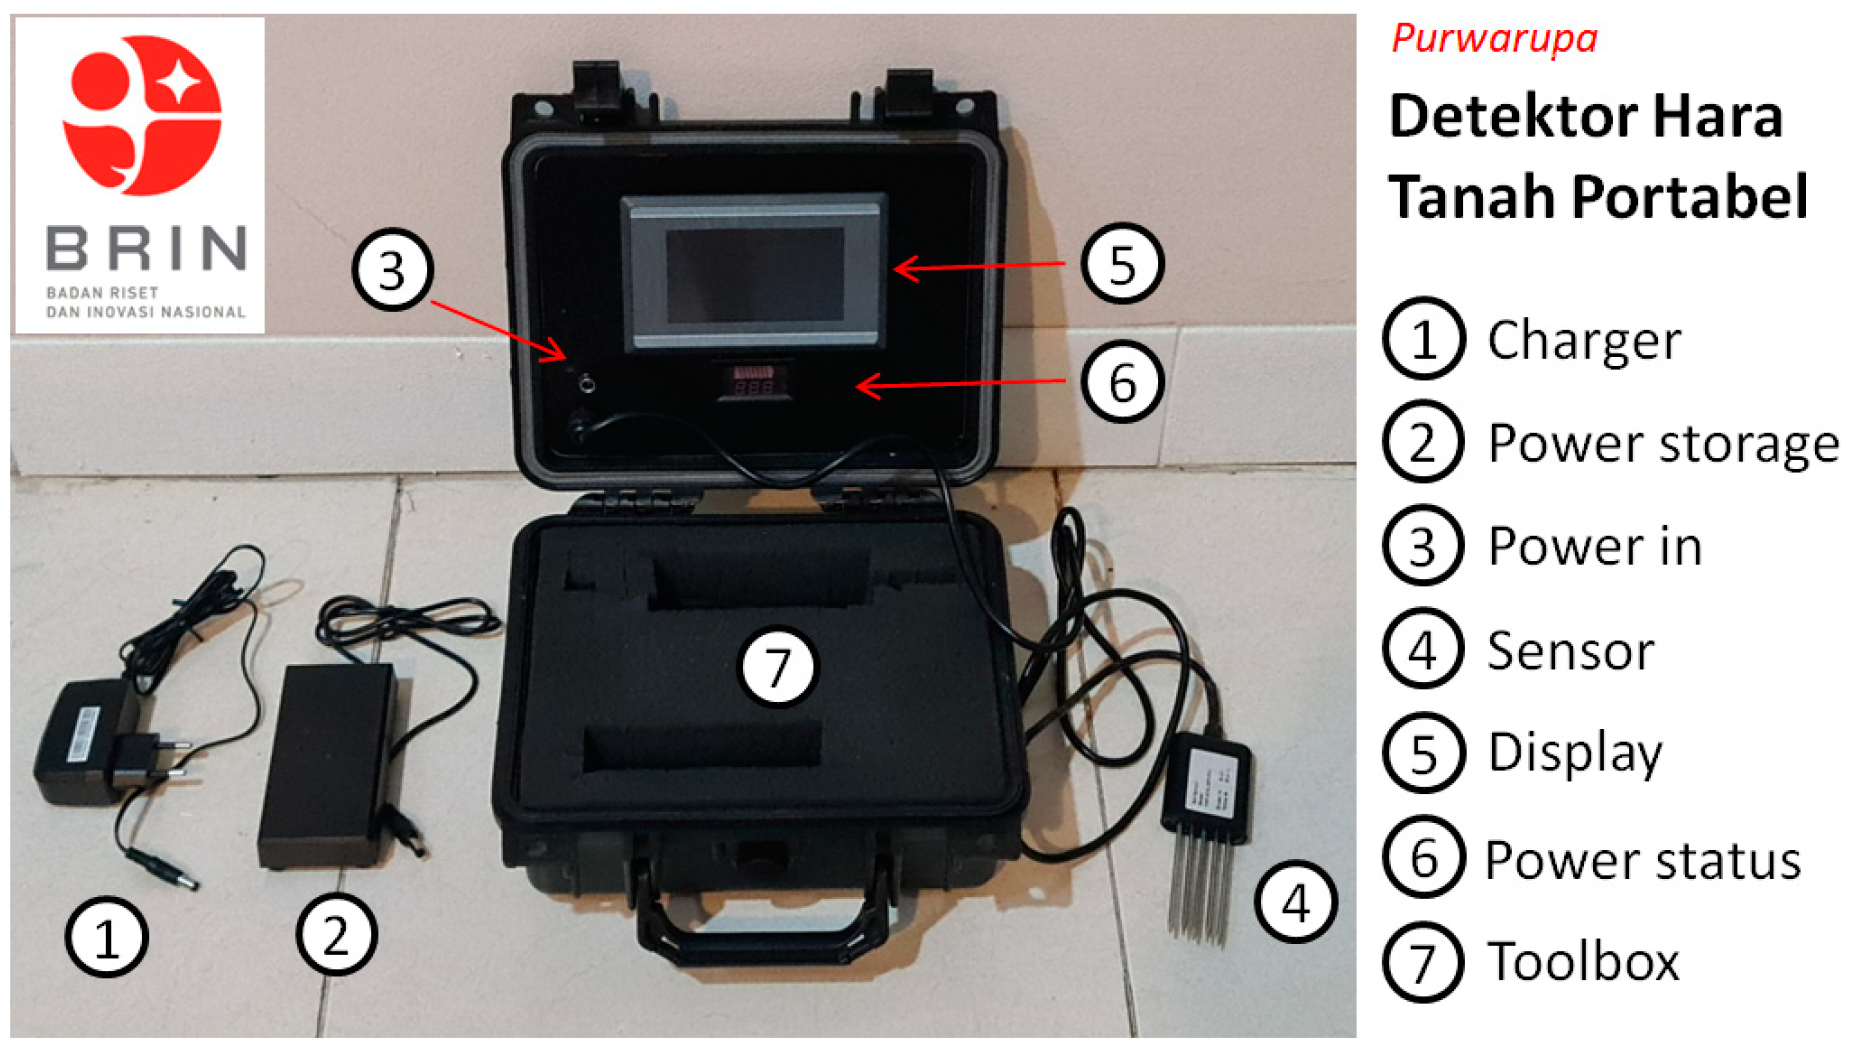
Figure 3.
A portable soil nutrient detector prototype to rapidly detect soil nutrients and provide fertilizer recommendations for rice, corn, soybean, mungbean, and sweet potato crops.
This device needs enough power for operation. Hence, providing portable power banks is vital because the device will be brought to the field and requires long-lasting power storage. The power storage and display monitor’s light-emitting diode (LED) provide information on the energy status. A charger is provided, and this charger is easy to obtain, as it can be used for various energy storage needs and is compatible with the outlets, plugs, and power available in Indonesia (Type C or Type F plug, 230 v, 50 Hz). The power test result showed that current power storage equipment lasts four days, and so charging is rare, meaning that the device should be charged after four days. This condition is beneficial, as a power outlet is not always available in the field.
Soil sensors, important components, are available in the online marketplace at low prices. Several companies have developed these sensors; however, the main consideration in the selection is the number of soil properties that can be measured simultaneously. These sensors are commonly used to develop IoT (Internet of Things) for in situ land management and cannot be removed to other places.
Measurement results are displayed in the LCD (liquid-crystal display) monitor coding using Arduino programming language. The current display provides soil temperature, moisture, pH, EC, and soil N, P, and K information. On the monitor, an LED lamp is installed to provide information on the device’s power status. The display also exercises saving power mode, in which the monitor will beam out if not used for two minutes.
The display is refreshed every two minutes, and the value will change accordingly. To obtain nutrient information, the operator should wait for a stable value. Additionally, it is recommended to perform measurements three or five times and take the median value as a result of the measurement.
3.2. Function
As an advantage, this portable soil nutrient detector measures the soil nutrient content and selected soil properties in the field directly and quantitatively without sample preparation. Moreover, fertilizer recommendations can be directly determined in the field. Nevertheless, the current fertilizer recommendation is only for the rice, maize, soybean, mungbean, and sweet potato that grow in paddy soils.
The functions of the device include (i) measuring the contents and statuses of soil N, soil P, and soil K in real time in the fields; (ii) measuring soil pH in real time in the fields; (iii) assessing soil salinity through timely EC measurements in the field; (iv) measuring the soil moisture content in real time in the field; (v) measuring the soil temperature in real time in the fields; and (vi) determining the fertilizer rate of N, P, and K fertilizer for rice, maize, soybean, mungbean, and sweet potato planted in the paddy soils.
This device can be carried to the field, does not use liquid, is safe to be brought to other places using air transportation, and provides real-time information. Nevertheless, this device will work well in moist to wet soils in paddy fields, either irrigated paddy fields, rainfed paddy fields, or tidal paddy fields.
3.3. Field Performance
The device’s performance was tested to assess sensor sensitivity, the soil nutrient content, and soil properties of tropical paddy soils. The sensor is not sensitive or has low variability if the measurement results are the same among locations. The sensor works well if it is sensitive, resulting in differences in values among locations.
Table 3 presents brief statistics of soil properties measured by the portable soil nutrient detector. The coefficients of variance for temperature and pH are very low (<15%), suggesting that the detector is not sensitive to these soil properties. However, the detector is sensitive to moisture and EC, N, P, and K contents. Thus, the detector assists in explaining variations in these properties and may be used for further measurement in the field.
Table 3.
Brief statistics of soil properties measured by the portable soil nutrient detector.
The standard deviations and CVs of the analysis results with the portable soil nutrient detector are quite high, including the results of EC, N, P, and K nutrients, which shows that this tool is quite sensitive. Meanwhile, the standard deviations and CVs of the temperature, humidity, and pH measurements are lower. It means that the analysis range is indeed low.
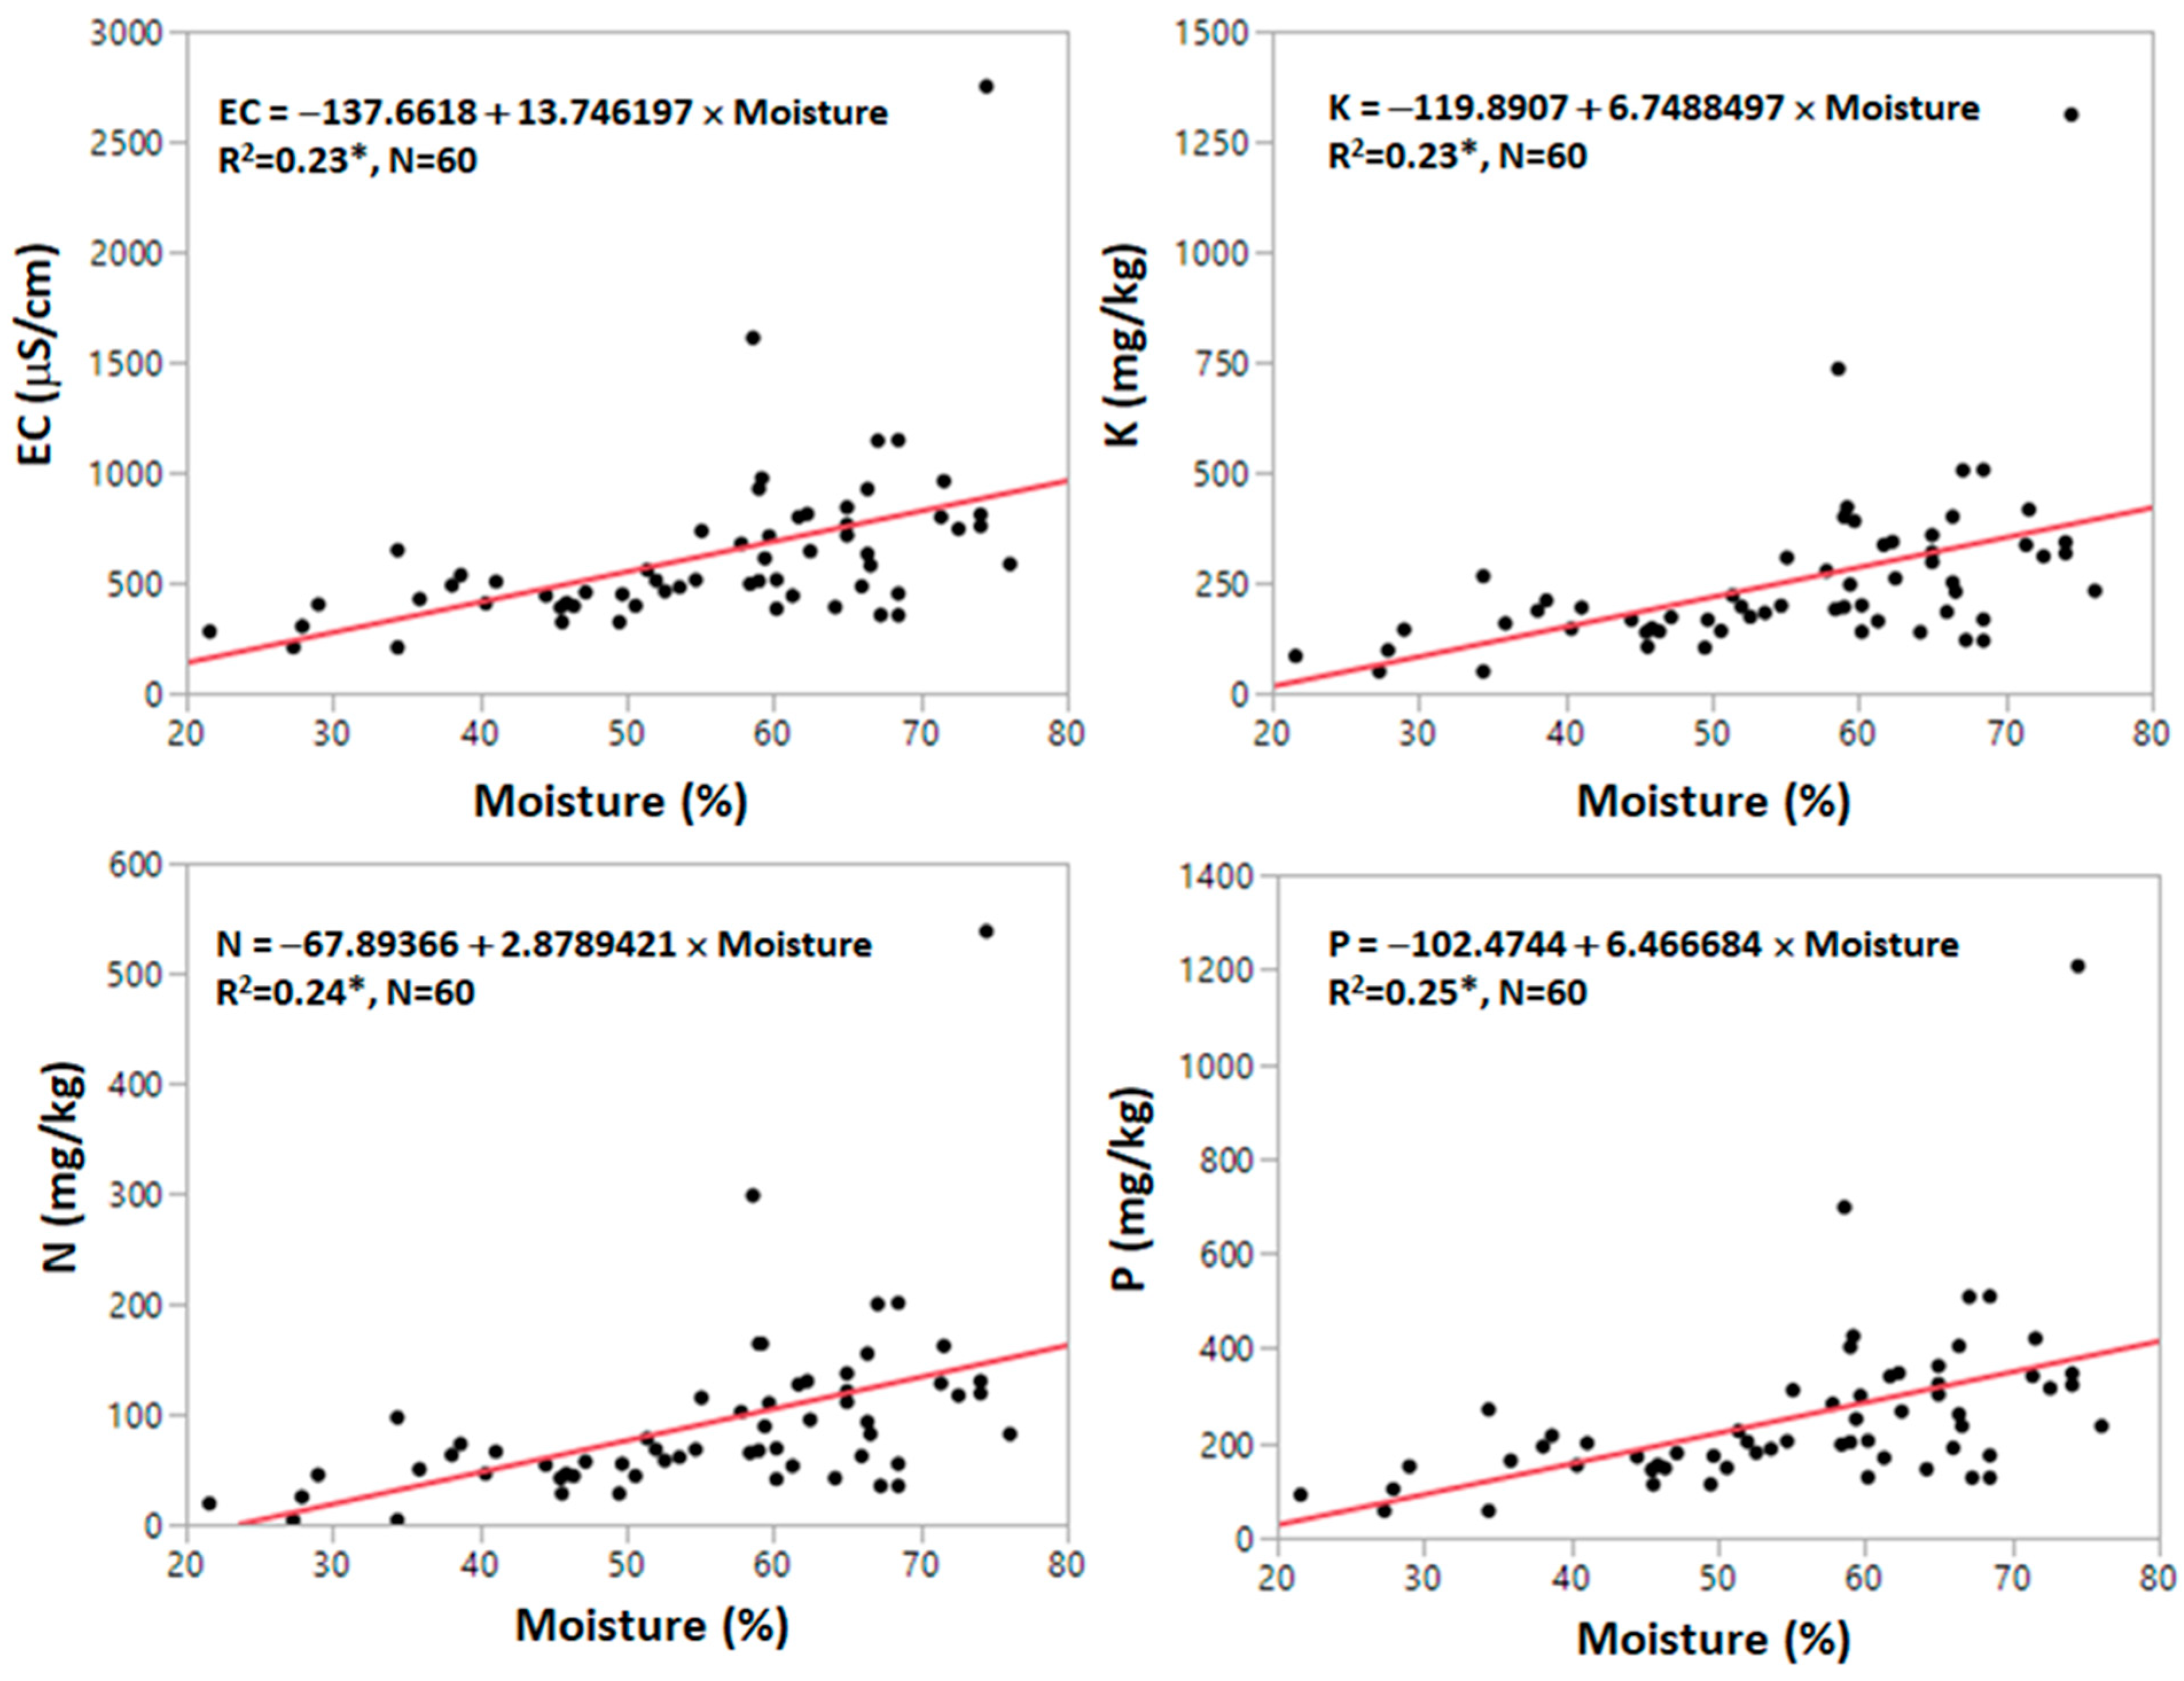
Figure 4 presents the relationship between the soil moisture content with soil pH, CEC, N, P, and K content. The moisture content is highly correlated with earth EC, N, P, and K contents, suggesting that the variations are controlled by soil moisture during measurement. The regression analysis indicated that the significance of variations in EC, N, P, and K contents was explained by the soil moisture content at an alpha of 0.05. There is a similar pattern in the data distribution. Thus, care should be taken when interpreting N, P, and K because that can be an error.
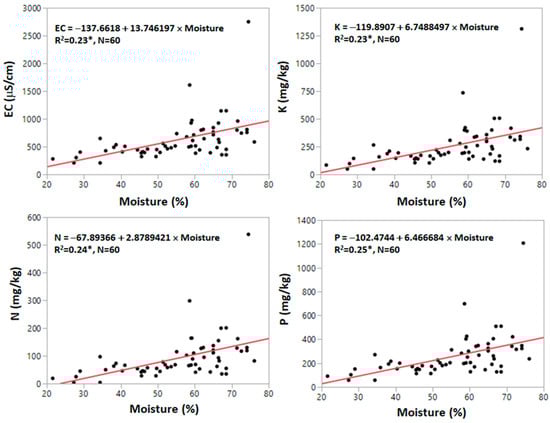
Figure 4.
The relationships between the water content and N, P, K, and EC, as measured by the portable soil nutrient detector, in the paddy field. Note: * means that the variation of the y-axis can be explained significantly by the formula at an alpha of 0.05.
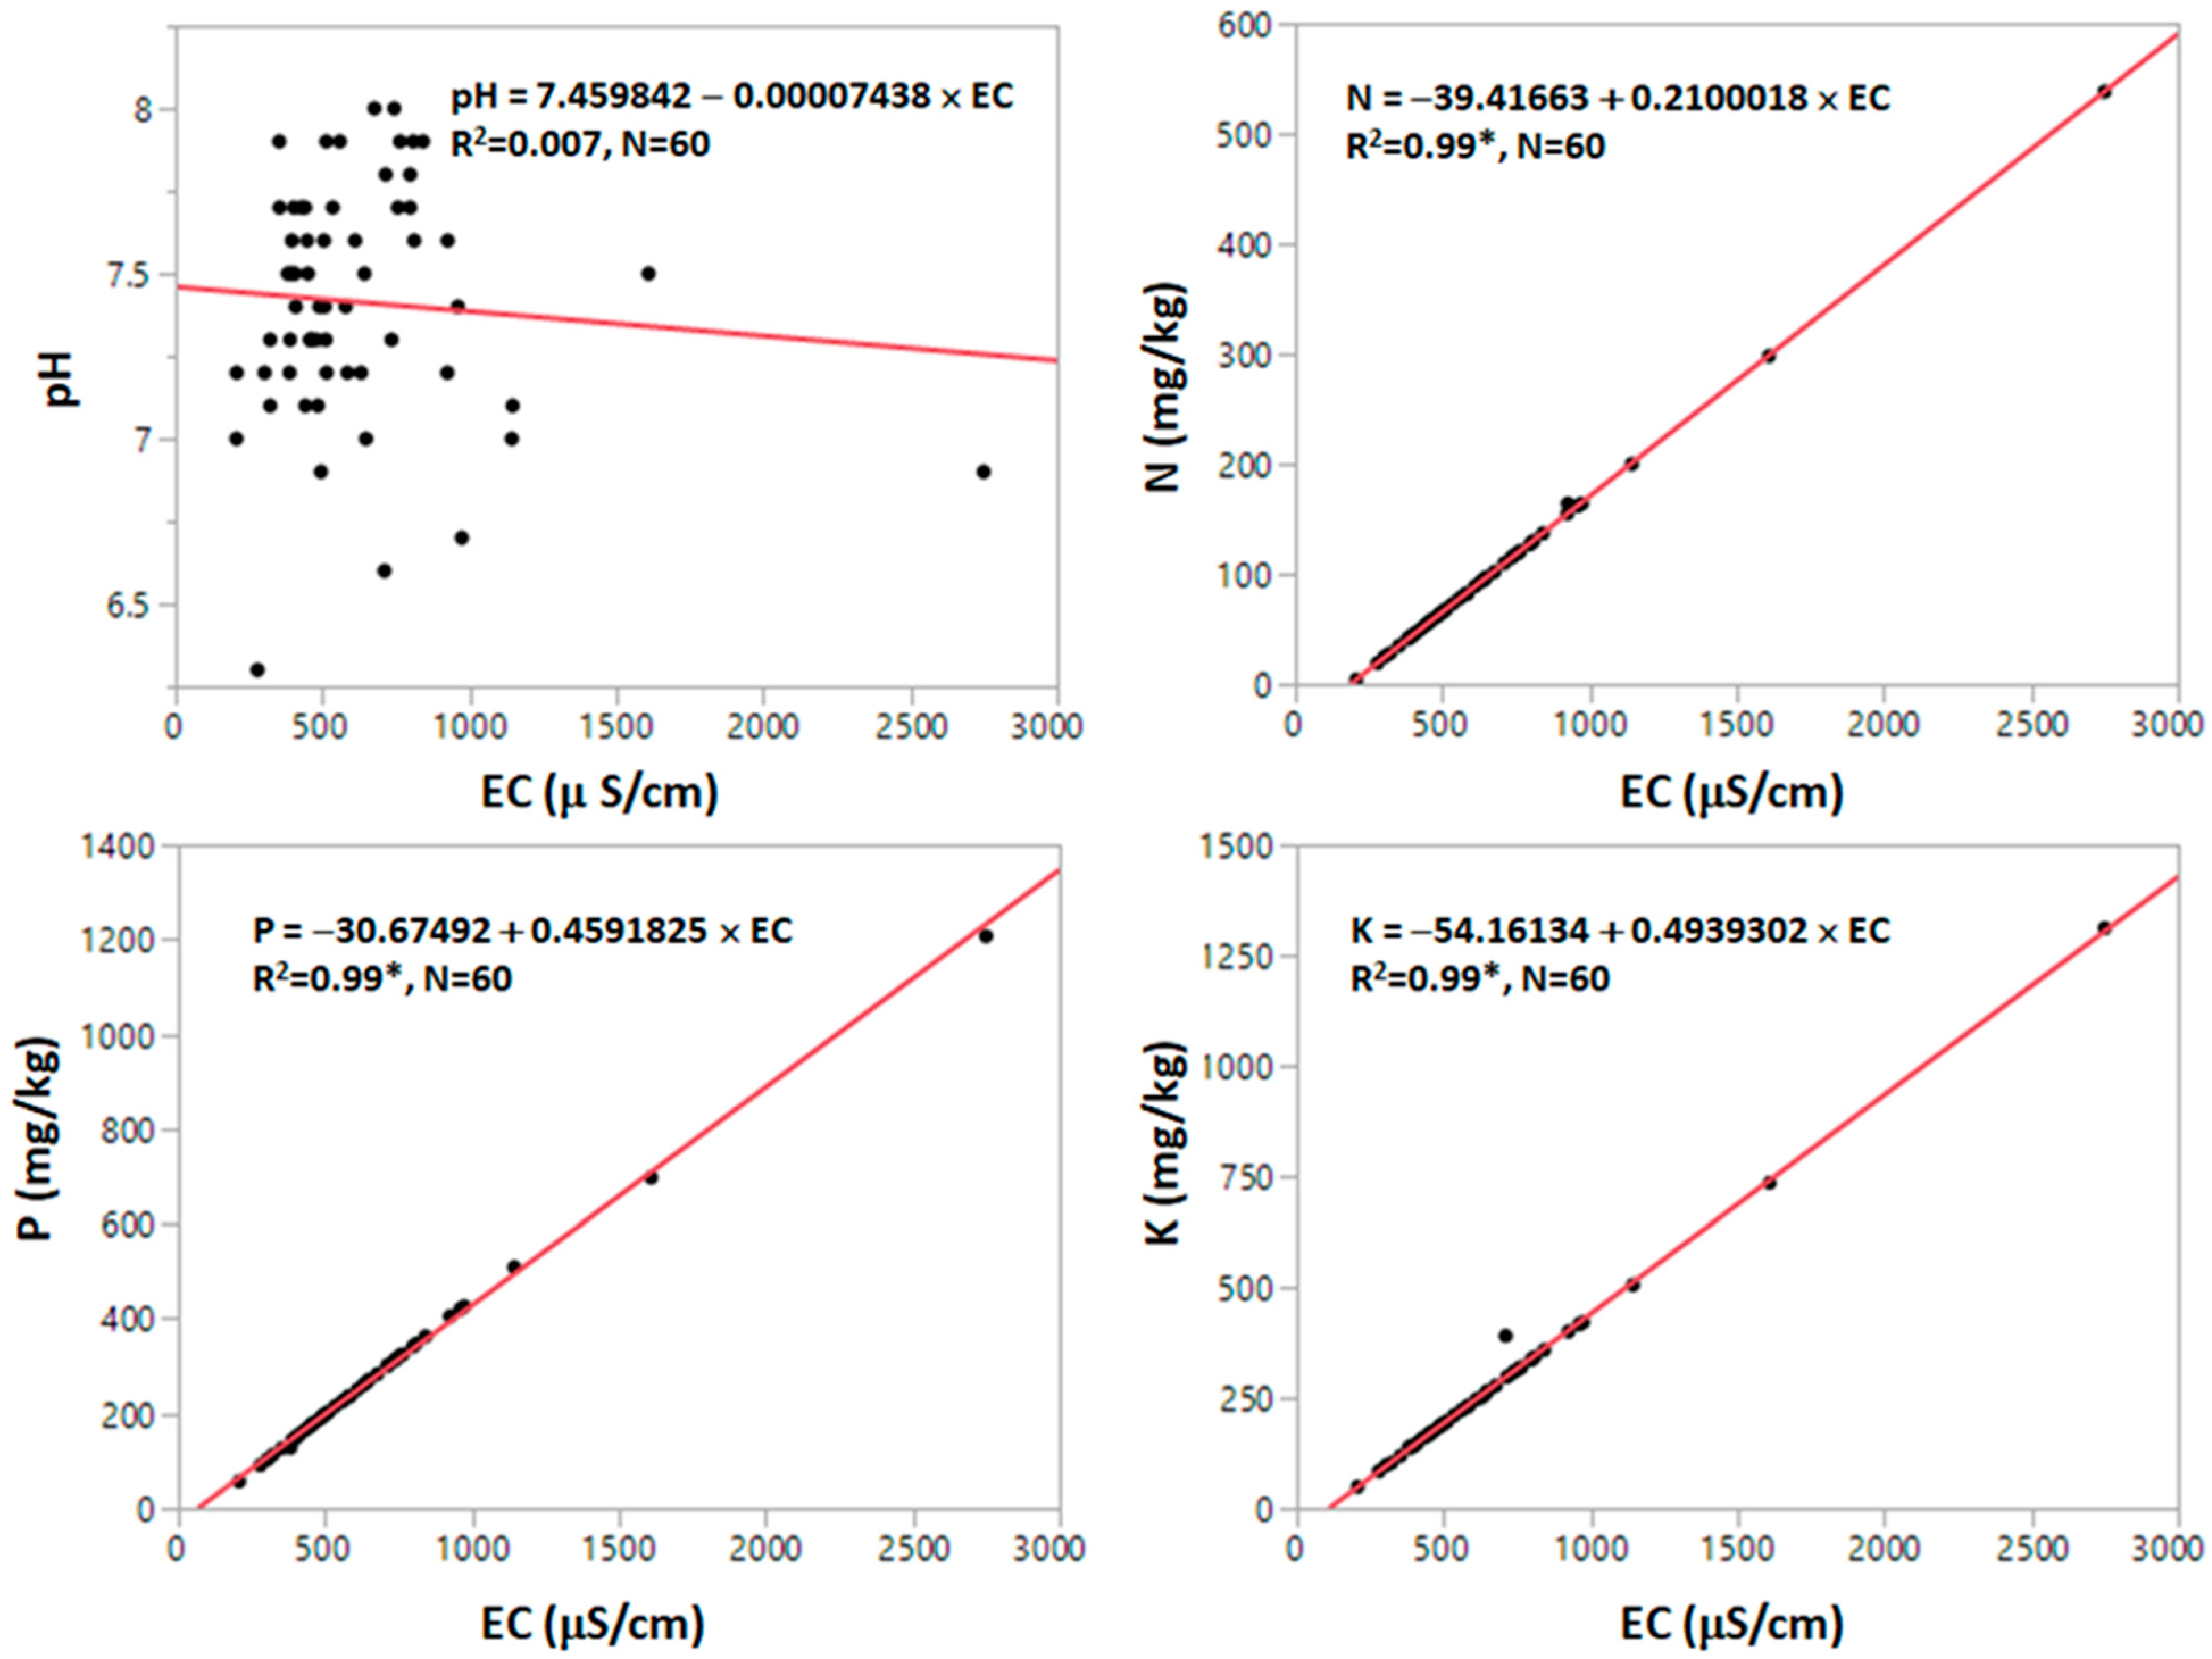
Figure 5 presents the relationships between EC and N, P, and K contents in the soil. A very close straight relationship exists between EC and soil N, P, and K nutrient contents, with each R2 = 0.99. These results align with research by Othaman et al. [20], who said that soil EC is directly proportional to the nutrient concentration. The relationships between EC and N, K, Ca, Mg, S, Na, Cl, Mn, and Zn are significant and real with Fe and Cu [21].
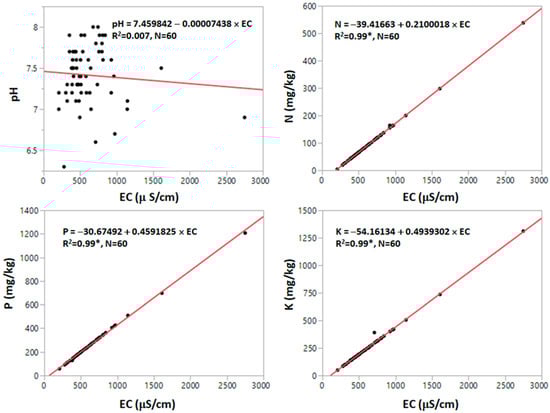
Figure 5.
The relationship between soil electrical conductivity with pH, N, P, and K nutrients, as measured by the portable soil nutrient detector in the paddy field. * Means that the variation of the y-axis can be explained significantly by the formula at an alpha of 0.05.
4. Discussion
4.1. Significance of the Soil Nutrient Detector and Transportability
Real-time measurement of soil nutrients evaluates the nutrient status and determines the fertilizer dose for optimum crop yield. In addition, real-time soil pH and EC measurements are crucial input data for improving soil quality. Accordingly, sensor-based tools have been developed in addition to soil test kits. In sensor technology, the measurement technique can be an optical sensor that measures soil properties by detecting the different frequencies of light reflectance in NIR, MIR, and polarized light spectra. Another technique could be a resistive sensor composed of two electrodes and a desired current and another technique. This capacitance sensor is used to develop a portable device in this study.
The advancement of soil sensor technology provides options for promptly measuring soil properties. As shown in this study, fast-growing companies that perform mass production also provide low-cost sensors for further tool development. The advancement of marketplace technology provides options for sensor users to opt for the best sensor for their needs, as the metadata area is provided in the marketplace on the company’s website.
4.2. Speed, Accuracy, and Cost-Effectiveness
One problem in measuring soil nutrients is the time duration for preparation and analysis in the soil laboratory, which is about one to two months for a given soil sample. As a result, fertilizer recommendation is always late relative to the crop growth phase. More time is needed to analyze the many samples. On the contrary, in this device, the soil nutrient content can be known right after sensors are inserted into the soil. The sensor simultaneously reports nutrient contents of N, P, K, and selected soil properties (pH, EC, moisture, and temperature). Hence, more soil information is obtained from many samples/sites over a certain period. Thus, this device works faster than the laboratory method and soil test kit procedure.
The device can inform on soil nutrient conditions as early as possible. Moreover, the device can be carried to the field and detect soil nutrients quickly and in many locations in a short time. Recommendations for soil improvement and fertilization can be immediately implemented, and plant growth can be improved. Soil test kits, the available field-based kit in Indonesia, also can be used in other locations. Still, information cannot be directly known, as filling a soil sample in the tube, adding reagents, mixing soil and reagent, and waiting for a reaction are needed before color comparisons. It is performed for each soil property. If many locations are to be determined, more time is needed. Hence, this device also works faster than a soil test kit.
Currently, soil data from a soil laboratory analysis are used as a reference. Determining the fertilizer rate uses a soil correlation and calibration study in a soil testing framework where all soil data are from laboratory analysis. The need for quick information urges field-based soil testing. In Indonesia, field-based soil test kits are used, but the information is categorical data and a subjective determination by comparing similar colors. Meanwhile, the portable soil nutrient sensor results in numeric data that are non-subjective; hence, it is easy to determine its accuracy with lab data. However, there is no study of an accuracy assessment, and so there is no basis for claiming which field-based tests are more accurate for laboratory analysis.
The portable soil nutrient sensor is cost-effective because of its low cost (about USD 300), but the soil test kit costs USD 80 with reagents for 50 samples and needs replenishing at USD 67 for another 50 samples. The cost will increase by the sample number, mainly by buying additional reagents. However, portable soil nutrient sensors do not require additional costs and can operate for many soil samples.
4.3. Factors Controlling the Sensor Reading
This research used five measurements for a given sample or location to obtain stable results. It takes one to two minutes to obtain stable data. Because every measurement uses different soil information, while soil properties are dynamic, replicating the measurement three to five times is recommended. The median value can then be used as a measurement result. Sensors are sensitive to changes in soil condition and moisture.
This study indicated that the soil moisture content and salt concentration (EC) control sensor readings. The moisture content is a crucial factor for operationalizing the detector. Accordingly, the measurement should be performed in a specific moisture content range. The detector also measures the moisture content, and for this purpose, the reading should be conducted after the moisture reading stabilizes and is in the acceptable range. As indicated by Figure 4, nutrient readings for N, P, K, and EC values are higher if moisture increases.
During the field test, the moisture range had a reasonable 22 to 78% for readings. Hence, it is suggested that the reading is in this range for paddy soils. Measurement at a moisture content lower than 20% or more than 78% shows illogical results. The ideal figure ranges from 40 to 50%.
Figure 4 also indicated high EC, N, P, and K values in two locations. This location is saline soil. The paddy fields in the coastal area of Karawang Regency are influenced by seawater (higher salinity). However, rice cultivation in the rainy season and the addition of irrigated water from The Jatiluhur Reservoir reduce soil salinity and provide good soil for rice growth. Nevertheless, there is no irrigation water in the dry season and the salt concentration increases, resulting in a high EC. Thus, it is suggested that more studies be conducted on using the detector readings in high soil salinity levels. For example, several areas of rice production centers are influenced by seawater intrusion, as found in the northern plain area of Java from Banten to Semarang, and the southern plain area from Pangandaran to Bantul (Yogyakarta).
Soil texture also controls the soil sensor reading. Sandy soil shows a low moisture content and very low value. Meanwhile, heavy clay soils show a high moisture content and high reading. Java paddy fields in this study show 20 to 80% soil moisture and field testing in the pre-rice planting stage. Water in the soil is the main key for analysis using sensors, including being a reaction medium for nutrients in the soil and making it easier for the sensor to be inserted into the soil.
The soil organic matter content also may interfere with sensor readings. Soil organic carbon controls the soil moisture content, whereas soil with a higher organic matter content retains more moisture. Considering the soil color during field testing, the soil organic matter content is low and has little effect on the sensor reading. However, the content of soil organic matter should be considered when evaluating sensor reading results.
4.4. Practical Implications and Device Limitation
Our portable soil nutrient detector offers other field tools for determining soil properties and the nutrient status, especially in Indonesia, besides soil test kits, EC meters, and pH meters. The soil nutrient detector combines all established facilities, namely determining soil temperature and soil moisture content, measuring soil pH and EC, and measuring N, P, and K contents in the soils. Hence, one measurement can determine seven soil properties, reducing the cost of buying previous tools. Moreover, other facilities not available in the existing ones are the ability to determine fertilizer rates for rice, maize, soybean, green bean, and sweet potato.
The detector does not use reagents and the colorimetric technique compared to soil test kits. Following national regulations for transferring liquids and chemical materials in air transportation, sending reagents to other areas is prohibited. Indonesia is an archipelago country that relies upon air transportation, limiting the use of soil test kits. Nevertheless, the detector can be easily sent and brought to other areas by air transportation.
Using a soil test kit needs extra work and time for mixing, stirring, and waiting for reagents to react with the soil. It becomes impractical if there are too many samples. The detector uses a short time; results arise in seconds. Many samples can be accomplished in a shorter time. Agricultural land for food crops can be immediately improved by providing ameliorant materials and appropriate fertilizer recommendations. On good-quality land, fertilization becomes more effective and efficient.
Water is the most important part of the reactions in the soil, and the soil water content is very significantly related to EC [22]. In Lateritic soil, increasing the water content and soil temperature can affect an increasing soil EC [23]. The soil water content influences soil anaerobic conditions and the forms of N (NO3− and NH4+) in the soil; it was further stated that EC could detect changes in the soil N status quickly [24]. The soil temperature and water content affect N mineralization, where the water content has a lower influence than temperature [25].
However, this portable soil nutrient detector can only be used for paddy soils that are saturated periodically. Due to soil moisture limitations, the device may not work for upland soils or show very low readings. Meanwhile, the device has advanced functionality to provide fertilizer rate recommendations for rice, maize, soybean, mungbean, and sweet potato as a default. Additional coding is required if other crops are to be included, namely, crops commonly planted in paddy soils or wet soils.
4.5. Future Research Directions
Our research results in a soil nutrient detector being tested in the paddy soils. The next study is to test it in upland soils and wetland soils. The moisture level controls the variation of the soil nutrient content. Our results suggested that a 30 to 70% moisture level is good for measuring soil nutrients in paddy fields. The moisture ranges should also be specified for dryland soils and wetland soils. In Indonesia, dry soils vary depending on the rainfall regime, soil texture, and parent materials. Hence, for dry soil material, testing should be performed on soils developing from felsic sedimentary rock, mafic sedimentary rock, volcanic rocks, and alluvial rock.
The next work for the established portable soil nutrient detector is a calibration study to evaluate the relationship between sensor readings and the soil laboratory analysis. Sensor calibration was conducted using different procedures, depending on the objective. For example, Polyakov et al. [26], Stroobosscher et al. [27], and Bhuiyan et al. [28] developed specific sensor calibration procedures. In these works, the accuracy was measured using goodness of fit (R-squared), mean bias error, root mean square error, and index of agreement.
However, the objective of this calibration study is to observe relationship patterns and to calculate correction patterns. This sensor reading and laboratory procedure have different work bases; the sensor works on a fresh soil and volume base, while the laboratory method works on air-dried fine soil and weight bases. Soil properties are determined in the field soils using the detector, and then the soil sample is taken, and its soil properties are measured following a laboratory procedure. The accuracy assessment is determined using multiple measures: R-square, mean bias error, root mean square error, and index of agreement. Through this calibration study, a correction factor and relationship models also can be determined. Using sensor readings, one can use this correction factor and model to predict laboratory results. However, this prediction is subject to error, depending upon the model’s goodness of fit or other model performance measures.
5. Conclusions
Real-time soil nutrient information is required for precision farming. This study designed and developed portable soil detectors to assist in rapid, real-time measurements in the field. This device can determine the main soil nutrients (N, P, and K) and other soil properties, controlling the efficiency of soil nutrient management (soil temperature, soil moisture, pH, and EC). Field testing indicated that the soil moisture content controlled the measurement results, where moisture at 30 to 70% is optimal for field measurement. The device performs well and comes with a light, good package. More field testing and calibration studies are needed in the future.
Author Contributions
Conceptualization, Y.S.; methodology, Y.S. and A.K.; software, E.S.; validation, Y.S., A.K. and N.S.; formal analysis, Y.S.; investigation, Y.S. and A.K.; resources, Y.S. and A.K.; data curation, E.S.; writing—original draft preparation, Y.S. and A.K.; writing—review and editing, Y.S., A.K., E.S., N.S. and R.D.P.; visualization, Y.S.; supervision, Y.S. and R.D.P.; project administration, Y.S.; funding acquisition, Y.S. and R.D.P. All authors have read and agreed to the published version of the manuscript.
Funding
This research was funded by National Research and Innovation Agency (BRIN): 9/III.11/HK/2023 (E.RPBU. JRC:TBPB no. 4). The APC was funded by BRIN.
Data Availability Statement
Data are available from the corresponding author upon reasonable request.
Acknowledgments
The authors thank Sri Yuliani from the Center for Agricultural Extension, Indonesian Ministry of Agriculture, for supporting the field study.
Conflicts of Interest
The authors declare no conflicts of interest. The funders had no role in the design of the study; in the collection, analyses, or interpretation of data; in the writing of the manuscript; or in the decision to publish the results.
References
- Paiman; Ardiyanta; Kusumastuti, C.T.; Gunawan, S.; Ardiani, F. Maximizing the Rice Yield (Oryza sativa L.) Using NPK Fertilizer. Open Agric. J. 2021, 15, 33–38. [Google Scholar] [CrossRef]
- Ahmed, W.; Liu, K.; Qaswar, M.; Huang, J.; Huang, Q.; Xu, Y.; Ali, S.; Mehmood, S.; Ammar Asghar, R.M.; Mahmood, M.; et al. Long-Term Mineral Fertilization Improved the Grain Yield and Phosphorus Use Efficiency by Changing Soil P Fractions in Ferralic Cambisol. Agronomy 2019, 9, 784. [Google Scholar] [CrossRef]
- Gewaily, E.E.; Ghoneim, A.M.; Elhabet, H.B.I. Effect of Soil Fertilization on Sakha 105 Rice Cultivar Productivity, NPK Uptake and Soil Nutrient. J. Soil Sci. Agric. Eng. 2018, 9, 253–259. [Google Scholar] [CrossRef]
- Chen, Y.; Hu, S.; Guo, Z.; Cui, T.; Zhang, L.; Lu, C.; Yu, Y.; Luo, Z.; Fu, H.; Jin, Y. Effect of Balanced Nutrient Fertilizer: A Case Study in Pinggu District, Beijing, China. Sci. Total Environ. 2021, 754, 142069. [Google Scholar] [CrossRef] [PubMed]
- Hossain, M.A.; Siddique, M.N.A. Online Fertilizer Recommendation System (OFRS): A Step Towards Precision Agriculture and Optimized Fertilizer Usage by Smallholder Farmers in Bangladesh: Online Fertilizer Recommendation. Eur. J. Environ. Earth Sci. 2020, 1, 1–9. [Google Scholar] [CrossRef]
- Hilalullaily, R.; Kusnadi, N.; Rachmina, D. Analisis Efisiensi Usahatani Padi Di Jawa Dan Luar Jawa, Kajian Prospek Peningkatan Produksi Padi Nasional. J. Agribisnis Indones. 2021, 9, 143–153. [Google Scholar] [CrossRef]
- Wibowo, H.; Kasno, A. Soil Organic Carbon and Total Nitrogen Dynamics in Paddy Soils on the Java Island, Indonesia. IOP Conf. Ser. Earth Environ. Sci. 2021, 648, 012192. [Google Scholar] [CrossRef]
- Widowati, L.R.; Sasmita, P.; Setyorini, D.; Jamil, A. Status of Soil Organic Carbon and Its Management Recommendation for Rice Plants at Four Experiment Stations of the Indonesian Centre for Rice Research. IOP Conf. Ser. Earth Environ. Sci. 2021, 648, 012060. [Google Scholar] [CrossRef]
- Kasno, A. Kearifan Lokal Sebagai Upaya Peningkatan Produktivitas Tanah Dan Tanaman. In Proceedings of the Prosiding Konser Karya Ilmiah Nasional “Peluang dan Tantangan Pembangunan Pertanian Berkelanjutan di era Globad an Digital”, Semarang, Indonesia, 13 September 2018; Fakultas Pertanian dan Bisnis UKSW: Semarang, Indonesia, 2018; pp. 93–104. [Google Scholar]
- Agrahari, R.K.; Kobayashi, Y.; Tanaka, T.S.T.; Panda, S.K.; Koyama, H. Smart Fertilizer Management: The Progress of Imaging Technologies and Possible Implementation of Plant Biomarkers in Agriculture. Soil Sci. Plant Nutr. 2021, 67, 248–258. [Google Scholar] [CrossRef]
- Kasno, A.; Widowati, L.R. Penyusunan Soil Test Kit Untuk Penetapan Kadar Hara Anah Sawah Di Lapang; Balai Penelitian Tanah: Bogor, Indonesia, 2004. [Google Scholar]
- Kashyap, B.; Kumar, R. Sensing Methodologies in Agriculture for Soil Moisture and Nutrient Monitoring. IEEE Access 2021, 9, 14095–14121. [Google Scholar] [CrossRef]
- Yin, H.; Cao, Y.; Marelli, B.; Zeng, X.; Mason, A.J.; Cao, C. Soil Sensors and Plant Wearables for Smart and Precision Agriculture. Adv. Mater. 2021, 33, 2007764. [Google Scholar] [CrossRef]
- Ng, W.; Husnain; Anggria, L.; Siregar, A.F.; Hartatik, W.; Sulaeman, Y.; Jones, E.; Minasny, B. Developing a Soil Spectral Library Using a Low-Cost NIR Spectrometer for Precision Fertilization in Indonesia. Geoderma Reg. 2020, 22, e00319. [Google Scholar] [CrossRef]
- Viscarra Rossel, R.A.; Adamchuk, V.I.; Sudduth, K.A.; McKenzie, N.J.; Lobsey, C. Proximal Soil Sensing: An Effective Approach for Soil Measurements in Space and Time. Adv. Agron. 2011, 113, 243–291. [Google Scholar] [CrossRef]
- Lavanya, G.; Rani, C.; Ganeshkumar, P. An Automated Low Cost IoT Based Fertilizer Intimation System for Smart Agriculture. Sustain. Comput. Inform. Syst. 2020, 28, 100300. [Google Scholar] [CrossRef]
- CWT Co. CWT Soil Sensor (NPK Type) Manual, Version: V1.4.; ComWinTop (CWT): Shenzen, China, 2023.
- Husnain; Kasno, A.; Rochayati, S. Pengelolaan Hara Dan Teknologi Pemupukan Mendukung Swasembada Pangan Di Indonesia. J. Sumberd. Lahan 2016, 10, 25–36. [Google Scholar]
- SAS Institute Inc. JMP, Pro 14.3; SAS Institute Inc.: Cary, NC, USA, 2018.
- Othaman, N.N.C.; Isa, M.N.M.; Ismail, R.C.; Ahmad, M.I.; Hui, C.K. Factors That Affect Soil Electrical Conductivity (EC) Based System for Smart Farming Application. AIP Conf. Proc. 2020, 2203, 020055. [Google Scholar] [CrossRef]
- Huang, L.; Liu, X.; Wang, Z.; Liang, Z.; Wang, M.; Liu, M.; Suarez, D.L. Interactive Effects of pH, EC and Nitrogen on Yields and Nutrient Absorption of Rice (Oryza sativa L.). Agric. Water Manag. 2017, 194, 48–57. [Google Scholar] [CrossRef]
- Ratshiedana, P.E.; Abd Elbasit, M.A.M.; Adam, E.; Chirima, J.G.; Liu, G.; Economon, E.B. Determination of Soil Electrical Conductivity and Moisture on Different Soil Layers Using Electromagnetic Techniques in Irrigated Arid Environments in South Africa. Water 2023, 15, 1911. [Google Scholar] [CrossRef]
- Bai, W.; Kong, L.; Guo, A. Effects of Physical Properties on Electrical Conductivity of Compacted Lateritic Soil. J. Rock Mech. Geotech. Eng. 2013, 5, 406–411. [Google Scholar] [CrossRef]
- Zhang, R.; Wienhold, B.J. The Effect of Soil Moisture on Mineral Nitrogen, Soil Electrical Conductivity, and pH. Nutr. Cycl. Agroecosystems 2002, 63, 251–254. [Google Scholar] [CrossRef]
- Guntiñas, M.E.; Leirós, M.C.; Trasar-Cepeda, C.; Gil-Sotres, F. Effects of Moisture and Temperature on Net Soil Nitrogen Mineralization: A Laboratory Study. Eur. J. Soil Biol. 2012, 48, 73–80. [Google Scholar] [CrossRef]
- Polyakov, V.; Fares, A.; Ryder, M.H. Calibration of a Capacitance System for Measuring Water Content of Tropical Soil. Vadose Zone J. 2005, 4, 1004–1010. [Google Scholar] [CrossRef]
- Stroobosscher, Z.J.; Athelly, A.; Guzmán, S.M. Assessing Capacitance Soil Moisture Sensor Probes’ Ability to Sense Nitrogen, Phosphorus, and Potassium Using Volumetric Ion Content. Front. Agron. 2024, 6, 1346946. [Google Scholar] [CrossRef]
- Bhuiyan, M.Z.I.; Wang, S.; Carter, J.; Raka, T.M. Calibration and Assessment of Capacitance-Based Soil Moisture Sensors. In Proceedings of the Geo-Congress 2020, Minneapolis, MN, USA, 25–28 February 2020; American Society of Civil Engineers: Minneapolis, MN, USA, 2020; pp. 754–766. [Google Scholar]

Disclaimer/Publisher’s Note: The statements, opinions and data contained in all publications are solely those of the individual author(s) and contributor(s) and not of MDPI and/or the editor(s). MDPI and/or the editor(s) disclaim responsibility for any injury to people or property resulting from any ideas, methods, instructions or products referred to in the content. |
© 2024 by the authors. Licensee MDPI, Basel, Switzerland. This article is an open access article distributed under the terms and conditions of the Creative Commons Attribution (CC BY) license (https://creativecommons.org/licenses/by/4.0/).