Article

Kinetics and Nanoparticle Catalytic Enhancement of Biogas Production from Wastewater Using a Magnetized Biochemical Methane Potential (MBMP) System

by
Emmanuel Kweinor Tetteh
* and
Sudesh Rathilal
Green Engineering and Sustainability Research Group, Department of Chemical Engineering, Faculty of Engineering and the Built Environment, Durban University of Technology, Steve Biko Campus, 70 Mansfield Road, Berea Durban, 4001, South Africa
*
Author to whom correspondence should be addressed.
Catalysts 2020, 10(10), 1200; https://doi.org/10.3390/catal10101200
Submission received: 21 September 2020 / Revised: 3 October 2020 / Accepted: 10 October 2020 / Published: 16 October 2020

Abstract

:
This study presents magnetized nanoparticles (NPs) as a catalyst to accelerate anaerobic digestion (AD) potential for clean and ecofriendly energy (biogas) from wastewater settings. The effects of iron oxides (Ms) and aluminum sulphate (Alum) were investigated using two chronological experiments: (i) the Jar test technique to generate residue slurry as organic fertilizer potential and (ii) a magnetized biochemical methane potential (MBMP) system for biogas production at mesophilic conditions for 21 days. X-ray diffraction and Fourier Transform Infrared spectroscopy were carried out to establish the Ms Crystallite and active functional groups respectively. Scanning electronic microscopy coupled with energy dispersive X-ray spectrometer and elemental analysis were used to track and confirm NPs inclusion after the post-AD process. Coagulation at 50 mg/L and magnetic exposure time of 30 min showed above 85% treatability performance by Ms as compared to 70% for Alum. Owing to the slow kinetics of the AD process, additional NPs content in the digesters coupled with an external magnetic field improved their performance. Cumulative biogas yields of 1460 mL/d > 610 mL/d > 505 mL/d for Ms > Control > Alum respectively representing 80% > 61% > 52% of CH4 were attained. The modified Gompertz model shows that the presence of NPs shortens the lag phase of the control system with kinetics rate constants of 0.285 1/d (control) to 0.127 1/d (Ms) < 0.195 1/d (Alum).

Graphical Abstract

1. Introduction

With the global concern about freshwater resources depletion, the purification of water and wastewater comes in handy to meet the necessities of humankind and other living organisms. This has sparked significant interest in developing wastewater treatment technologies worldwide, owing to the rapid industrialization and environmental pollution accompanying it [1,2,3,4]. The swift utilization of nanomaterials (like coagulants, nanotubes, nanowires, metals) and generation of a huge amount of pollutants such as heavy metals in the wastewater setting cannot be excluded from this industrial evolution [5,6,7]. However, recovery of valuable products such as energy from wastewater and landfills is gaining much attention through worldwide application of the anaerobic digestion (AD) process [3,4,8]. Owing to the increasing rate of municipality solid wastes and biosolids, the AD process has been one of the cost-effective technologies for biomass conversion to biogas and degradation of high strength organic waste [4]. In spite of managing zero-waste, recovering valuable potentials from wastewater as a renewable energy source (biogas) has attracted considerable attention, aimed at achieving green energy, clean water and sanitation towards the United Nations sustainable development goals for the year 2030 [9].
Recent advancing technologies such as membrane filtration, ion exchange, magnetic coagulation, adsorption and advanced oxidation processes are emerging to eliminate the contaminants from the wastewater before discharging to the water bodies [4,7,10]. In response, nanotechnology has drawn the attention of many researchers for biotechnological, pharmacological and separation applications [6,10,11]. However, there is limited information on its application in bioenergy from biomass [4,12], and wastewater treatment plants (WWTPs) [6,11]. This has raised global environmental concern of antibacterial resistance and inhibition effects of nanoparticles (NPs) in wastewater settings, especially with the biological systems [13]. Furthermore, the use of fossil fuels poses negative impacts on the environment, contributing to global warming [4,12,14], whereby the need for alternative and renewable sources of energy have become a global concern [14,15,16].
Biogas (methane and carbon dioxide), which is produced biologically in an oxygen-depleted environment during anaerobic digestion (AD) of organic materials, seems very promising [4,16]. In wastewater settings, biogas is considered as the by-products of AD of sewage sludge treated for the reduction of odorants, eutrophics, and landfill residues [16]. Apart from industrial wastewater and that from slaughterhouses and municipalities, biogas can also be produced from high strength organic wastes including water hyacinth, cow dung, poultry litter and breweries, anaerobically [4,17,18,19]. However, there is still ongoing debate about the use of aluminum and iron-based coagulants, and their safety and toxicity towards biological systems [6,20]. Thus, there is a high possibility of the accumulated nanomaterials to affect the treatability performance of the downstream process and to incur costs of landfill disposal [20,21], notwithstanding the occurrence and transportation routes (Figure 1) of emerging contaminants (nanoplastics, pharmaceuticals, antibiotics) ending up in the WWTP [7,8,16]. These undergo a series of transformations through the different unit operations from physical, chemical to biological treatment processes [4]. Similarly, in the AD process, different domains of microorganisms contribute to the degradation of organic compounds into biogas in sequential steps including hydrolysis, acidogenesis, acetogenesis and methanogenesis [16,17].
As a known fact in wastewater settings, there is a high probability of NPs trapped in sludge to be toxic and inhibitory to microbial organisms during biogas production [4,14,22]. A possible way to overcome this problem is to use carrier materials that can provide large surface areas for microbial growth [23,24]. Brar et al. [23] demonstrated that iron-rich primary sludge increased biogas production in wastewater sludge as compared to iron-poor sludge. On the contrary, the limited effect and pathway of Fe3+- and Al3+-based coagulants on biogas production is not well known [22,23,25]. Therefore, this study aimed to examine the magnetic effect on coagulation using magnetic-based coagulants (Ferro magnetite (Ms) and Alum), and also their coagulated sludge effect on biogas production by the magnetized biochemical methane potential (MBMP) system. In addition, modified Gompertz and first-order Kinetic models of biogas production were compared. This was carried out to improve the AD process, bioenergy, and sludge stability as well as heavy metals removal from wastewater settings.

2. Results

This study investigated coagulation and anaerobic digestion of wastewater as a means to facilitate integration of physiochemical and biological treatment processes with benefits of biogas production and reduction of landfills complexity. The results obtained are presented under Section 2.2 and Section 2.3 for coagulated sludge production and BMP respectively, whereas a detailed discussion is presented in Section 3.

2.1. Characterised Ms

The crystalline structure of the Ms is characterized by XRD, with distinctive diffraction peaks as shown in Figure 2. The X-ray diffraction analysis (Figure 2) revealed Ms as the principal dominating component with other phases of hematite (H) and wustite (W). The iron oxide (Ms > H > W) phases identified are in agreement with the reference line pattern of JCPDS file No. 19-0629 [5,6]. Their respective peaks–signal index and interlinear (hkl) spacing values are presented in Table 1. The peaks identified (Figure 2) were furthermore analyzed by Fourier Transform Infrared (FTIR) spectroscopy to understand how the Ms interacted with the active functional groups. In Figure 3, even though the FTIR was evaluated within a range of 400–4000 cm−1, the disappearing region represents amines and other radical groups which were bonded to the Ms and sludge surface (Figure 2). In addition, Ms in water could cause water-splitting with more negatively charged ions, resulting in excessive OH groups appearing on the surface of the nanoparticles [6,24,26].

2.2. Coagulated Sludge Production

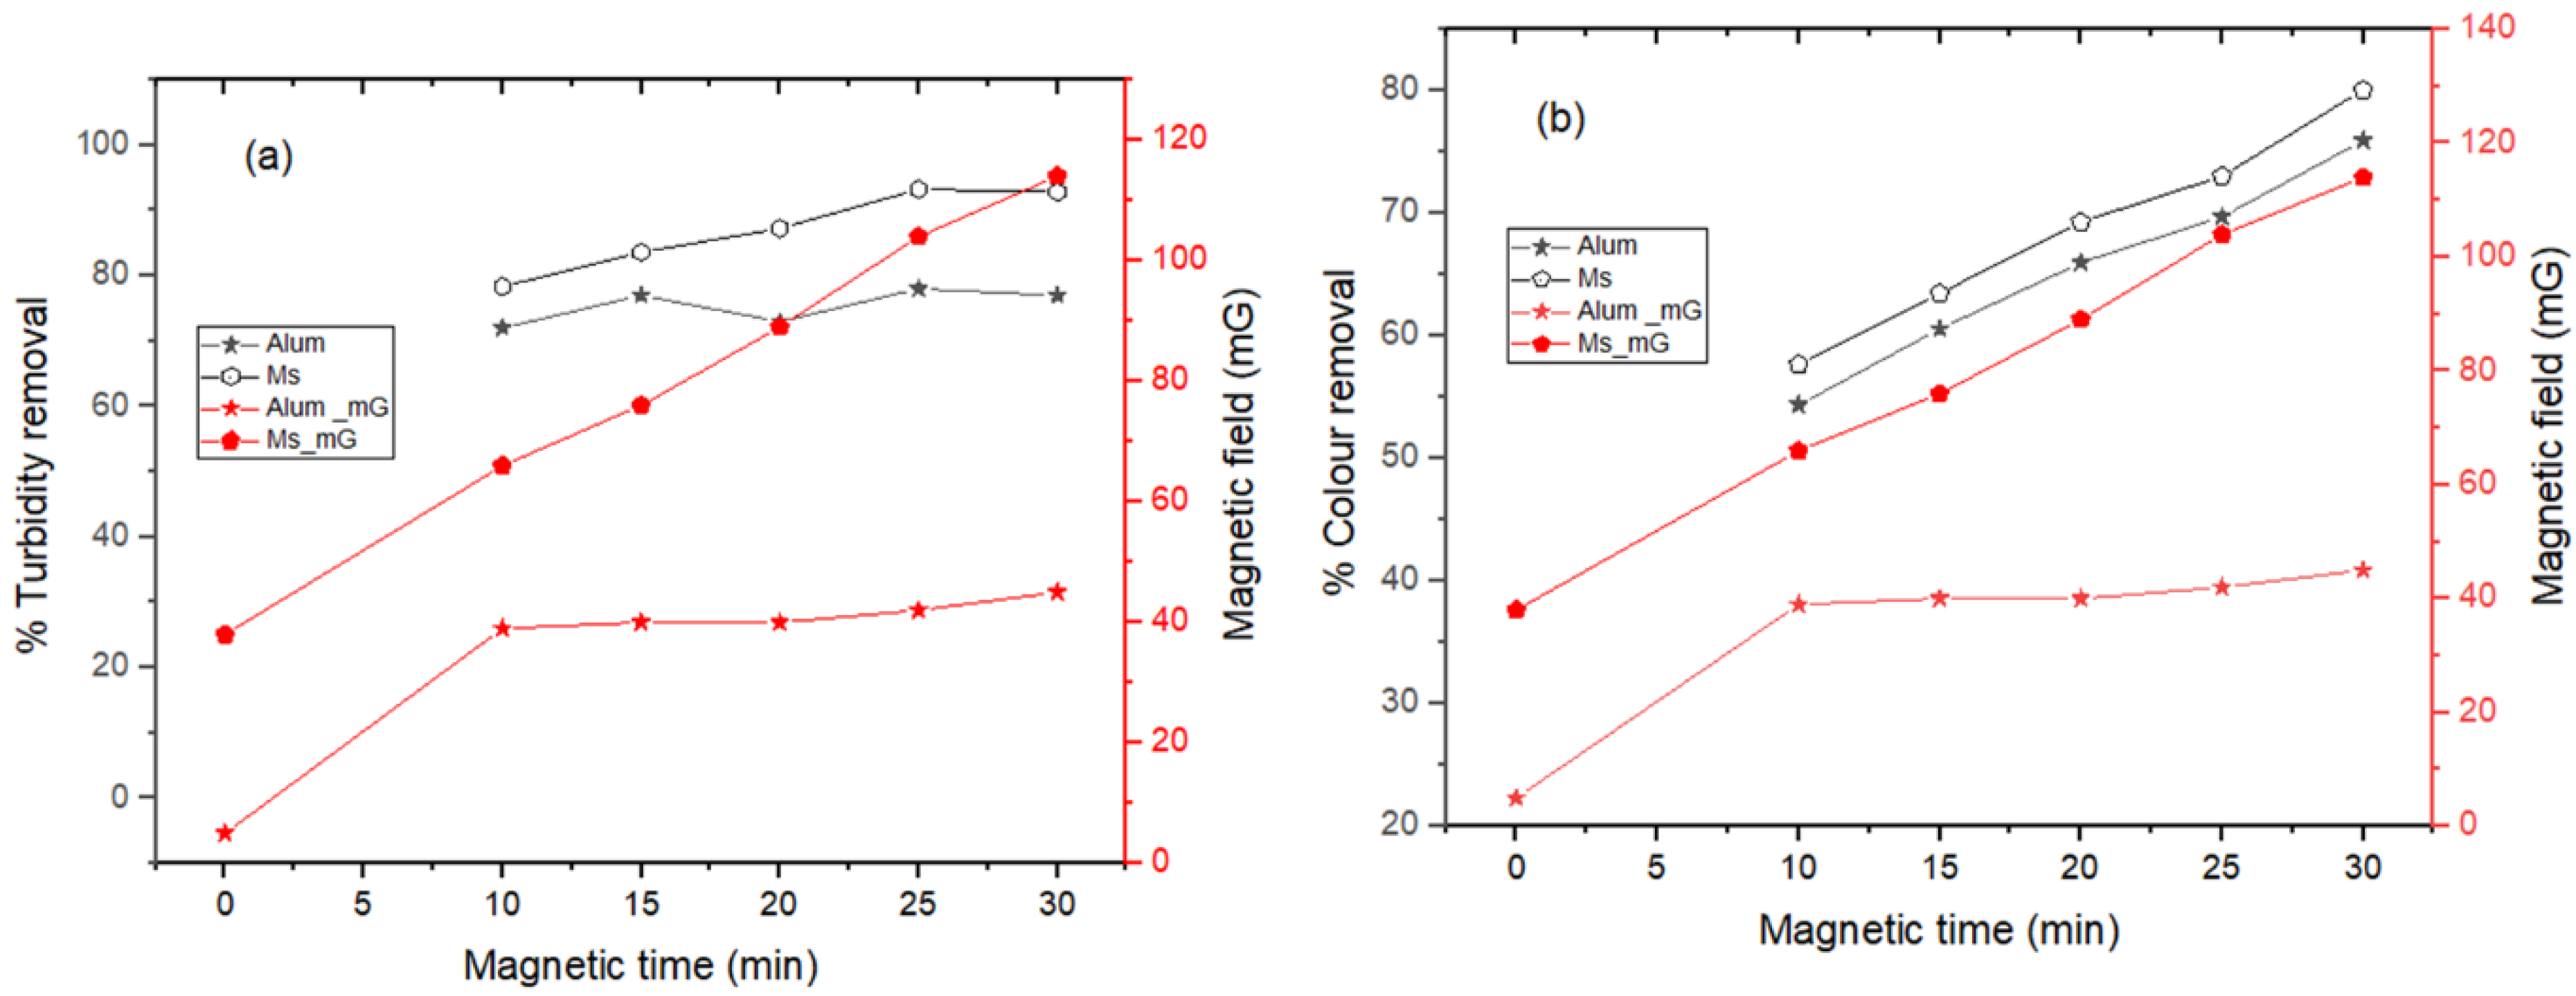
The wastewater sample collected from a local South Africa Sugar refinery industry was firstly coagulated with the coagulants (Alum and Ms). This was carried out at a pH of 6.8 to investigate the effect of coagulant dosage (10–60 mg/L) and magnetic field time exposure (10–30 min) for the removal of color and turbidity. Figure 4 presents the effect of coagulant dosage for the removal of (a) turbidity and (b) color from the wastewater. Likewise, Figure 5 shows the effect of magnetic field exposure on the coagulation process. However, no removal of the contaminant was observed without the addition of the coagulant (Ms and Alum). Summarized results on the coagulation process are presented in Table 2. It was deduced that the longer the magnetic time (30 min) and optimal coagulant dosage (50 mg/L) with high supermagnetic strength, the better the pollutant removal. The subsequent experiment was carried out using the coagulated sludge, spiked with the pure activated sludge (inoculum) towards the biogas production (Section 2.3).

2.3. Biochemical Methane Potential (BMP)

The results for the nanoparticles and magnetic field effects on biodegradability carried out by the BMP test for biogas and methane production are presented in Section 2.3.1. The scanning electron microscopy (SEM)/energy dispersive X-ray spectrometer (EDS) results (Section 2.3.2) present the morphology and elemental composition of the digester sludge after conducting the experiments with Alum (A), Ms (B) and control (C). The kinetics were carried out to make understanding the mechanism of degradation and synergetic interactions of the nanoparticles enhancing the anaerobic chain reaction for the biogas production easier (Section 2.3.3).

2.3.1. Biogas Production

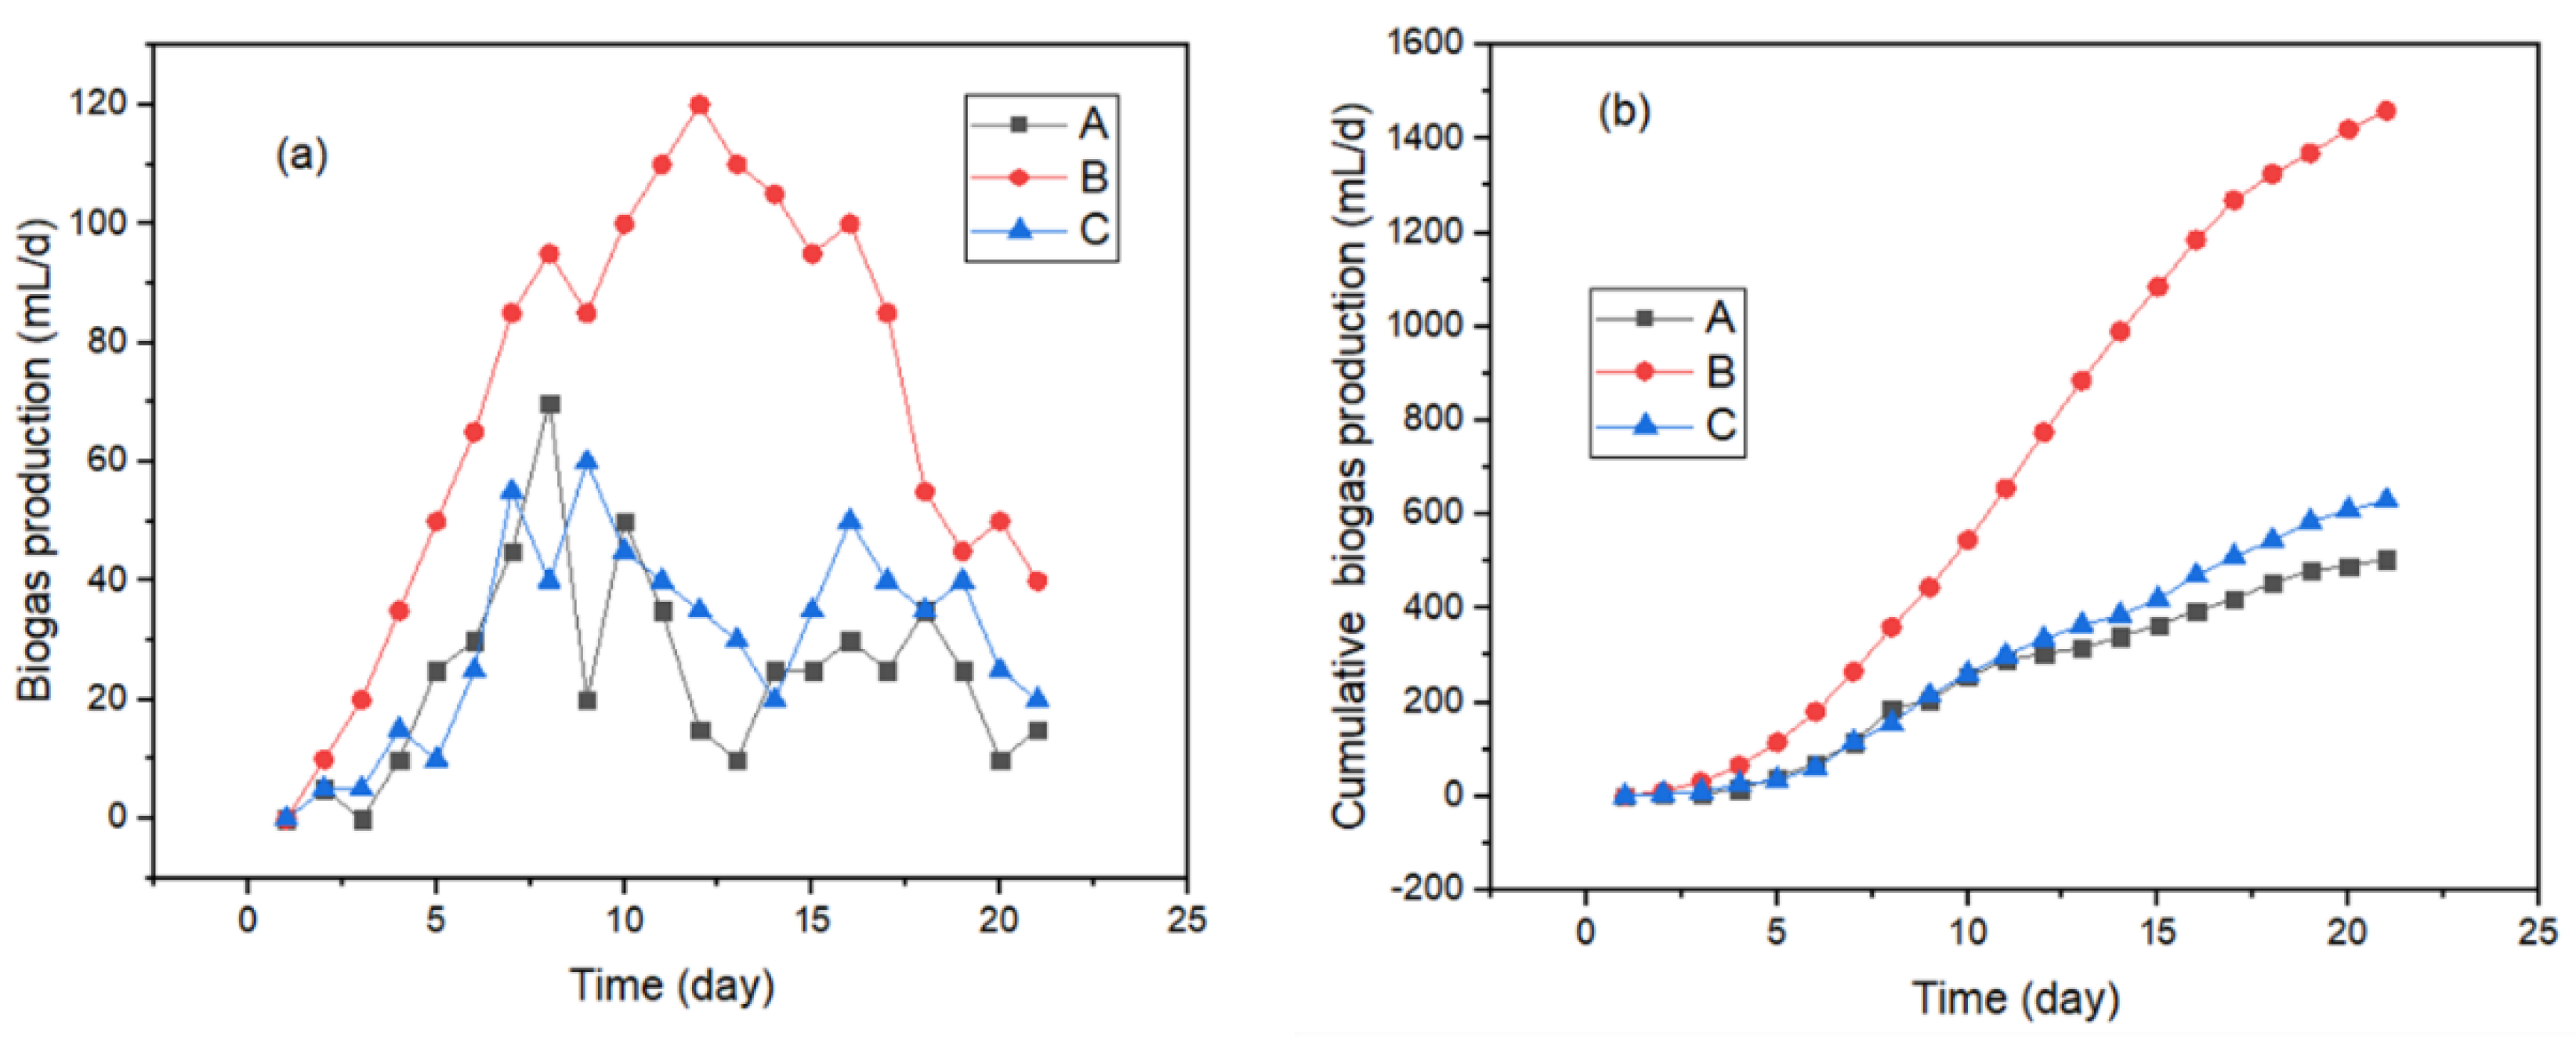
Figure 6 shows the digester set-ups (A, B and C) daily and cumulative biogas volumes produced. The average daily biogas production (Figure 6a) was 70 ± 14 mL/d, 30 ± 5 mL/d and 25 ± 42 mL/d, representing the increasing order of the set-ups as B > C > A respectively. Similarly, the cumulative biogas (Figure 6b) yield was 1460 mL/d, 630 mL/d and 505 mL/d for set-ups B > C > A respectively for the degradability duration of 21 days. Noticeably (Figure 6), the addition of nanoparticles such as Ms increased the biogas production (high peaks) in the set-up (B) as compared to the control set-up (C). However, the alum additives in set-up (A) reduced biogas production (low peaks) by achieving a high peak at the 8th day as against the control (C) (Figure 6a).
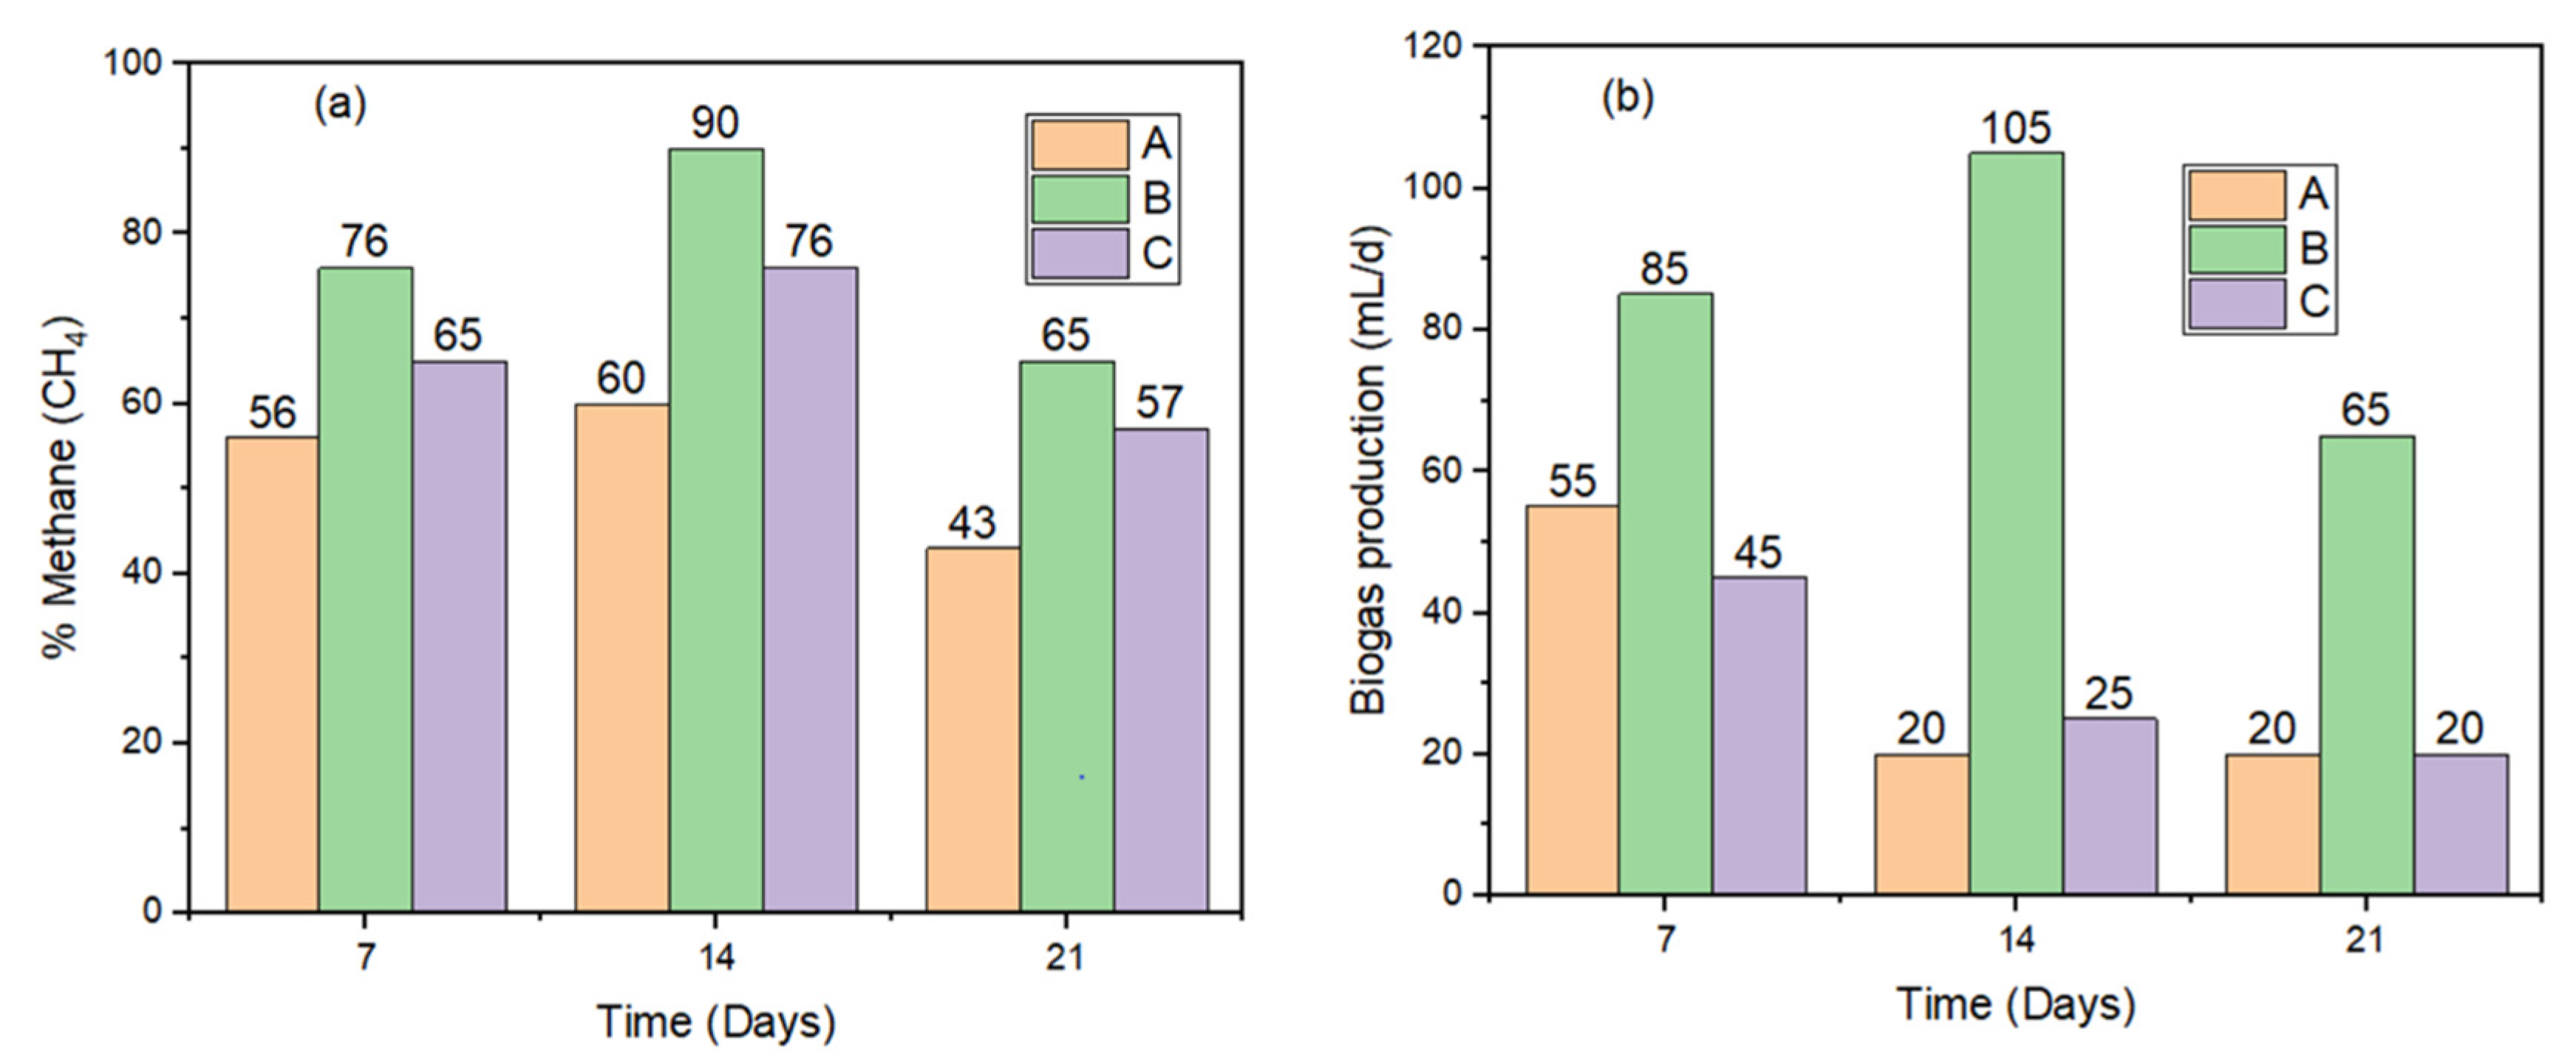
Figure 7 shows the methane content (Figure 7a) and biogas production (Figure 7b) monitored on a weekly basis (7th, 14th and 21st days). Magnetically, an increase in exposure time to the digester had a significant impact on the degradability of the organic compounds into biogas and methane production, as seen on the 14th day with the highest peak of set-up (B) biogas (105 mL/d) and methane (90%) production, as compared to set-ups (C > A) low biogas (25 > 20 mL/d) and methane (76 > 60%) production. This revealed that the magnetic field agglomerated the microbial activity as a function of biogas production [23,27]. This phenomenon might be due to the decreased number of active methanogens and structural modification of the bacteria components caused by the impact of the magnetic field [26,27,28]. In addition, the inactivation of bacterial cells or a decrease in bacterial fission rate along with the nanoparticles could have inhibited the system after the 14th day to the 21st day [28].

2.3.2. SEM/EDS Results of Digester Sludge

After the 21 days of hydraulic retention time (HRT), 2 g of the sludge obtained was characterized by SEM coupled with an energy dispersive X-ray analyzer (EDX) (Model: EVO HD15, Carl Zeiss, and Germany). Figure 8 represents scanned images of digested sludge surfaces of (A) A—Alum, (B) B—Ms and (C) C—Control. In Figure 8C, the activated sludge had a smooth surface, flawless boundaries, a dense structure and irregular protrusions. Comparing Figure 8A to that of the control (Figure 8C), the regular dense structure of the sludge is destroyed with unclear boundaries, crystallized amorphous and flocculated coalesces observed. Figure 8B shows the activated sludge had agglomerated crystallized particles with heterogeneous, spongy and large surface layers. These layers with abundant pores provided active sites for the adsorption of the Fe-NPs. It appears that the effect of NPs used in the MBMP system depends not only on the size of the NPs, but also on their concentration, the NP type, the substrate and the HRT. Their average surface thickness (Figure 8A–C) appears to be 6.36 mm > 5.90 mm > 5.33 mm for B > A > C respectively when viewed at 20.8 µm under a scale of 5 µm. This result agrees with Deepanra et al. [29] and Zaidi et al. [30], who stated that supermagnetic and metallic-supported nanoparticles can influence the surface area and consequently adsorptive activities. Additional reports also suggest that nanoparticle size can be of a wide range of 5 nm to 250 nm, which denotes the NPs acted as a catalyst for the bio-degradation [28,30,31].
Figure 9 shows the EDS results of the activated sludge post-adsorption of the elemental distribution on the surface. The compositions (table), spectrum (EDS images) and peaks of the elementals were elucidated by the adsorption mechanism by electrostatic attraction, agglomeration and the process of oxidation [29,30]. As observed, the elements on the control set-up (C) sludge surface (Figure 8C) were higher than those of set-ups B (Figure 9B) and A (Figure 9A). Spectrum 2 of Alum (Figure 9A) and Ms (Figure 9B) EDS images show the elemental distributions, whereas for that of the control (Figure 9C), represented by spectrum 5, almost similar peaks were observed near 0.7–6.5 keV energy regions. The decreasing order (C < A < B) of most of the adsorbed elementals onto the activated sludge surface were towards the NPs with magnetic properties. This adsorption mechanism of the supermagnetic and metal-supported NPs onto the activated sludge surface was due to the presence of the external magnetic field. This conforms to the results obtained by Zhao et al. [28] and Zaidi et al. [30], who reported on the magnetic effect on substrate surface complexation, pore structure, functional groups, ions exchange, hydrogen and chemical bonds.

2.3.3. Biogas Kinetics

The cumulative biogas production data obtained was kinetically modelled with the first-order and modified Gompertz kinetic models equations (2) and (3) respectively. The kinetic constants were determined by simulating the data obtained with non-linear regression of OriginLab (2019 version) software. Figure 10 and Table 3 respectively present the modified Gompertz model fitting curves and the parameter values. The aforementioned models predicted different biogas production results, whereby the yield for each set-up (A, B, C) was based on the organic substrate and the nanomaterial additives.

2.3.4. Summary of Results

The BMP test was carried out to estimate the impact of the NPs (aluminum and iron-based additives) on AD digestion of sludge for biogas and methane production. Adding to the credit of the NPs was their ability to dissociate and dissolve organics (proteins, carbohydrates and cellulose) and increase the surface area for sorption of the contaminants, as well as the methanogen activities, under AD conditions for biogas production [4,29,30]. Aside from the biogas production, it is evident that the NPs stimulated the dissolution of the organics and restructuring of the microbe’s active surface for adsorption and precipitation, whereby appreciable elementals were found in their activated sludge generated (Figure 9). From the extensive experiments conducted and data analyzed, the summarized results of the MBMP tests are presented in Table 4.

3. Discussions

The results (Section 2) illustrated effective biogas and methane production by integrated-anaerobic treatability with NPs after a coagulation treatment of local South Africa Sugar refinery wastewater. The experiments were carried out in two steps: (i) coagulation and (ii) MBMP tests, whereby the physiochemical properties of the characterized Ms and other detailed discussion are being presented under this section.

3.1. Characteristics of Ms

Figure 2 shows the crystalline structure of Ms characterized by XRD with and without sludge, whereby most of the peaks identified at 2θ (°) of 24.2, 25.3, 37.8, 38.4, 48.2, 53.6, 55.1, 62.8 and 68.7 were allotted to Ms (magnetite Fe3O4). With respect to the diffraction peaks, the Ms Crystals with cubic spine structure were determined to be (111), (440), (220), (311), (400), (422), (511), (214) and (533). As the XRD signals are indexed in Table 1 with phases which are close to iron oxides. This makes it possible to be attracted by the external magnetic field. Generally, the diffraction peaks at (200) are the characteristic peaks of wustite, whereas (222), (104), (024) and (116) represent hematite, such that Ms can easily be oxidized in air to form maghemite (γ-Fe2O3), hematite (α-Fe2O3) and wustite (FeO) at temperatures above 250 °C. The Ms crystallite size was estimated by using the Scherer equation with the width at half-maximum of the strongest peak (331) to be 12.9 nm [7,13]. Additionally, the dominant phase was found to be Ms, with an estimated lattice constant of 0.839 nm, which was in agreement with other studies [6,7,13].
The FTIR spectra (Figure 3) of Ms with and without sludge had active functional groups (polymeric hydroxyl, carbonyl and aromatic rings) which were chemisorbed onto their surface. In Figure 3, the minor band at 453 cm−1 assigned may be due to the vibration of Fe–OH bonds [7,13]. Thus, the surfactant molecules in the transmission state were being subjected to surface hydroxylation and thereby shifting the bands towards the lower wavenumber region (<800 cm−1). This signifies the hydrocarbon chains were closely packed in their crystalline state, which enhanced the electrostatic force of attraction [6,13]. The broad and sharp bands at 1479 cm−1, 1027 cm−1 and 882 cm−1 might be due to the overlaid intramolecular hydrogen bound (O–H) ascribed to the symmetric and asymmetric stretching vibrations of the CH2 [7,13]. Notwithstanding, the absorbance intensity at 1655 cm−1, 1593 cm−1 and 1508 cm−1 denotes the carbonyl (C=O) and alkene (C=C) stretching vibrations due to the aromatic rings of the Ms with sludge [7,13]. This proves the possible occurrence of esterification between the C=O and C=C on the surface of the magnetite [13].

3.2. Effects of Coagulant Dosage and Magnetic Field on Coagulation

The increase in the coagulant dosage (10–60 mg/L) effectively reduced the pollutant surface charge, which resulted in destabilization and agglomeration of the particles into larger flocs [25,29]. As shown in Figure 4, both coagulants (Alum and Ms) demonstrated potential removal of turbidity and color within three categorical dosages: (i) the dosage of 10 mg/L was too low to coagulate the pollutant effectively (alum 50%; Ms 70%); (ii) an observably optimal range was achieved within 40–60 mg/L for alum (60–80%) and Ms (75–95%) with appreciable larger flocs formed; and (iii) optimal dosage of 50 mg/L, of which increasing it to 60 mg/L had no effect on the treatability performance. This phenomenon might be due to reversal and restability of the charge ions on the particle surface due to an excess of the coagulant molecules [23,25].
Based on Figure 5 and Table 2, it is evident that the combination of coagulation and magnetic field provided over 75% removal of the initial color and turbidity (Table 1) with a pH of 6.5, whereby the iron-based coagulant (Ms) performance was proven to be magnetically more effective than the alum, representing turbidity (95%) and color (80%) removal. Alum showed a slight effect of magnetism for the turbidity (80%) and color (75%) removal. This treatability performance occurred at a dosage of 50 mg/L and magnetic field exposure time of 30 min. As observed (Figure 5), the magnetic field facilitated the strength of the aggregated flocs to settle easily by trapping metalloids and other derivatives, leaving the suspension supernatant clear [6,25]. Meanwhile, the charge neutralization and adsorption of pollutants by Ms is reportedly better, owing to its supermagnetic property and dipole–dipole attraction [25].
Consequently, the issue of disposing hazardous waste, which increases the complexity and operational cost of WWTPs, has become a global concern, whereby coagulation plays a major role as the first pre-treatment step [23,25]. For instance, iron- and aluminum-based coagulants have been reported as contributing to secondary pollutants and generating large volumes of sludge [6,23]. Notwithstanding the fact that conventional ferric chloride is reported to be more effective in the removal of pollutants than alum, in most cases the cheap cost of alum is considered [6,31]. The Ms appeared to be more advantageous than alum, owing to its sludge generated with no or slightly complex elementals (Figure 9A). Also, the presence of multivalent metal ions (Fe3+) enhanced the flocculation of complex metals by bridging most of the microflocs with carboxylate groups into aggregated flocs during the process [28,29]. This stimulated the sulfur species for subsequent degradation in the wastewater [30].
Therefore, using magnetic-based coagulants (Ms) stands a better chance of addressing most of the setbacks associated with conventional coagulation [31,32]. Thus, the dissociated ions (Fe3+ and Al3+) behaved as Lewis acids, which reacted with the OH-ions (Lewis base) of the wastewater, thereby precipitating the pollutants in the form of Fe(OH)3 or Al(OH)3 [29,30]. These precipitates have positive electrostatic surface charges with large adsorptive surface areas to enhance trapping of the negatively charged particles in the solution [6,29,30]. This phenomenon justified the reason why high amounts of precipitated solids/flocs settled at the bottom of the beaker with magnetic fields [29,30]. A similar occurrence was observed with the use of Ms, whereas the dissociated Al species in the solution were not magnetically attracted due to its non-magnetic property [6,26].

3.3. Effects of Nanomaterials and Magnetic Field on Biogas and Methane Production

With the rapid development and application of nanotechnology towards green energy [30,33], the safety and toxicology of some of these engineered nanomaterials are of environmental concern. In conventional WWTPs, accumulation and adsorption of high amounts of heavy metals or nanomaterials in the sludge might affect the downstream treatment process [6,29,30]. Successively, some of these nanomaterials (iron-based) are likely to be utilized as micronutrients by microbial biomass, whereas others can exhibit an inhibitory impact on the AD process [27,28,29]. Thus, the substrate variation of content in the sludge during the degradation by the microbes can result in different intermediate end products such as sugars, fatty acids, alcohols, carbonic acids and amino acids [6,30]. This has led to intensive research on the degradation of sewage sludge with other waste streams by AD processes towards environmental protection, economical and eco-friendly energy [27,29]. Nevertheless, this study affirms the presence of heavy metals and nanomaterials in a digester might decrease the AD efficiency [24,27,30]. Thus, the addition of nanoparticles in AD had a synergic effect on the microorganisms for the biogas production [29].
The impacts of the NPs on the setups were ascertained based on the volume of biogas production and methane composition. In Figure 6 and Table 4, it is evident that biogas production increased more with time for the setup (B) with Ms as compared to the control (C), and that of set-up (A) was the lowest. The addition of alum to setup (A) contributed to the production of volatile fatty acids and other organic intermediates (SO4) [30,31,32]. This mechanism, along with metal toxicity, resulted in methanogenic bacteria inhibition. Additional conversion of the substrate to volatile fatty acid by the acidogenic bacteria also contributed to acidification and system failure in setup (A). Based on Figure 7 and Table 4, an enhancement of the biogas volume of production and methane composition was observed when the systems were exposed to external magnetic fields. Thus, the systems under the anaerobic conditions with the magnetic field influenced the growth and multiplicity of the microbes’ activities.
The magnetic field strength of the system reduced the lag phase and increased biogas production and methane composition (Figure 7). This is in accordance with Zhao et al. [28] and Zaidi et al. [30], who reported on the presence of Fe NPs, which provided suitable substrates for methanogenesis enhancement in AD systems. Seyedi et al. [22] and Biswas [33] also reported on the effects of trace metals such as iron and their capacity to reduce the lag phase of mixed culture, which caused the improvement in methane composition and the biogas production. Sreekanh and Sahu [34] reported that NPs uptake may stimulate methanogens by increasing their metabolic intermediates and key enzymatic activities involved in the hydrolysis, acidification, and methanogenesis stages of AD. Here, Fe species acted as an active component, and the catalytic activities were governed by the trivalent and zero-valent (Fe3+/Fe0) ions ratio and their exposed surface area [30,34,35]. Sreekanh and Sahu [34] added 1.4 g of NPs to enhance biogas yield in a portable-food waste digester, while here the waste and environmental conditions of this study are different. Casals et al. [36] reported that an Fe NPs dose of 0.5–16 mg/L increased cumulative CH4 production, by reducing the CO2 via a hydrogenation mechanism. This is in agreement with the current study, which confirms that the Ms increased the CH4 potential by 20% (Table 4). Therefore, there are high prospects of Fe NPs to be used as fuel catalysts to reduce CO2 into CH4 through the stability of the autotrophic methanogens [30].

3.3.1. Sludge Surface Complexity and Traced Nanoparticles after Digestion

The SEM images (Figure 8) present the morphology of the activated sludge aggregated with NPs of amorphous shapes with an average diameter less than 10 nm. The addition of the Fe/Al NPs increased the roughness of the activated sludge, with the development of cracks and macrospores. The pores of Ms (Figure 8B) were larger than those of Alum (Figure 8A), which is due to the replaceability of the Fe or Al species as ion donors on the surface of the activated sludge. This observation is in agreement with the EDS results (Figure 9), in which similar peaks for the Fe element between Ms and Alum were observed.
Figure 9 reveals the complexity of the metal ions or organic compounds on the surface of the activated sludge after the complexation reaction and adsorption. This was as a result of the interaction between the electron donors and electron acceptors being bound to the active groups on the activated sludge surface [31,33]. The control system (C) had a substrate without nanomaterials and resulted in a low biogas production volume and methane composition. Also, there were some elemental changes in the set-up systems as depicted in the electoral spectrum (Figure 9), which includes carbonate (C), silicate (Si), sulfur (S), calcium (Ca), potassium (K), phosphorus (P), manganese (Mn), iron (Fe) and aluminum (Al) from the control. The toxicity levels of elementals accumulated in the sludge followed a decreasing order (Figure 9A) in set-up (A); C > O > Al > Si > S > Mn > Fe; Figure 9B for setup (B) as C > O > Al > Si > Fe > K > Ca > P and Figure 9C representing set-up (C) as C > O > Si > Fe > Al > S > Ca > K > P. It can be seen that the low biogas yield (Table 4) of the alum digester (A) can be attributed to the rapid poisoning of the active microbes in the digester by the SO4 species (sulfide), which increased the acidity of the system.
Conversely, some of the elementals in the Ms digester (Figure 10 B) acted as macro-nutrients (Fe, K, Ca, P) for simulating the methanogenic activity, creating active sites and stabilizing surface intermediate species. According to Casals et al., [36], this can be due to the hydrolysis of soluble proteins and transformational activities of the electron donors, which were driven by redox–proton translocation in a methanogenic species. Furthermore, Zhao et al. [28] indicated magnetic NPs (Ms), which seems to be non-toxic during long-term contact with bacterial activity and has mild toxicity at the initial stage (Figure 8 and Figure 9). However, the magnetic effects of the MBMP system influenced the Ms to enhance the activity of the autotrophic bacteria [29,30]. Thus, the propagation of autotrophic bacteria being attached to a carrier with a proton donor is positive for their growth and enrichment [35,36].
The two key tracing metal ions (Fe and Al) were assessed based on their distribution in the effluent. These were characterized to understand the possible mechanism of the heavy metal impact order in the supernatant. In Table 4, it is shown that B—Ms (Al: 8 ± 4 mg/L; Fe: 6 ± 7 mg/L) affected the system positively, followed by C—control (Al: 30 ± 4 mg/L; Fe: 32 ± 3 mg/L), whereas A—Alum (Al: 36 ± 8 mg/L; Fe: 60 ± 16 mg/L) had a negative impact on the system. The Al active sites, besides the primary Fe sites on the surface of activated sludge (Figure 9C) microspheres, facilitated the creation of Al–peroxide intermediates (Al–OOH), which reduced the apparent activation energy of the decomposition [34,35,36]. The synergistic effect between the Fe and Al sites acted as reaction promoters for most of the metal oxides being used in CO2 hydrogenation reactions [34,35].
As reported, nanomaterials are inhibitory to biodegradation, nitrification and the AD process [24,33]. Hence, understanding the complex mechanisms by which these particles interacted with the substrate and the microbes to enhance methanogenesis is very important. Notwithstanding their composition, nanoparticles have high surface area to volume ratios and particle size that can influence the rate of adsorption and biodegradation [28,30]. Additional combination of the substrate and the NPs resulted in functional groups containing oxides (Fe2O3), which heightened precipitation removal of the contaminants from the effluent [31,33]. According to Zhao et al., [28], the interactions between the Ms and the activated sludge created an anoxic environment, which heterotrophic bacteria prefer, and thereby enhanced their activities. This adds to the advantages of Ms due to the large fraction and highly disperse nature (Figure 8B) of the Fe species on the surface of the activated sludge (Figure 9B), making it reachable for the reactants to adsorb.

3.3.2. Biogas Production Kinetics Using First-Order and Modified Gompertz Models

The availability of substrate for metabolism under anaerobic conditions with active microbial community enhanced the rate of biogas production. This mechanism was attributed to the four steps in the AD process: hydrolysis, acidogenesis, acetogenesis and methanogenesis [30,33]. The inhibitory effect of the nanoparticles in the AD biogas production was evaluated by the BMP test. To monitor the performance in terms of volume of biogas produced per day, the water displacement method was used. The measuring cylinder used for the gas collection was fixed with butyl rubber at the top to enable injection of the gas for analysis. From Figure 6, the average daily biogas production recorded was 25, 70 and 32 mL/day respectively for A—alum, B—Ms and C—Control. In Table 4, organic degradation is also represented as 304 ± 92, 157 ± 8 and 258 ± 72 mg/L of COD respectively for A—alum, B—Ms and C—Control set-ups. The cumulative biogas production data (Figure 10) obtained was simulated with the first-order kinetic model (5) and modified Gompertz model (6) constants obtained, presented in Table 3.
Additives of the nanomaterials (Ms) enhanced the kinetics process of the acetotrophic and hydrogenotrophic methanogens in the digester for biogas and methane production. Thus, the electrons released or hydrogen generated by the Ms had a significant influence on the biogas and methane production (Figure 3). Subsequently, methanogenic reactions under anaerobic conditions were accelerated by the presence of Fe3+, whereas the Al3+ retarded or inhibited the methanogens growth rate. The reactions (1 and 3) illustrate the dehydrogenation and hydrogenation pathways of Fe and Al NPs, which served as catalysts to hinder microbial activities or enhanced the degradation of the toxic organic compounds respectively.
4Fe0 + 8H+ + CO2 → 4Fe2+ + CH4 + 2H2O
Fe0 + H2S → FeS + H2
Al2 (SO4)3 + 6H2O → 2Al (OH) 3 + 3H2SO4
From reaction (1), electrons released (Fe) promoted the CH4 production and by-products like formic acid whose decomposition resulted in a polymerization chain reaction of CO2 and H2. Also, the zero-valent Fe0 can be consumed by the inorganic CO2 and other complex compounds (sulfide) (2) [30]. Table 5 presents reported bio-stimulating effects of Al- and Fe-based salts and NPs additives on AD biogas production, which confirms Ms as the most effective nanocatalyst for the bio-hydrogenation and methanogenesis processes [28,30,33]. In Table 6, Sreekanh and Sahu [35] reported about 21.3% and 35.7% reduction in the biogas volume as a result of using 100 mg/L of Al- and Fe-based salts for municipality sewage treatment respectively. Although previous studies were on mixed sludge with alum and ferric salts, the current study also corroborates reduction of biogas yield from Alum activated sludge [35,36]. Thus, the Al additives promoted the formation of sulfuric acid, and other volatile fatty acids, which were inhibitory to the MBMP process. This retarded the pH level of the AD process to be in acidic medium, thereby affecting the methanogen growth rate and activities for the biogas and methane production [33,34,35]. However, additives of the Ms reduced not only the lag phase but also the time to achieve the highest biogas production (peak).

4. Materials and Methods

4.1. Chemicals

All the chemicals and reagents used were of Sigma Aldrich analytical grade purchased from Merck Chemicals (Pty) (Durban, South Africa). Aluminum sulphate hydrate (alum) and ferric chloride hexahydrate (FeCl3 < 5 µm, ≥96%) were used as coagulants. Their stock solutions were prepared with MiliQ water (Conductivity of 18.2 MΩ/cm at 25 °C). In order to prevent further reactions, the stock solution bottles were wrapped with aluminum foil, stored at room temperature and used within 24 h. In terms of synthesizing Ms, the ferrous chloride tetrahydrate (FeCl2·4H2O) and FeCl3 were used as the precursors. Ammonium hydroxide (25 wt% NH4OH) was used as the precipitating agent, whereas deionized water was used to remove the extreme impurities. Successively, the experiments were carried out in two phases: (i) coagulation and (ii) magnetized biochemical methane potential (MBMP).

4.1.1. Synthesis of Ferromagnetite (Ms)

The Ms was prepared via a modified chemical co-precipitation procedure reported in the literature [6,25]. This was carried out by dissolving 5.4 g of FeCl3 and 2.7 g FeCl2·4H2O with 100 mL MiliQ water followed with intermittent addition of 20 mL of 25 wt% NH4OH. This was then sonicated (45 KHz at 80 °C) for 15 min until the solution color changed from orange to dark brown. The precipitated Ms was filtered and systematically washed with deionized water to remove the chloride ions and at the end oven dried at 80 °C for 24 h and calcined at 500 °C for 1 h.

4.1.2. Physiochemical Analysis

The crystalline nature and mineralogical composition of the Ms and sludge were identified by X-ray diffraction equipment (Bruker AXS, D8 advance) coupled with Panalytical X’Pert PRO MPD software. This was carried out by firstly metalizing the samples with a gold–palladium alloy using the sputtering technique (Quorum Q15OR ES metallizer). A continuous measurement was done on a J-J scan with copper anode (Cu-Kα radiation: λ = 1.5406 Å) and Bragg–Brentano configuration. The diffractograms were performed at room temperature with 0.01° (2θ) step size and 10 s step time. To ascertain the functional groups on the Ms and sludge surface, Fourier Transform Infrared spectroscopy (FTIR) by a Perkin Elmer spectrum spectrophotometer was employed. The spectrum obtained was within the wavelength of 4000 to 400 cm−1. Also, scanning electron microscopy coupled with an energy dispersive X-ray analyzer (SEM/EDX) (Model: EVO HD15, Carl Zeiss, Germany) was employed to determine the elemental distribution of sludge.

4.2. Wastewater and Substrate

Both the wastewater and activated anaerobic sludge samples used were obtained from a local South African Sugar processing industry, in the Kwazulu Natal Province (Durban, South Africa). The thickened sludge was allowed to settle in a cold room (5 °C) for 24 h, whereby the supernatant aqueous part was removed. The wastewater used as the substrate was rich in organic nutrients (COD), which was spiked with the coagulated residue obtained to serve as inhibitors to the BMP process. The water quality, as presented in Table 6, was characterized based on the American Public Health Association standards for wastewater (APHA) [37]. Al and Fe were characterized using an Agilent Micro-Plasma Atomic Emission Spectrophotometer (MP-AES, MY 18379001).

4.3. Experimental Procedure

4.3.1. Coagulation Process

A jar test apparatus (JTL6) manufactured by Velp Scientifica (Velp Inc, USA) equipped with six 1 L beakers was employed to evaluate the effect of coagulant dosage (10–60 mg/L) and magnetic time exposure (10–30 min). Firstly, the wastewater sample was distributed into the beakers leaving a headspace of 200 mL. After the addition of the specified coagulant dose, the suspension was rapidly mixed (at 150 rpm—quick coagulation) for 2 min, followed by 15 min slow mixing (at 30 rpm—slow coagulation) [6]. The samples were then exposed to a magnetic field for 15 min to enhance settling. At the end of the settling period, 20 mL of the supernatant from the top of the suspension was withdrawn with a syringe for turbidity (Hach 2100N turbidimeter, USA) and color (Hach DR3900 Spectrophotometer) measurement. The above procedure was also used to test the magnetic effect using different magnetic exposure times (10, 15, 20, 25 and 30 min) at the optimum dosage obtained. Removal of the contaminants was calculated according to (4).
% r e m o v a l = C 0 C I C 0 × 100
where C0 and CI are the contaminant initial and final concentrations of the samples.

4.3.2. Biochemical Methane Potential (BMP)

Biochemical methane potential (BMP) tests reported by Tetteh et al. [19] and Armah et al. [17] were followed with modification. The 1000 mL Duran schott bottles used as batch reactors were supplied by CC Imelmann (Pty) Limited in Johannesburg, South Africa. In Figure 11, the working volumes of the bottles were 800 mL; filled with anaerobic sludge (400 mL), substrate (350 mL), coagulated residue (40 mL) and 10 mL of stock solution (alum or Ms). Magnetic bars (stirrers) were placed in each bottle to facilitate mixing of the samples. After all the components were filled, the bottles were air-tightened with the caps. The reactors’ headspaces of 200 mL were then purged with N2 gas for 5 min to flush out the oxygen inside. This was carried out through the two ports of the cap: one side for injecting and the other side for releasing of the gas. Each setup was then placed on a hotplate magnetic stirrer, operated at mesophilic temperature (35 °C) with a mixing rate of 15 rpm. Intermittent mixing was done every 4 h, to ensure contact of constituents and homogeneousness of the samples. The volume of biogas produced was recorded every day at the same time. The experiment was carried out for 21 days, which had enough retention time to digest all the organic content. Every 7 days, the biogas composition was characterized by Gas Chromatography (GC 2014, Shimadzu), whereas the daily biogas production was measured by the liquid displacement method used by other authors [17,19]. The biogas production kinetics was modelled with the modified Gompertz model and first-order models expressed in Equations (5) and (6) respectively [27].
y ( t ) = y m [ 1 exp ( k t ) ]
y ( t ) = y ( m ) · exp ( exp [ U , e y ( m ) [ λ t ] ] + 1 )
where y(t) represents the cumulative yield of biogas at time t (mL/days) and t the digestion time for biogas production (days). y(m) is the volume of biogas produced (mL), λ is the lag phase period of producing biogas (days), e is the mathematical constant (= 2.718282), and k is the biogas rate constant (1/days). In the modified Gompertz model, k is expressed as the maximum biogas production rate per biogas production potential ( U , e y ( m ) ; 1/days), where U is the maximum biogas production rate.

5. Conclusions

This study presents coagulation and anaerobic digestion coupled with Ms as effective options for wastewater treatment for reuse as compared to that of alum. Additionally, the potential benefits of a magnetized system for wastewater remediation and biogas production via integration of coagulation and MBMP were explored. The physiochemical analysis by XRD and FTIR validated the crystallite of Ms and its ability to bind to or react with other functional groups. In the coagulated system, the magnetic field influenced the agglomeration and adsorption of the contaminants with easy settling. This yielded turbidity (95%; 80%) and color (80%; 75%) removal representing Fe-NPs and alum performance at a dosage of 50 mg/L and magnetic exposure time of 30 min. The inhibitory effect of the NPs was measured based on the biogas production. Ms increased the daily biogas volume of the control system from 32 mL to 70 mL, whereas the alum inhibitory effect reduced the volume of the biogas to 25 mL. The cumulative biogas production of the Ms and alum were 1460 mL/d and 505 mL/d as compared to the control system of 630 mL/d. The Ms attained the highest amount of methane composition of 80% CH4, as compared to the control and alum respectively at 61% CH4 and 52% CH4. Cumulative biogas data obtained were modelled by the modified Gompertz and first-order kinetic models. The results were well fitted with the modified Gompetz kinetic model, with coefficient determinations (R2) as 0.965, 0.999 and 0.967 for Control, Ms and alum systems corresponding to kinetic rate constants of 0.285 d−1, 0.127 d−1 and 0.195 d−1 respectively. Subsequent addition of Ms to the MBMP coupled with a magnetic field showed robust enhancement of the biogas production and methane yield, with a reduced lag phase and low kinetic rate. In addition, the magnetized system has proven to be viable for heavy metals removal from wastewater with complex ions and high organic strength. The synergistic effect of integrating magnetized systems into coagulation as pre-treatment to AD in the wastewater setting results in the following research directives being recommended:
  • The future prospects of magnetized NPs (Fe NPs) to be used in bioenergy systems for energy conversion are economically viable. This is due to their high surface area, porous structure and supermagnetic properties, which can act as an activator for a degradation catalyst, such as a photocatalyst (Fe/TiO2).
  • The development of magnetized NPs to be used as a coagulant or catalyst should be given research attention for the removal of contaminants and reduction of landfills complexity. This includes methods of recovery of the NPs after the application in the AD process to reduce environmental impact on soil and agricultural crops.
  • Kinetically evaluate the effects of magnetic field on AD biogas production by considering different approaches such as substrate pre-treatment, nanoparticles dosage and inoculum mixture with respect to time should be considered.

Author Contributions

Conceptualization, methodology, investigation and writing—original draft preparation was carried out by E.K.T. Whereas supervision, review and editing was done by S.R. All authors have read and agreed to the published version of the manuscript.

Funding

This research was funded by Water Research Commission of South Africa under project identification WRC Project: C2019/2020-00212.

Acknowledgments

The authors wish to thank the Durban University of Technology, Green Engineering and Sustainability Research Group and the Water Research Commission of South Africa for their support on the project identification WRC Project: C2019/2020-00212.

Conflicts of Interest

The authors declare no conflict of interest. The funders had no role in the design of the study; in the collection, analyses, or interpretation of data; in the writing of the manuscript, or in the decision to publish the results.

References

  1. Werner, C.M.; Logan, B.E.; Saikaly, P.E.; Amy, G.L. Wastewater treatment, energy recovery and desalination using a forward osmosis membrane in an air-cathode microbial osmotic fuel cell. J. Membr. Sci. 2013, 428, 116–122. [Google Scholar] [CrossRef]
  2. Goswami, L.; Kumar, R.V.; Pakshirajan, K.; Pugazhenthi, G. A novel integrated biodegradation—Microfiltration system for sustainable wastewater treatment and energy recovery. J. Hazard. Mater. 2019, 365, 707–715. [Google Scholar] [CrossRef]
  3. Maaz, M.; Yasin, M.; Aslam, M.; Kumar, G.; Atabani, A.E.; Idrees, M.; Anjum, F.; Jamil, F.; Ahmad, R.; Khan, A.L.; et al. Anaerobic membrane bioreactors for wastewater treatment: Novel configurations, fouling control and energy considerations. Bioresour. Technol. 2019, 283, 358–372. [Google Scholar] [CrossRef]
  4. Tetteh, E.K.; Rathilal, S.; Chetty, M.; Armah, E.K.; Asante-Sackey, D. Treatment of Water and Wastewater for Reuse and Energy Generation-Emerging Technologies. In Water and Wastewater Treatment; Eyvaz, M., Ed.; IntechOpen: Rijeka, Croatia, 2019. [Google Scholar]
  5. Wu, Y.; Lin, H.; Yin, W.; Shao, S.; Lv, S.; Hu, Y. Water quality and microbial community changes in an urban river after micro-nano bubble technology in situ treatment. Water 2019, 11, 66. [Google Scholar] [CrossRef] [Green Version]
  6. Tetteh, E.K.; Rathilal, S. Application of magnetized nanomaterial for textile effluent remediation using response surface methodology. Mater. Today Proc. 2020. [Google Scholar] [CrossRef]
  7. Zekić, E.; Vuković, Ž.; Halkijević, I. Application of nanotechnology in wastewater treatment. Gradjevinar 2018. [Google Scholar] [CrossRef]
  8. Zieliński, M.; Rusanowska, P.; Dębowski, M.; Hajduk, A. Influence of static magnetic field on sludge properties. Sci. Total Environ. 2018. [Google Scholar] [CrossRef] [PubMed]
  9. United Nations. The Sustainable Development Goals Report; United Nations Publications: New York, NY, USA, 2017. [Google Scholar] [CrossRef] [Green Version]
  10. Okoli, C.; Boutonnet, M.; Järas, S.; Rajarao-Kuttuva, G. Protein-functionalized magnetic iron oxide nanoparticles: Time efficient potential-water treatment. J. Nanopart. Res. 2012. [Google Scholar] [CrossRef]
  11. Hatamie, A.; Parham, H.; Zargar, B.; Heidari, Z. Evaluating magnetic nano-ferrofluid as a novel coagulant for surface water treatment. J. Mol. Liq. 2016. [Google Scholar] [CrossRef]
  12. Niemann, M.U.; Srinivasan, S.S.; Phani, A.R.; Kumar, A.; Goswami, D.Y.; Stefanakos, E.K. Nanomaterials for hydrogen storage applications: A review. J. Nanomater. 2008. [Google Scholar] [CrossRef] [Green Version]
  13. Marambio-Jones, C.; Hoek, E.M. A review of the antibacterial effects of silver nanomaterials and potential implications for human health and the environment. J. Nanopart. Res. 2010, 12, 1531–1551. [Google Scholar] [CrossRef]
  14. Mao, C.; Feng, Y.; Wang, X.; Ren, G. Review on research achievements of biogas from anaerobic digestion. Renew. Sustain. Energy Rev. 2015. [Google Scholar] [CrossRef]
  15. Martins, F.; Felgueiras, C.; Smitková, M. Fossil fuel energy consumption in European countries. Energy Procedia 2018. [Google Scholar] [CrossRef]
  16. Muñoz, R.; Meier, L.; Diaz, I.; Jeison, D. A review on the state-of-the-art of physical/chemical and biological technologies for biogas upgrading. Rev. Environ. Sci. Bio/Technol. 2015, 14, 727–759. [Google Scholar] [CrossRef] [Green Version]
  17. Armah, E.K.; Chetty, M.; Deenadayalu, N. Effect of particle size on biogas generation from sugarcane bagasse and corn silage. Chem. Eng. Trans. 2019, 76, 1471–1476. [Google Scholar] [CrossRef]
  18. Laiq Ur Rehman, M.; Iqbal, A.; Chang, C.C.; Li, W.; Ju, M. Anaerobic digestion. Water Environ. Res. 2019. [Google Scholar] [CrossRef] [Green Version]
  19. Tetteh, E.; Amano, K.O.A.; Asante-Sackey, D.; Armah, E. Response Surface Optimisation of Biogas Potential in Co-Digestion of Miscanthus Fuscus and Cow Dung. Int. J. Technol. 2018. [Google Scholar] [CrossRef] [Green Version]
  20. Ahmad, T.; Ahmad, K.; Ahad, A.; Alam, M. Characterization of water treatment sludge and its reuse as coagulant. J. Environ. Manag. 2016. [Google Scholar] [CrossRef]
  21. Dave, P.N.; Chopda, L.V. Application of iron oxide nanomaterials for the removal of heavy metals. J. Nanotechnol. 2014. [Google Scholar] [CrossRef] [Green Version]
  22. Seyedi, S.; Venkiteshwaran, K.; Benn, N.; Zitomer, D. Inhibition during Anaerobic Co-Digestion of Aqueous Pyrolysis Liquid from Wastewater Solids and Synthetic Primary Sludge. Sustainability 2020, 12, 3441. [Google Scholar] [CrossRef] [Green Version]
  23. Brar, S.K.; Verma, M.; Tyagi, R.D.; Surampalli, R.Y. Engineered nanoparticles in wastewater and wastewater sludge—Evidence and impacts. Waste Manag. 2010. [Google Scholar] [CrossRef] [PubMed]
  24. Ghernaout, D. Magnetic field generation in the water treatment perspectives: An overview. Int. J. Adv. Appl. Sci. 2017, 5, 193–203. [Google Scholar] [CrossRef]
  25. Santos, T.R.T.; Silva, M.F.; Nishi, L.; Vieira, A.M.S.; Klein, M.R.F.; Andrade, M.B.; Bergamasco, R. Development of a magnetic coagulant based on Moringa oleifera seed extract for water treatment. Environ. Sci. Pollut. Res. 2016. [Google Scholar] [CrossRef] [PubMed]
  26. Ferreira, M.; Sousa, J.; Pais, A.; Vitorino, C. The role of magnetic nanoparticles in cancer nanotheranostics. Materials 2020, 13, 266. [Google Scholar] [CrossRef] [Green Version]
  27. dos Santos, L.A.; Valença, R.B.; da Silva, L.C.S.; de Barros Holanda, S.H.; da Silva, A.F.V.; Jucá, J.F.T.; Santos, A.F.M.S. Methane generation potential through anaerobic digestion of fruit waste. J. Clean. Prod. 2020, 256, 120389. [Google Scholar] [CrossRef]
  28. Zhao, B.; Sha, H.; Li, J.; Cao, S.; Wang, G.; Yang, Y. Static magnetic field enhanced methane production via stimulating the growth and composition of microbial community. J. Clean. Prod. 2020, 271, 122664. [Google Scholar] [CrossRef]
  29. Deepanraj, B.; Sivasubramanian, V.; Jayaraj, S. Effect of substrate pretreatment on biogas production through anaerobic digestion of food waste. Int. J. Hydrog. Energy. 2017, 42, 26522–26528. [Google Scholar] [CrossRef]
  30. Zaidi, A.A.; RuiZhe, F.; Shi, Y.; Khan, S.Z.; Mushtaq, K. Nanoparticles augmentation on biogas yield from microalgal biomass anaerobic digestion. Int. J. Hydrog. Energy. 2018, 43, 14202–14213. [Google Scholar] [CrossRef]
  31. Tetteh, E.K.; Rathilal, S. Application of organic coagulants in water and wastewater treatment. In Organic Polymers (Sand anZaki); IntechOpen: Rijeka, Croatia, 2019. [Google Scholar]
  32. Iwuozor, K.O. Prospects and Challenges of Using Coagulation-Flocculation method in the treatment of Effluents. Adv. J. Chem. Sect. A Theor. Eng. Appl. Chem. 2019, 2, 105–127. [Google Scholar] [CrossRef] [Green Version]
  33. Biswas, A. Nanotechnology in Biofuels Production: A Novel Approach for Processing and Production of Bioenergy. In Sustainable Approaches for Biofuels Production Technologies; Springer: Cham, Switzerland, 2019; pp. 183–193. [Google Scholar]
  34. Sreekanth, K.M.; Sahu, D. Effect of iron oxide nanoparticle in bio digestion of a portable food-waste digester. J. Chem. Pharm. Res. 2015, 7, 353–359. [Google Scholar]
  35. Ojo, P.; Ifelebuegu, A.O. The Effects of Aluminium-and Ferric-Based Chemical Phosphorus Removal on Activated Sludge Digestibility and Dewaterability. Processes 2019, 7, 228. [Google Scholar] [CrossRef] [Green Version]
  36. Casals, E.; Barrena, R.; García, A.; González, E.; Delgado, L.; Busquets-Fité, M.; Font, X.; Arbiol, J.; Glatzel, P.; Kvashnina, K.; et al. Programmed iron oxide nanoparticles disintegration in anaerobic digesters boosts biogas production. Small 2014, 10, 2801–2808. [Google Scholar] [CrossRef] [PubMed] [Green Version]
  37. APHA. Standard Methods for the Examination of Water and Wastewater; American Water Works Association/American Public Works Association/Water Environment Federation: Washington, DC, USA, 2012. [Google Scholar]
Figure 1. Schematic flow of a conventional wastewater treatment plant.
Catalysts 10 01200 g001
Figure 2. X-ray diffraction iron oxides (Ms) profile with and without sludge corresponding to JCPDS file No. 19-0629 reference line patterns; Ms magnetite (Fe3O4), H: hematite (α-Fe2O3) and W: wustite (FeO).
Catalysts 10 01200 g002
Figure 3. Fourier Transform Infrared (FTIR) spectra of Ms with and without sludge.
Catalysts 10 01200 g003
Figure 4. Effects of coagulant dosage (10–60 mg/L) on (a) turbidity and (b) color removal (%); Ms (red) and Alum (black) without any magnetic influence.
Catalysts 10 01200 g004
Figure 5. Effect of magnetic field exposure time (10–30 min) on (a) turbidity and (b) color removal (black scale—left) at dosage of 50 mg/L; Ms_mG, Alum_mG; magnetic field (red scale—right).
Catalysts 10 01200 g005
Figure 6. (a) Daily and (b) cumulative biogas production; B—Ms (red) > C—Control (blue) > A—Alum (black).
Catalysts 10 01200 g006
Figure 7. Biochemical methane potential (BMP) weekly monitoring (a) methane content (%), and (b) biogas production (mL/d); B—Ms (green) > A—Alum (brown) > C—Control (violet).
Catalysts 10 01200 g007
Figure 8. Scanning electron microscopy (SEM) images of digested sludge from magnetized biochemical methane potential (MBMP) setups of (A) Alum, (B) Ms and (C) Control.
Catalysts 10 01200 g008
Figure 9. Energy dispersive X-ray spectrometer (EDS) image showing tracing nanoparticles (NPs) in digester sludge of set-up A—Alum (A) increasing order C > O > Al > Si > S > Mn > Fe; set-up B—Ms (B) increasing order C > O > > Si > Fe > K > Ca > Al > P and set-up C—Control (C) increasing order C > O > Si > Fe > Al > S > Ca > K > P.
Catalysts 10 01200 g009
Figure 10. Cumulative biogas production for Modified Gompertz kinetic model.
Catalysts 10 01200 g010
Figure 11. Magnetized biochemical methane potential (MBMP) setups; (A) with Alum; (B) with Ms and (C) Control without any nanomaterials.
Catalysts 10 01200 g011
Table 1. X-ray diffraction positions (2θ) and crystal structure of the iron oxide phases identified.
2θ (°)d (Å)Interlinear Spacing Values (hkl)Crystal StructureIron Oxides Phase (JCPDS File No. 19-0629)
21.46.32(200)OrthorhombicW wustite (FeO)
24.24.53(111)CubicMs magnetite (Fe3O4)
25.33.96(222)HexagonalH: hematite (α-Fe2O3)
(440)CubicMs
26.53.76(104)HexagonalH
36.53.16(024)HexagonalH
37.82.96(220)CubicMs
38.42.70(311)CubicMs
42.62.52(200)OrthorhombicW
48.22.41(116)HexagonalH
(400)CubicMs
53.61.96(422)CubicMs
55.11. 74(511)CubicMs
60.11.69(220)OrthorhombicW
62.81.52(214)CubicMs
68.71.38(533)CubicMs
Table 2. Coagulation summary results with and without magnetic field.
Parameters N* MsW* MsN* AlumW* Alum
Dosage (mg/L)50505050
Magnetic time (min)N/A30N/A30
Magnetic field (mG)N/A111.69N/A81.05
Turbidity (%)85 957080
Colour (%)70806075
N*—no magnetic field, W*—with magnetic field, N/A—not applicable.
Table 3. Results of Modified Gompertz and first-order kinetic constants.
Set-UpA—AlumB—MsC—Control
Modified Gompertz Model
y535.28 ± 091731.3 ± 58736.3 ± 67
k (1/day)0.1950.1270.285
c9.1310.6910.97
Actual coefficient of determination (R2)0.9770.9990.965
Adjustable coefficient of determination (Adj R2)0.9690.9960.954
Sum of squares residual (SSR)6075.73 ± 352113.63 ± 924915.56 ± 41
First-order model
y283.65 ± 25827.33 ± 66339.44 ± 52
k (1/day)0.3150.2210.329
Actual coefficient of determination (R2)0.9850.9830.976
Adjustable coefficient of determination (Adj R2)0.9830.9810.966
Sum of squares residual (SSR)1170.07 ± 75932.38 ± 361292.89 ± 18
Table 4. Summarized results of the BMP test.
Parameter A—AlumB—MsC—Control
pH6.46.66.8
COD (mg/L)304 ± 92157 ± 8258 ± 72
Turbidity (NTU)66 ± 4424 ± 16105 ± 7
Color (PtCo)75 ± 252 ± 8112 ± 24
TSS (mg/L)38 ± 822 ± 760 ± 8
Al (mg/L)36 ± 88 ± 430 ± 4
Fe (mg/L)60 ± 166 ± 732 ± 3
Average daily biogas (mL/d)25 ± 4270 ± 1430 ± 5
Cumulative biogas (mL/d)5051460630
% Methane (CH3)51.5679.860.74
% Carbon dioxide (CO2) 48.4420.239.26
Table 5. Study on bio-catalytic effect of Al- and Fe-based salts and nanoparticles on biogas production.
SubstrateCumulative Biogas Production (mL/d) without NanoparticlesCumulative Biogas Production (mL/day) with NanoparticlesRef
Algae wastewater + Ni NPs488618[30]
Algae wastewater + Co NPs488535[30]
Algae wastewater + Fe NPs488624[30]
Algae wastewater + Mg NPs488529[30]
Sewage + Al salt34.91 ± 1.3 24.85 ± 1.3 [35]
Sewage + Fe salt 34.91 ± 1.322.46 ± 1.5 [35]
Sugar refinery wastewater + Alum630505* This study
Sugar refinery wastewater + Ms6301460* This study
* Results obtained from this study.
Table 6. Characterized wastewater sample.
Parameter UnitsValue
pH-6.6–7.2
Chemical oxygen demand (COD) (mg/L)942 ± 180
Turbidity NTU302 ± 18
Color Pt.Co250 ± 24
Total suspended solids (TSS) (mg/L)152 ± 13
* Aluminium ion (Al)(mg/L)56 ± 12
* Iron (Fe)(mg/L)134 ± 19
* as a result of spiked nano-material residue.
Publisher’s Note: MDPI stays neutral with regard to jurisdictional claims in published maps and institutional affiliations.