Article

Virgin Heavy Gas Oil from Oil Sands Bitumen as FCC Feed

1
Natural Resources Canada, CanmetENERGY, 1 Oil Patch Drive, Devon, AB T9G 1A8, Canada
2
Department of Chemical and Biochemical Engineering, Western University, London, ON N6A 5B9, Canada
3
State Key Laboratory of Chemical Engineering, East China University of Science and Technology, Shanghai 200237, China
4
Natural Resources Canada, CanmetENERGY, 1 Haanel Drive, Ottawa, ON K1A 1M1, Canada
5
Research Institute of Petroleum Processing, Sinopec, 18 Xueyuan Road, Haidian District, Beijing 100083, China
6
Natural Resources Canada, Geological Survey of Canada, 3303–33rd St NW, Calgary, AB T2L 2A7, Canada
7
Beijing Institute of Petrochemical Technology, Daxing, Beijing 102600, China
8
College of Biological, Chemical Sciences and Engineering, Jiaxing University, 118 Jiahang Road, Jiaxing 314001, China
*
Authors to whom correspondence should be addressed.
Catalysts 2020, 10(3), 277; https://doi.org/10.3390/catal10030277
Submission received: 3 January 2020 / Revised: 19 February 2020 / Accepted: 21 February 2020 / Published: 1 March 2020

Abstract

:
This study deals with a systematic investigation of the fluid catalytic cracking (FCC) performance of a bitumen-derived virgin heavy gas oil (HGO) in the presence of its counterpart from bitumen-derived synthetic crude oil (SCO). The objective is to determine the amelioration effect on yield and product slate by the addition of the premium SCO HGO. The 343–525 °C cut virgin bitumen HGO was obtained from distillation of a raw Athabasca oil sands bitumen. It was then blended with different amounts of the 343 °C+ fraction of commercial SCO. Four HGO blends were prepared containing 75, 64, 61, and 48 v% of SCO HGO. Each HGO blend, as well as 100% SCO HGO, were catalytically cracked at 500 and 520 °C using a bench-scale Advanced Cracking Evaluation (ACE) unit. The results show acceptable FCC performance of bitumen virgin HGO when an adequate amount of SCO HGO is added. However, the resulting liquid product may need some quality improvement before use. Several observations, including catalyst poisoning by feed nitrogen and the refractory nature of virgin HGO, are evident and help to explain some observed cracking phenomena.

1. Introduction

Oil sands bitumen is a mixture of immature and complex hydrocarbons with a relatively low hydrogen to carbon ratio (i.e., very aromatic) and an abundance of chemical impurities. Because of its high viscosity, bitumen can only be transported through pipelines after being mixed with suitable diluents, such as light oil condensate. Alternatively, bitumen can be upgraded to a light and bottomless synthetic crude oil (SCO), which is pipelineable. Syncrude Canada Ltd. is one of the world’s largest producers of SCO. Over the years, Syncrude has been striving for better quality of its SCO [1], now called Syncrude Sweet Premium (SSP), with specific interest in the heavy gas oil (HGO) or vacuum gas oil (VGO) [2], which is usually used by refiners as a feed to the fluid catalytic cracking unit (FCCU). The FCCU is the heart of a refinery for converting HGOs to gasoline, diesel, and other valuable chemicals. The HGO composition, which has the most important influence on yield and product quality, depends on the crude used and the processes involved. In general, the bitumen-derived crude (BDC), which is rich in aromatics, including SCO, is not as good a source of FCC feed as conventional crude [3]. For this reason, refiners in North America limit the use of BDC in their conventional FCC-based operations. In 1998, Syncrude evaluated ten VGOs in a riser pilot plant [4]. These feeds, except one from conventional crude, were all derived from oil-sands bitumen, and were related to Syncrude’s existing or future potential processing schemes. It was important to assess their performances in catalytic cracking. Prior to the riser experiments, a comprehensive test program consisting of a series of microactivity (MAT) tests in fixed and/or fluid bed reactors was conducted at the National Centre for Upgrading Technology (NCUT), an alliance between the Federal and Alberta governments for oil sands research. Key objectives of the test program were to provide guidance for the pilot plant operation and to correlate results between the riser pilot plant and the MAT unit. Riser results were reported fully by Yui et al. [4] and partially by Ng et al. for brief comparisons of cracking yield and product quality [5,6,7] between the riser reactor and the MAT unit. One of the ten feeds studied was an oil sands untreated virgin HGO (343–525 °C) obtained from batch distillation of a whole bitumen, to simulate a commercial product from Syncrude’s vacuum tower. The riser study revealed that virgin HGO, despite its relatively high sulfur and nitrogen contents (being 3.25 wt% and 1930 wppm, respectively), could be accepted as a feed to the resid FCCU [4].
From 2011 to 2015, in an effort to enhance the competitiveness of Canadian oil sands bitumen in the world’s market, a test program was executed in which virgin HGO was co-processed with SCO HGO in different ratios for FCC evaluation. The primary objective was to facilitate regular catalytic cracking of the resid-free portion of raw bitumen, of which the poisoning effect could be mitigated by the presence of a good-quality SCO counterpart. This work presents some of our key findings, which indicate that the virgin HGO can be a premium commodity in terms of excellent processability for producing transportation fuels. This is significant as the process scheme investigated may lead to substantial cost saving and reductions of greenhouse gas (GHG) emissions by eliminating upgrading of virgin HGO. Note that studies of a similar nature, i.e., FCC co-processing of virgin HGO from oil sands with other petroleum feed, have never been reported in literature.

2. Results and Discussion

2.1. Material Properties

Properties of the prepared HGOs are given in Table 1, which are presented as if each SCO-bitumen blend was distilled to obtain the corresponding HGO fraction (343 °C–FBP). Please see Section 3.1 for feed preparation and explanation.
Table 1 shows that, of the two parent feeds—HGOs from SCO and bitumen—the former is of superior quality. This is reflected in its higher API gravity, contents of hydrogen and carbon, and H/C atomic ratios, but lower sulfur, microcarbon residue (MCR), and metals contents. The only exception is that SCO HGO contains more nitrogen, which poisons FCC catalysts. In regard to the hydrocarbon types, SCO HGO contains more saturates and less aromatics (including aromatic sulfur) and polars, which again indicates better quality. This ranking is further supported by the SCO HGO having higher contents of gasoline precursors and lower contents of light cycle oil (LCO) precursors. Gasoline precursors are defined as the sum of saturates and monoaromatics [8] and LCO precursors are defined as the sum of diaromatics, two-ring aromatic sulfur, and one half of three-ring aromatic sulfur [6]. The four blends resulting from the two parent feeds decrease in quality with decreasing content of SCO HGO.
An equilibrium catalyst (ECAT) supplied by Albermarle Catalysts International LLC was used in this study. Table 2 shows the properties of the equilibrium catalyst.
The catalyst used is characterized by relatively high alumina (51.0 wt%) and medium rare earth (0.8 wt%) contents (Table 2). The latter is used to boost the catalyst stability and activity [9]. The low nickel and vanadium contents indicate that this catalyst did not experience significant contamination during refinery or pilot FCC operations.

2.2. Conversion and Yield

The adjustable process variables in this study are the reaction temperature and the catalyst/oil (C/O or CTO) ratio. Cracking results are presented in two graphical formats: yield vs. CTO and yield vs. conversion. Yield is calculated by dividing the amount of the product by the amount of the feed.
Yield vs. CTO shows the direct response from a feed and a catalyst with varying test severity. These plots are helpful to explain behavior during cracking. Yield vs. conversion illustrates the product selectivity and is commonly used for data comparison and presentation by the refining industry. Note that CTO is an operating condition or “severity”, whereas conversion is a measurement of the produced lighter fractions, which have defined qualities. A conversion level can be achieved by changing catalyst activity (e.g., zeolite type, content, acidity, and coke on spent catalyst) and operation severity [e.g., CTO, weight hourly space velocity (WHSV), or reaction temperature]. For a given feed at a fixed temperature, the yield–conversion relationship is not as informative as the yield–CTO relationship due to the fact that for the former, both yield and conversion can be affected to some degree. Therefore, yield–CTO is a better choice for interpretation of test results. Another potential drawback of the yield–conversion plot is that comparisons of all feeds at the same conversion may not be possible. This is due to limitations from feedstock characteristics, or insufficient experimental data; an extrapolated trend line may be inaccurate or unreliable.
In this study, regression lines were established for the data. Regression types were selected based on the best (highest) correlation factor, except in a few cases where the model was known (e.g., linear correlation for coke vs. CTO and exponential correlation for dry gas or coke vs. conversion) [10]. The trend lines based on the best correlation are provided only to indicate directional relationships.

2.2.1. Conversion

Conversion is defined as the portion of the feed that is converted to gas and liquid product that has a boiling point below 221 °C, plus coke. Coke is the secondary product after cracking of the feed, and its yield constitutes part of the conversion. Mathematically, conversion is the sum of dry gas (H2, H2S, C1–C2, CO, and CO2), liquefied petroleum gas (LPG, C3–C4), gasoline (C5–221 °C), and coke. Conversion can also be calculated using the difference between 100 and the sum of unconverted products, for example, the light cycle oil (LCO, 221−343 °C) and the heavy cycle oil (HCO, 343 °C+).
Figure 1 shows the relationship between conversion and CTO for SCO HGO and its four blends with bitumen HGO at 500 and 520 °C. In this figure, the thinner curves with unfilled symbols are for the lower reaction temperature (500 °C), whereas the thicker curves with filled symbols are for the higher temperature (520 °C). Key observations from this figure are summarized below.
  • At a certain temperature, conversion of a feed increases with CTO, and levels off at high CTOs. This behavior is not unexpected, as higher CTO ratios will give a greater number of active sites on the catalyst on which feed molecules can be cracked. At high CTOs, the gasoline precursors (crackable components) are gradually used up, and the cracking rate will be reduced.
  • For a given feed, conversion is increased by an elevated temperature. This is explained easily, as an elevated temperature (1) promotes cracking, which produces more gases and more lighter liquid products, and (2) reduces the catalyst poisoning of basic nitrogen in the feed that is more prevalent at lower temperatures. At higher CTOs, the nitrogen effect is also reduced, as there is less nitrogen in the system, resulting from having less oil in contact with the same amount of catalyst. This explains the observed narrower conversion gap between two temperatures for the same feed as CTO increases (Figure 1). However, careful examination reveals that not all feeds increase in conversion at higher temperature to the same degree. In general, the better the quality of the feed (or the richer the SCO HGO in the feed), the larger the resulting conversion gap at the same CTO. This is because (1) the better feed with more gasoline precursors can be cracked better at a higher temperature (520 °C) to produce more light products, resulting in higher conversions across the whole CTO range, and (2) the better feed also contains more nitrogen, leading to lower conversions at a lower temperature (500 °C). The combined effect is responsible for the observed larger conversion gap between the two temperatures for the feed with better quality.
  • Perhaps the most surprising observation is that, at a given temperature (500 °C or 520 °C) and the same CTO, the order of conversion does not follow the order of feed quality-the blend containing 75 v% SCO HGO (called “75% feed” for simplicity) shows the highest conversion, followed by 100%, 64%, 61%, and 48% feed, in sequence. Possible explanations are as follows.
    Nitrogen content is lower in bitumen HGO at 1355 wppm as compared to 1584 wppm N in SCO HGO, and lower N feeds should crack better.
    In a comprehensive study involving ~30 different nitrogen compounds, Fu and Schaffer [11] reported that the poisoning effect of a nitrogen compound on cracking yields depended strongly on its molecular structure with respect to type of heterocyclic, molecular size, the numbers of nitrogen contained in rings, the degree of saturation, and the presence of alkyl substitutes. On the issue of degree of saturation, hydrogenation of heterocyclic rings can dramatically change the distribution of nitrogen types, e.g., conversion of a neutral compound such as pyrrole (C4H5N) to a base such as pyrrolidine (C4H9N).
    Bitumen HGO has a higher monoaromatics content than SCO HGO (28.9 vs. 23.0 wt%). This boosts the gasoline precursors (and FCC performance) of some of their blends, although bitumen HGO contains less saturates (Table 1).
    Being virgin in nature (not having been exposed to any cracking or reaction environment), bitumen HGO is believed to be more reactive than its counterpart from SCO in terms of having larger or bulkier molecules and longer aromatic side chains, which are easier to crack. The 75% SCO-HGO feed has more of these longer/bulkier molecules than the 100% SCO-HGO feed, and should behave better upon catalytic cracking.
Thus, with a limited addition of bitumen HGO in the blend, its conversion can be higher than that of the pure SCO-HGO. Lower conversion results only when the addition of bitumen HGO is increased to such a degree that the deterioration effect resulting from the refractory nature of bitumen HGO (in terms of polynuclear aromatics) becomes dominant. Thus, two effects appear to be in competition, one relating to nitrogen and gasoline precursors and the other to refractory aromatics.

2.2.2. Dry Gas Yield

Dry gas is a low-value FCC product, the yield of which should be reduced as much as possible. Figure 2a,b shows the variations of dry gas yield with CTO and with conversion, respectively, for the five feeds. Note that Figure 2b was derived from Figure 1 and Figure 2a. In Figure 2a, for a given feed, dry gas yield increases with severity (CTO or temperature), similar to conversion, but with increased temperature sensitivity. The components in the dry gas are secondary products from thermal cracking and catalytic cracking of gasoline and butenes, with thermal cracking contributing to more products than the catalytic cracking [12]. These cracking reactions are mostly nonselective, resulting in parallel yield profiles (product yields vs. conversion). The characteristics of nitrogen poisoning that were previously observed (Figure 1) are not present in Figure 2a. At the same temperature, the pure SCO HGO exhibits the lowest yield, followed by the 75, 64, 61, and 48% blends, in that order. In this case, the increase in dry gas yield with higher addition of bitumen HGO in the feed is largely due to the increased feed sulfur, which contributes 0.43 wt% H2S as dry gas per wt% S in feed for virgin feeds [3,13]. The selectivity curves (yield over conversion) in Figure 2b show more or less the same trends as in Figure 2a with respect to the yield-temperature relationship. Overall, the yield of dry gas, which is a final product in catalytic cracking, exhibits exponential increases with conversion for all feeds.

2.2.3. Liquefied Petroleum Gas Yield

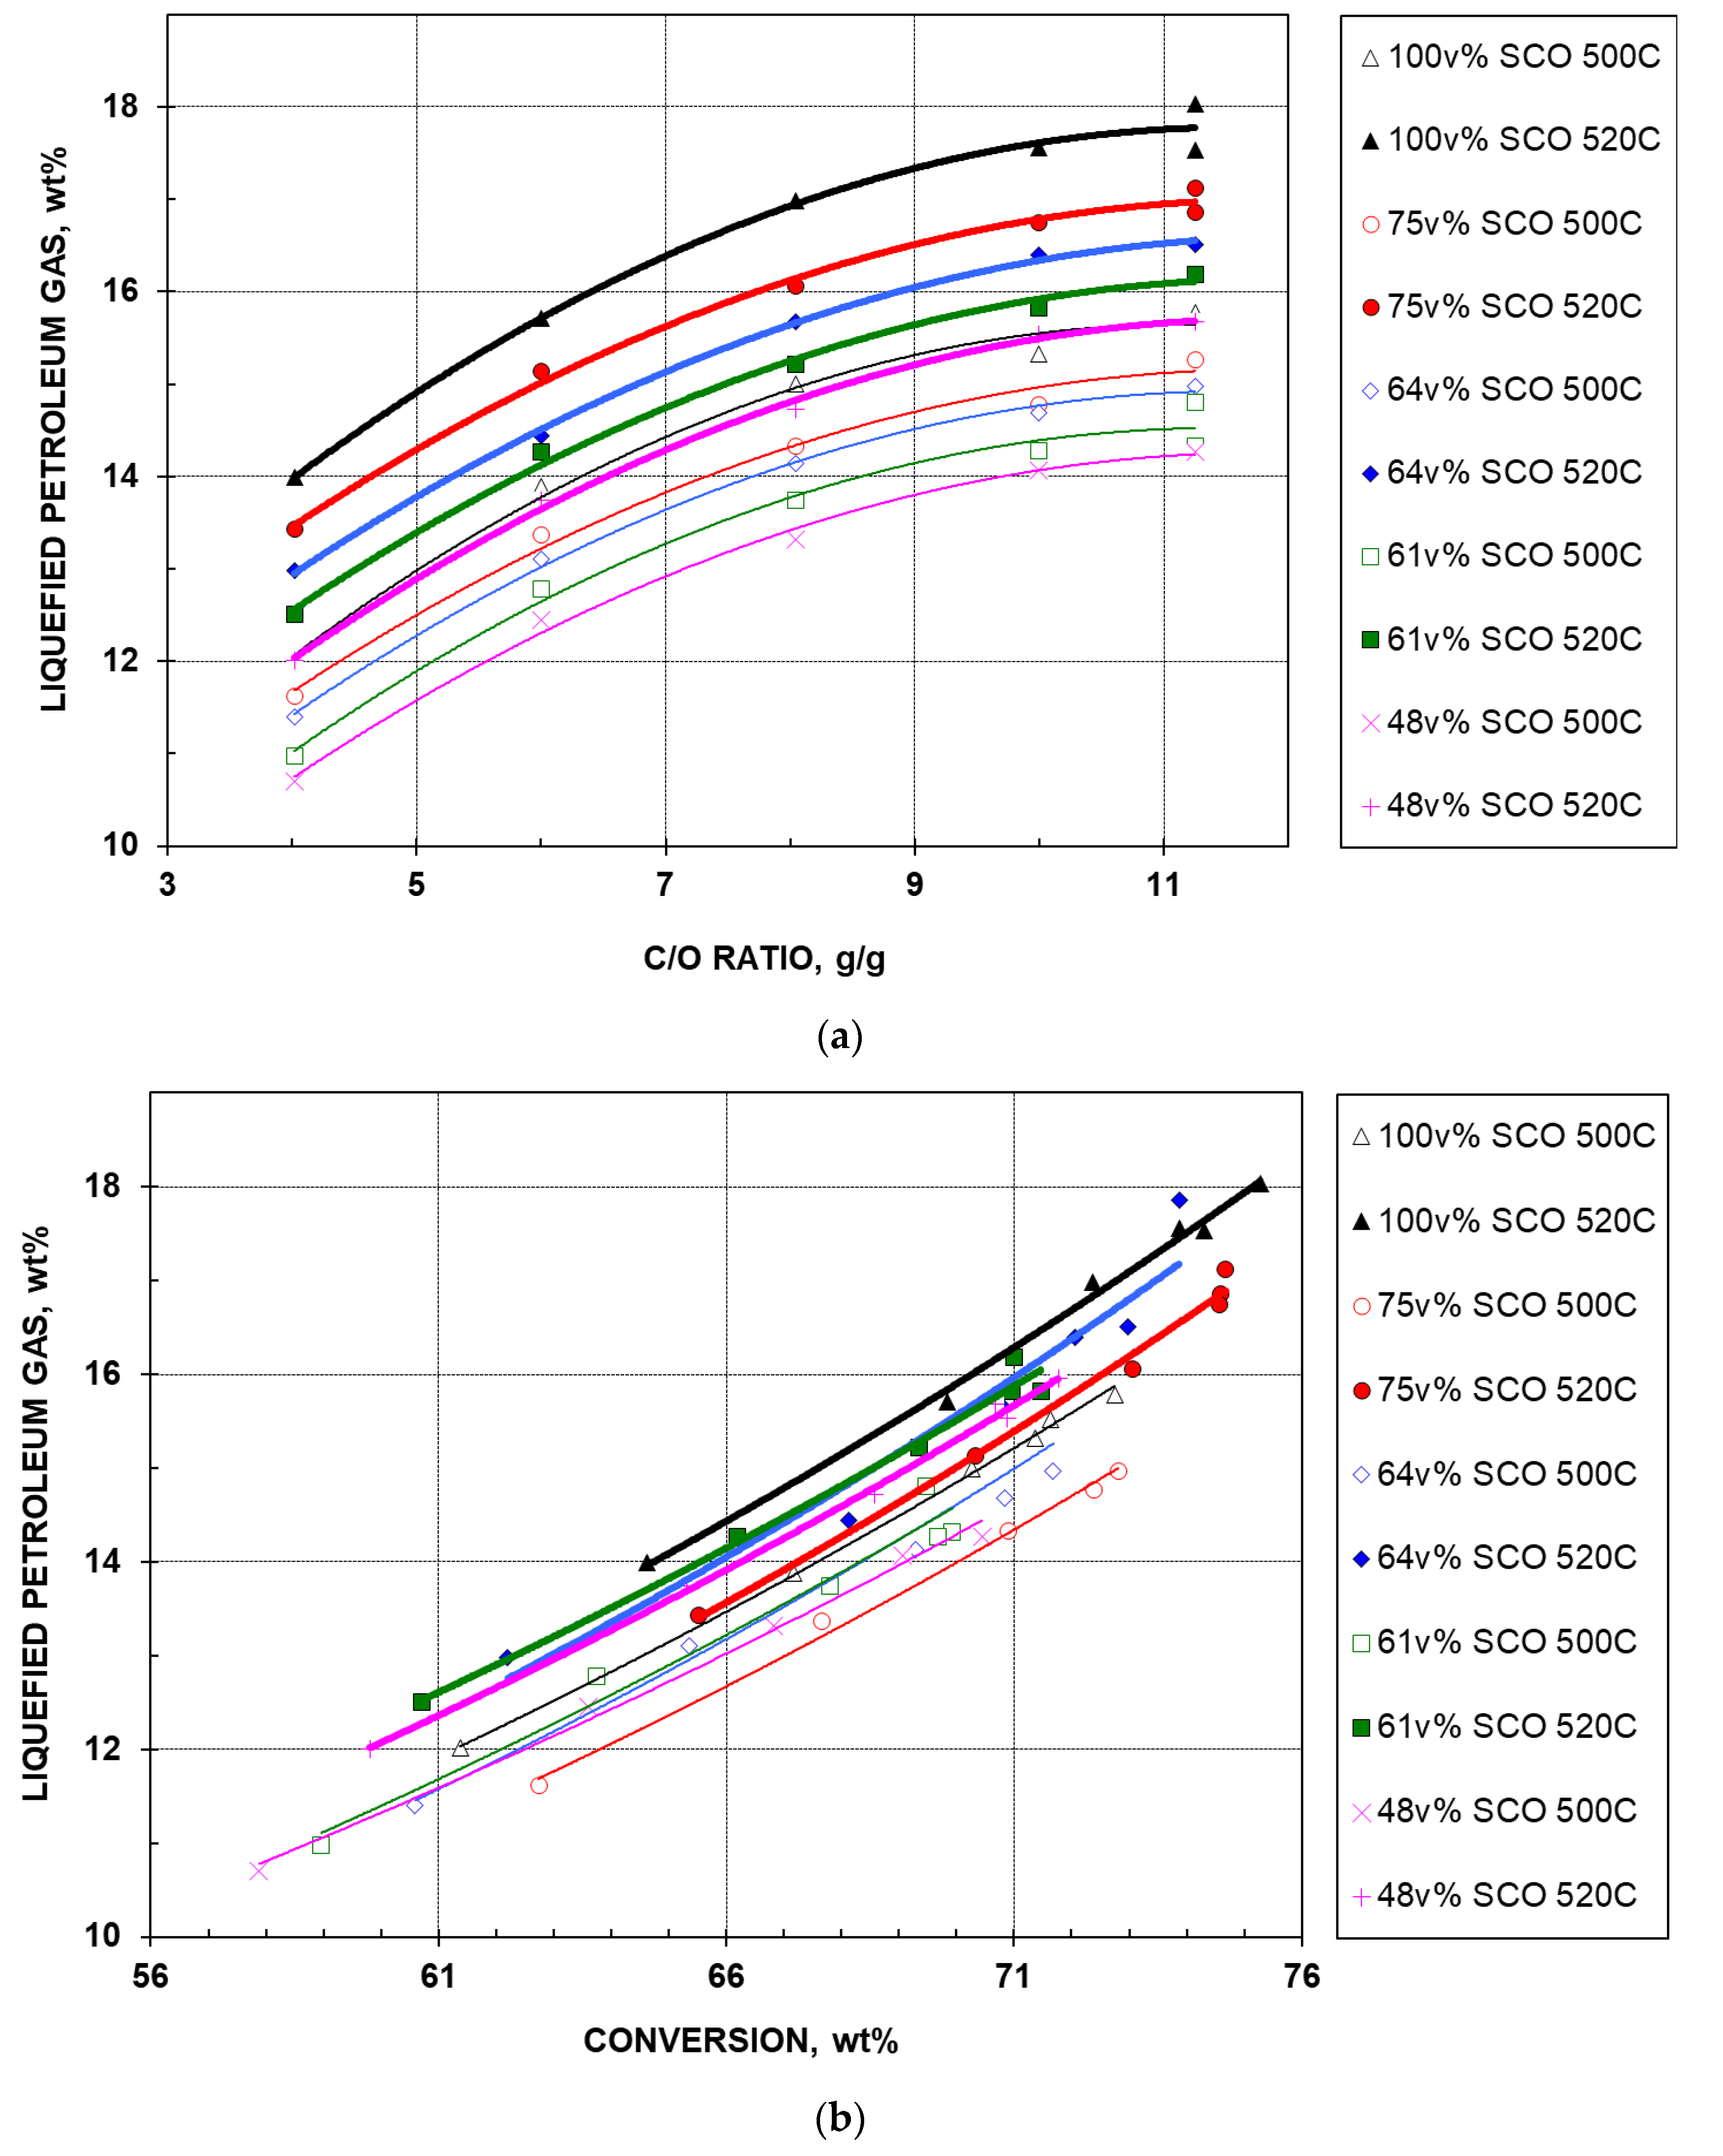
Liquefied petroleum gas (LPG) is a valuable product, as it contains components that can be used as feedstocks for alkylation and petrochemical processes. Figure 3a demonstrates that the variation of LPG with CTO is similar to that for conversion (Figure 1), except at the same temperature and CTO, SCO HGO gives the highest LPG yield, followed by the 75, 64, 61, and 48% feeds in agreement with the order of feed quality. Again, for the same feed at a given CTO, a higher temperature boosts the LPG yield. The better the quality of the feed, the greater the increase in LPG yield, resulting in a larger yield gap between the two temperatures. However, in the yield–conversion relationship as depicted in Figure 3b, there is a slight change in the order of LPG yield at the same temperature and conversion. The second highest LPG yield of the 75% feed in Figure 3a is masked by its highest conversion in Figure 1, leading to the lowest LPG yield at a given temperature and conversion (Figure 3b).

2.2.4. Gasoline Yield

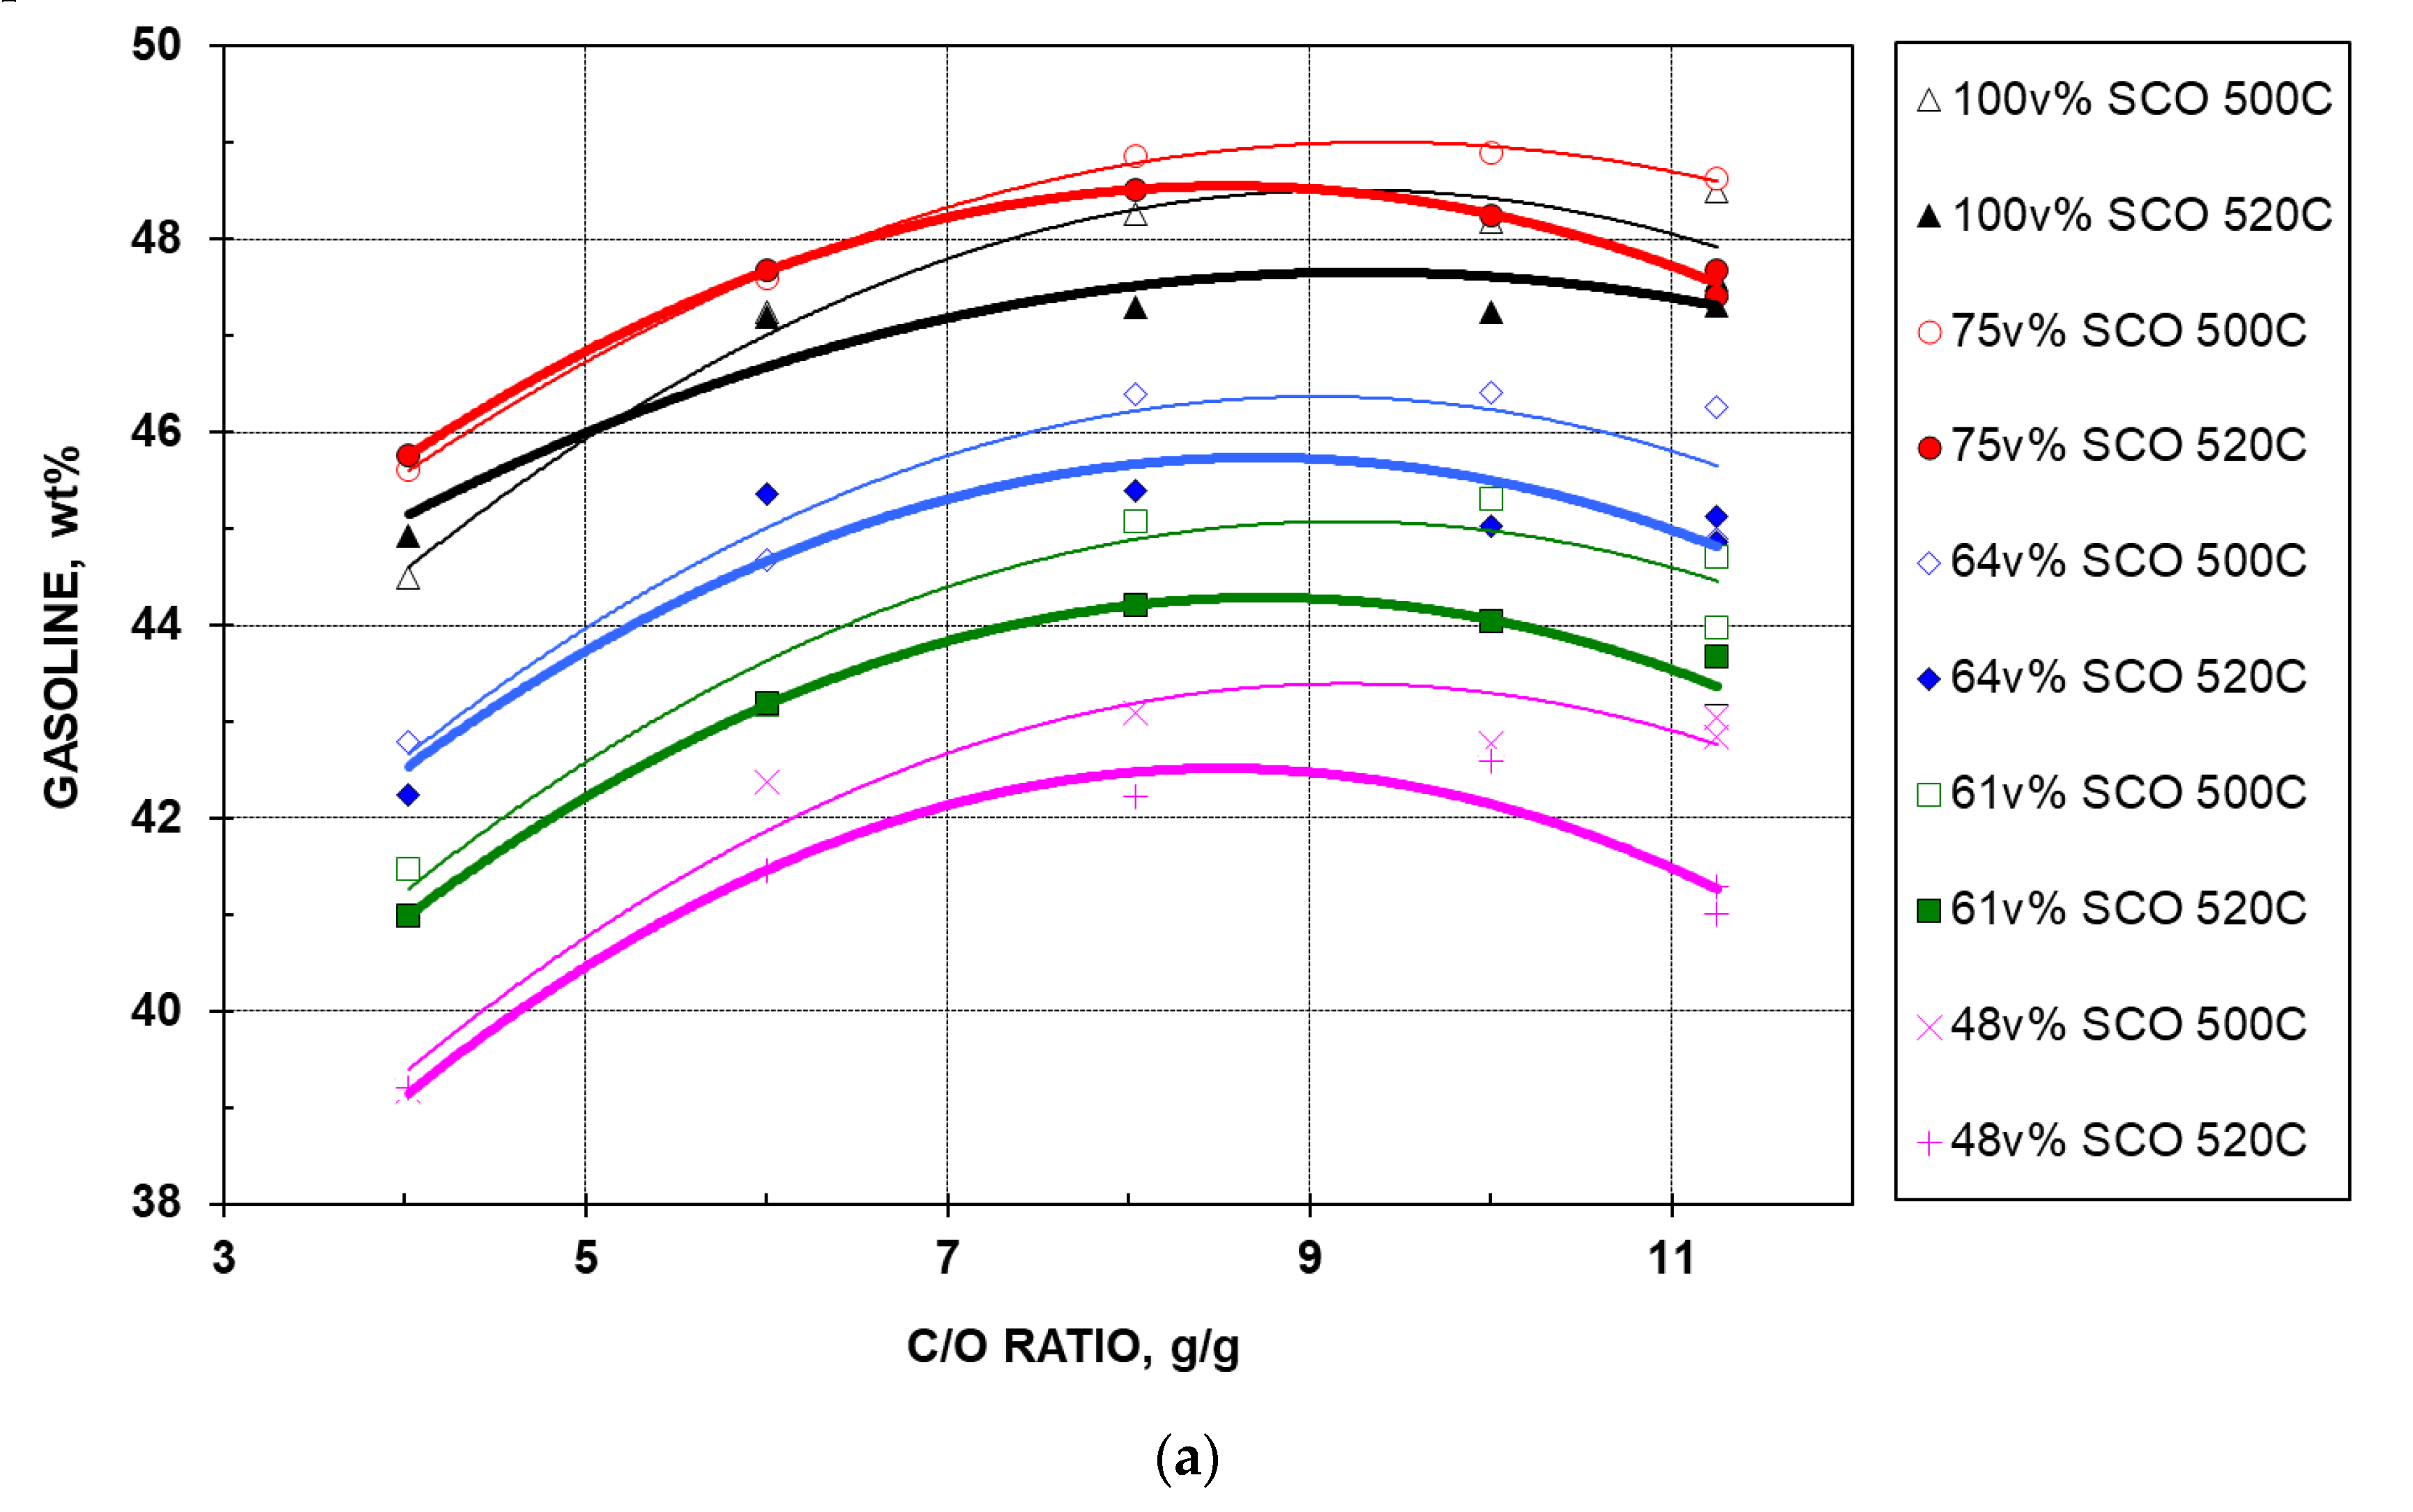
In North America, gasoline is the most desired product from FCC operation, and is the primary product. Figure 4a shows the variation of gasoline yield with CTO at 500 and 520 °C. The yield patterns look very different compared to those for dry gas and LPG. The data are analyzed as follows:
  • For the five feeds at a given temperature, gasoline yield increases with CTO, but only up to a certain point (at a CTO of ~9 at 500 °C), after which the yield begins to decline at higher CTOs. A maximum signifies that the rate of formation of gasoline from cracking of its precursors (i.e., feed, HCO, and/or LCO) is exceeded by the consumption of gasoline to produce LPG, dry gas, and coke. This behavior is usually termed “over-cracking”. For the same feed, the maximum is reached at a lower CTO when the temperature is higher. This is understandable, as higher temperature favors production of gases and coke at the expense of gasoline.
  • For the five feeds at a given CTO, gasoline yield decreases when the temperature is increased from 500 to 520 °C, except for the 100 and 75% feeds, which show an opposite trend at very low CTOs. The latter observation can be explained by the nitrogen poisoning effect (of the two nitrogen-rich feeds), which is reduced at higher temperature (520 °C). The gap between the two yield curves at different temperatures widens as CTO increases, which is attributable to the earlier over-cracking (at a lower CTO) of the feed cracked at a higher temperature (520 °C), as mentioned above.
  • As in the case of conversion, among the five feeds at a given temperature and CTO, the 75% feed gives the highest gasoline yield, followed by the 100%, 64%, 61%, and 48% feeds, in sequence. Again, the lower nitrogen content and the virgin nature of bitumen HGO in the blend is believed the key factor contributing to the high gasoline yield of the 75% feed. However, the poisoning effect of polynuclear aromatics comes into play, resulting in low gasoline yields at elevated additions of bitumen HGO.
  • Figure 4a was converted into Figure 4b through the conversion–CTO relationship that is shown in Figure 1. In Figure 4b, over-cracking phenomena are observed at 520 °C with an overall general trend, indicating that the occurrence of over-cracking depends on the aromatic content of the feed—when aromatics content is higher, the maximum appears at a lower conversion. Higher temperature can shift over-cracking to a lower conversion. The above observation agrees well with our previous finding [14]. Figure 4b also confirms the superior performance of the 75% feed, which gives the highest gasoline yield, as well as the order of performance of all five feeds at a given temperature.

2.2.5. Light Cycle Oil Yield

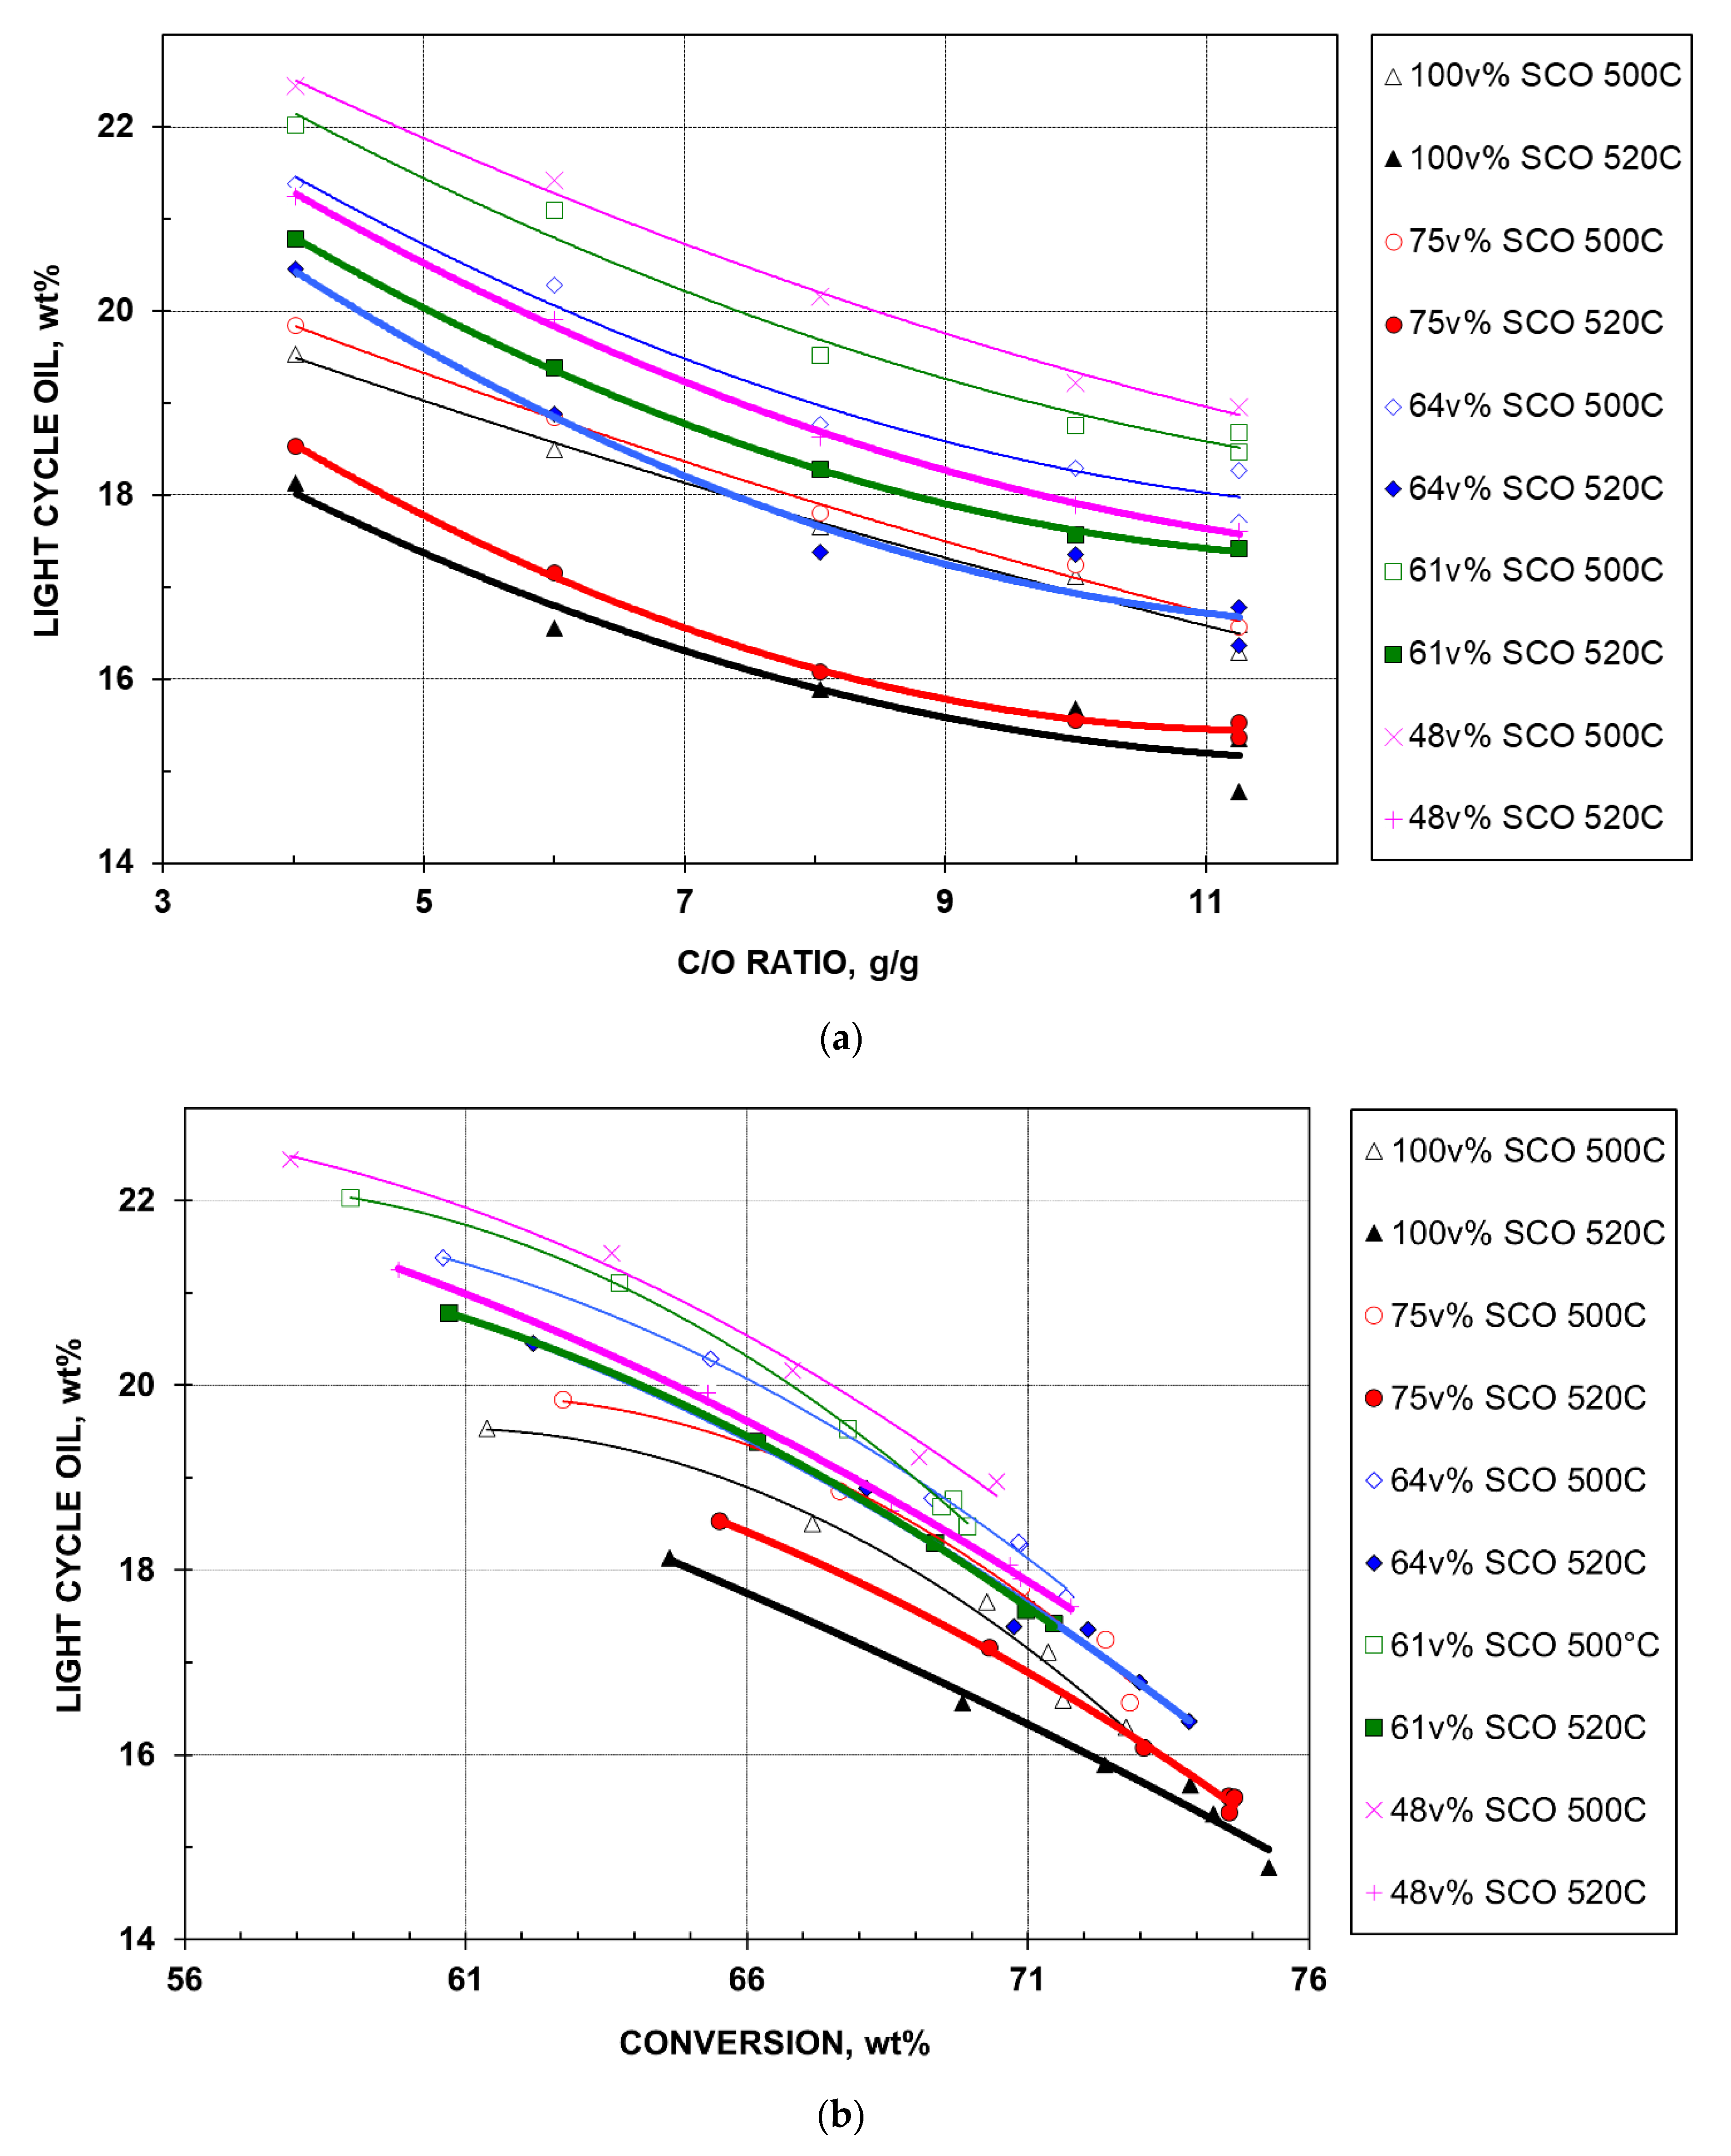
Light cycle oil (LCO) is an unconverted product that has varying value depending on where the refinery is located. In Europe, China, and USA, many refiners have regular or seasonal adjustments in LCO production to meet increased transportation diesel fuel demand or to avoid heating oil shortages in the winter. In the western USA and Canada, LCO has a lower market value due to the preference for natural gas for home heating, and/or warmer weather. As a transportation fuel, LCO is high-sulfur and rich in aromatics, so it requires further hydrotreatment prior to blending in the diesel pool. Therefore, LCO is not a highly desirable product. Figure 5a shows the LCO yield as a function of CTO. Key observations are summarized below.
  • For a given temperature and feed, LCO yield decreases monotonously and in parallel with CTO. At high CTOs, the concave yield curves level off, approaching the limit of LCO precursors, which is defined as the sum of diaromatics, 2-ring aromatic sulfur, and half of the 3-ring aromatic sulfur [6]. This definition assumes that the remaining core compounds will boil in the LCO range (221–343 °C) after the precursor side chains are removed.
  • At a given temperature and the same CTO, among the five feeds, the 100% SCO HGO feed exhibits the lowest LCO yield, followed by the 75, 64, 61, and 48% feeds, sequentially. This is in agreement with their respective LCO precursor contents in Table 1. However, Figure 5a seems to reveal that the 75% feed is cracked excessively, with LCO yield close to that of the 100% feed. Again, this is credited by the lower nitrogen content and the virgin nature of bitumen HGO in blend.
  • For the same feed at a given CTO, LCO yield is observed to decrease at higher temperatures. This helps drive the cracking of large molecules (e.g., those found in LCO) into smaller molecules (gases and gasoline). However, the yield gap between the two temperatures seems to depend on the feed quality, with the 100% SCO HGO feed showing the largest gap.
  • The LCO selectivity (yield over conversion) plot is shown in Figure 5b, which combines Figure 1 and Figure 5a. Nearly all yield curves exhibit convex decreases. In theory, they should merge (by definition of conversion, see Section 2.2.1) at 100 wt% conversion with 0 wt% LCO. Note that the five feeds contain 1.9 to 4.8 wt% material in the LCO boiling range (Table 1). Thus, when catalytic cracking occurs, the LCO yield of each feed should initially increase, and then decrease after reaching a maximum (as conversion increases). This behavior is not observed in Figure 5b. In Figure 5b, the maxima occur at lower conversions, which are not attained in this study.

2.2.6. Heavy Cycle Oil Yield

Heavy cycle oil (HCO) is an unconverted product with low value and comparatively high contents of aromatics and sulfur. Figure 6a shows the HCO yield–CTO plot for the five feeds at two temperatures. The patterns of yields of Figure 6a is similar to that of LCO (Figure 5a) except that, at a given temperature and the same CTO, the 75% feed displays the lowest HCO yield, followed by the 100 and 64 (the two almost overlap), 61, and 48% feeds at 520 °C. The trend at 500 °C for yields of the 100, 64, and 61% feeds, which vary in a rather narrow range, is less certain because of the greater scatter in the data. For the same feed at a given CTO, HCO yield is lower at the higher temperature, similar to the case of LCO. The cracking behavior observed in Figure 6a is explainable by using the same arguments that were described for LCO.
Figure 6b shows that as conversion increases, there are monotonic concave decreases in HCO yield. Again, in theory, all yield curves should merge at 100 wt% conversion with 0 wt% HCO. In a selectivity plot, the magnitude of HCO yield of a feed at a selected conversion should be reversed to that observed for LCO by using the relationship: HCO = 100 – conversion – LCO = Constant – LCO.

2.2.7. Coke Yield

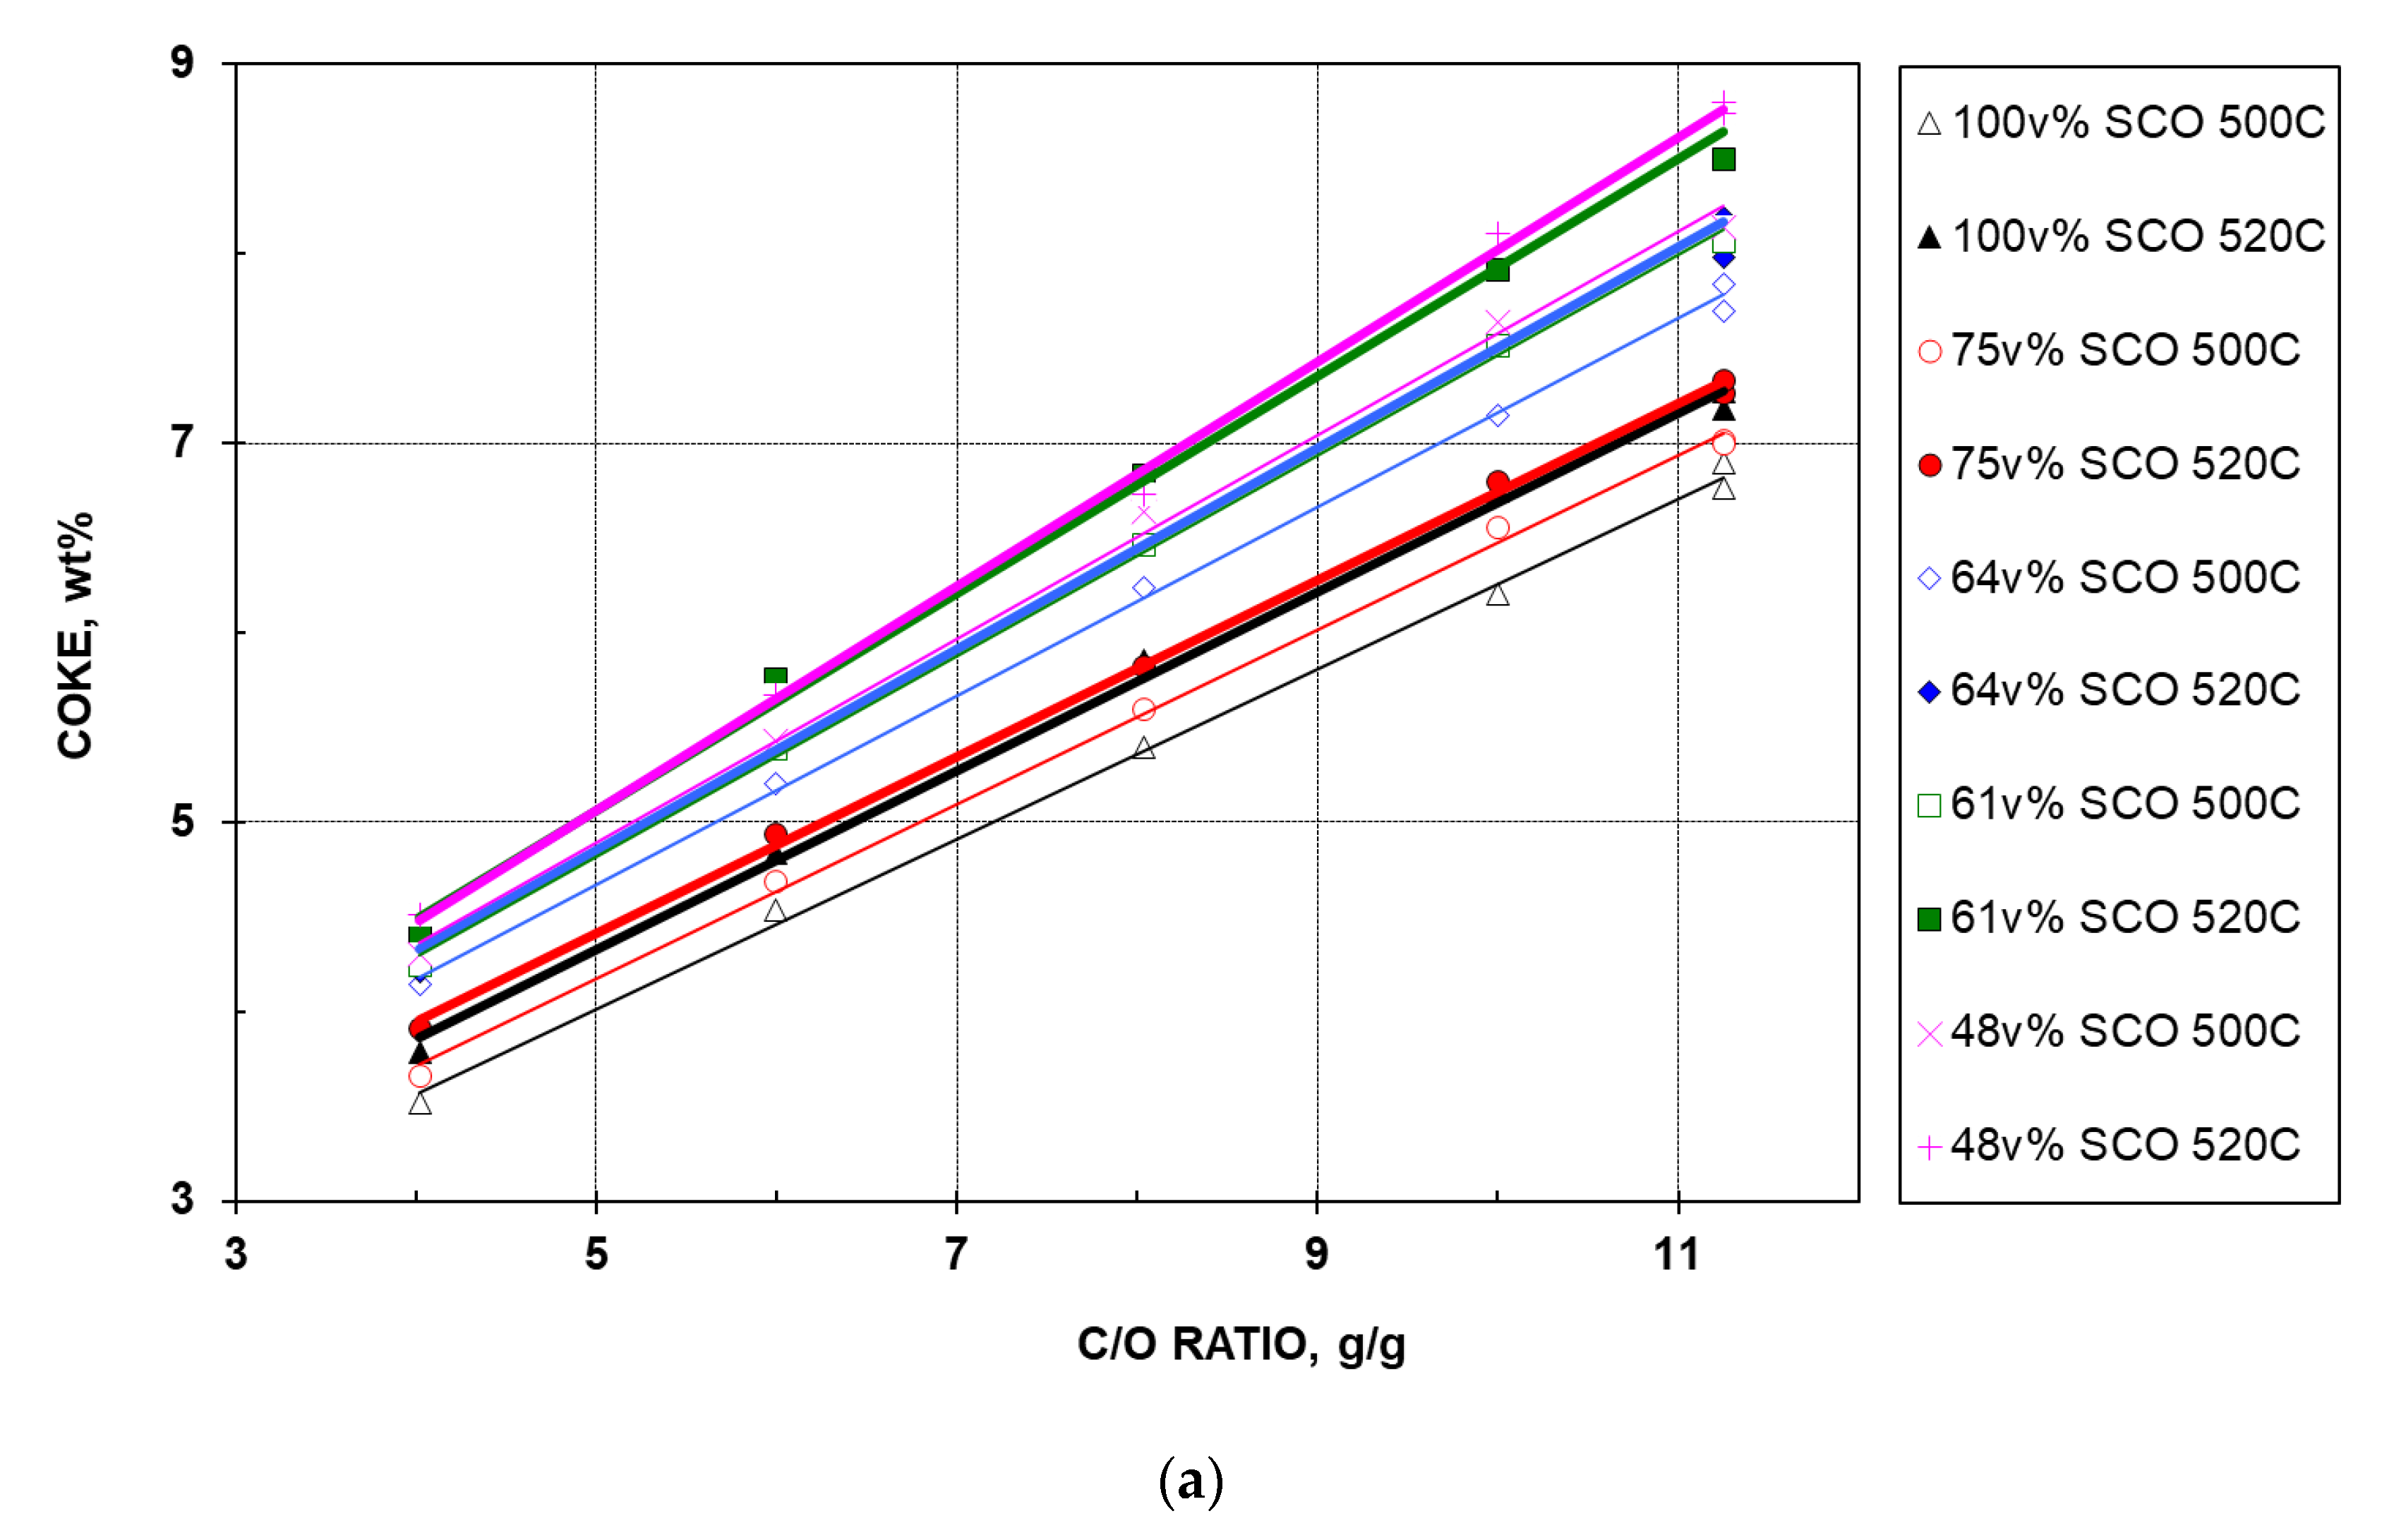
In the operation of FCC units, it is necessary to have coke to supply the heat for preheating of the feed, and cracking. However, if too much coke is present, it can cause poisoning of the catalyst and can overload the air blower during catalyst regeneration; this results in excessively high temperatures in the regenerator. Figure 7a displays coke yield as a function of CTO. Key observations are summarized below.
  • For the five feeds at a given temperature, coke yield increases linearly with CTO.
  • For a given feed and CTO, coke yield increases with elevated temperature. This increase is understandable as a higher severity (either CTO or temperature) promotes cracking with coke as a product.
  • At a given temperature and the same CTO, coke yield depends on the feed quality. In line with theory, the 100% SCO HGO feed, containing the least aromatics (Table 1), gives the lowest coke yield, followed by the 75, 64, 61, and 48% feeds, sequentially. Note that the difference between coke yields of the two best feeds at 520 °C is minimal.
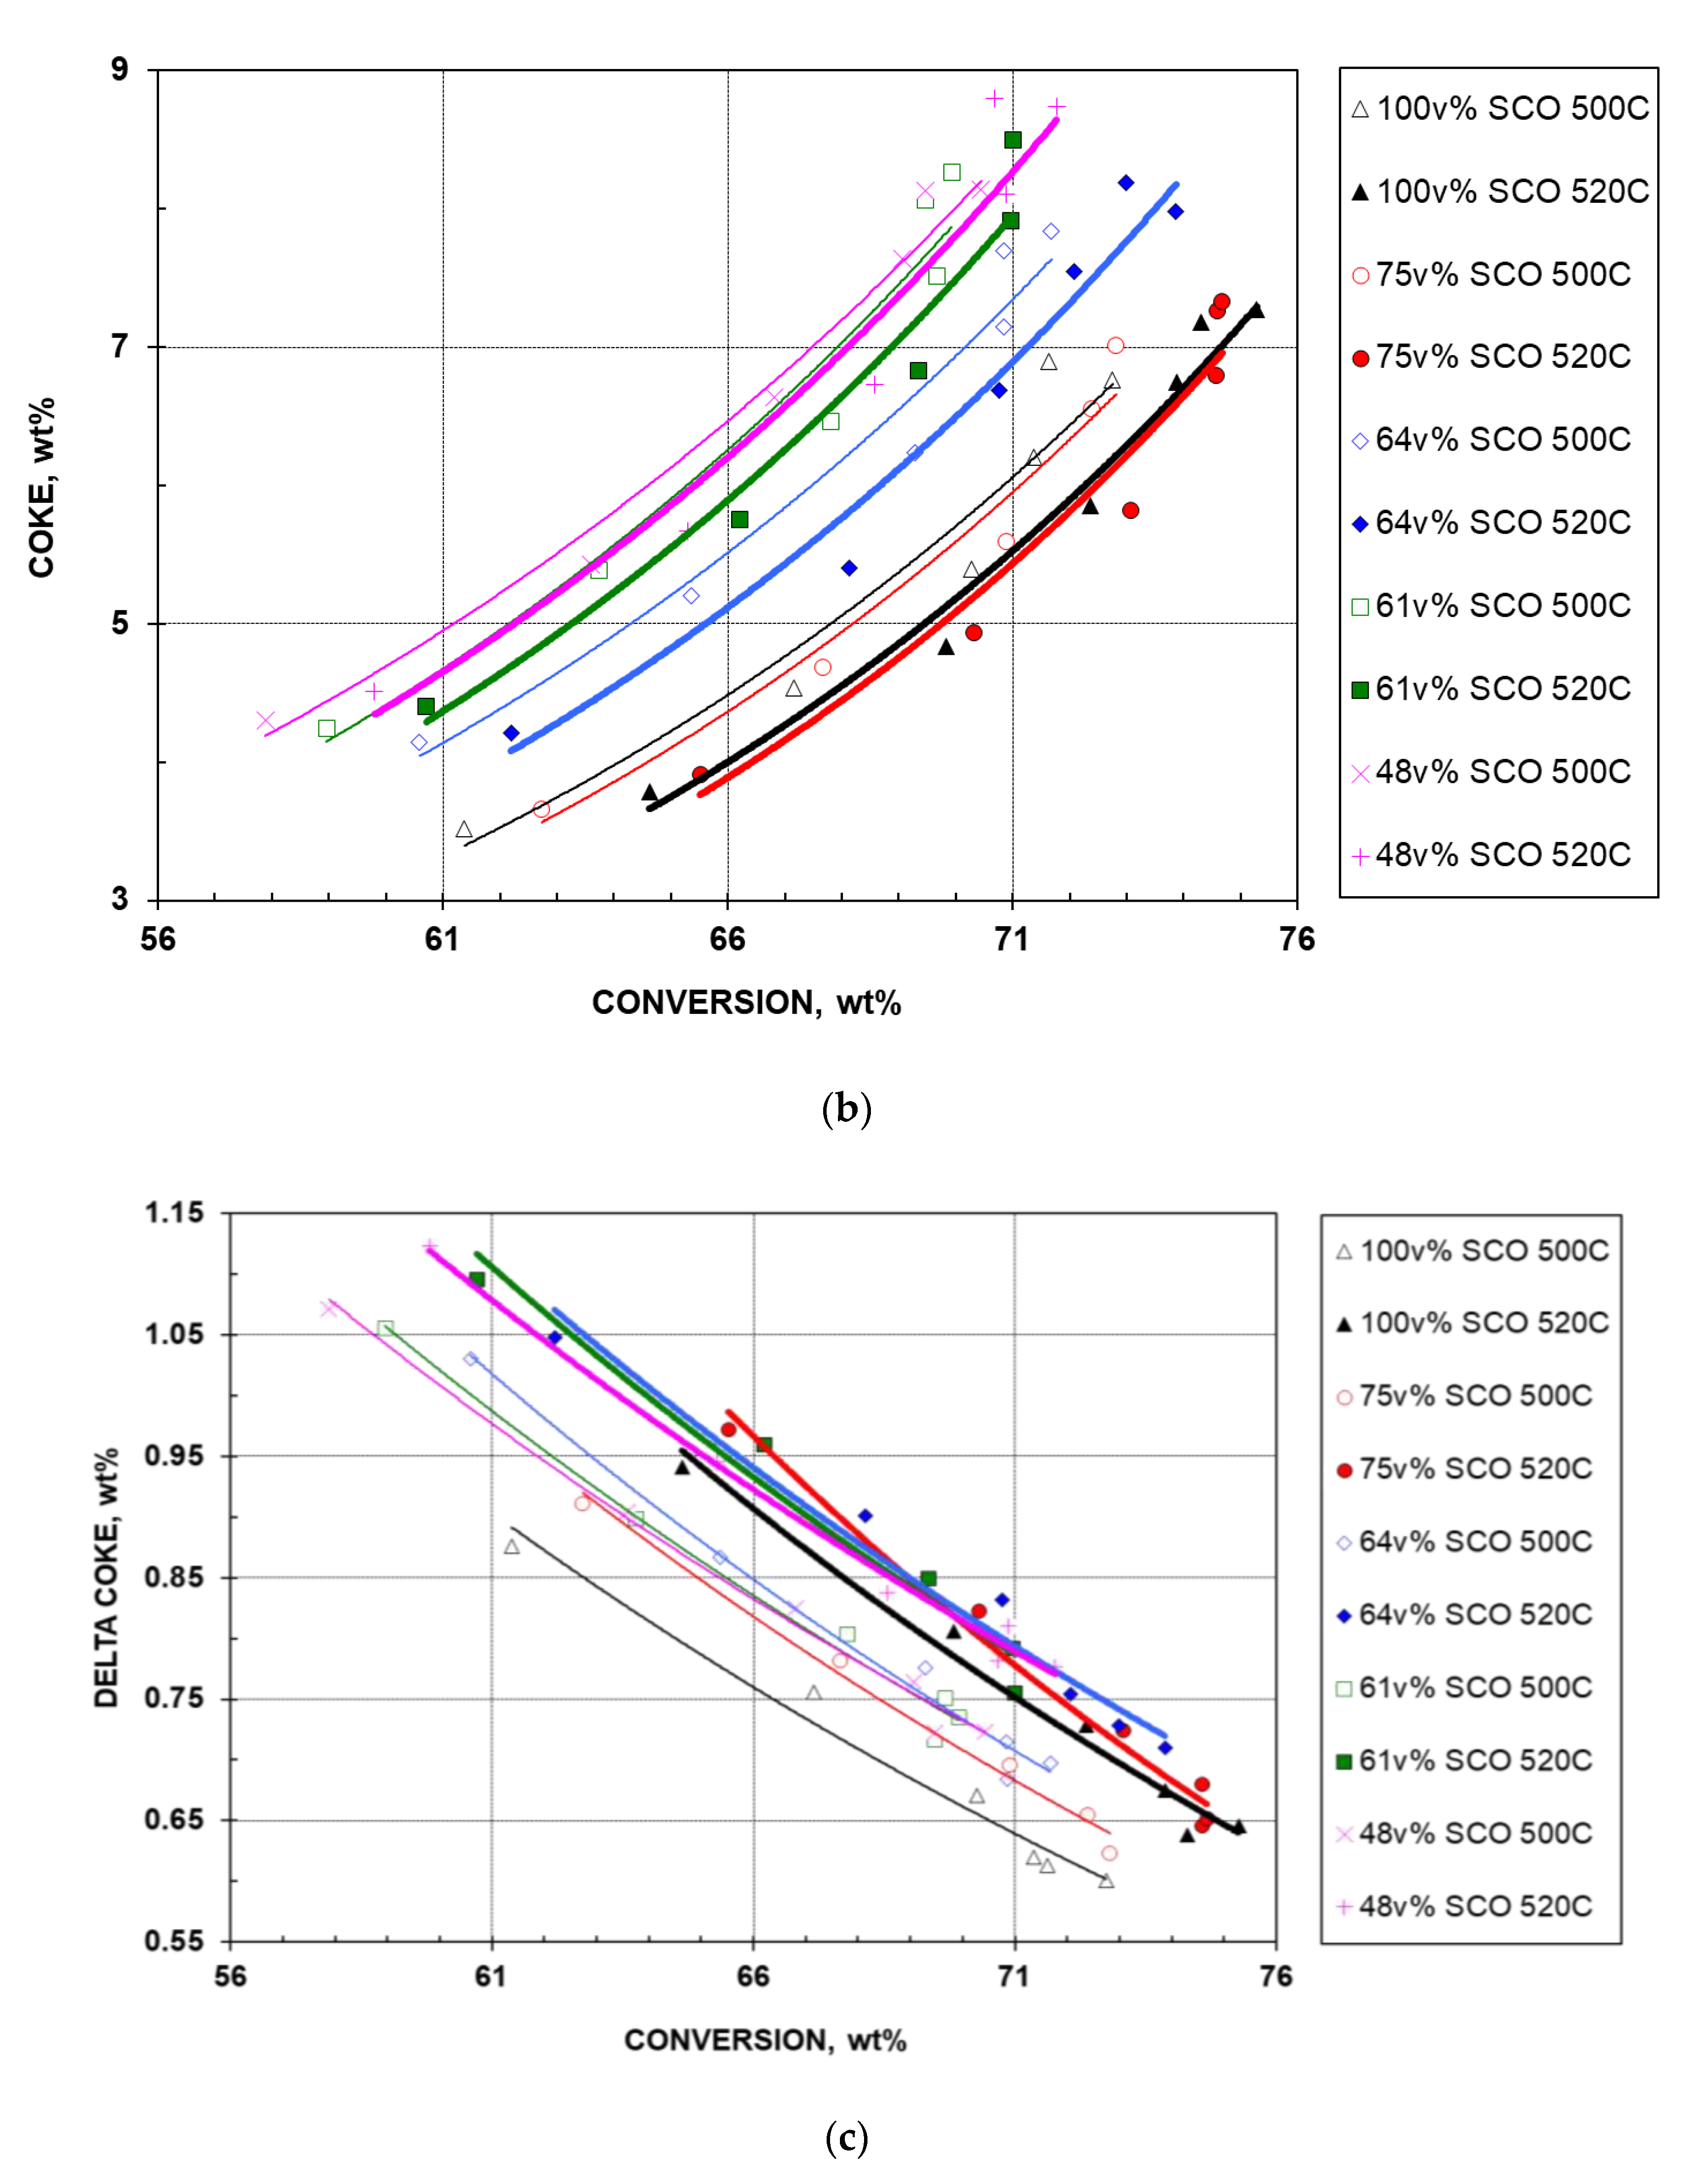
  • The corresponding coke selectivity plot derived from Figure 1 and Figure 7a is shown in Figure 7b. For the five feeds at a given temperature, coke exhibits an exponential increase in yield at higher conversions. For the same feed at a given conversion, a decreased coke yield is observed as temperature increases. At a given temperature and the same conversion, coke yield decreases with improved feed quality except for the 75% feed, which exhibits slightly lower coke yield than the best feed, the pure SCO HGO. These observations can be explained by the data in Figure 1 and Figure 7a.
In commercial FCC operation, refiners are particularly concerned with delta coke, which is a more salient parameter than coke yield for controlling regenerator temperature. Delta coke is defined as the difference between the coke on the spent catalyst and the coke on the regenerated catalyst. If the coke on the regenerated catalyst becomes zero, then delta coke is the amount of coke generated on the catalyst during the reaction. Delta coke can be calculated as the coke yield divided by the cat/oil ratio. Figure 7c illustrates the changes of delta coke as a function of conversion at two reaction temperatures. For a feed at a given temperature, delta coke decreases with increased conversion. For the same feed at a given conversion, delta coke increases with increased temperature, which boosts the coke yield (Figure 7a). In general, at a given temperature and the same conversion, delta coke decreases as feed quality improves. The above observations in Figure 7c can be explained from the delta coke definition in combination with Figure 1 and Figure 7b.

2.3. Assessment of Blends as FCC Feeds

Figure 8 shows the relationship between SCO HGO addition and product yields at two temperatures and at 72 wt% conversion where the 75% feed exhibits the maximum gasoline yields (Figure 4b). Key observations are as follows.
  • At a given temperature, as feedstock quality decreases with lower SCO HGO addition, the gasoline first increases then decreases; the LPG and coke first decrease (based on data point, not trend line, for coke) then increase; dry gas, LCO, and delta coke increase at all times (very minor increase for delta coke); and HCO decreases at all times.
  • Among the blends at a given temperature, the 75% feed is no doubt the best FCC feed which outperforms the 100% SCO-HGO feed with higher gasoline and diesel and lower HCO and coke, although there is a mild increase in dry gas and a drop in LPG.
  • HGO from Synsynbit with 64 v% SCO addition also behaves acceptably with a small decrease in gasoline and a slight increase in diesel.
  • HGO from Synbit containing more than 50 v% bitumen is, of course, expected to perform relatively poorly. Given the much lower market price of synbit, this option may still be worth considering.
  • Increasing the temperature from 500 to 520 °C reduces gasoline, LCO, and coke, but increases all gaseous products, HCO, and delta coke (very little increase for delta coke).

3. Experimental

3.1. Materials

Samples of raw oil sands bitumen and commercial SCO were obtained from Syncrude Research Centre, Edmonton, Alberta, Canada. These materials were distilled using ASTM D5236 [15] (vacuum potstill method; distillation unit made by B/R Instrument, Easton, MD, USA) to produce HGOs (343–525 °C cut from the bitumen and 343 °C–FBP cut from the SCO). From these two HGOs, four SCO-HGO/bitumen-HGO blends were prepared containing 75, 64, 61, and 48 v% SCO HGO; 100% SCO HGO was also tested in this study. Note that HGO from SCO combined with HGO from bitumen in an x:y ratio is equivalent to HGO distilled from a blend containing SCO and bitumen in the same x:y ratio. The former is more practical to perform and was therefore used in the experiments. Properties of the five feeds for this study are given in Table 1 which have been presented and discussed previously in Section 2.1. Feed analyses in Table 1 were performed using ASTM and other supplementary methods: density of petroleum liquids by ASTM D4052 (Mettler Toledo DE45 Density Meter, Mississauga, ON, Canada); carbon and hydrogen by ASTM D5291 (instrumental CHN analyzer; Elementar VarioMICRO cube, Ronkonkoma, NY, USA); total sulfur by ASTM D4294 (X-ray fluorescence spectroscopy; Oxford Instruments X-Supreme, Scotts Valley, CA, USA); trace nitrogen by ASTM D4629 (syringe/inlet combustion and chemiluminescence detection; Antek Instruments Model 9000HTNS, Houston, TX, USA); Micro Carbon Residue (MCR) by ASTM D4530 (Alcor MCRT 130 Micro Carbon Residue Tester, San Antonio, TX, USA); nickel and vanadium by ASTM D8110 (inductively coupled plasma mass spectrometry (ICP-MS); Agilent ICP-OES 5110, Agilent Technologies, Santa Clara, CA, USA); and simulated distillation (up to 615 °C) by ASTM D2887Ext (gas chromatography; Hewlett Packard HP6890-G1530A, Agilent Technologies, Santa Clara, CA, USA). For hydrocarbon types analysis, the sample was first separated into saturates, aromatics, resins (polars), and asphaltenes (SARA) by ASTM D2007 (clay–gel absorption chromatographic method). The first two fractions were further analyzed individually by ASTM D2786 and D3239 (high ionizing voltage mass spectrometry; Hewlett Packard HP6890-G1530A with 5973 Mass Selective Detector, Agilent Technologies, Santa Clara, CA), respectively.
The parent feeds of the two blends containing 64 and 48 v% SCO HGO were referred to as synsynbit and synbit, respectively. An earlier marketability study [16] on oil sands products in Asian countries predicted that (1) synsynbit, the bitumen blended with SCO to approximate the quality of Middle East light sour crudes, would realize larger export volumes and diversity of marketability than those for the sweet SCO, and (2) Asian refineries would be able to accept synsynbit without major modifications to their refinery infrastructure.
This study used an equilibrium catalyst (ECAT), supplied by Albermarle Catalysts International LLC (Charlotte, NC, USA). Table 2 in Section 2.1 gives some properties of this catalyst. The catalyst was first screened on 60 and 400 Tyler mesh sieves (corresponding to 400- and 38-µm openings, respectively) following the procedures recommended by the supplier of the reaction unit. The on-size particles were then calcined at 600 °C for 4 h, and were then loaded into the six hoppers of the reaction unit.

3.2. Apparatus

A reaction unit called the “Advanced Cracking Evaluation” (ACE) unit, supplied by Kayser Technologies (Houston, TX, USA), was used in this work. A detailed description of this unit and its operation have been reported previously [14,17,18,19].

3.3. Experimental Conditions

Catalytic cracking runs were performed at atmospheric pressure, with a constant load of 9 g equilibrium catalyst heated at two reaction temperatures: 500 ºC and 520 ºC. A total of six runs per batch of ACE test per feed at catalyst/oil (C/O or CTO) ratios of 4, 6, 8, 10, and 11.25 (11.25 ran twice) g/g were conducted for each temperature. A feed of 100% bitumen HGO was not run due to poor FCC performance, as reported previously [4,10]. With a constant injection rate of 1.2 g/min, which gave an 8 h−1 weight hourly space velocity (WHSV), oil injection time was varied to obtain the desired CTO through the relationship WHSV = 60/[(C/O) × t], where t is the feed delivery time (feed injection time) in minutes and C and O are weights of catalyst and feed, respectively, in grams. The adjustable process variables were the reaction temperature and CTO. A liquid stripping time of seven times the oil injection time was chosen. At the end of the stripping period, spent catalyst was regenerated in situ in the presence of air, and the fluid-bed temperature was programed from the reaction temperature to 720 ºC to accelerate combustion. The exhaust gas containing CO2 and CO went through a catalytic converter (with CuO as oxidizer) to convert CO to CO2. The level of CO2 was quantitatively monitored by an online infrared (IR) analyzer and the exhaust gas flowrate was recorded. At the end of regeneration, the system stopped collecting data on CO2 once its level in the exhaust gas fell below 0.3 v%. Mass of carbon on the catalyst was calculated based on the ideal gas law. Coke yield was obtained by applying a carbon-to-coke factor of 1.0695, with an assumption that one mole of hydrogen is approximately associated with one mole of carbon in coke composition.

3.4. Error Analysis of ACE Data

In this work, all runs are within 96 to 102 wt% mass balance as required by ASTM D7964 [18]. The average mass balance and the standard deviation of 60 runs (5 feeds × 6 CTOs × 2 temperatures) are 99.24 and 1.83 wt%, respectively. These values compare quite well with their counterparts in ASTM D7964 (being 99.124 and 1.521 mass%). Note that the precision of this ASTM method is based on an interlaboratory study in which seven laboratories participated. Each laboratory was asked to report twelve replicate test results for a single FCC catalyst. Table 3 shows the repeatability data of our work on conversion and yields at 11.0 CTO and two temperatures for five feeds. In Table 3, other than a bad run (Run 950 with 75% feed at 500 °C), which was not used for plots involving conversion, plus a few sets of HCO data (two out of ten including that from Run 950), the difference between two results (conversions or yields) at a temperature relative to their mean is less than 8% (less than 5% in most cases). Thus, we may conclude that the observed variations of test results are really due to the effects of CTO and temperature rather than due to the experimental error.

4. Conclusions

  • Virgin HGO from raw bitumen contains less nitrogen than its counterpart from SCO, and has relatively low Ni + V and MCR. These poisons impose no serious threat to the cracking catalyst. As a result, in the presence of a suitable amount of SCO HGO, the cracking performance of the blend, in terms of conversion and yields of gasoline, diesel, and coke, improves. It can be accepted as FCC feed.
  • The major challenge is the mild increase in the dry gas yield, notably due to the augmentation of H2S, and higher sulfur levels in gasoline and diesel, which may need desulfurization prior to being sent to gasoline and diesel pools.
  • For a given HGO blend at a constant conversion, higher cracking temperature produces more dry gas and delta coke and less gasoline. Thus, it is advantageous to crack the blend at a lower temperature, thereby reducing secondary reactions.
  • In this study, overcracking, where gasoline started to decline at a given conversion, is observed in many occasions. This is governed by the aromatics in the feed―the higher the aromatics, the lower the conversion at which overcracking is observed. Higher temperature can shift overcracking to a lower conversion.
  • Gasoline yield is strongly affected by gasoline precursors, defined as feed saturates plus monoaromatics, whereas LCO yield is by LCO precursors, defined as the summation of diaromatics, 2-ring aromatic sulfur, and 1/2 of the 3-ring aromatic sulfur.

Author Contributions

Conceptualization: S.H.N.; Data curation: S.H.N., N.E.H., Y.Z., and J.W.; Formal analysis: Q.L., F.D., and H.W.; Funding acquisition: S.H.N. and E.L.; Investigation, S.H.N., N.E.H., Y.Z., H.L., and H.W.; Methodology, N.E.H., Y.Z., and Q.L.; Project administration: S.H.N. and E.L.; Resources: Y.Z., E.L., and F.D.; Software: H.L. J.W., and F.D.; Supervision: Y.Z., J.W., and F.D.; Validation: J.W., H.L., Q.L., and H.W.; Visualization: J.W. and H.L.; Writing—original draft preparation: S.H.N. and N.EH.; Writing—review and editing: S.H.N., N.E.H., Y.Z., E.L., and H.W. All authors have read and agreed to the published version of the manuscript.

Funding

No external funding.

Acknowledgments

The authors wish to thank the analytical laboratory of the CanmetENERGY Devon research centre for technical support, Syncrude Canada for supplying the synthetic crude oil, and Albermarle Catalysts International LLC for supplying the equilibrium catalyst. Partial funding for this study was provided by Natural Resources Canada and the government of Canada’s interdepartmental Program of Energy Research and Development (PERD).

Conflicts of Interest

The authors declare no conflicts of interest.

References

  1. Yui, S. Producing quality synthetic crude oil from Canadian oil sands bitumen. J. Jpn. Petro. Inst. 2008, 51, 1–13. [Google Scholar] [CrossRef] [Green Version]
  2. Yui, S.; Dodge, T. Producing quality diesel fuel and FCC feedstock from bitumen-derived heavy gas oils by hydrocracking. The Commemorative International Symposium on the 50th Anniversary of JPI/38th Petroleum-Petrochemical Symposium of JPI. Jpn. Petro. Inst. 2008, 121. [Google Scholar] [CrossRef]
  3. Ng, S.H.; Wang, J.; Fairbridge, C.; Zhu, Y.; Yang, L.; Ding, F.; Yui, S. Study of Canadian FCC feeds from various origins and treatments. 1. Ranking of feedstocks based on feed quality and product distribution. Energy Fuels 2004, 18, 160–171. [Google Scholar] [CrossRef]
  4. Yui, S.; Matsumoto, N.; Sasaki, Y. Athabasca oil sands produce quality FCC feeds. Oil Gas. J. 1998, 96, 43–51. [Google Scholar]
  5. Ng, S.H.; Yang, H.; Wang, J.; Zhu, Y.; Fairbridge, C.; Yui, S. Comparison of catalytic cracking performance between riser reactor and microactivity test (MAT) unit. Energy Fuels 2001, 15, 783–785. [Google Scholar] [CrossRef]
  6. Ng, S.H.; Wang, J.; Fairbridge, C.; Zhu, Y.X.; Zhu, Y.J.; Yang, L.; Ding, F.; Yui, S. Study of Canadian FCC feeds from various origins and treatments. 2. Some specific cracking characteristics and comparisons of product yields and qualities between a riser reactor and a MAT unit. Energy Fuels 2004, 18, 172–187. [Google Scholar] [CrossRef]
  7. Ng, S.H.; Humphries, A.; Fairbridge, C.; Zhu, Y.; Khulbe, C.; Tsai, T.Y.R.; Ding, F.; Charland, J.P.; Yui, S. Comparisons of FCC product yields and qualities between reactors using Canadian heavy feeds. Fuel Process. Technol. 2005, 86, 1335–1350. [Google Scholar] [CrossRef]
  8. Fisher, I.P. Effect of feedstock variability on catalytic cracking yields. Appl. Catal. 1990, 65, 189–210. [Google Scholar] [CrossRef]
  9. Scherzer, J. Correlation between catalyst formulation and catalytic properties. In Fluid Catalytic Cracking: Science and Technology; Magee, J.S., Mitchell, M.M., Jr., Eds.; Studies in Surface Science and Catalysis 76; Elsevier Science Publishers B. V.: Amsterdam, The Netherlands, 1993; pp. 145–182. [Google Scholar]
  10. Ng, S.H.; Zhu, Y.; Humphries, A.; Zheng, L.; Ding, F.; Gentzis, T.; Charland, J.-P.; Yui, S. FCC study of Canadian oil-sands derived vacuum gas oils. 1. Feed and catalyst effects on yield structure. Energy Fuels 2002, 16, 1196–1208. [Google Scholar] [CrossRef]
  11. Fu, C.M.; Schaffer, A.M. Effect of nitrogen compounds on cracking catalysts. Ind. Eng. Chem. Prod. Res. Dev. 1985, 24, 68–75. [Google Scholar] [CrossRef]
  12. John, T.M.; Wojciechowski, B.W. Effect of reaction temperature on product distribution in the catalytic cracking of a neutral distillate. J. Catal. 1975, 37, 348–357. [Google Scholar] [CrossRef]
  13. Keyworth, D.A.; Reid, T.A.; Asim, M.Y.; Gilman, R.H. Offsetting the cost of lower sulfur in gasoline. In Proceeding of the 1992 NPRA Annual Meeting, New Orleans, LA, USA, 22–24 March 1992. AM-92-17. [Google Scholar]
  14. Ng, S.H.; Al-Sabawi, M.; Wang, J.; Ling, H.; Zheng, Y.; Wei, Q.; Ding, F.C.; Little, E. FCC coprocessing oil sands heavy gas oil and canola oil. 1. Yield structure. Fuel 2015, 156, 163–176. [Google Scholar] [CrossRef]
  15. ASTM D5236-13. Standard Test Method for Distillation of Heavy Hydrocarbon Mixtures (Vacuum Potstill Method); ASTM International: West Conshohocken, PA, USA, 2010. [Google Scholar] [CrossRef]
  16. Purvin & Gertz, Inc. Oil Sands Products Analysis for Asian Markets. 2005. Available online: https://open.alberta.ca/publications/oil-sands-products-analysis-for-asian-markets (accessed on 15 April 2005).
  17. Kayser, J.C. Versatile fluidized bed reactor. U.S. Patent 6069012 30 May 2000. [Google Scholar]
  18. ASTM D7964/D7964M-14. Standard Test Method for Determining Activity of Fluid Catalytic Cracking (FCC) Catalysts in a Fluidized Bed; ASTM International: West Conshohocken, PA, USA, 2014. [Google Scholar] [CrossRef]
  19. Ng, S.H.; Shi, Y.; Heshka, N.E.; Zhang, Y.; Little, E. Laboratory production of biofuels and biochemicals from a rapeseed oil through catalytic cracking conversion. J. Vis. Exp. 2016, 115, e54390. [Google Scholar] [CrossRef] [PubMed]
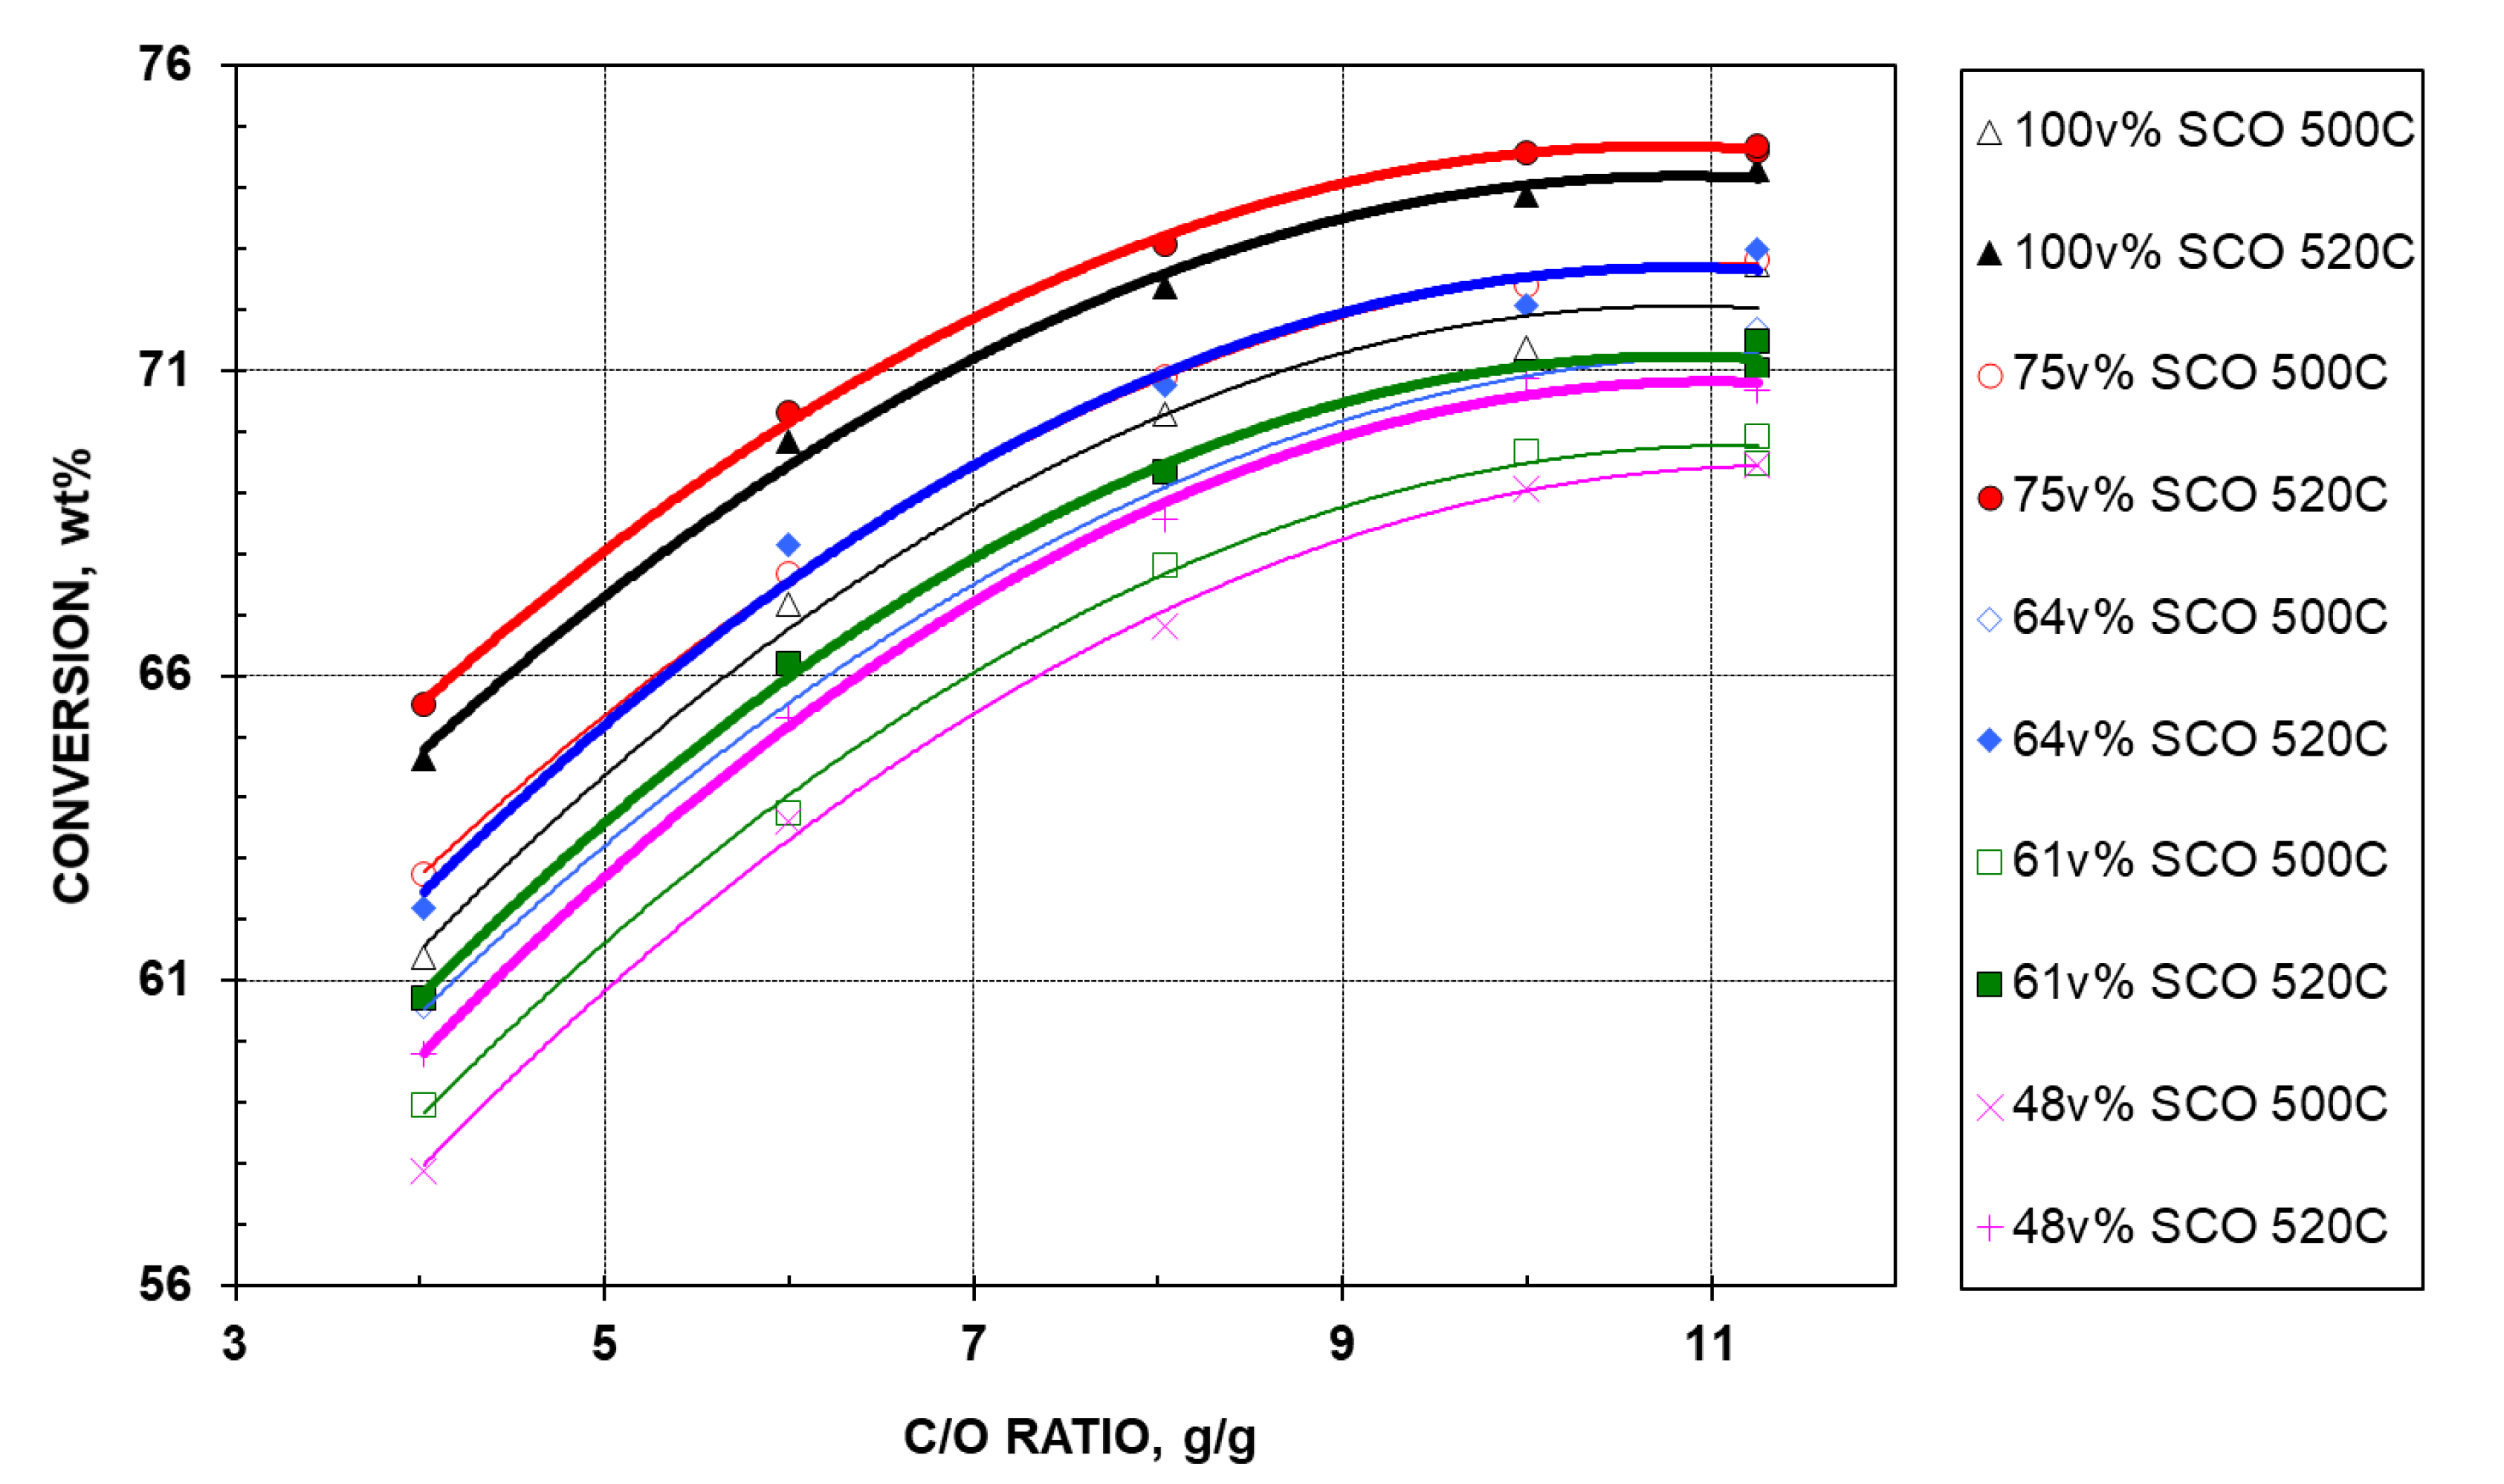
Figure 1. Conversion of SCO HGO and its blends with bitumen HGO vs. C/O ratio at two reaction temperatures.
Catalysts 10 00277 g001
Figure 2. (a) Dry gas yield vs. C/O ratio at two reaction temperatures; (b) Dry gas yield vs. conversion at two reaction temperatures.
Catalysts 10 00277 g002
Figure 3. (a) LPG yield vs. C/O ratio at two reaction temperatures; (b) LPG yield vs. conversion at two reaction temperatures.
Catalysts 10 00277 g003
Figure 4. (a) Gasoline yield vs. C/O ratio at two reaction temperatures; (b) Gasoline yield vs. conversion at different reaction temperatures.
Catalysts 10 00277 g004aCatalysts 10 00277 g004b
Figure 5. (a) LCO yield vs. C/O ratio at two reaction temperatures; (b) LCO yield vs. conversion at two reaction temperatures.
Catalysts 10 00277 g005
Figure 6. (a) HCO yield vs. C/O ratio at two reaction temperatures; (b) HCO yield vs. conversion at two reaction temperatures.
Catalysts 10 00277 g006
Figure 7. (a) Coke yield vs. C/O ratio at two reaction temperatures; (b) Coke yield vs. conversion at two reaction temperatures; (c) Delta coke vs. conversion at two reaction temperatures.
Catalysts 10 00277 g007aCatalysts 10 00277 g007b
Figure 8. Effect of SCO HGO addition on product yields at 500 and 520 °C.
Catalysts 10 00277 g008
Table 1. Properties of the feedstocks used in this work.
HGO (343 °C–FBP)
SCO in (SCO + bitumen) blend, v%100.0075.3764.0061.0948.000.00
SCO in (SCO + bitumen) blend, wt%100.0074.5562.9860.0446.910.00
density at 15.6 °C, g/cm30.93360.94290.94800.94890.95450.9755
°API gravity20.118.617.817.616.713.6
carbon, wt%87.586.886.586.986.184.8
hydrogen, wt%11.911.011.311.011.010.7
H/C atomic ratio, mol/mol1.621.511.561.511.531.51
sulfur, wt%0.441.241.601.662.123.69
nitrogen, wppm158415261502149514651355
MCR, wt%0.000.100.130.030.070.26
Ni, wppm<0.10.10.30.1<0.1<0.1
V,c wppm0.100.150.170.180.200.30
simulated distillation, wt%------
343 °C−1.93.84.04.04.87.2
525 °C+6.56.88.37.98.911.8
saturates, wt%46.547.343.544.640.532.5
paraffins6.04.43.43.83.21.9
cycloparaffins40.542.940.040.837.330.6
aromatics, wt%48.647.050.049.452.658.5
monoaromatics23.023.724.425.927.928.9
diaromatics15.916.717.517.918.422.2
triaromatics8.05.15.14.44.85.0
tetraaromatics and up1.31.02.21.01.01.1
aromatic sulfur0.40.40.70.10.51.3
2-ring compounds0.40.40.70.10.51.3
3-ring compounds0.00.00.00.00.00.0
polars, wt%4.95.36.06.06.99.1
asphaltenes, wt%0.00.00.00.00.00.0
gasoline precursors,a wt%69.571.067.970.568.461.4
light cycle oil precursors,b wt%16.317.118.218.018.923.5
a saturates + monoaromatics; b diaromatics + 2-ring aromatic sulfur + 1/2 × 3-ring aromatic sulfur; c calculated values for the blends.
Table 2. Equilibrium catalyst properties.
CatalystAlbemarle E-CAT
total surface area, m2/g141
zeolite surface area, m2/g54.0
matrix surface area, m2/g87.0
zeolite/matrix (Z/M)0.62
micropore volume, cm3/g0.03
Al2O3, wt%51.0
RE2O3, wt% (on catalyst) *0.80
Na2O, wt%0.38
Fe2O3, wt%0.63
Ni, wppm50
V, wppm60
apparent bulk density, g/cm30.83
average particle size, µm75
particle size distribution, %-
−105 µm79
−80 µm57
−60 µm30
−40 µm7
−20 µm0
* RE: rare earth element.
Table 3. Repeatability data of conversions and yields at 11.0 C/O ratio and two temperatures for five feeds.
v% SSB in Blend100.0075.3764.0061.0948.00
Run No.79179679780294595095195612461251125212579639689699741264126912701275
Temp., °C500520500520500520500520500520
Conv., wt%71.6372.7574.3075.2872.8167.7974.5974.6770.8571.6872.9873.8769.9369.4771.4771.0069.4670.4470.6871.77
Diff, %1.551.327.150.121.161.200.660.661.401.52
Yield, wt%
Dry Gas1.711.712.272.392.212.192.782.812.642.603.153.162.632.633.233.252.742.783.433.43
Diff, %0.285.210.621.061.800.200.050.751.470.06
LPG15.5215.7817.5418.0314.9715.2616.8617.1215.6214.9716.5117.8614.3214.8015.8216.1913.6914.2615.6815.95
Diff, %1.642.801.961.524.237.893.292.284.081.74
Gasoline47.5048.5047.3147.5948.6343.3347.6847.4244.8946.2745.1344.8644.7043.9743.6743.0643.0442.8441.3041.00
Diff, %2.080.5811.520.550.010.611.661.410.480.71
LCO16.5916.3015.3614.7816.5619.8915.3715.5318.2717.7016.7916.3618.4718.6817.4216.9718.2718.9618.0617.60
Diff, %1.803.8618.251.053.172.551.152.633.722.57
HCO11.7810.9610.359.9410.6212.3210.049.7910.8710.6210.239.7711.6011.8511.1112.0412.2710.6011.2610.63
Diff, %7.253.9914.832.512.384.612.097.9814.625.74
Coke6.896.767.187.277.017.007.277.337.707.848.197.998.278.078.758.508.138.148.808.74
Diff, %1.941.240.210.841.912.552.492.900.050.66
Delta Coke0.610.600.640.650.620.620.650.650.680.700.730.710.730.720.780.760.720.720.780.78
Diff, %1.941.240.210.841.912.552.492.900.050.66