Article

Core-Shell Nanostructures of Graphene-Wrapped CdS Nanoparticles and TiO2 (CdS@G@TiO2): The Role of Graphene in Enhanced Photocatalytic H2 Generation

1
Department of Chemical Engineering, Norwegian University of Science and Technology (NTNU), Sem Sælands vei 4, NO-7491 Trondheim, Norway
2
SINTEF Industry, P. O. Box 4760, Torgarden, NO-7465 Trondheim, Norway
*
Author to whom correspondence should be addressed.
Catalysts 2020, 10(4), 358; https://doi.org/10.3390/catal10040358
Submission received: 6 March 2020 / Revised: 19 March 2020 / Accepted: 22 March 2020 / Published: 25 March 2020
(This article belongs to the Special Issue Recent Advances in TiO2 Photocatalysts)

Abstract

:
Aiming to achieve enhanced photocatalytic activity and stability toward the generation of H2 from water, we have synthesized noble metal-free core-shell nanoparticles of graphene (G)-wrapped CdS and TiO2 (CdS@G@TiO2) by a facile hydrothermal method. The interlayer thickness of G between the CdS core and TiO2 shell is optimized by varying the amount of graphene quantum dots (GQD) during the synthesis procedure. The most optimized sample, i.e., CdS@50G@TiO2 generated 1510 µmole g−1 h−1 of H2 (apparent quantum efficiency (AQE) = 5.78%) from water under simulated solar light with air mass 1.5 global (AM 1.5G) condition which is ~2.7 times and ~2.2 time superior to pure TiO2 and pure CdS respectively, along with a stable generation of H2 during 40 h of continuous operation. The increased photocatalytic activity and stability of the CdS@50G@TiO2 sample are attributed to the enhanced visible light absorption and efficient charge separation and transfer between the CdS and TiO2 due to incorporation of graphene between the CdS core and TiO2 shell, which was also confirmed by UV-vis, photoelectrochemical and valence band XPS measurements.

Graphical Abstract

1. Introduction

The burning of fossil fuels to meet the energy demands of modern society is not only increasing global warming exponentially but also leading to the depletion of conventional energy sources which may soon result in a severe energy crisis [1]. To mitigate these serious issues, a renewable and environmentally friendly alternative energy transformation carrier is urgently needed. Photocatalytic hydrogen (H2) generation from water, utilizing solar energy, is considered an appealing approach in the scientific community [2]. In the past few years, extensive efforts have been devoted to explore and investigate new approaches for the development of highly efficient and stable photocatalyst for H2 generation from water. However, there is still a need to find a suitable photocatalyst which will be highly active and stable [3]. Among many different semiconductor-based photocatalysts, cadmium sulfide (CdS), active in the visible range of the light spectrum due to narrow bandgap (ca. 2.3 eV), is a promising catalyst for photocatalytic H2 generation [4]. Despite its fascinating photocatalytic properties, it exhibits a disappointing activity and stability toward the generation of H2 due to the fast recombination of charge carriers and the photo-corrosion of CdS into elemental sulphur caused by the holes (h+) generated in the valence band during the photocatalytic reaction [5]. Numerous efforts have been made to enhance the activity of CdS, including the use of noble metals as co-catalysts, doping of different elements in CdS and manipulating the morphological properties [6,7]. Among all these strategies, the formation of a heterojunction of CdS with another semiconductor is a promising approach in terms of cost-effectiveness and efficient charge separation due to the built-in heterojunction leading to enhanced photocatalytic activity [8]. The use of noble metal loading on the heterojunction binary CdS-based photocatalysts is also an attractive approach that usually exhibits enhanced photocatalytic activity and stability but adds cost to the catalysts [9,10,11]. By combining all these strategies, there is still room to develop a new approach that can achieve enhanced activity and stability of CdS based photocatalysts without the use of noble metals.
In photocatalysis, titanium dioxide (TiO2) has stabile photoelectrical properties with a wide bandgap which can only be active in the UV region of the light spectrum [3]. To overcome this drawback of TiO2, the formation of a heterojunction of CdS with TiO2 in the form of core-shell nanostructure (CdS@TiO2) is attractive due to the dual role played by the shell of TiO2 over the CdS core. The core-shell combination of CdS and TiO2 will lead to the advantages of utilizing a wider solar spectrum along with the formation of a heterojunction providing higher activity and stability due to more efficient charge separation. Furthermore, the layer of TiO2 over CdS will also provide shielding effects during the photocatalytic reaction to attain the stability of CdS [12,13]. Core-shell nanoparticles of CdS and TiO2 have already been reported to exhibit enhanced photocatalytic activity and stability for numerous different photocatalytic applications including phenol photodecomposition, rhodamine B degradation and reduction of heavy metal ions [13,14,15]. We have demonstrated enhanced photocatalytic activity for H2 generation along with promising catalyst stability by synthesizing the core-shell nanoparticles of CdS and TiO2 [16]. The enhanced activity and stability are mainly attributed to the enhanced light absorption, efficient charge separation and the presence of a TiO2 layer over the CdS nanoparticles [16]. In principle, through the formation of a heterojunction, the band bending at the interface of both semiconductors are aligning the fermi levels resulting in the formation of a Schottky-like barrier which provides resistance to the charge flow across the semiconductors and in turn suppress the photocatalytic activity [17,18].
To overcome the resistance in the movement of charges between the two semiconductors due to the formation of the heterojunction, a conductive interlayer can be introduced between the two semiconductors for tailoring the photocatalytic properties of the heterojunction materials [19]. The conductive layer will assist easy movements of electrons (e) and holes (h+) between two semiconductors which can lead to an increase in the charge separation efficiency beneficial for the photocatalytic activity, similar to what was observed by Feng et al. by placing the graphene layer between an α-Fe2O3 core and a BiV1−xMoxO4 shell [20]. Furthermore, carbon-based materials and especially graphene is considered as a promising candidate to achieve high photocatalytic efficiency due to its high electron mobility, transparency, flexibility, and high surface area. Graphene has already been investigated for various applications including dye degradation, phenol removal, photocatalytic hydrogen generation from water and photocatalytic CO2 reduction [21,22,23,24]. The presence of graphene in photocatalysts plays a role in extracting the electrons from the conduction band of the excited semiconductor, which accelerates the photocatalytic activity by enhanced charge separation and thus can act as a promising alternative to noble metals in photocatalysis.
Motivated to avail the benefits of placing the conductor layer in the heterojunction of two semiconductors and to further enhance the photocatalytic activity of our previously developed core-shell nanoparticles of CdS and TiO2 [16], we have introduced a conductive layer of graphene (G) between the CdS core and TiO2 shell (CdS@G@TiO2). The photocatalyst was synthesized by the following three steps: (1) synthesis of CdS nanoparticles by simple hydrothermal method, (2) loading of the G on CdS nanoparticles by sonication (CdS@G) and (3) formation of a TiO2 shell on CdS@G (CdS@G@TiO2) by hydrothermal method. To optimize the G layer in CdS@xG@TiO2 (where x = 20, 30, 40, 50, 60, 80 µL correspond to 100 mg mL−1 concentration of graphene quantum dots (GQD) solution) samples, we vary the content of graphene in the synthesis procedure by adding varying amounts of GQD solution. The synthesized samples were extensively characterized and the role of G in the charge separation and transfer between CdS and TiO2 was investigated by electrochemical measurements. The photocatalytic activity of all the synthesized samples was evaluated in H2 generation from water under simulated solar light with air mass 1.5 global (AM 1.5G) condition.

2. Results and Discussion

2.1. Material Synthesis

The synthesis scheme is based on the fact that CdS nanoparticles possess positive charge on their surface due to non-stoichiometric atomic ratio of Cd and S in CdS [25,26]. The graphene quantum dots (GQD) exhibit negative surface charge due to the presence of –COOH and C=O groups [27]. During the synthesis of graphene-wrapped CdS nanoparticles, first, positively charged CdS nanoparticles (200 mg) were dispersed in DI water along with varying content of GQD solution (~100 mg mL−1) containing negative charge. Thus, GQD are attracted towards the CdS nanoparticles by opposite electrostatic charge and attached to the surface of CdS nanoparticles [27,28,29]. The graphene layer is formed by the stacking of GQD using oxygen containing groups present on GQD, π–π interaction and dipole-dipole attraction which results in the formation graphene-wrapped CdS nanoparticles (CdS@G) [30,31]. To construct the shell of TiO2 over CdS@G, the titanium (Ti) precursor (1.11 mL) is added to the dispersed CdS@G solution in ethanol. After stirring for 30 min, the reaction mixture undergoes hydrothermal treatment to obtain crystalline TiO2 and to construct the heterojunction of CdS@G and TiO2 to form CdS@G@TiO2 nanostructures.

2.2. Material Analysis

X-ray diffraction (XRD) patterns of pure CdS nanoparticles, pure TiO2 and various compositions of core-shell CdS@xG@TiO2 (x = 20, 30, 40, 50, 60, 80 µL of GQD solution with a concentration of ~100 mg mL-1 was used in the synthesis) are shown in Figure 1a and Figure S1. The diffraction pattern of pure TiO2 exhibits peaks which are indexed at 2θ = 25.45, 37.97, 48.16, 54.21, 55.18 and 62.79 corresponding to (101), (004), (200), (105), (211) and (204) planes, respectively, corresponding to JCPDS card no. 83-2243 confirming the anatase phase [10]. The formation of pure wurtzite structure of CdS is confirmed by the appearance of characteristic diffraction peaks at 2θ = 24.97°, 26.62°, 28.29°, 36.77°, 43.85°, 47.97°, 51.12°, 51.98°, 52.94°, 54.67°, 58.54°, 67.01° and 69.53° attributed to the (100), (002), (101), (102), (110), (103), (200), (112), (201), (004), (202), (203) and (210) planes, well matched with JCPDS card no. 80-0006 [32,33]. The formation of a nanocomposite in the form of CdS@xG@TiO2 is confirmed by the presence of the wurtzite structure of CdS and the anatase phase of TiO2 in all the samples. Furthermore, no peak corresponding to graphite is observed in the nanocomposite (Figure 1a and Figure S1) presumably due to the relatively low content of graphene [34]. Raman analysis is also performed to investigate the structure of CdS@50G@TiO2 as shown in Figure S2. The Raman spectrum of the CdS@50G@TiO2 sample exhibits peaks at 148, 401, 516 and 640 cm−1 attributed to the Eg, B1g, A1g and Eg modes of pure anatase [24]. The peaks around 300 and 600 cm−1 represent the longitudinal optical mode (LO-1) and the first overtone of A1 mode (LO-2) of CdS nanoparticles, respectively [35]. In the Raman spectrum, no D and G band of graphene was observed most likely due to the low content of graphene. To further verify the presence of graphene in CdS@xG@TiO2 samples, Fourier-transform infrared spectroscopy (FTIR) is applied and the FTIR spectra of pure CdS and CdS@xG@TiO2 are shown in Figure 1b. All the graphene containing samples exhibited a strong and broad peak in the range 3000–3500 cm−1 consistent with the presence of O-H groups on the graphene due to the stretching vibration of hydroxyl groups [36]. Furthermore, the peaks appearing around 2800 and 1235 cm−1 are attributed to the vibrations from –CH2 and C–OH groups present in graphene [37]. The peaks appearing around 1625 cm−1 is amplified in the graphene containing samples in comparison to pure CdS, which can be justified by the co-existence of C–C of the graphene and the Cd–S vibration from pure CdS, which confirms the presence of graphene in the CdS@xG@TiO2 samples [38].

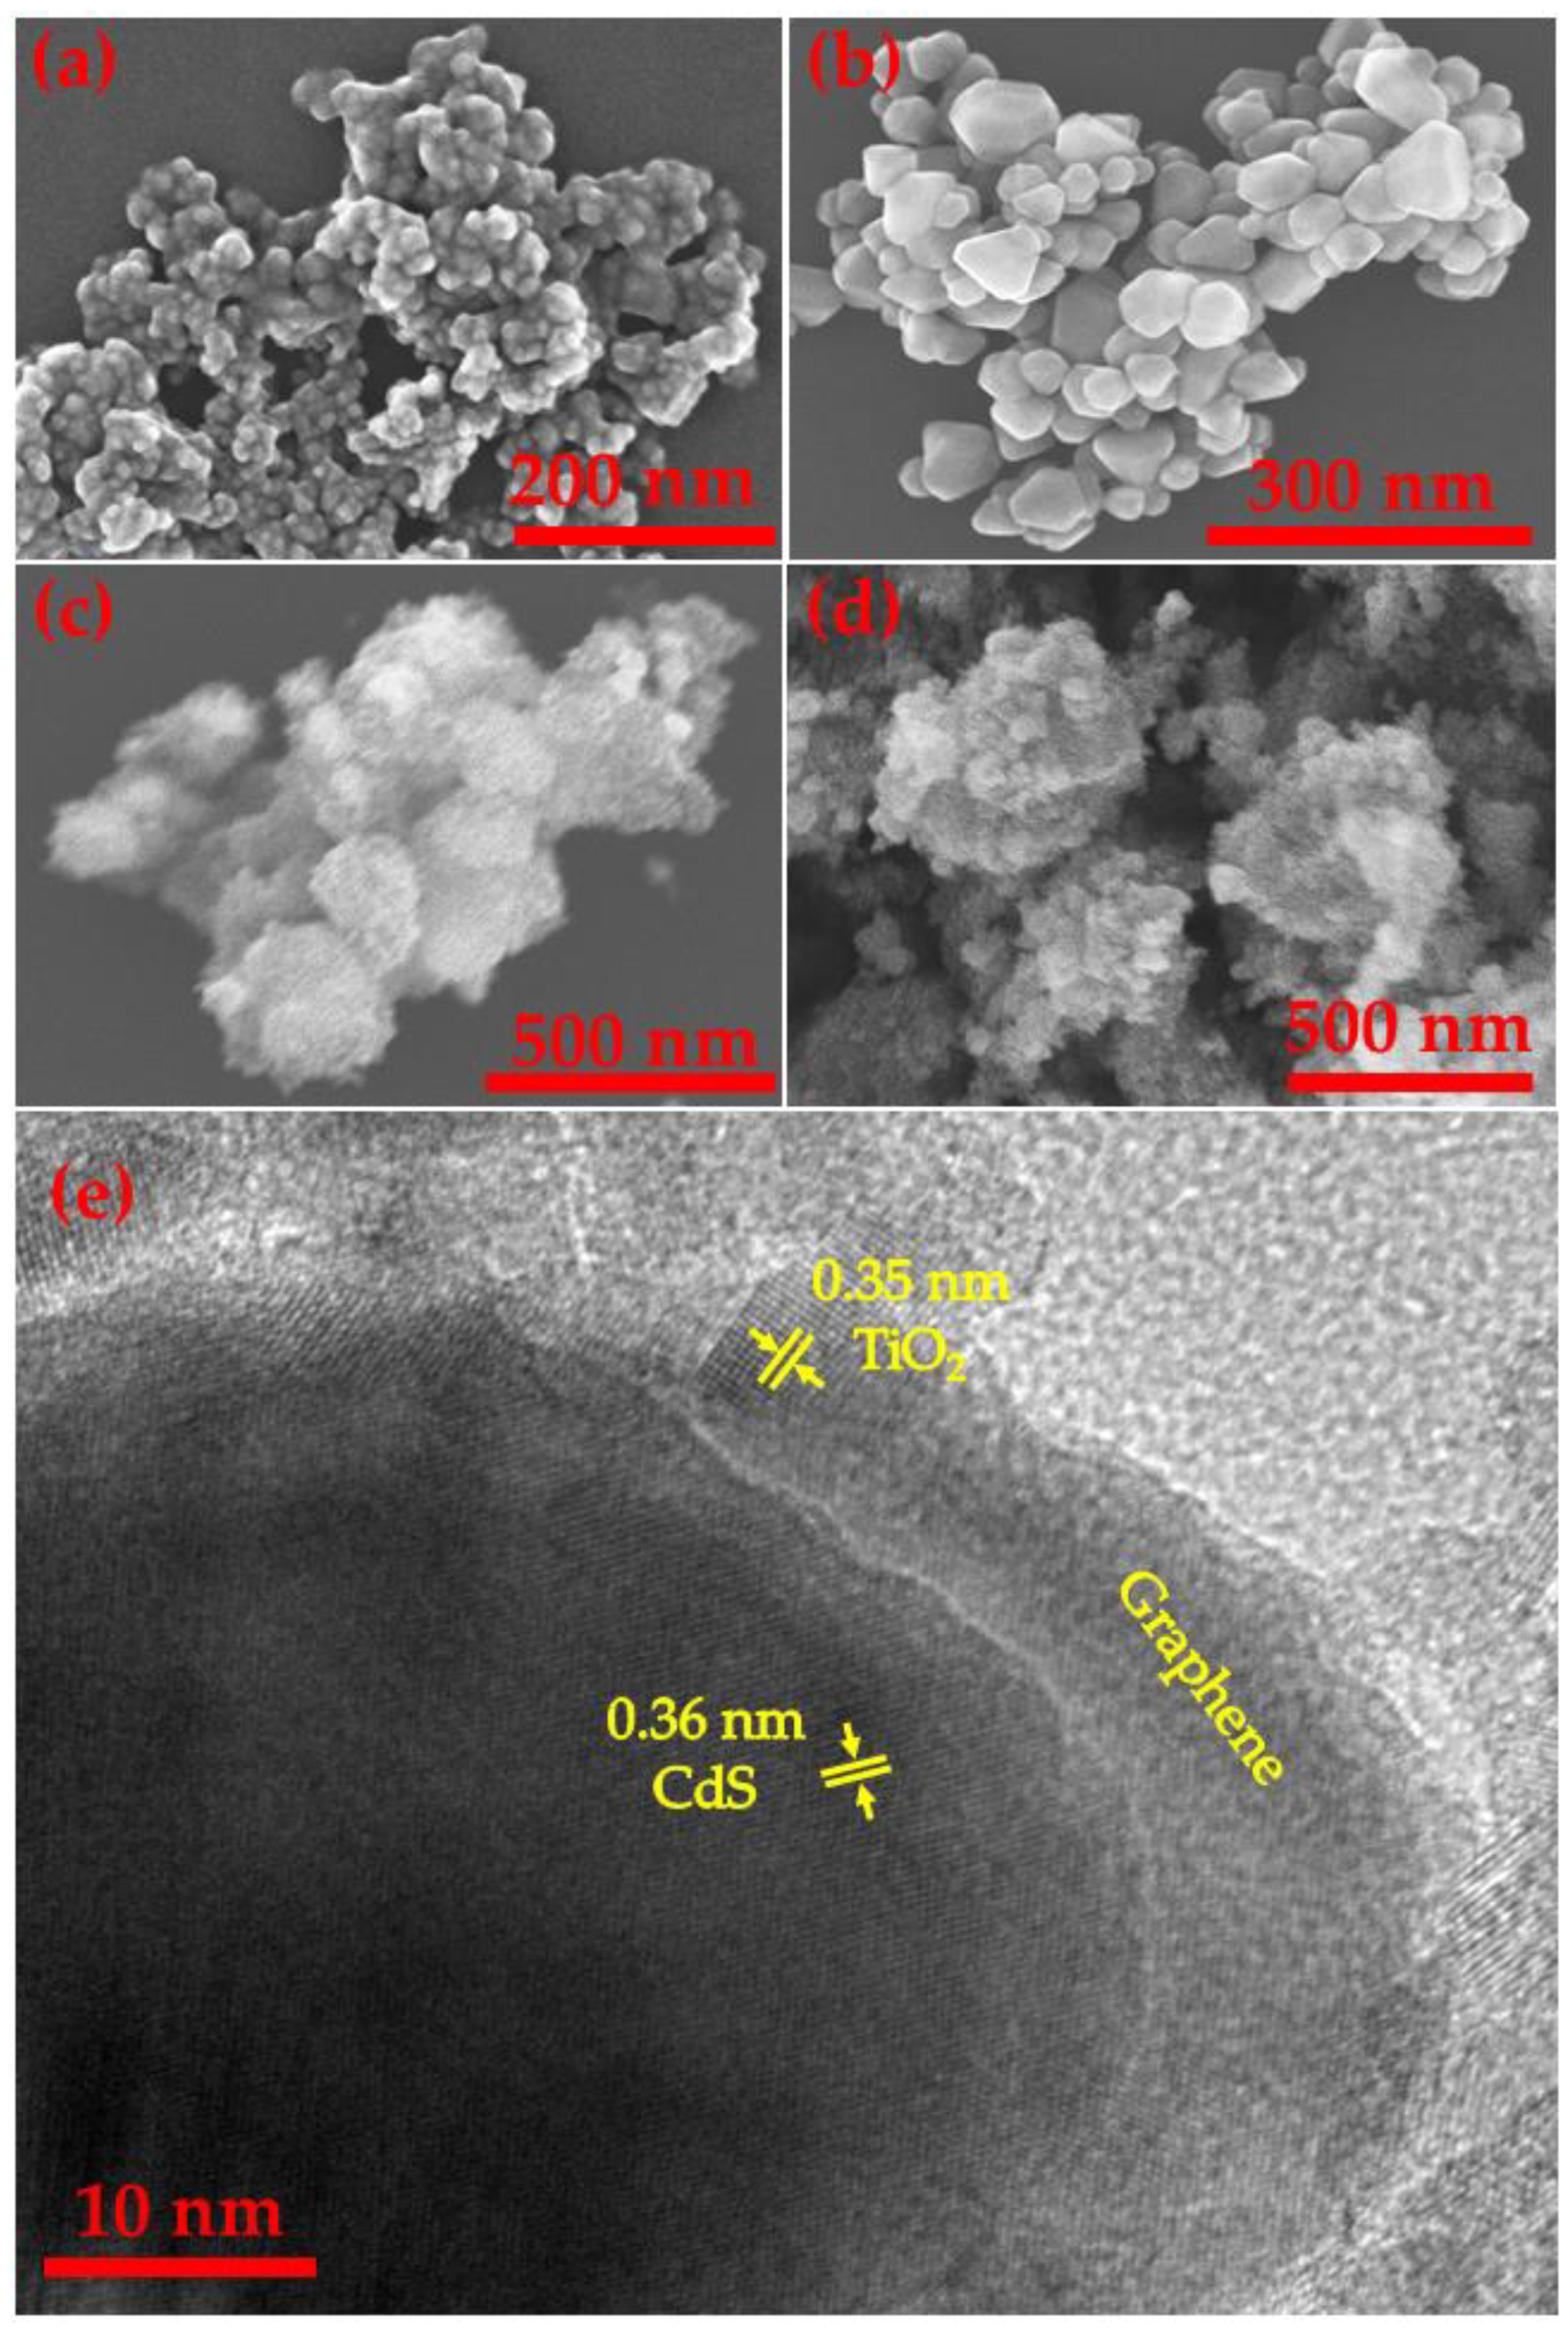
2.3. Morphological Analysis

The morphology of pure TiO2, pure CdS, CdS@TiO2 and CdS@50G@TiO2 samples are analyzed using field emission scanning electron microscopy (FE-SEM) and transmission electron microscopy, as shown in Figure 2. Pure TiO2 forms a layer-type structure by agglomeration of small particles as shown in Figure 2a. Figure 2b shows the conical shape of pure CdS nanoparticles having a size of ~70 nm with a clear grain boundary. It can be observed in Figure 2c that the CdS particles are uniformLy covered by the TiO2 nanoparticles forming a core-shell structure, i.e., CdS@TiO2. Figure 2d shows the formation of a core-shell structure of graphene-wrapped CdS and TiO2 (CdS@G@TiO2) in which TiO2 particles are embedded in the graphene layer present on the CdS nanoparticles. EDX elemental mapping corroborates the formation of a core-shell CdS@50G@TiO2 structure by the presence of Cd and S from CdS nanoparticles while Ti and O are distributed over a larger area than Cd and S as shown in Figure S3. Furthermore, the presence of graphene in CdS@50G@TiO2 is supported by the carbon signal in the EDX elemental mapping shown in Figure S3d.
The TEM image of CdS@50G@TiO2 is shown in Figure S4, confirming that CdS particles are wrapped with graphene and TiO2 particles to form the CdS@50G@TiO2 nanostructure. The HR-TEM image displayed in Figure 2e shows that the lattice spacing of CdS at the core of the CdS@50G@TiO2 sample is 0.36 nm which corresponds to the (100) plane of CdS. TiO2 is identified with a lattice spacing of 0.35 nm attributed to the (101) plane in the shell of the CdS@50G@TiO2 nanostructure. Graphene (G) can be seen between the CdS nanoparticles and TiO2 nanoparticles with a thickness of ~3 nm as a clear interface between CdS and TiO2 which confirms the formation of CdS@50G@TiO2 nanostructure.

2.4. Optical Properties

The absorption spectrum of pure graphene quantum dots (GQD) is shown in Figure S5 which exhibits two typical absorption peaks confirming the presence of GQD. Peaks centered around 360 nm and 250 nm are attributed to the electron excitation from ground to excited state, and the π–π* transition of the aromatic sp2 domain [24,39]. The UV-vis diffuse reflectance spectroscopy (DRS) of pure TiO2, pure CdS and CdS@xG@TiO2 are measured to investigate the response of the photocatalysts towards light as shown in Figure 3a and Figure S6. The pure TiO2 exhibits an absorption onset at ca. 380 nm corresponding to its intrinsic bandgap and the excitation of an electron from the valence band to the conduction band [24]. Pure CdS nanoparticles show an absorption edge around 500 nm associated with its bandgap along with strong absorption in visible and UV regions of the spectrum due to the narrow bandgap [40]. The UV-vis DRS spectrum of CdS@TiO2 exhibited enhanced absorption compared to pure CdS and pure TiO2. With the addition of graphene between CdS and TiO2 (CdS@50G@TiO2) the absorption is further increased relative to CdS@TiO2 as shown in Figure 3a. As the amount of GQD is increased from 20 to 50 µL in CdS@xG@TiO2, the absorption in UV-vis DRS spectra also increases. Upon further increase of GQD up to 80 µL in CdS@80G@TiO2, the absorption slightly decreases most likely due to the relatively thicker layer of graphene as shown in Figure S6. The bandgap (Eg) of pure CdS nanoparticles (Figure 3b) and pure TiO2 (Figure 3c) is calculated using the Tauc plots obtained by plotting the (αhν)n vs. Eg (where Eg = hν, h represents Plank’s constant, ν is the frequency, α shows the absorption coefficient, and for the direct bandgap nature of TiO2 and CdS, n = 2) [41,42]. Pure CdS and pure TiO2 showed a bandgap of 2.31 eV and 3.0 eV respectively which is close to the reported values for pure hexagonal CdS and anatase [43,44].

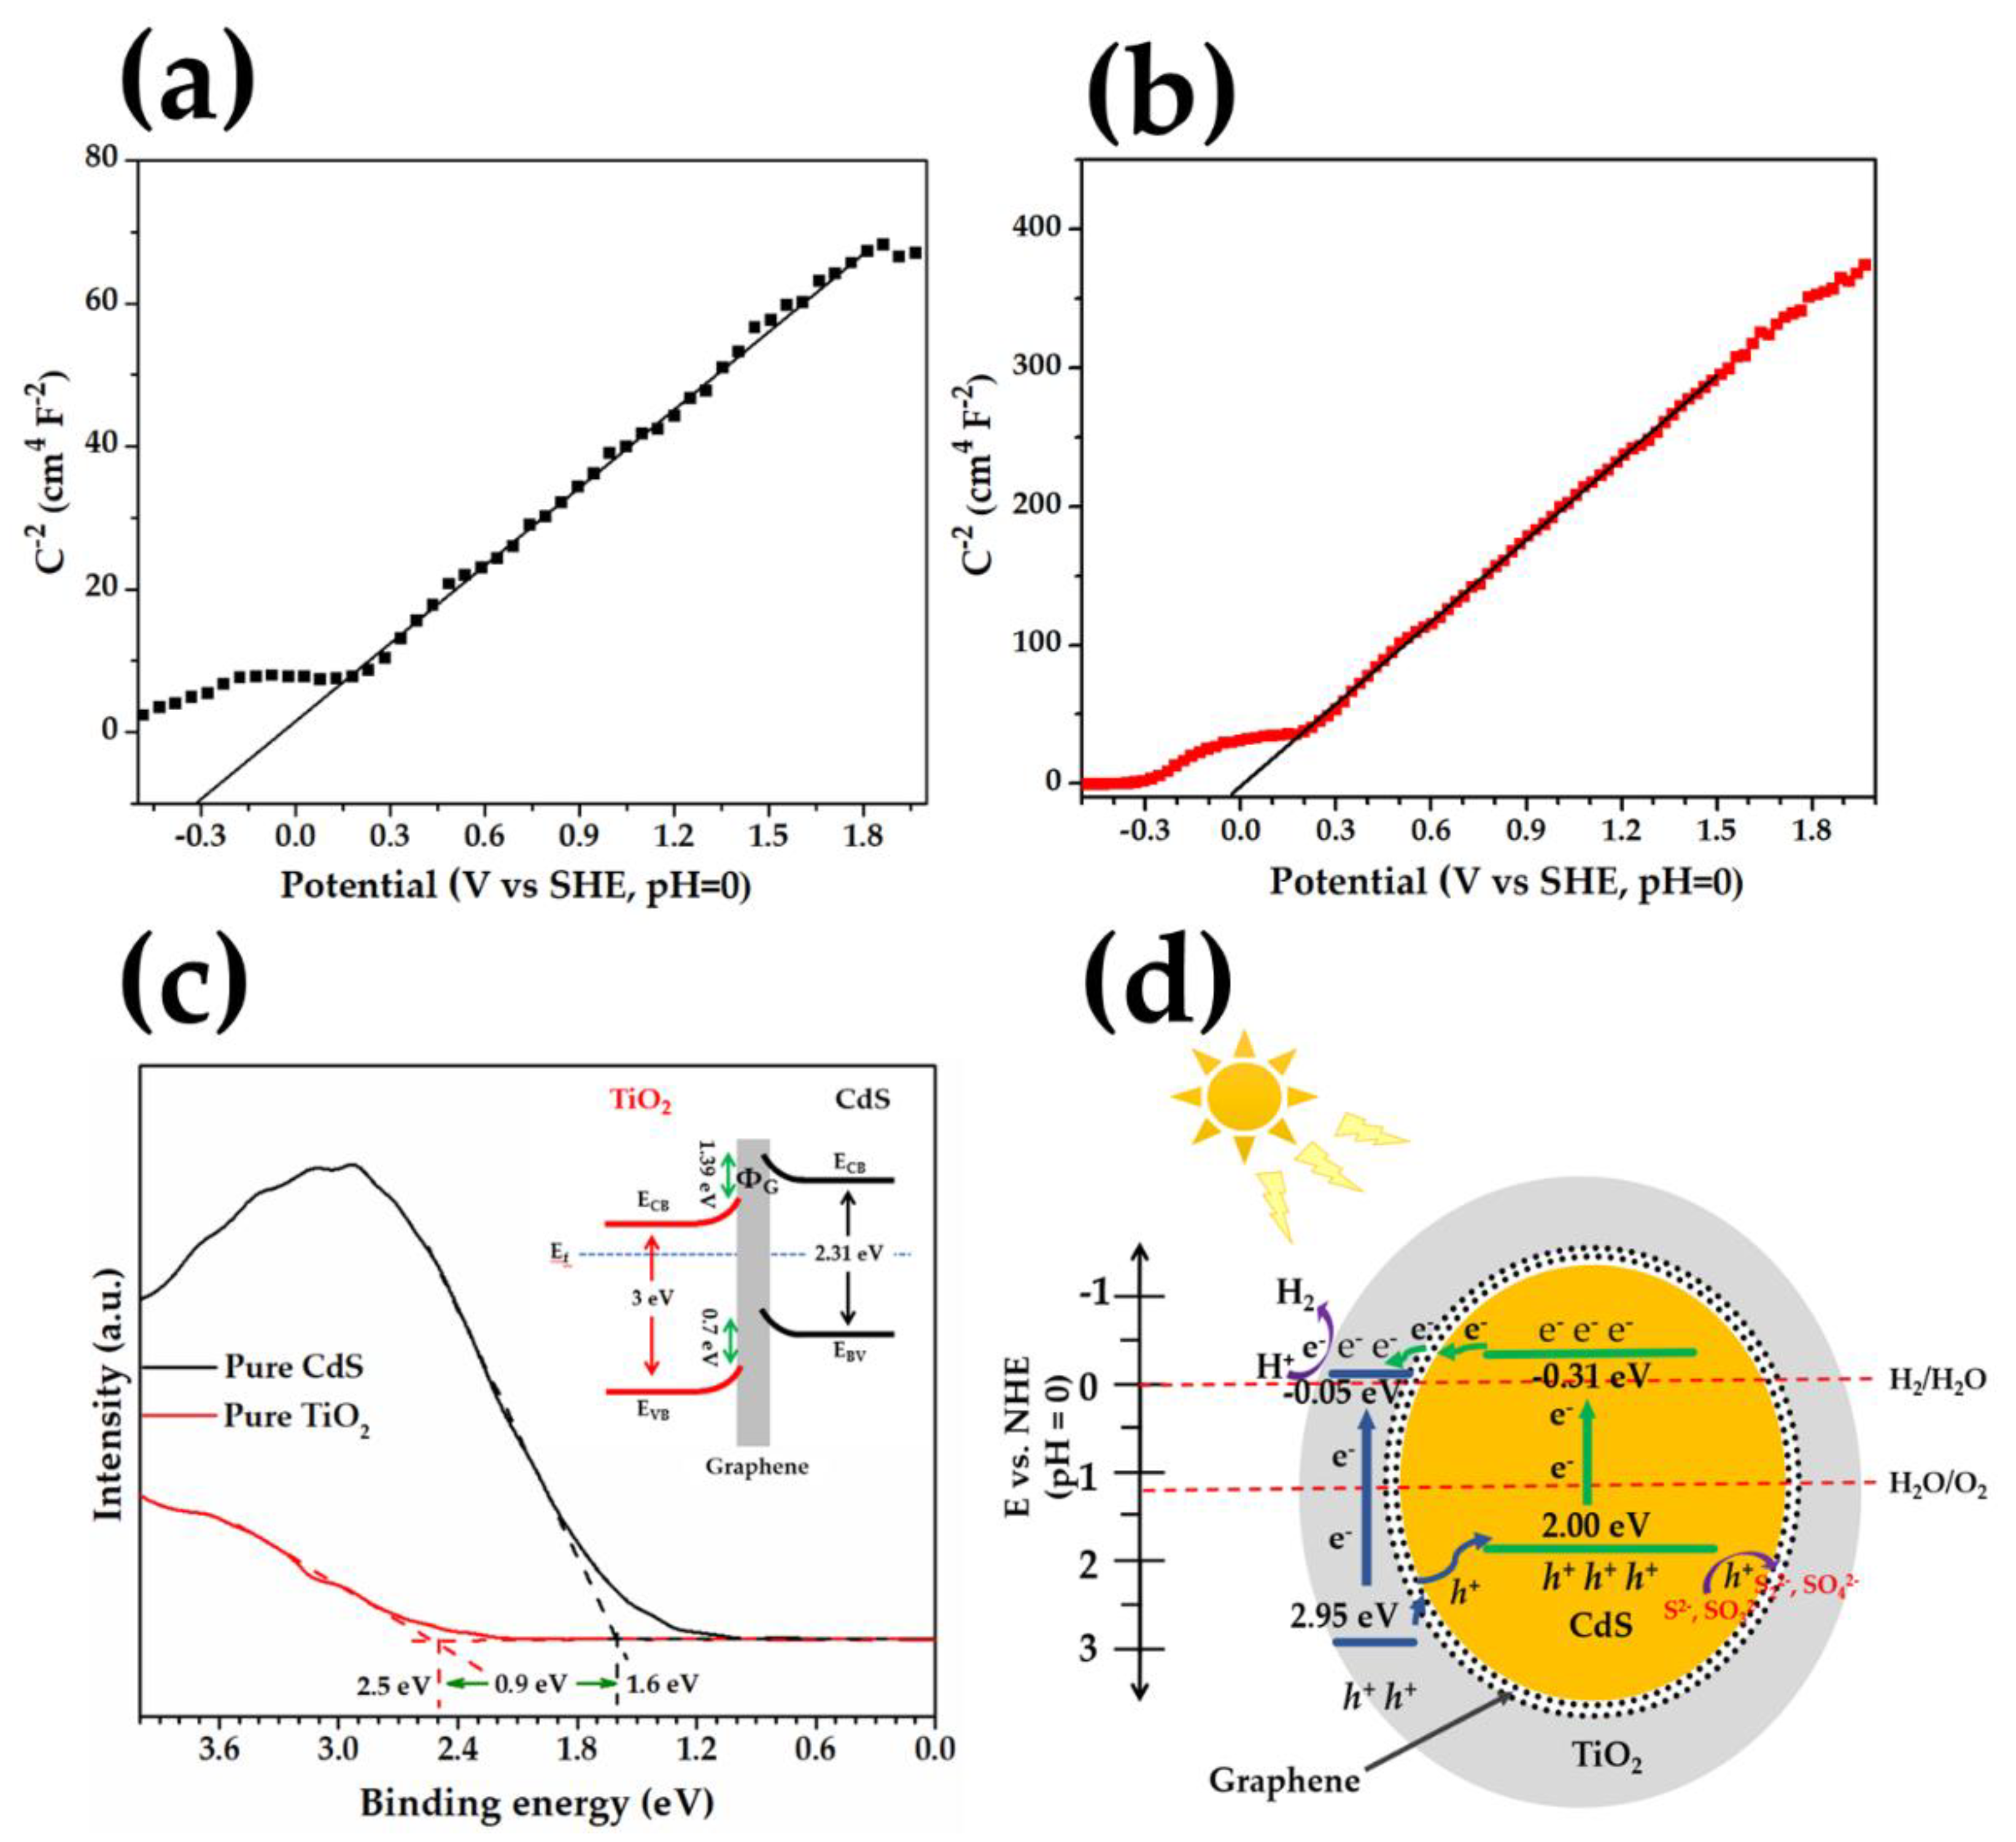
2.5. Surface Analysis

The electronic structure of the surface region was investigated using XPS, where the core level spectra of Cd 3d, S 2p, Ti 2p, O 1s, and C 1s are displayed in Figure 4. Cd is mainly in the form of Cd2+ for pure CdS (Figure 4a), where the 3d5/2 and 3d3/2 spin-orbit split peaks have binding energies around 405.1 and 411.8 eV. A minor component at higher binding energies of 406.0 and 412.5 eV was attributed to the surface Cd terminal atoms [45]. In the CdS@50G@TiO2 sample, Cd exhibits similar peaks to the pure CdS sample, however, the intensity is comparably lower indicative of the core-shell nanostructure of the CdS@50G@TiO2 sample. The intensity of the minor component at high binding energy is comparatively larger for the core-shell structure likely due to the interaction of Cd with oxygen-containing groups on the graphene [46]. Figure 4b represents the XPS spectra of S 2p region for pure CdS and CdS@50G@TiO2, where the S 2p peaks have binding energies around 161.4 eV and 162.6 eV, respectively, in agreement with literature values [47]. There is an additional minor contribution at higher binding energy associated with the presence of sulphate groups [48]. The Ti 2p spectrum of the pure TiO2 sample (Figure 4c) exhibits two main peaks at around 458.6 eV and 464.3 eV for the Ti 2p3/2 and Ti 2p1/2 doublet typical of TiO2 [49]. The corresponding O 1s spectra (Figure 4d) show one major peak around 529.8 eV associated with lattice oxygen in TiO2, with a minor tail at the high binding energy side attributed to –OH groups and/or organic O type species [50]. The Ti 2p peaks and O 1s peak of CdS@50G@TiO2 (Figure 4c,d) are slightly shifted towards higher binding energies caused by the interaction with CdS@G, and the shoulder in the O 1s spectrum, has increased in intensity compared to the pure counterpart. The C 1s core level of CdS@50G@TiO2, shown in Figure 4e, which exhibits three peaks around 284.8 eV, 286.3 eV and 288.8 eV attributed to the C–C/C=C of sp3/sp2 hybridized carbon, C–OH groups and other oxygen-containing groups on graphene, respectively [51].

2.6. Photoelectrochemical (PEC) Measurements

To further investigate the photogenerated charge separation and transfer properties, transient photocurrent measurements are performed under dark and simulated solar light with an ON/OFF pattern for 20 seconds each as shown in Figure 5a. Pure CdS and pure TiO2 generate 30 µA cm−2 and 25 µA cm−2 current density under illumination, whereas no current is generated in the dark confirming the activation of TiO2 and CdS by light. With the formation of a heterojunction of pure CdS and pure TiO2, i.e., CdS@TiO2, a photogenerated current density of 65 µA cm−2 is achieved which is higher than in the case of pure CdS and TiO2. The photogenerated current density is further increased to 130 µA cm−2 due to the incorporation of graphene (G) between CdS and TiO2 (CdS@50G@TiO2). This increase in the current density is mainly attributed to the effective generation of electrons (e) and holes (h+) by the efficient light absorption in CdS@50G@TiO2 as indicated by UV-vis DRS results and the efficient charge separation due to the formation of the heterojunction between CdS and TiO2. Furthermore, the presence of G between the CdS core and the TiO2 shell also contributes to efficient charge separation due to high conductivity and assists the movement of charges from one semiconductor to the other. Such efficient charge separation can lead to higher photocatalytic efficiency.
Electrochemical impedance spectroscopy (EIS) is used to further investigate the interfacial charge transfer mechanism in the synthesized samples. The EIS Nyquist plots of pure CdS, TiO2, CdS@TiO2, and CdS@50G@TiO2 were measured in dark and light, and the results are shown in Figure 5b. The radius of the semi-circles of the EIS corresponds to the overall charge transfer resistance. All the samples show less charge transfer resistance under simulated light than in dark. Pure TiO2 and pure CdS show high charge transfer resistance in light, governed by the radius of the semicircle, leading to lower charge separation efficiency. With the formation of a heterojunction of CdS and TiO2, the charge transfer resistance of CdS@TiO2 in light decreases sharply, indicative of efficient charge transfer by the heterojunction [52]. Furthermore, by incorporation of G between the CdS core and the TiO2 shell, forming CdS@50G@TiO2, the charge transfer resistance in light is further decreased as shown by the radius of the semicircle in the inserted view of Figure 5b. This supports that G acts as a conductor between CdS and TiO2 assisting the photogenerated charge (e and h+) separation and transfer from both semiconductors by exhibiting a very low charge transfer resistance leading to enhanced photocatalytic activity.

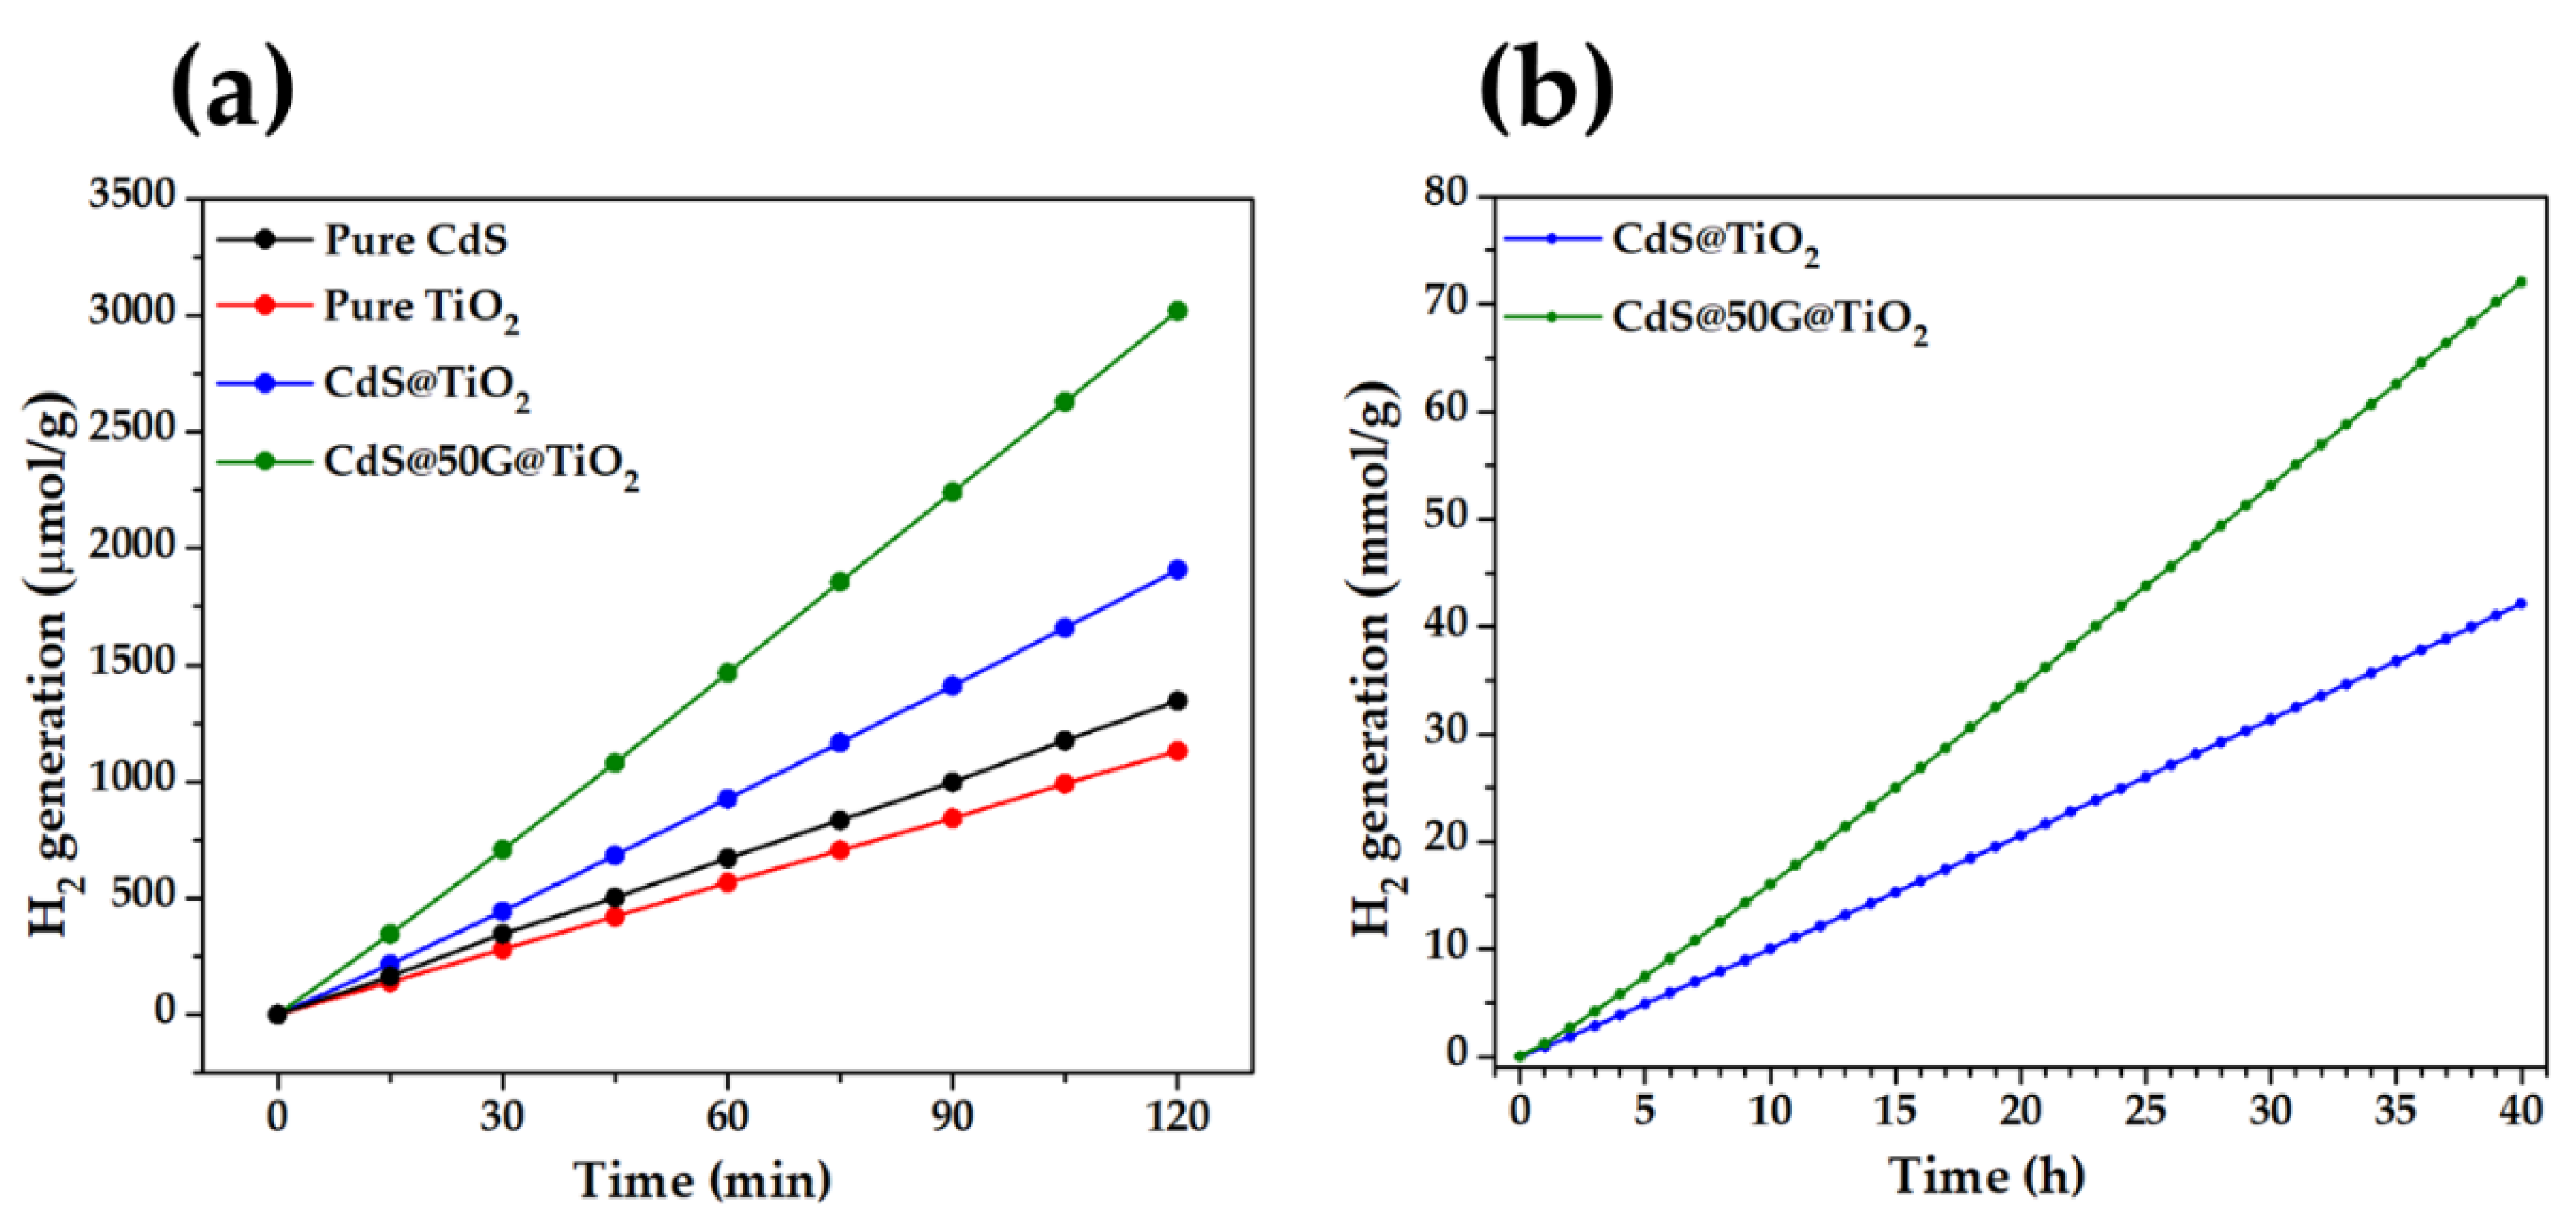
2.7. Photocatalytic Activity Tests for H2 Generation from Water

To evaluate the photocatalytic activity of the synthesized samples, photocatalytic H2 generation from water is carried out under simulated solar light with AM 1.5G conditions in the presence of hole scavengers, i.e., 0.125 M Na2S and 0.175 M Na2SO3. Figure 6a and Figure S7 represent the photocatalytic hydrogen generation rate on synthesized samples. Pure TiO2 and pure CdS yield 565 and 673 µmole g−1 h−1 of hydrogen respectively under irradiation. The amount of H2 generation is increased to 954 µmole g−1 h−1 by forming a heterojunction of CdS and TiO2 (CdS@TiO2). The amount of hydrogen generated is further increased by the incorporation of G between CdS and TiO2 (CdS@xG@TiO2) as shown in Figure S6. As the amount of GQD increases from 20 to 50 µL, the amount of generated H2 is also increased and the most active sample yields 1510 µmole g−1 h−1 (CdS@50G@TiO2) which is ~2.7 times and ~2.2 times higher than pure TiO2 and pure CdS, respectively. The hydrogen generation decreases with further increase in the amount of GQD in the samples due to the restriction of light absorption by the semiconductors with the presence of a thicker layer of G, as confirmed by UV-vis. Photocatalytic H2 generation from all samples along with the calculated apparent quantum efficiency (AQE) is tabulated in Table S1 and the most active sample (CdS@G@TiO2) exhibits AQE of 5.78. The achieved activity using core-shell particles of graphene-wrapped CdS and TiO2 is promising compared to the reported values employing CdS-TiO2 based heterojunction materials (Table S2). Furthermore, the current activity is also competitive to recently reported photocatalysts (Table S3) without the use of any noble metal, which is a significant step in increasing the activity of cost-effective photocatalysts. A control test was also conducted employing CdS@50G@TiO2 in dark which did not generate any detectable hydrogen, confirming that the hydrogen generation under light is mainly due to the photocatalytic reaction.
To investigate the stability, CdS@TiO2 and CdS@50G@TiO2 were run for 40 continuous hours in photocatalytic H2 generation tests using the same setup as the normal photocatalytic activity testing. Both samples display quite stable behavior in photocatalytic H2 generation for 40 h as shown in Figure 6b. The high stability can be attributed to the efficient charge separation taking place between CdS and TiO2. The holes (h+) which are responsible for the CdS photo-corrosion, are being efficiently neutralized. Furthermore, the shell of TiO2 on CdS@G protects the samples from physical degradation.

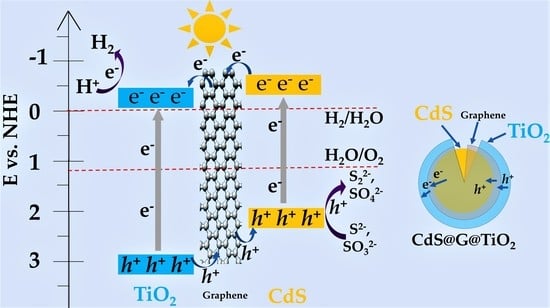
2.8. Reaction Mechanism

To understand the underlying reaction mechanism employing the CdS@xG@TiO2 samples, Mott–Schottky plots of pure CdS and pure TiO2 are measured to find the position of the conduction band potentials. Figure 7a,b represents the Mott–Schottky plots of pure CdS and pure TiO2 respectively confirming the n-type behavior of both semiconductors by exhibiting a positive slope of the plot [53,54]. The position of the conduction band of the n-type semiconductor is considered very close to the flat bandgap of the semiconductor, and hence the conduction band potential (ECB) of pure CdS and pure TiO2 is estimated to be −0.31 V and −0.05 V (vs. SHE, pH = 0) respectively as shown in Figure 7a,b. By using the relationship of ECB and bandgap (Eg), the valence band potential (EVB) was calculated for pure CdS and pure TiO2 which appeared at 2.00 and 2.95 V (vs. SHE, pH = 0) as summarized in Table S4. The valence band maximum (EVBM) is also evaluated by measuring the valence band region of pure CdS and pure TiO2 using XPS as shown in Figure 7c. The EVBM of pure CdS and pure TiO2 appears at 1.6 and 2.5 eV below the Fermi level (Ef). The difference of EVBM of pure CdS and pure TiO2 using valence band XPS is 0.9 eV close to the estimated difference of EVB (0.95 eV) using the Mott–Schottky plot and Eg values (See Table S4). The band alignment at the interface of CdS@50G@TiO2 samples is also determined by calculating the valence band offset (ΔEv) and conduction band offset (ΔEc) employing the following equations [55,56]:
Δ Ev = E V B M b E V B M a + E C L a E C L ( i ) a + E C L b E C L ( i ) b
Δ Ec = E g b E g a + Δ Ev
Here, a and b represent pure CdS and pure TiO2, respectively. ΔEv is the energy difference between the valence band maximum of CdS and TiO2 and ΔEc is the energy difference of the conduction band minimum of CdS and TiO2 at the junction after band bending. E V B M b ,   E V B M a ,   E C L a ,   E C L ( i ) a ,   E C L b   and   E C L ( i ) b represent valence band maximum of pure TiO2 (2.5 eV), valence band maximum of pure CdS (1.6 eV), core level binding energy of Cd 3d in pure CdS (405.1 eV), core level binding energy of Cd 3d in CdS@50G@TiO2 (405.1 eV), core level binding energy of Ti 2p in pure TiO2 (458.6 eV) and core level binding energy of Ti 2p in CdS@50G@TiO2 (458.8 eV) respectively. The E g b   and   E g a are the bandgap energy of pure TiO2 and pure CdS, respectively. The ΔEV and ΔEC appeared at 0.7 eV and 1.39 eV, and the bands will be bending upwards due to the n-type nature of both semiconductors. Furthermore, the work function (ΦG) of graphene appears at 0.1 V (vs. NHE, pH = 0) [24] which is between the ECB of CdS and TiO2. The proposed band bending diagram of CdS@50G@TiO2 is shown in the in-set of Figure 7c which is in accordance with the reported band diagram of CdS-Au-TiO2 [57]. Under illumination, the electrons will be excited to the conduction band of TiO2 and CdS, and the photogenerated electrons in the conduction band of CdS will migrate toward the conduction band of TiO2 by passing through the graphene layer due to the difference of the ECB potential. The presence of graphene between CdS and TiO2 plays a role in decreasing the potential of the Schottky barrier [18] which allows easy transfer of electrons from the conduction band of CdS to the conduction band of TiO2. The excited electrons in the conduction band of TiO2 undergo a redox reaction to convert H+ ions from water to generate H2 (H+/H2 = 0 V, vs. NHE, pH = 0) as shown in Figure 7d. On the other hand, photogenerated holes in the valence band of TiO2 migrates to the valance band of CdS by passing through the graphene layer and undergo oxidation and become neutralized by the hole scavenger present in the reaction mixture. The photocatalytic activity depends on the surface area of the CdS@TiO2 nanocomposite as confirmed by our previous results [16]. With the incorporation of graphene between CdS and TiO2 to form CdS@xG@TiO2, no change in the surface area is observed relative to CdS@TiO2 as shown in Table S1, which confirms that the photocatalytic activity of CdS@xG@TiO2 is independent of the surface area of the composite. Based on the optical properties of the material, electrochemical impedance, Mott–Schottky plots and valance band XPS measurements, the increase in the photocatalytic activity for H2 generation is attributed to the enhanced light absorption, effective net charge separation and charge migration between CdS and TiO2.

3. Materials and Methods

3.1. Materials and Reagents

Titanium (IV) isopropoxide (TTIP, 98%), cadmium acetate dihydrate (Cd (OOCCH2)2·2H2O, 98%), and citric acid (CA, ACS. ≥ 99.5%) were ordered from Sigma-Aldrich (Munich, Germany). Thiourea (SC(NH2)2, ACS. ≥ 99%), sodium hydroxide (NaOH, ≥ 99%) and absolute ethanol (C2H5OH) were purchased from Alfa Aesar (Kandel, Germany), Millipore (Darmstadt, Germany), and VWR CHEMICALS (Langenfeld, Germany ) respectively. Sodium sulfite (Na2SO3, 98%) and sodium sulfide nonahydrate (Na2S·9H2O, ACS. 98%) were procured from Alfa Aesar (Kandel, Germany). All the chemical reagents were used without any further modification and deionized (DI) water is used during the synthesis process.

3.2. Synthesis of CdS Nanoparticles

A hydrothermal method [16] was applied for the synthesis of pure CdS nanoparticles. In brief, a clear solution of 1.8 g of cadmium acetate dihydrate and 5.26 g of thiourea is made in 60 mL of DI water and transferred to a Teflon-lined hydrothermal autoclave (volume = 90 mL) after stirring for 10 min. Then, the autoclave filled with the resultant solution was kept in a box furnace at 180 °C for 18 h. With the completion of the reaction, CdS nanoparticles of orange color were collected from the naturally cooled autoclave and washed with DI water several times. After drying at 80 °C for 12 h, pure CdS nanoparticles were obtained.

3.3. Synthesis of Graphene Quantum Dots (GQD)

Graphene quantum dots (GQD) were synthesized by the pyrolysis of citric acid as reported previously [24,58]. Briefly, citric acid (2 g) was melted at 180 °C until the color of the liquid citric acid changed to orange and the obtained melted product was then added in 20 mL of a water solution containing 1 g NaOH under vigorous stirring. A mixture of G in H2O was obtained with a concentration of ~100 mg mL−1 and extensive characterization of such GQD has already been reported [24].

3.4. Synthesis of CdS@Graphene@TiO2 Samples (CdS@G@TiO2)

For the synthesis of CdS@G@TiO2, a mixture of 300 mg of CdS nanoparticles, 2 mL of DI water and a specific amount of GQD solution was dispersed properly by sonicating for 30 min in a glass vial. After sonication, the mixture was dried at 80 °C in an oven to obtain the CdS@G samples. To make a shell of TiO2 over the CdS@G samples, 200 mg of CdS@G was again dispersed in C2H5OH (40 mL), sonicated for 30 min and 1.11 mL of TTIP was added to achieve uniform suspension. After that, 20 mL of DI water was added dropwise under vigorous stirring. The mixture was then transferred to a Teflon-lined hydrothermal autoclave and kept in the hydrothermal reactor at 180 °C for 18 h in the furnace. After cooling down to room temperature, the core-shell particles of graphene wrapped CdS and TiO2 (CdS@G@TiO2) are collected and washed with DI water several times followed by drying at 80 °C overnight. According to stoichiometric calculations, the mass ratio of CdS and TiO2 in the obtained mixture was kept at 2:3 which was optimized in our previous work to obtain the highest photocatalytic activity for H2 generation for the CdS@TiO2 samples without G [16]. To find the effect of the graphene layer between the CdS core and the TiO2 shell, a series of samples were synthesized by varying the content of GQD solution in the synthesis process (20, 30, 40, 50, 60, 80 µL correspond to 100 mg mL−1 concentration of graphene) to obtain the CdS@20G@TiO2, CdS@30G@TiO2, CdS@40G@TiO2, CdS@50G@TiO2, CdS@60G@TiO2, and CdS@80G@TiO2 samples. Pure TiO2 and CdS@TiO2 were also synthesized by following the same procedure without CdS@G and G, respectively.

3.5. Material Characterization Techniques

The crystal structure of all the samples was analyzed by powder X-ray diffraction (XRD) and patterns were recorded in the range of 2θ = 10–70° by employing an X-ray diffractometer (D8 A25 DaVinci, Bruker, Cambridge, United Kingdom) with Cu Kα radiation (λ= 1.54 Å). Raman analysis was performed with a micro-Raman spectrometer (InVia Reflex Spectrometer System, Renishaw, Järfälla, Sweden) equipped with a 532 nm wavelength laser. Fourier transform infrared (FTIR) spectra of the samples were measured by using a Thermo Scientific NICOLET iS50 FT-IR instrument (Dreieich, Germany). The morphological analysis of the synthesized samples was performed with an in-lens cold field emission electron microscope FE-S(T)EM, (Hitachi S-5500, Hitachi, Japan) equipped with a Bruker EDX-system and a transmission electron microscopy (Jeol JEM 2100—LaB6, Tokyo, JAPAN) operating at 200kV. The textural properties of the samples were analyzed by N2 sorption isotherms Micromeritics (TriStarII3020, Norcross, GA, U.S.A.) apparatus. The optical behavior was investigated by measuring the UV–vis diffuse reflectance spectra (DRS) of the samples on a spectrometer (AvaSpec-3648, Avantes, Apeldoorn, The Netherlands) connected to an integrated sphere (AvaSphere-30-REFL, Avantes, Apeldoorn, The Netherlands) and light source (Avalight-DHS, Avantes, Apeldoorn, The Netherlands) with optical fibers. The baseline of the spectrometer was first set against BaSO4 before measuring the DRS. The surface analysis of the samples was performed with X-ray photoelectron spectroscopy (XPS) (Axis Ultra DLD XP spectrometer, Kratos Analytical, Manchester United Kingdom) using a Al Kα (1486.6 eV) monochromated source. All the peaks of the samples were calibrated against C 1s of the adventurous carbon at 284.8 eV and core level spectra are measured with a pass energy of 10 eV. All the XPS data are fitted using CASA XPS software.

3.6. Photoelectrochemical (PEC) Measurements

The standard three-electrode configuration setup is used to measure the photoelectrochemical properties by employing Princeton Versa STAT potentiostat analyzer (Princeton Applied Research, Cambridge, United Kingdom) under dark and simulated solar light using a 150 W Xenon solar simulator (SCIENCE TECH SS150 with AM 1.5 G filter, London, Canada). For PEC measurements, working electrodes were prepared by coating 1 cm2 area of the fluorine-doped tin oxide (FTO) with uniformLy dispersed photocatalysts in ethanol by the doctor’s blade technique. A Pt wire and Ag/AgCl were used as the counter electrode and the reference electrode, respectively and aqueous 0.1 M Na2S (pH = 13) is used as the electrolyte. The transient photocurrent response was recorded in light and dark with an interval of 20 s at 0 V (vs. Ag/AgCl) bias. The Nyquist plots were obtained by measuring the electrochemical impedance (EIS) in dark and light by applying 0 V (vs. Ag/AgCl) with AC amplitude of 10 mV in a frequency range of 0.5 Hz–0.1 MHz. To find the valence band position of pure CdS and TiO2, Mott–Schottky plots were recorded in dark with a frequency of 1–20000 Hz and voltage range of −1.5 to 1 V.

3.7. Photocatalytic H2 Generation Setup

For the photocatalytic H2 generation tests, a previously reported setup was used [16] and presented in Figure S8. For photocatalytic reactions, 600 mL of DI water containing 0.125 M Na2S and 0.175 M Na2SO3 acting as hole scavengers, and 40 mg of the photocatalysts were dispersed by sonication. The photoreactor containing the reactants was sealed, and to remove any absorbed oxygen, Ar gas was purged at 100 mL min−1 through the reactor for 30 min in dark. After degassing, the photoreactor was irradiated with simulated solar light from 150 W Xeon solar simulator (SCIENCETECH SS150, London, Canada) equipped with SCIENCETECH FRSS AM 1.5 G. The photogenerated H2 during the reaction was measured after every 15 min from the effluent of the reaction by using an on-line micro-Gas chromatograph (Agilent Technologies 3000, Santa Clara, CA, United States). The apparent quantum efficiency of all the photocatalytic samples was calculated using the method described in the supplementary materials (S1).

4. Conclusions

With the motivation of developing noble metal-free and cost-effective photocatalyst with enhanced photocatalytic activity and stability, core-shell particles of graphene-wrapped CdS particles and TiO2 (CdS@xG@TiO2) were synthesized with a facile synthesis approach. The layer thickness of the graphene between the CdS core and the TiO2 shell is optimized by varying the content of graphene quantum dots in the synthesis procedure to obtain enhanced light absorption and efficient charge transfer, due to the presence of conductive graphene between the CdS and TiO2. The presence of graphene between CdS and TiO2 behaves as an electron reservoir and charge transmitter which induces shorter Schottky barriers to move the photoinduced charges between CdS and TiO2. The enhanced light absorption and efficient charge transfer in the photocatalysts were further confirmed by UV-vis DRS and electrochemical measurements. The improved photocatalytic properties of the most optimized sample (CdS@50G@TiO2) gave high photocatalytic activity towards H2 generation from water with promising catalyst stability. The layer of TiO2 and graphene over CdS provide a shielding effect from photo-corrosion of CdS by efficiently transferring the holes from CdS toward TiO2 leading to high stability. The dual core-shell approach by tuning the conductive role of graphene between two semiconductors is shown to be a promising approach for achieving high photocatalytic activity and stability.

Supplementary Materials

The following are available online at https://www.mdpi.com/2073-4344/10/4/358/s1, S1: Calculation steps for Apparent Quantum Efficiency (AQE), Figure S1: XRD pattern of CdS@xG@TiO2 (x = 20, 30, 40, 50, 60, 80 µL of GQD solution with a concentration of ~ 100 mg mL−1 were used in the synthesis), Figure S2: Raman spectrum of CdS@50G@TiO2 sample, Figure S3: EDX elemental mapping images of CdS@50G@TiO2 sample which shows the presence of Cd, S, C, O and Ti in the sample, Figure S4: TEM image of CdS@50G@TiO2 sample, Figure S5. UV-vis spectrum of pure graphene quantum dots (GQD), Figure S6: UV-vis DRS spectra of CdS@xG@TiO2 samples, Figure S7: Photocatalytic H2 generation from water employing CdS@TiO2 and CdS@xG@TiO2 samples under simulated solar light with 1.5 AM filter, Figure S8: Schematic diagram of photocatalytic H2 generation setup in which Ar gas (a) was bubbled through mass flow controller (b) from the photoreactor (c) (V = 1.2 L) filled with a uniform reaction mixture consisting of 40 mg photocatalyst in aqueous Na2S and Na2SO3 solution. The photoreactor is illuminated with a solar simulator (d) equipped with AM 1.5 G filter and the effluent of the photoreactor is analyzed by a micro-gas chromatography unit (e). Table S1: BET surface areas, H2 production rates and apparent quantum efficiencies (AQE) of all the photocatalytic samples; Table S2: Comparison of various CdS-TiO2 with carbon and noble metal based photocatalysts reported for photocatalytic H2 generation from water; Table S3: Comparison of various photocatalysts recently reported for photocatalytic H2 generation from water; Table S4: Estimated values of valence band potential (EVB), conduction band potential (ECB) bandgap (Eg) and the difference in the valence band potential (ΔEVB) for pure CdS and pure TiO2 nanoparticles. The valence band maximum (EVBM) measured by valance band XPS.

Author Contributions

Conceptualization, M.Z., M.R. and J.Y.; methodology M.Z., M.R. and J.Y.; formal analysis, M.Z., I.-H.S., M.R. and J.Y.; investigation, M.Z.; I.-H.S., M.R. and J.Y.; writing—original draft preparation, M.Z.; writing—review and editing, M.Z., I.-H.S., M.R. and J.Y.; visualization, M.Z.; supervision, M.R. and J.Y.; project administration, J.Y.; funding acquisition, J.Y. All authors have read and agreed to the published version of the manuscript.

Funding

The authors thank NTNU for strategic funding support.

Acknowledgments

The Authors would like to acknowledge the Research Council of Norway through the support of the NTNU NanoLab (grant number 245963) and Norwegian Center for Transmission Electron Microscopy, NORTEM (197405/F50) which provided the characterization tools.

Conflicts of Interest

The authors declare no conflict of interest.

References

  1. Ul’yanin, Y.A.; Kharitonov, V.V.; Yurshina, D.Y. Forecasting the Dynamics of the Depletion of Conventional Energy Resources. Stud. Russ. Econ. Dev. 2018, 29, 153–160. [Google Scholar] [CrossRef]
  2. Chandrasekaran, S.; Yao, L.; Deng, L.; Bowen, C.; Zhang, Y.; Chen, S.; Lin, Z.; Peng, F.; Zhang, P. Recent advances in metal sulfides: From controlled fabrication to electrocatalytic, photocatalytic and photoelectrochemical water splitting and beyond. Chem. Soc. Rev. 2019, 48, 4178–4280. [Google Scholar] [CrossRef] [PubMed]
  3. Kim, J.H.; Hansora, D.; Sharma, P.; Jang, J.-W.; Lee, J.S. Toward practical solar hydrogen production—An artificial photosynthetic leaf-to-farm challenge. Chem. Soc. Rev. 2019, 48, 1908–1971. [Google Scholar] [CrossRef] [PubMed]
  4. Yuan, Y.-J.; Chen, D.; Yu, Z.-T.; Zou, Z.-G. Cadmium sulfide-based nanomaterials for photocatalytic hydrogen production. J. Mater. Chem. A 2018, 6, 11606–11630. [Google Scholar] [CrossRef]
  5. Daskalaki, V.M.; Antoniadou, M.; Li Puma, G.; Kondarides, D.I.; Lianos, P. Solar Light-Responsive Pt/CdS/TiO2 Photocatalysts for Hydrogen Production and Simultaneous Degradation of Inorganic or Organic Sacrificial Agents in Wastewater. Environ. Sci. Technol. 2010, 44, 7200–7205. [Google Scholar] [CrossRef] [PubMed]
  6. Wang, Y.; Wang, Y.; Xu, R. Photochemical Deposition of Pt on CdS for H2 Evolution from Water: Markedly Enhanced Activity by Controlling Pt Reduction Environment. J. Phys. Chem. C 2013, 117, 783–790. [Google Scholar] [CrossRef]
  7. Liu, M.; Du, Y.; Ma, L.; Jing, D.; Guo, L. Manganese doped cadmium sulfide nanocrystal for hydrogen production from water under visible light. Int. J. Hydrog. Energy 2012, 37, 730–736. [Google Scholar] [CrossRef]
  8. Oskoui, M.S.; Khatamian, M.; Haghighi, M.; Yavari, A. Photocatalytic hydrogen evolution from water over chromosilicate-based catalysts. RSC Adv. 2014, 4, 19569–19577. [Google Scholar] [CrossRef]
  9. Kim, M.; Kim, Y.K.; Lim, S.K.; Kim, S.; In, S.-I. Efficient visible light-induced H2 production by Au@CdS/TiO2 nanofibers: Synergistic effect of core–shell structured Au@CdS and densely packed TiO2 nanoparticles. Appl. Catal. B Environ. 2015, 166–167, 423–431. [Google Scholar] [CrossRef]
  10. Fang, J.; Xu, L.; Zhang, Z.; Yuan, Y.; Cao, S.; Wang, Z.; Yin, L.; Liao, Y.; Xue, C. Au@TiO2–CdS Ternary Nanostructures for Efficient Visible-Light-Driven Hydrogen Generation. ACS Appl. Mater. Interfaces 2013, 5, 8088–8092. [Google Scholar] [CrossRef]
  11. Yu, H.; Huang, Y.; Gao, D.; Wang, P.; Tang, H. Improved H2-generation performance of Pt/CdS photocatalyst by a dual-function TiO2 mediator for effective electron transfer and hole blocking. Ceram. Int. 2019, 45, 9807–9813. [Google Scholar] [CrossRef]
  12. Li, A.; Zhu, W.; Li, C.; Wang, T.; Gong, J. Rational design of yolk–shell nanostructures for photocatalysis. Chem. Soc. Rev. 2019, 48, 1874–1907. [Google Scholar] [CrossRef] [PubMed]
  13. Liu, S.; Zhang, N.; Tang, Z.-R.; Xu, Y.-J. Synthesis of One-Dimensional CdS@TiO2 Core–Shell Nanocomposites Photocatalyst for Selective Redox: The Dual Role of TiO2 Shell. ACS Appl. Mater. Interfaces 2012, 4, 6378–6385. [Google Scholar] [CrossRef] [PubMed]
  14. Dong, W.; Pan, F.; Xu, L.; Zheng, M.; Sow, C.H.; Wu, K.; Xu, G.Q.; Chen, W. Facile synthesis of CdS@TiO2 core–shell nanorods with controllable shell thickness and enhanced photocatalytic activity under visible light irradiation. Appl. Surf. Sci. 2015, 349, 279–286. [Google Scholar] [CrossRef]
  15. Jiang, B.; Yang, X.; Li, X.; Zhang, D.; Zhu, J.; Li, G. Core-shell structure CdS/TiO2 for enhanced visible-light-driven photocatalytic organic pollutants degradation. J. Sol-Gel Sci. Technol. 2013, 66, 504–511. [Google Scholar] [CrossRef]
  16. Zubair, M.; Svenum, I.-H.; Rønning, M.; Yang, J. Facile synthesis approach for core-shell TiO2–CdS nanoparticles for enhanced photocatalytic H2 generation from water. Catal. Today 2019, 328, 15–20. [Google Scholar] [CrossRef]
  17. El-Atab, N.; Chowdhury, F.; Ulusoy, T.G.; Ghobadi, A.; Nazirzadeh, A.; Okyay, A.K.; Nayfeh, A. ~3-nm ZnO Nanoislands Deposition and Application in Charge Trapping Memory Grown by Single ALD Step. Sci. Rep. 2016, 6, 38712. [Google Scholar] [CrossRef]
  18. Wu, W.; Jiang, C.; Roy, V.A. Recent progress in magnetic iron oxide–semiconductor composite nanomaterials as promising photocatalysts. Nanoscale 2015, 7, 38–58. [Google Scholar] [CrossRef] [Green Version]
  19. Zhou, J.; Ren, F.; Zhang, S.; Wu, W.; Xiao, X.; Liu, Y.; Jiang, C. SiO2–Ag–SiO2–TiO2 multi-shell structures: Plasmon enhanced photocatalysts with wide-spectral-response. J. Mater. Chem. A 2013, 1, 13128–13138. [Google Scholar] [CrossRef]
  20. Hou, Y.; Zuo, F.; Dagg, A.; Feng, P. Visible Light-Driven α-Fe2O3 Nanorod/Graphene/BiV1−xMoxO4 Core/Shell Heterojunction Array for Efficient Photoelectrochemical Water Splitting. Nano Lett. 2012, 12, 6464–6473. [Google Scholar] [CrossRef]
  21. Moussa, H.; Girot, E.; Mozet, K.; Alem, H.; Medjahdi, G.; Schneider, R. ZnO rods/reduced graphene oxide composites prepared via a solvothermal reaction for efficient sunlight-driven photocatalysis. Appl. Catal. B Environ. 2016, 185, 11–21. [Google Scholar] [CrossRef]
  22. Minella, M.; Sordello, F.; Minero, C. Photocatalytic process in TiO2/graphene hybrid materials. Evidence of charge separation by electron transfer from reduced graphene oxide to TiO2. Catal. Today 2017, 281, 29–37. [Google Scholar] [CrossRef]
  23. Xiang, Q.; Yu, J. Graphene-Based Photocatalysts for Hydrogen Generation. J. Phys. Chem. Lett. 2013, 4, 753–759. [Google Scholar] [CrossRef]
  24. Zubair, M.; Kim, H.; Razzaq, A.; Grimes, C.A.; In, S.-I. Solar spectrum photocatalytic conversion of CO2 to CH4 utilizing TiO2 nanotube arrays embedded with graphene quantum dots. J. CO2 Util. 2018, 26, 70–79. [Google Scholar] [CrossRef]
  25. Kuznetsova, Y.V.; Rempel, A.A. Size and zeta potential of CdS nanoparticles in stable aqueous solution of EDTA and NaCl. Inorg. Mater. 2015, 51, 215–219. [Google Scholar] [CrossRef]
  26. Park, S.W.; Huang, C.P. The surface acidity of hydrous CdS(s). J. Colloid Interface Sci. 1987, 117, 431–441. [Google Scholar] [CrossRef]
  27. Liu, S.; Yang, M.-Q.; Xu, Y.-J. Surface charge promotes the synthesis of large, flat structured graphene–(CdS nanowire)–TiO2 nanocomposites as versatile visible light photocatalysts. J. Mater. Chem. A 2014, 2, 430–440. [Google Scholar] [CrossRef]
  28. Liu, H.; Lv, T.; Wu, X.; Zhu, C.; Zhu, Z. Preparation and enhanced photocatalytic activity of CdS@RGO core–shell structural microspheres. Appl. Surf. Sci. 2014, 305, 242–246. [Google Scholar] [CrossRef]
  29. Kuai, L.; Zhou, Y.; Tu, W.; Li, P.; Li, H.; Xu, Q.; Tang, L.; Wang, X.; Xiao, M.; Zou, Z. Rational construction of a CdS/reduced graphene oxide/TiO2 core–shell nanostructure as an all-solid-state Z-scheme system for CO2 photoreduction into solar fuels. RSC Adv. 2015, 5, 88409–88413. [Google Scholar] [CrossRef]
  30. Chen, G.; Wu, S.; Hui, L.; Zhao, Y.; Ye, J.; Tan, Z.; Zeng, W.; Tao, Z.; Yang, L.; Zhu, Y. Assembling carbon quantum dots to a layered carbon for high-density supercapacitor electrodes. Sci. Rep. 2016, 6, 19028. [Google Scholar] [CrossRef]
  31. Chen, C.; Yang, Q.-H.; Yang, Y.; Lv, W.; Wen, Y.; Hou, P.-X.; Wang, M.; Cheng, H.-M. Self-Assembled Free-Standing Graphite Oxide Membrane. Adv. Mater. 2009, 21, 3007–3011. [Google Scholar] [CrossRef]
  32. Haque, S.E.; Ramdas, B.; Sheela, A.; Padmavathy, N. Facile one-pot low-temperature solid-state approach towards phase transformation of nanoCdS. Micro Nano Lett. 2014, 9, 731–735. [Google Scholar] [CrossRef]
  33. El-Maghrabi, H.H.; Barhoum, A.; Nada, A.A.; Moustafa, Y.M.; Seliman, S.M.; Youssef, A.M.; Bechelany, M. Synthesis of mesoporous core-shell CdS@TiO2 (0D and 1D) photocatalysts for solar-driven hydrogen fuel production. J. Photochem. Photobiol. A Chem. 2018, 351, 261–270. [Google Scholar] [CrossRef]
  34. Ge, M.-Z.; Li, S.-H.; Huang, J.-Y.; Zhang, K.-Q.; Al-Deyab, S.S.; Lai, Y.-K. TiO2 nanotube arrays loaded with reduced graphene oxide films: Facile hybridization and promising photocatalytic application. J. Mater. Chem. A 2015, 3, 3491–3499. [Google Scholar] [CrossRef]
  35. Liang, Y.; Zhai, L.; Zhao, X.; Xu, D. Band-Gap Engineering of Semiconductor Nanowires through Composition Modulation. J. Phys. Chem. B 2005, 109, 7120–7123. [Google Scholar] [CrossRef]
  36. Fernández-Merino, M.J.; Guardia, L.; Paredes, J.I.; Villar-Rodil, S.; Solís-Fernández, P.; Martínez-Alonso, A.; Tascón, J.M.D. Vitamin C is an Ideal Substitute for Hydrazine in the Reduction of Graphene Oxide Suspensions. J. Phys. Chem. C 2010, 114, 6426–6432. [Google Scholar] [CrossRef]
  37. Lei, Y.; Yang, C.; Hou, J.; Wang, F.; Min, S.; Ma, X.; Jin, Z.; Xu, J.; Lu, G.; Huang, K.-W. Strongly coupled CdS/graphene quantum dots nanohybrids for highly efficient photocatalytic hydrogen evolution: Unraveling the essential roles of graphene quantum dots. Appl. Catal. B Environ. 2017, 216, 59–69. [Google Scholar] [CrossRef] [Green Version]
  38. Gharedaghi, S.; Kimiagar, S.; Safa, S. P-Nitrophenol Degradation Using N-Doped Reduced Graphene-CdS Nanocomposites. Phys. Status Solidi 2018, 215, 1700618. [Google Scholar] [CrossRef]
  39. Yang, H.B.; Dong, Y.Q.; Wang, X.; Khoo, S.Y.; Liu, B. Cesium Carbonate Functionalized Graphene Quantum Dots as Stable Electron-Selective Layer for Improvement of Inverted Polymer Solar Cells. ACS Appl. Mater. Interfaces 2014, 6, 1092–1099. [Google Scholar] [CrossRef]
  40. He, G.; Zhang, Y.; He, Q. MoS2/CdS Heterostructure for Enhanced Photoelectrochemical Performance under Visible Light. Catalysts 2019, 9, 379. [Google Scholar] [CrossRef] [Green Version]
  41. Tauc, J.; Grigorovici, R.; Vancu, A. Optical Properties and Electronic Structure of Amorphous Germanium. Phys. Status Solidi 1966, 15, 627–637. [Google Scholar] [CrossRef]
  42. Zhang, L.; Fu, X.; Meng, S.; Jiang, X.; Wang, J.; Chen, S. Ultra-low content of Pt modified CdS nanorods: One-pot synthesis and high photocatalytic activity for H2 production under visible light. J. Mater. Chem. A 2015, 3, 23732–23742. [Google Scholar] [CrossRef]
  43. Xiang, Q.; Cheng, B.; Yu, J. Hierarchical porous CdS nanosheet-assembled flowers with enhanced visible-light photocatalytic H2-production performance. Appl. Catal. B Environ. 2013, 138–139, 299–303. [Google Scholar] [CrossRef]
  44. Duta, A.; Visa, M.; Manolache, S.A.; Nanu, M. Anatase (TiO2) Thin Layers for Solar Energy Conversion. In Proceedings of the 2008 11th International Conference on Optimization of Electrical and Electronic Equipment, Brasov, Romania, 22–24 May 2008; pp. 461–466. [Google Scholar]
  45. Wei, H.H.-Y.; Evans, C.M.; Swartz, B.D.; Neukirch, A.J.; Young, J.; Prezhdo, O.V.; Krauss, T.D. Colloidal Semiconductor Quantum Dots with Tunable Surface Composition. Nano Lett. 2012, 12, 4465–4471. [Google Scholar] [CrossRef]
  46. Okotrub, A.V.; Asanov, I.P.; Larionov, S.V.; Kudashov, A.G.; Leonova, T.G.; Bulusheva, L.G. Growth of CdS nanoparticles on the aligned carbon nanotubes. Phys. Chem. Chem. Phys. 2010, 12, 10871–10875. [Google Scholar] [CrossRef]
  47. Zhang, N.; Liu, S.; Fu, X.; Xu, Y.-J. Fabrication of coenocytic Pd@CdS nanocomposite as a visible light photocatalyst for selective transformation under mild conditions. J. Mater. Chem. 2012, 22, 5042–5052. [Google Scholar] [CrossRef]
  48. Fantauzzi, M.; Elsener, B.; Atzei, D.; Rigoldi, A.; Rossi, A. Exploiting XPS for the identification of sulfides and polysulfides. RSC Adv. 2015, 5, 75953–75963. [Google Scholar] [CrossRef]
  49. Wu, L.; Yu, J.C.; Fu, X. Characterization and photocatalytic mechanism of nanosized CdS coupled TiO2 nanocrystals under visible light irradiation. J. Mol. Catal. A Chem. 2006, 244, 25–32. [Google Scholar] [CrossRef]
  50. Jimmy, C.Y.; Yu, J.; Tang, H.Y.; Zhang, L. Effect of surface microstructure on the photoinduced hydrophilicity of porous TiO2 thin films. J. Mater. Chem. 2002, 12, 81–85. [Google Scholar]
  51. Wang, S.; Chen, Z.-G.; Cole, I.; Li, Q. Structural evolution of graphene quantum dots during thermal decomposition of citric acid and the corresponding photoluminescence. Carbon N. Y. 2015, 82, 304–313. [Google Scholar] [CrossRef] [Green Version]
  52. Murashkina; Bakiev; Artemev; Rudakova; Emeline; Bahnemann Photoelectrochemical Behavior of the Ternary Heterostructured Systems CdS/WO3/TiO2. Catalysts 2019, 9, 999. [CrossRef] [Green Version]
  53. Kumar, R.; El-Shishtawy, R.; Barakat, M. Synthesis and Characterization of Ag-Ag2O/TiO2@polypyrrole Heterojunction for Enhanced Photocatalytic Degradation of Methylene Blue. Catalysts 2016, 6, 76. [Google Scholar] [CrossRef]
  54. Hong, S.J.; Lee, S.; Jang, J.S.; Lee, J.S. Heterojunction BiVO4/WO3 electrodes for enhanced photoactivity of water oxidation. Energy Environ. Sci. 2011, 4, 1781–1787. [Google Scholar] [CrossRef] [Green Version]
  55. Santoni, A.; Biccari, F.; Malerba, C.; Valentini, M.; Chierchia, R.; Mittiga, A. Valence band offset at the CdS/Cu2ZnSnS4 interface probed by x-ray photoelectron spectroscopy. J. Phys. D Appl. Phys. 2013, 46, 175101. [Google Scholar] [CrossRef]
  56. Dias, S.; Krupanidhi, S.B. Determination of band offsets at the Al: ZnO/Cu2SnS3 interface using X-ray photoelectron spectroscopy. AIP Adv. 2015, 5, 047137. [Google Scholar] [CrossRef]
  57. Li, J.; Cushing, S.K.; Zheng, P.; Senty, T.; Meng, F.; Bristow, A.D.; Manivannan, A.; Wu, N. Solar Hydrogen Generation by a CdS-Au-TiO 2 Sandwich Nanorod Array Enhanced with Au Nanoparticle as Electron Relay and Plasmonic Photosensitizer. J. Am. Chem. Soc. 2014, 136, 8438–8449. [Google Scholar] [CrossRef]
  58. Dong, Y.; Shao, J.; Chen, C.; Li, H.; Wang, R.; Chi, Y.; Lin, X.; Chen, G. Blue luminescent graphene quantum dots and graphene oxide prepared by tuning the carbonization degree of citric acid. Carbon N. Y. 2012, 50, 4738–4743. [Google Scholar] [CrossRef]
Figure 1. (a) XRD patterns of pure TiO2, CdS and CdS@XG@TiO2 samples and (b) FTIR spectra of pure CdS and CdS@XG@TiO2 samples.
Catalysts 10 00358 g001
Figure 2. FE-SEM images of pure TiO2 (a), pure CdS (b), CdS@TiO2 (c), CdS@50G@TiO2 (d) and HR-TEM images of CdS@50G@TiO2 with lattice spacing (e).
Catalysts 10 00358 g002
Figure 3. UV-vis DRS spectra of pure TiO2, pure CdS, CdS@TiO2 and CdS@50G@TiO2 (a), bandgap measurements by using Tauc plots of pure CdS (b) and pure TiO2 (c).
Catalysts 10 00358 g003
Figure 4. High resolution XPS analysis of Cd 3d in pure CdS and CdS@50G@TiO2 (a), S 2p (b), Ti 2p (c), O 1s (d) of pure CdS and CdS@50G@TiO2 and C 1s of CdS@50G@TiO2 (e).
Catalysts 10 00358 g004
Figure 5. Transient photocurrent response (a) and EIS Nyquist plots (b) of pure TiO2, pure CdS, CdS@TiO2 and CdS@50G@TiO2 in light and dark.
Catalysts 10 00358 g005
Figure 6. Photocatalytic activity tests for hydrogen generation from water employing different samples (a) and stability tests under the same conditions (b) employing 40 mg of catalysts dispersed in 600 mL DI water with 0.125 M Na2S and 0.175 M Na2SO3 acting as hole scavengers illuminated with simulated solar light.
Catalysts 10 00358 g006
Figure 7. Mott–Schottky plots of pure CdS (a), pure TiO2 (b), valence band XPS along with band diagram of CdS@xG@TiO2 (c) and schematic photocatalytic reaction mechanism (d).
Catalysts 10 00358 g007

