Article

Comparison of Ga2O3 and TiO2 Nanostructures for Photocatalytic Degradation of Volatile Organic Compounds

1
Department of Materials Engineering, Korea Aerospace University, Goyang 10540, Korea
2
Radiation Laboratory, University of Notre Dame, Notre Dame, IN 46556, USA
3
School of Electrical Engineering, Korea Advanced Institute of Science and Technology(KAIST), Daejeon 34141, Korea
*
Authors to whom correspondence should be addressed.
Catalysts 2020, 10(5), 545; https://doi.org/10.3390/catal10050545
Submission received: 20 April 2020 / Revised: 8 May 2020 / Accepted: 8 May 2020 / Published: 14 May 2020

Abstract

:
The photocatalytic degradation of formaldehyde, acetaldehyde, toluene, and styrene are compared using monoclinic Ga2O3 and anatase TiO2 nanostructures under ultraviolet-C irradiation. These Ga2O3 and TiO2 photocatalysts are characterized using a field emission scanning electron microscope, a powder X-ray diffraction system, the Brunauer–Emmett–Teller method, and a Fourier transform infrared spectrometer. The Ga2O3 shows a higher reaction rate constant (k, min−1) than TiO2 by a factor of 7.1 for toluene, 8.1 for styrene, 3.1 for formaldehyde, and 2.0 for acetaldehyde. The results demonstrate that the photocatalytic activity ratio of the Ga2O3 over the TiO2 becomes more prominent toward the aromatic compounds compared with the nonaromatic compounds. Highly energetic photo-generated carriers on the conduction/valence band-edge of the Ga2O3, in comparison with that of the TiO2, result in superior photocatalytic activity, in particular on aromatic volatile organic compounds (VOCs) with a high bond dissociation energy.

1. Introduction

Indoor air quality has become an urgent issue as most people spend large amounts of time in residential and commercial buildings (such as housing complexes, schools, and offices) [1]. One of the main concerns indoors is the volatile organic compounds (VOCs) that are emitted from a wide range of chemicals and consumer products during use and even in storage. These VOCs are harmful to health and can cause respiratory symptoms, allergic skin reactions, headaches, and even cancer under long-term exposure. To reduce the concentration of VOCs indoors, air purification/filtration systems are often incorporated into air circulation systems. Photocatalytic oxidation (PCO) is a promising method to remove low-level VOCs compared with absorption and incineration methods because it is effective, inexpensive, and eco-friendly [2]. Semiconductor nano/microstructures can be used as efficient photocatalytic platforms wherein charge carriers (electron and hole pairs) are generated upon light irradiation with above-bandgap excitation [3,4]. These photo-generated electron–hole pairs within semiconductor photocatalysts can generate reactive oxygen species (ROSs such as hydroxyl (OH-·) and superoxide (O2-·) radicals) that turn the adsorbed VOCs into CO2 and H2O. Over the past half-century, since the photocatalytic effect was discovered in 1972 [5], TiO2 has been the dominant photocatalyst due to its photocatalytic activity and non-toxic properties [6]. However, TiO2-based photocatalysts suffer from long-term instability due to the intermediate residues on the TiO2 surface during the VOCs removal process [7,8]. This deactivation on the photocatalyst surface diminishes the photocatalytic activity and cyclic stability, limiting the further practical applications of TiO2-based photocatalysts [9,10]. Recently, Ga2O3 has emerged as a promising alternative with higher redox capabilities and longer-term stability than conventional TiO2 [3,4,8,11,12]. Ga2O3 elicits enhanced photocatalytic degradation for aromatic (benzene and its derivatives, including toluene and ethylbenzene) and nonaromatic compounds (ethylene, bromomethane, and butanone) in comparison with TiO2 under 254 nm ultraviolet-C (UVC) irradiation [4,8]. Thus far, researchers investigating the photocatalytic activities of Ga2O3 have focused on the degradation of individual VOCs, while correlations between the physical/chemical structures of VOCs and the corresponding photocatalytic performance have not yet been explored [8,13]. In addition, the fundamental physical constants related to VOC removal have not yet been established, which is essential to develop Ga2O3-based photocatalysts in air purification systems. In this work, we systematically compare the photocatalytic degradation of nonaromatic organic compounds (formaldehyde and acetaldehyde) and aromatic organic compounds (toluene and styrene) with Ga2O3 and TiO2 photocatalysts. The findings mark an important step towards the development of the photocatalytic degradation of VOCs over Ga2O3-based photocatalysts.

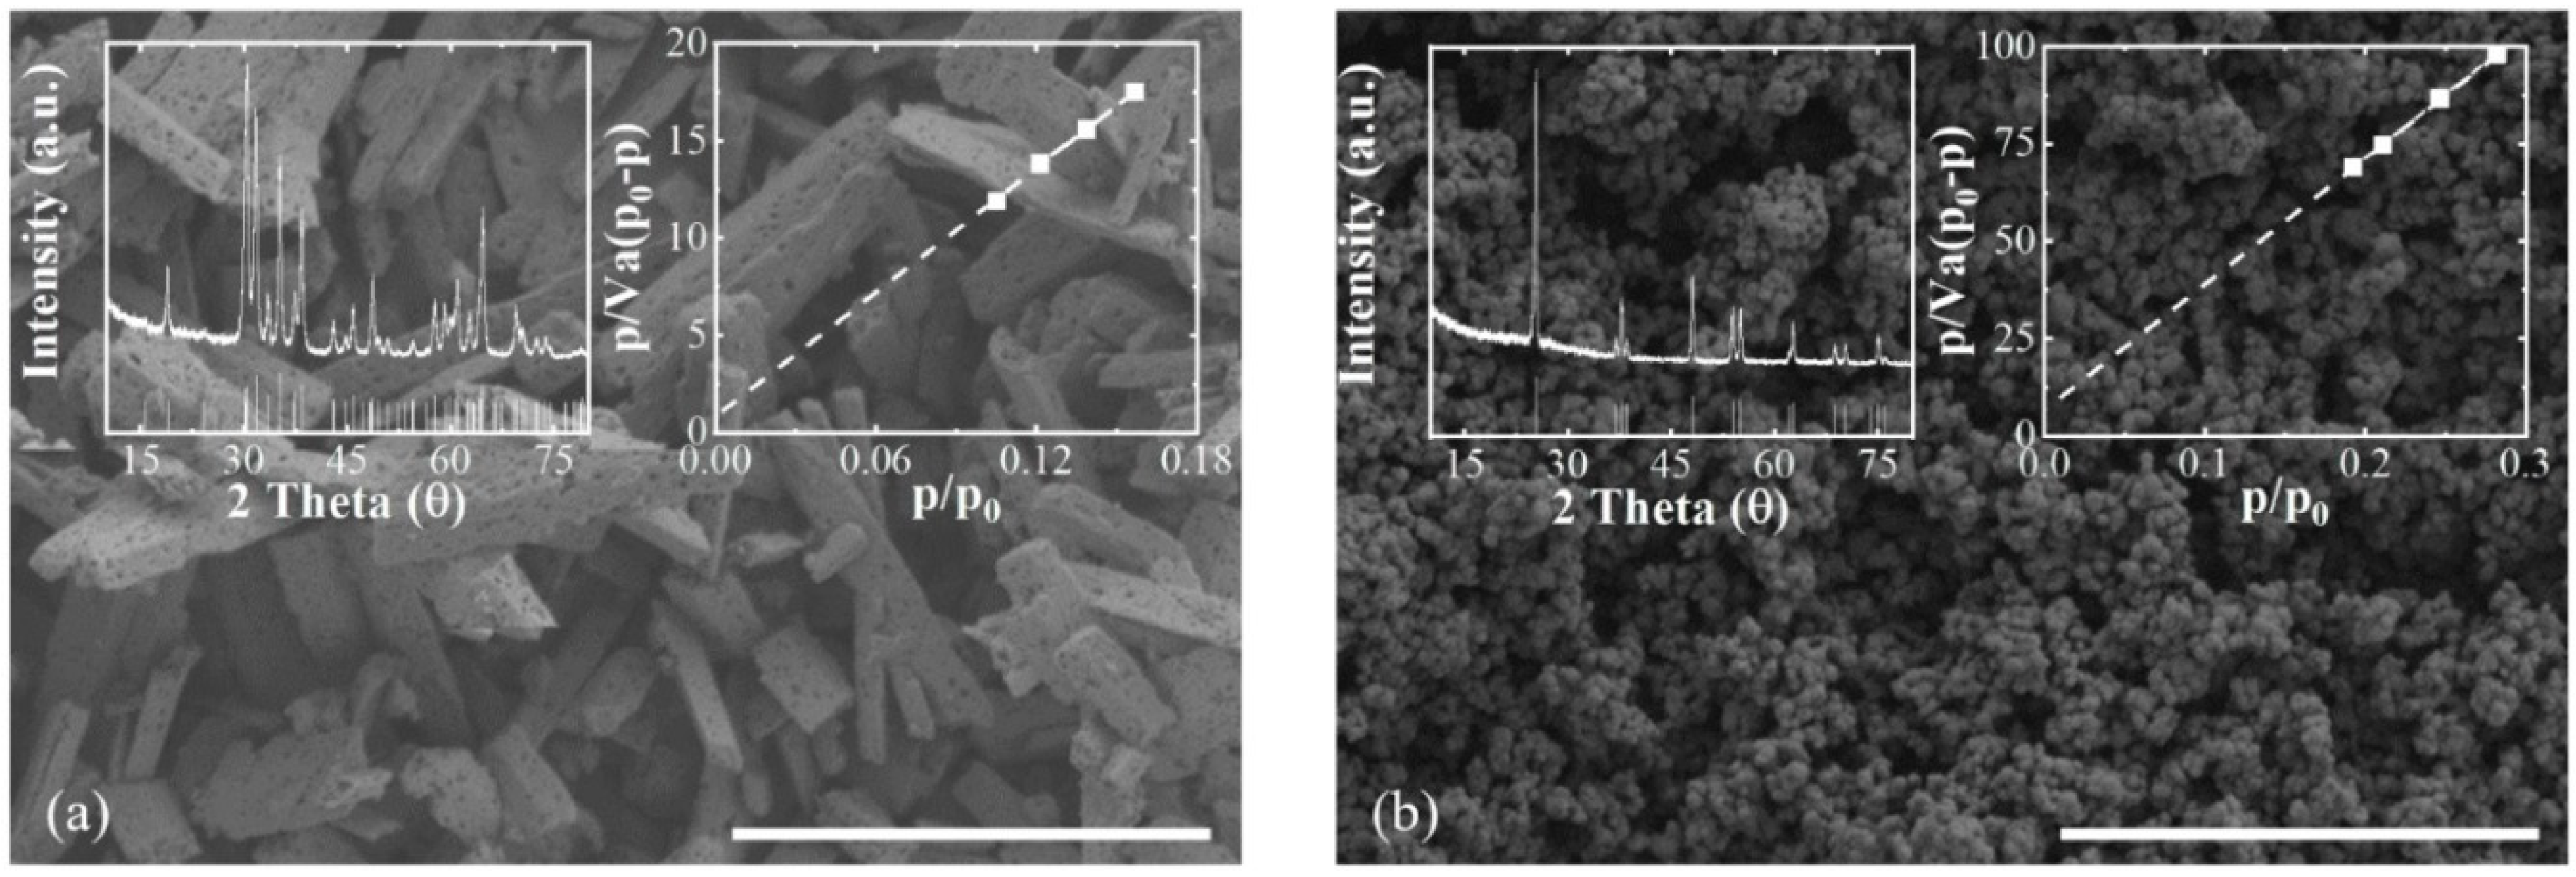
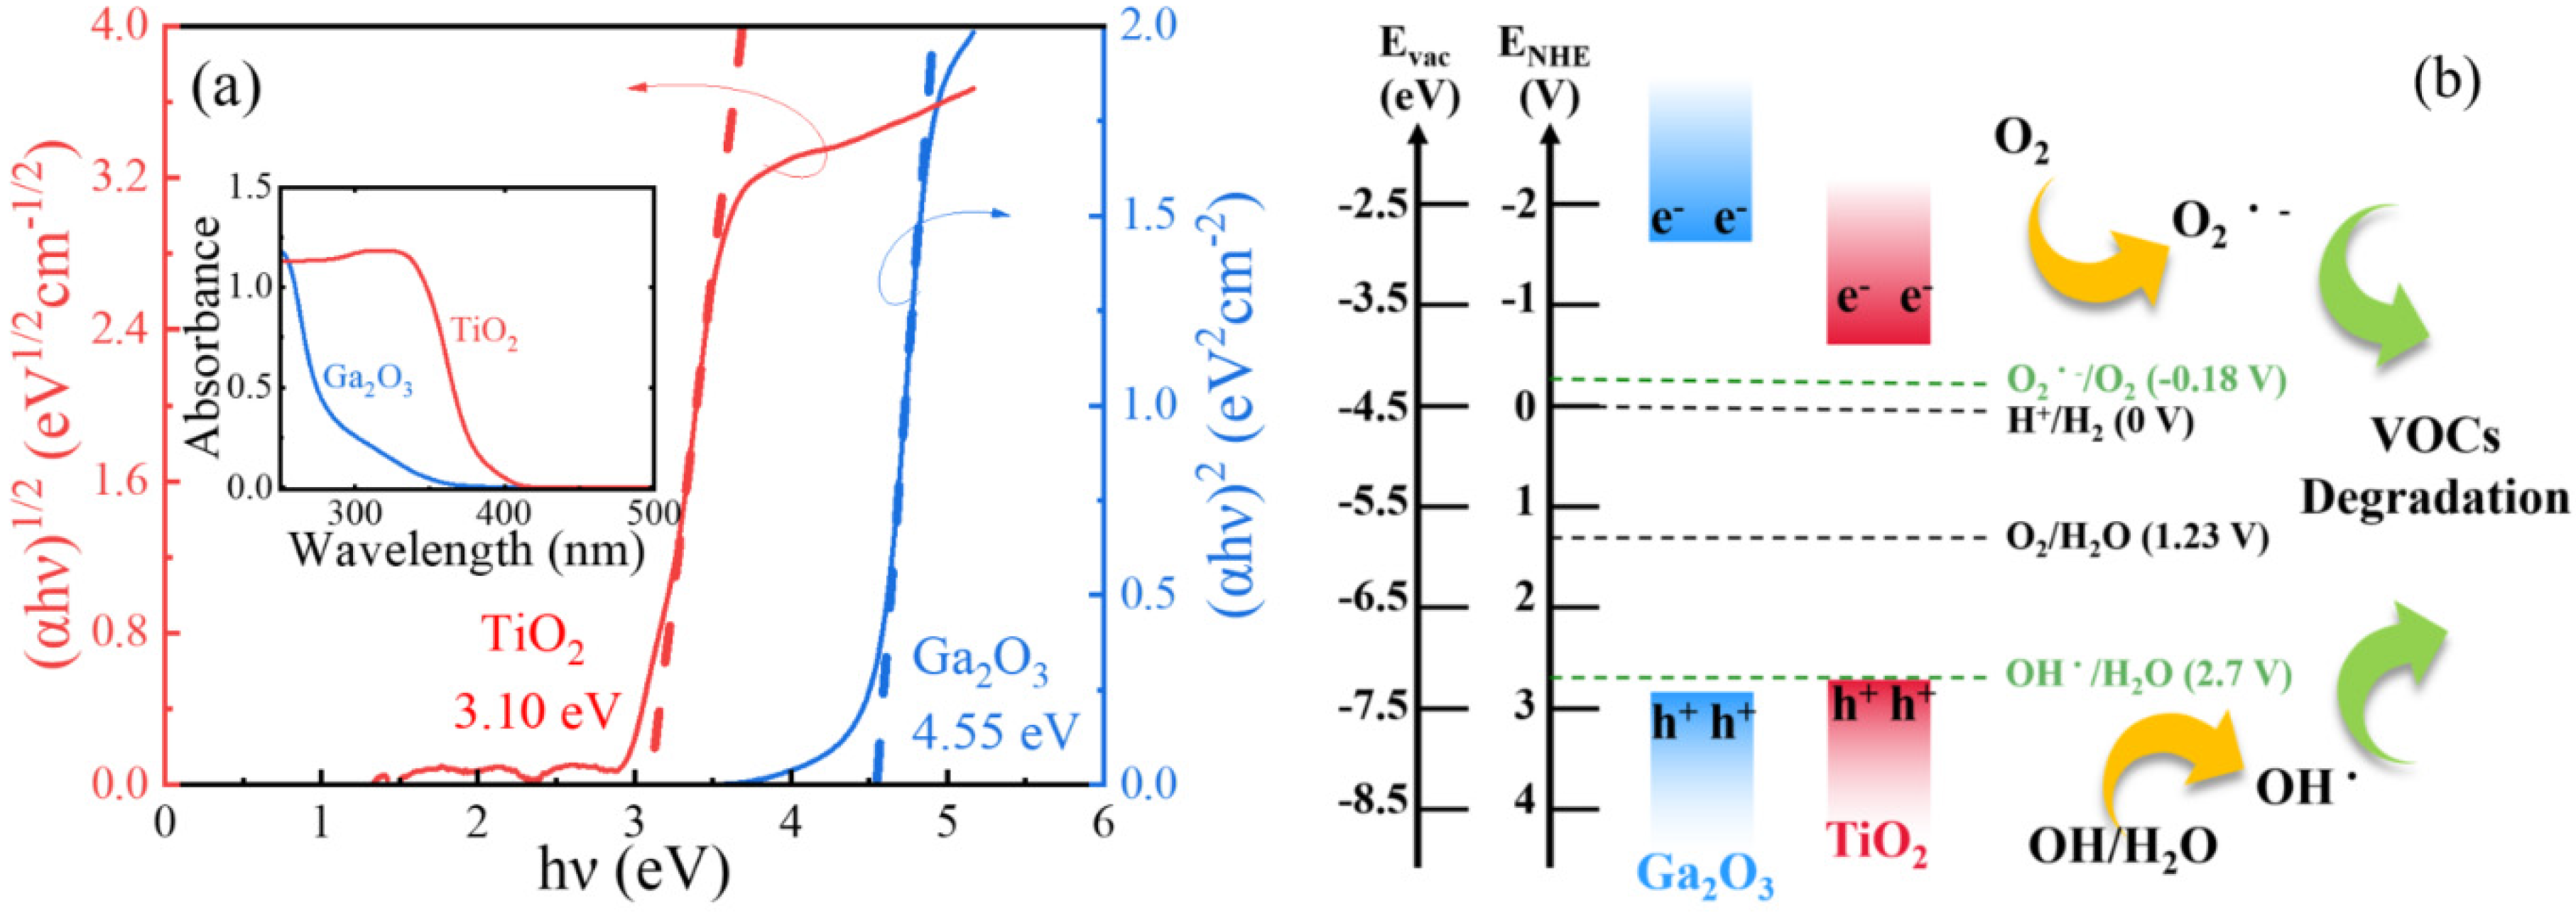
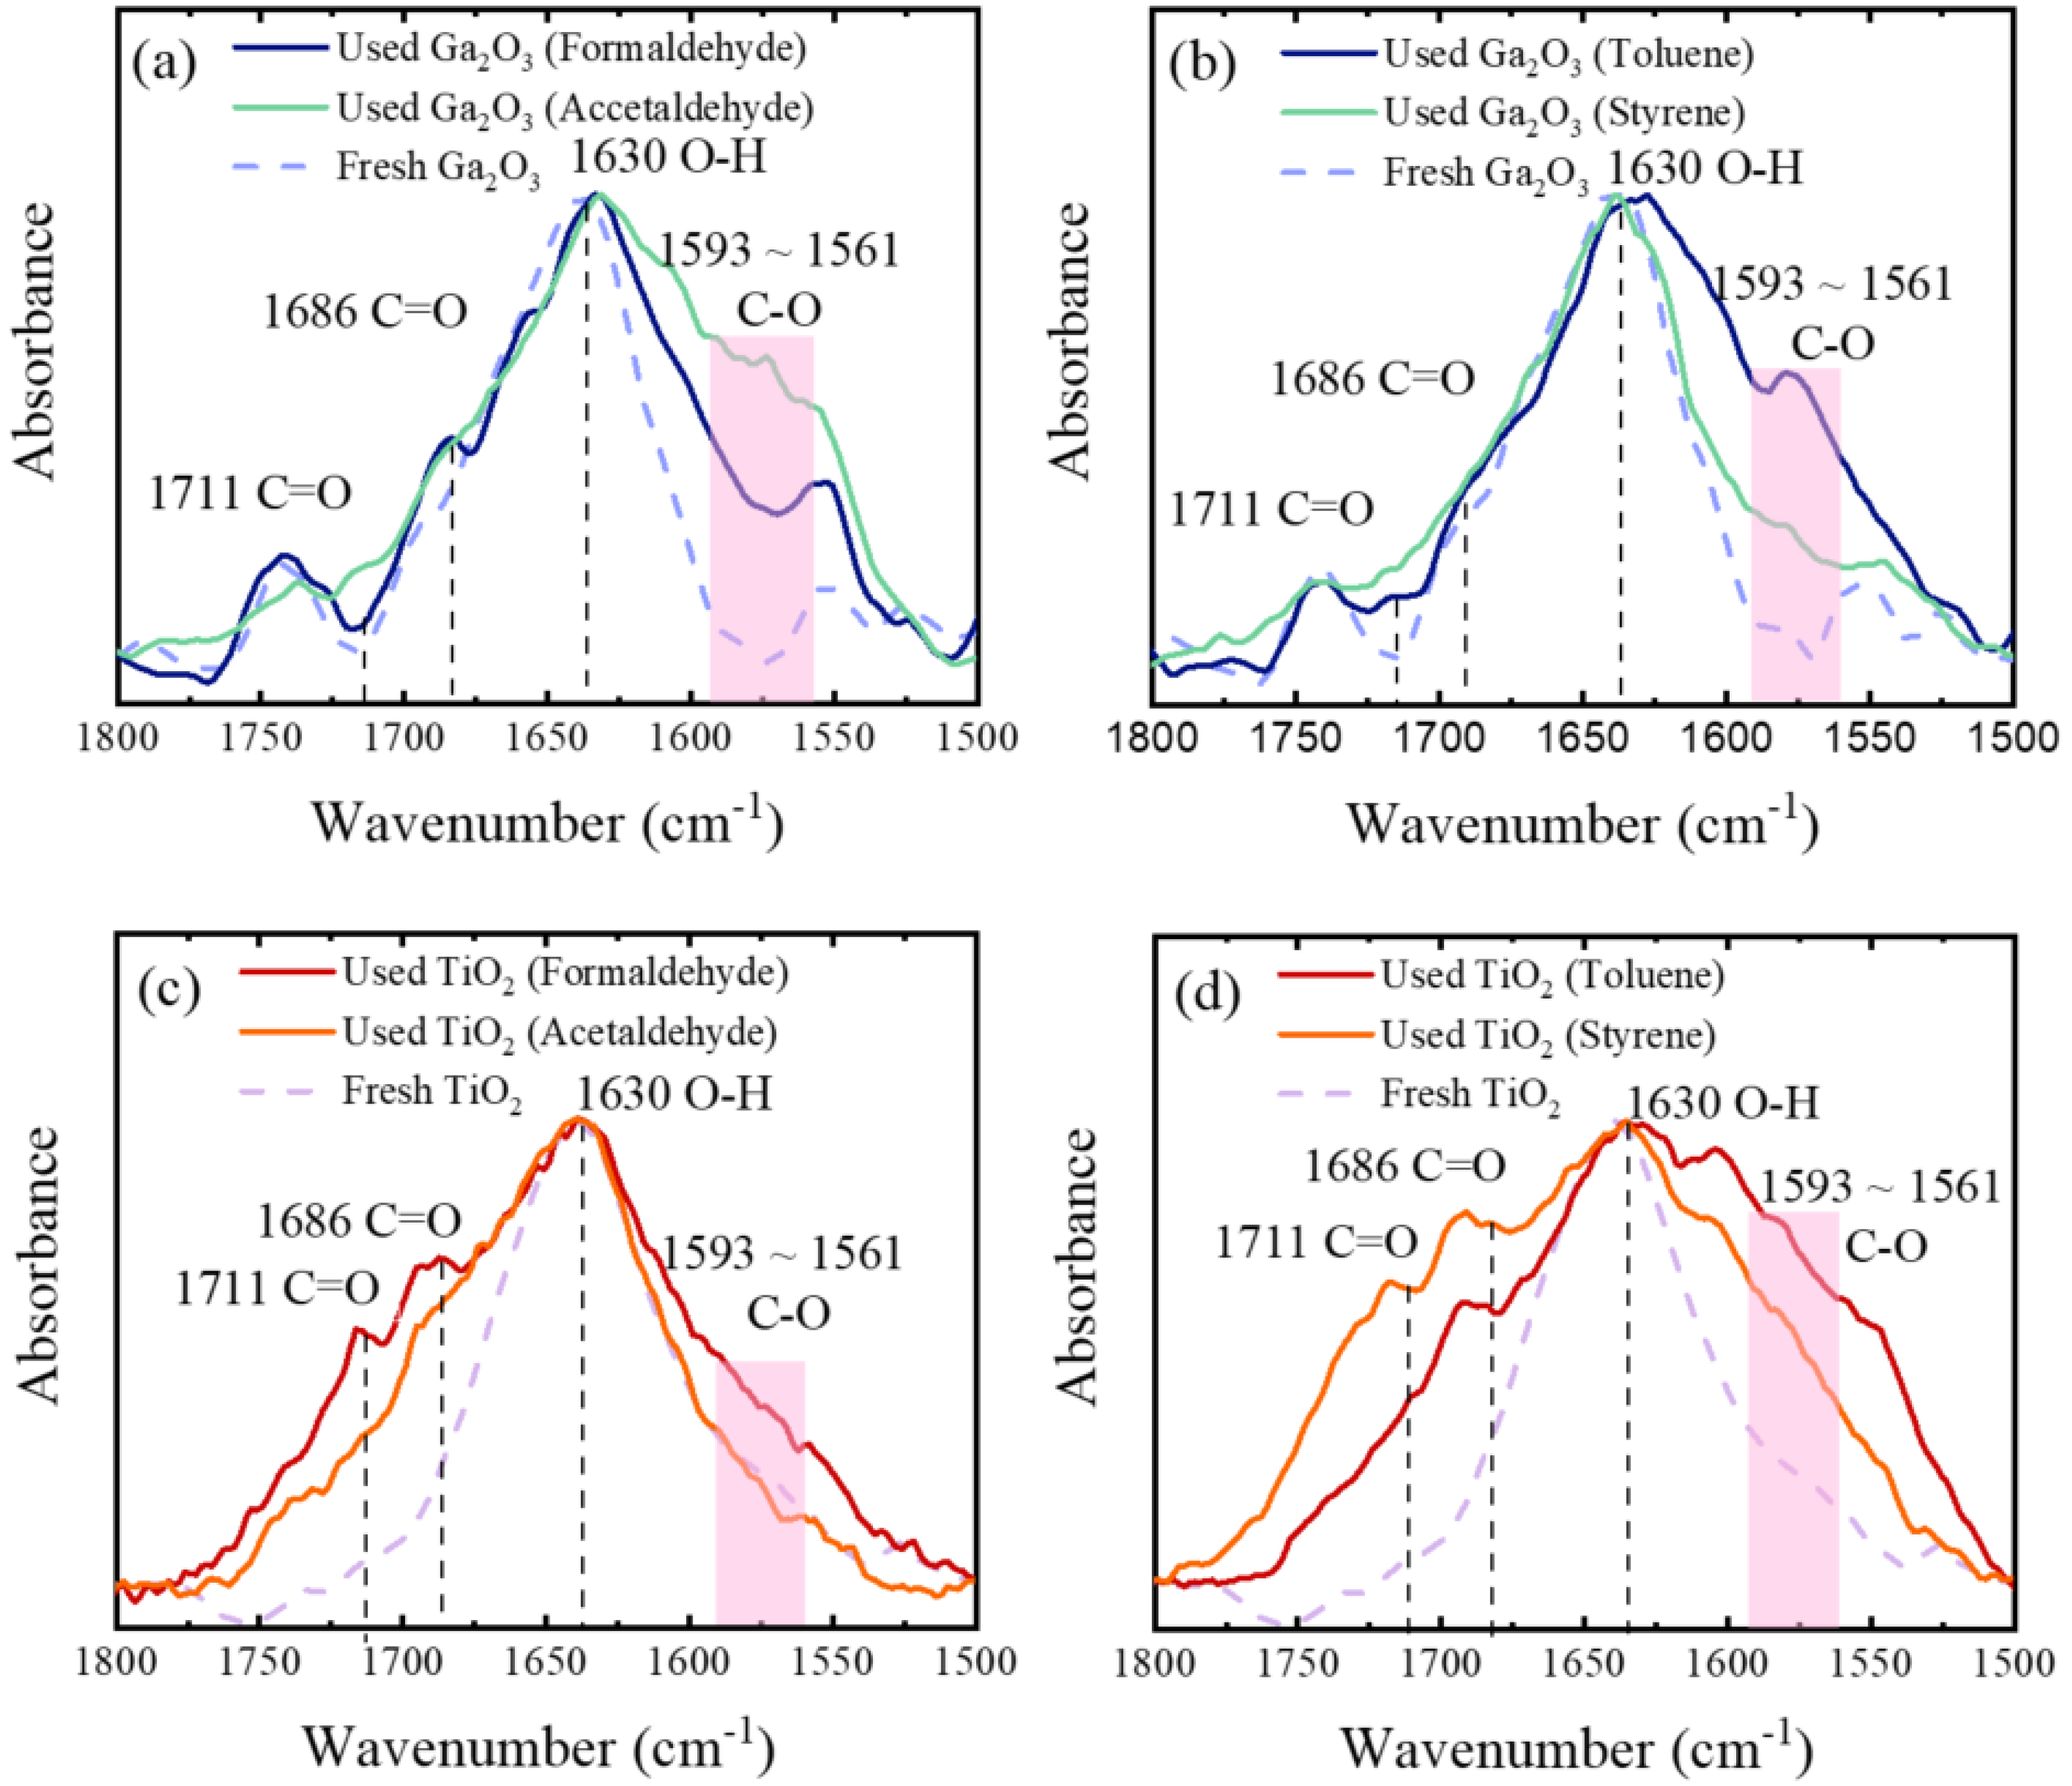
2. Results and Discussion

The morphology and crystallographic structure of the Ga2O3 and TiO2 photocatalysts are characterized in Figure 1. The SEM images revealed that the Ga2O3 photocatalysts were composed of porous microrods while their TiO2 counterparts were comprised of agglomerated spherical nanoparticles. The X-ray diffraction patterns of these photocatalysts were satisfactorily indexed to the monoclinic Ga2O3 and anatase TiO2, respectively. The surface areas of the Ga2O3 and TiO2 were found to be 32.2 and 10.4 m2/g, respectively, via the Brunauer–Emmett–Teller (BET) plots with a correlation coefficient of R2 = 0.99.
Figure 2a–d shows the pseudo-first order kinetics of the photocatalytic degradation of various VOCs (formaldehyde (2a), acetaldehyde (2b), toluene (2c), and styrene (2d)) over Ga2O3 and TiO2 under UVC irradiation. For comparison, the VOC degradation in the absence of photocatalysts was also included under the same UVC irradiation in this plot because the UVC irradiation itself induced some minimal degradation in the VOCs. Table 1 lists the corresponding rate constant (k) and coefficient of determination (R2). The Ga2O3 exhibited higher photocatalytic performance than the TiO2 regardless of the different VOCs, as shown in Figure 2e. Furthermore, the rate constant ratios (kGa2O3/kTiO2) of the Ga2O3 over TiO2 were plotted as a function of bond dissociation energy (kJ/mol) of the VOCs in Figure 2f. The dissociation energies of the VOCs were calculated by adding up the chemical bonding energy values (C-H, C-C, C=C, and C=O) in the chemical structures of the VOCs [14]. The Ga2O3 showed higher rate constants than TiO2 by a factor of 7.1 for toluene, 8.1 for styrene, 3.1 for formaldehyde, and 2.0 for acetaldehyde. The results in Figure 2f were categorized into two groups based on the dissociation energy of the VOCs; one is categorized as a nonaromatic compound and the other is an aromatic compound. More energy would be required to degrade the aromatic compounds (toluene and styrene) compared to the nonaromatic compounds (formaldehyde and acetaldehyde), as shown in Table 2. Figure 2 and Table 2 revealed that the photocatalytic activity of the Ga2O3 over TiO2 became more effective toward aromatic VOCs with high bond dissociation energy such as toluene and styrene; TiO2 was still effective in degrading nonaromatic VOCs with low binding energy such as formaldehyde and acetaldehyde.
The photocatalytic cyclic stabilities of Ga2O3 and TiO2 were compared for formaldehyde and toluene degradation in Figure 3, where formaldehyde and toluene were selected as representative nonaromatic and aromatic compounds, respectively. The photocatalytic activity of the Ga2O3 remained nearly constant with five cycles regardless of different VOCs; the variation was less than 2%. On the other hand, the photocatalytic activity of the TiO2 degraded within five cycles, and its reduction in the photocatalytic activity was around 23% for formaldehyde and 40% for toluene. This inferior toluene degradation (40% reduction) compared to formaldehyde degradation (23% reduction) over TiO2 was in part attributed to the lower diffusion coefficient of toluene (0.09 cm2/s) relative to that of formaldehyde (0.18 cm2/s). Heavy aromatic molecules (including toluene) with slower diffusivity are known to have strong adsorption propensities on the photocatalyst surface, leading to a higher probability of intermediate residues on the photocatalyst surface.
The photocatalytic degradation of VOCs is mediated via ROSs whose production rate is affected by the bandgap energy and band-edge potentials of semiconductor photocatalysts [15,16,17,18]. The optical bandgap energy of the Ga2O3 and TiO2 extracted from the Tauc plots was determined to be around 4.6 and 3.1 eV, respectively, as shown in Figure 4a. The valence and conduction band-edge potential of the Ga2O3 and TiO2 were aligned with respect to the redox potential of O2/O2-· (−0.18 eV versus normal hydrogen electrode (NHE)) and OH/OH· (+2.7 eV versus NHE) in Figure 4b [8]. The conduction band-edge energy of the Ga2O3 was positioned more negatively than that of TiO2 (relative to NHE). This indicated that the photogenerated electrons on the Ga2O3 have a stronger reduction ability than those on TiO2 [8], which is beneficial for breaking the chemical bonding of the VOCs with higher dissociation energy levels. Unlike the conduction band-edge comparison, the valence band-edge potential of the Ga2O3 was not obviously higher than that of the TiO2 with respect to the OH/OH· potential (+2.7 eV versus NHE). This presumed that the oxidation ability through the hole transfer would be comparable for the Ga2O3 and TiO2 photocatalysts.
Aside from the stronger redox capabilities of the Ga2O3, the larger surface area of the Ga2O3 compared with TiO2, as shown in Figure 1, can also explain the higher photocatalytic performance of the Ga2O3. As is true in most photocatalysis, the active sites on the surface, rather than the morphological surface, between the photocatalyst and reactant was of paramount importance. The photocatalytic reaction on the active sites were often blocked due to the residual intermediates on the photocatalyst surface. In recognition of this aspect, the deactivation of the Ga2O3 and TiO2 photocatalysts caused by the blockage of the residual intermediates on the photocatalyst surface needs to be considered.
Figure 5 shows the normalized FTIR absorption spectra of the Ga2O3 (a,b) and TiO2 (c,d) before and after the photocatalytic degradation of the VOCs—formaldehyde (a) and acetaldehyde (c) versus toluene (b) and styrene (d). The IR spectra difference between the fresh (before) and used (after) photocatalysts provided information regarding the residual intermediates on the photocatalyst surfaces. The spectra were normalized based on the maximum IR band at 1630 cm−1 that was assigned to the bending vibrational mode of the hydroxyl (OH) groups from the metal oxides. This O-H bending mode was attributed to the surficial hydroxyl group of the metal oxides or water molecules adsorbed on the surface of the semiconductor metal oxides [19]. Figure 5c,d shows that two absorption bands at 1711 and 1686 cm−1, associated with the aliphatic C=O stretching mode from the aldehyde groups [8], increased after the VOCs degraded with the TiO2. This indicated that the aliphatic intermediates of the C=O groups remained on the TiO2 surface, prohibiting a further photocatalytic reaction between the VOCs and the photocatalyst surface. On the other hand, these two absorption bands at 1711 and 1686 cm−1 remained unchanged with the Ga2O3 after the VOC degradation regardless of aromatic and nonaromatic compounds. This revealed that no aliphatic intermediates of the C=O groups remained on the Ga2O3 surface during the photocatalytic reactions, resulting in the Ga2O3′s higher catalytic reactivity and photostability, as shown in Figure 2 and Figure 3. For the overall photocatalytic degradation of the VOCs, dynamic equilibrium between the adsorption of the VOCs and desorption of the intermediates/final by-products on the photocatalyst surface needs to be considered. This explained that the inferior photocatalytic activity and photostability of the TiO2, compared with the Ga2O3, were attributed to the slower electron transfer kinetics, as shown in Figure 4b. In addition, the poor photostability of the TiO2 over the aromatic compounds, compared with the nonaromatic compounds, was attributed to the lower diffusion coefficient of the aromatic compounds than that of the nonaromatic compounds.
It was also noted that the broad bands from 1561 to 1593 cm-1, representing asymmetric C-O stretching, also increased with the Ga2O3 and TiO2 after the VOC degradation regardless of aromatic and nonaromatic compound degradation [20]; the increase with TiO2 after acetaldehyde degradation was negligible. This asymmetric C-O stretching mode was presumably associated with the carboxylate residues, which accepted a strong hydrogen bond from a metal-bound water molecule [20]. The bond energy of a C=O bond is 745 kJ/mole while that of a C-O bond is 351 kJ/mole [21], indicating that a C=O bond is a more robust intermediate on the photocatalyst’s surface affecting the overall photocatalytic reaction on the surface.

3. Materials and Methods

3.1. Characterization of Ga2O3 and TiO2 Photocatalysts

Ga2O3 (99.995%) and TiO2 (99.8%) nanostructures were purchased from CRM Material (Nanchang, Jiangxi, China) and Sigma-Aldrich (St. Luis, MO, USA), respectively. The morphology and crystallographic structures of the Ga2O3 and TiO2 photocatalysts were characterized using a field emission scanning electron microscope (FESEM, JEOL JSM-7100F, Tokyo, Japan) and a powder X-ray diffraction system (XRD, PANalytical, X’pert pro, Malvern, UK) with Cu kα radiation (λ = 0.154 nm), respectively. The specific surface areas of these photocatalysts were measured using a nitrogen adsorption-desorption isotherm on a BELSORP-max instrument and calculated via the Brunauer–Emmett–Teller (BET) method. Prior to measurement, the samples were degassed at 473 K for 4 h [22,23]. The optical bandgaps of the Ga2O3 and TiO2 were extracted using diffuse reflectance spectroscopy (DRS, SHIMADZU, SolidSpec-3700, Kyoto, Japan) via the expression of (αhν)m versus hν, where α is the absorption coefficient, h is the Planck constant, and ν is the frequency of the electromagnetic radiation. The value of the exponent m = 2 was used for Ga2O3, whereas m = 0.5 for TiO2; the former is considered to be a direct bandgap material, whereas the latter is an indirect bandgap material.

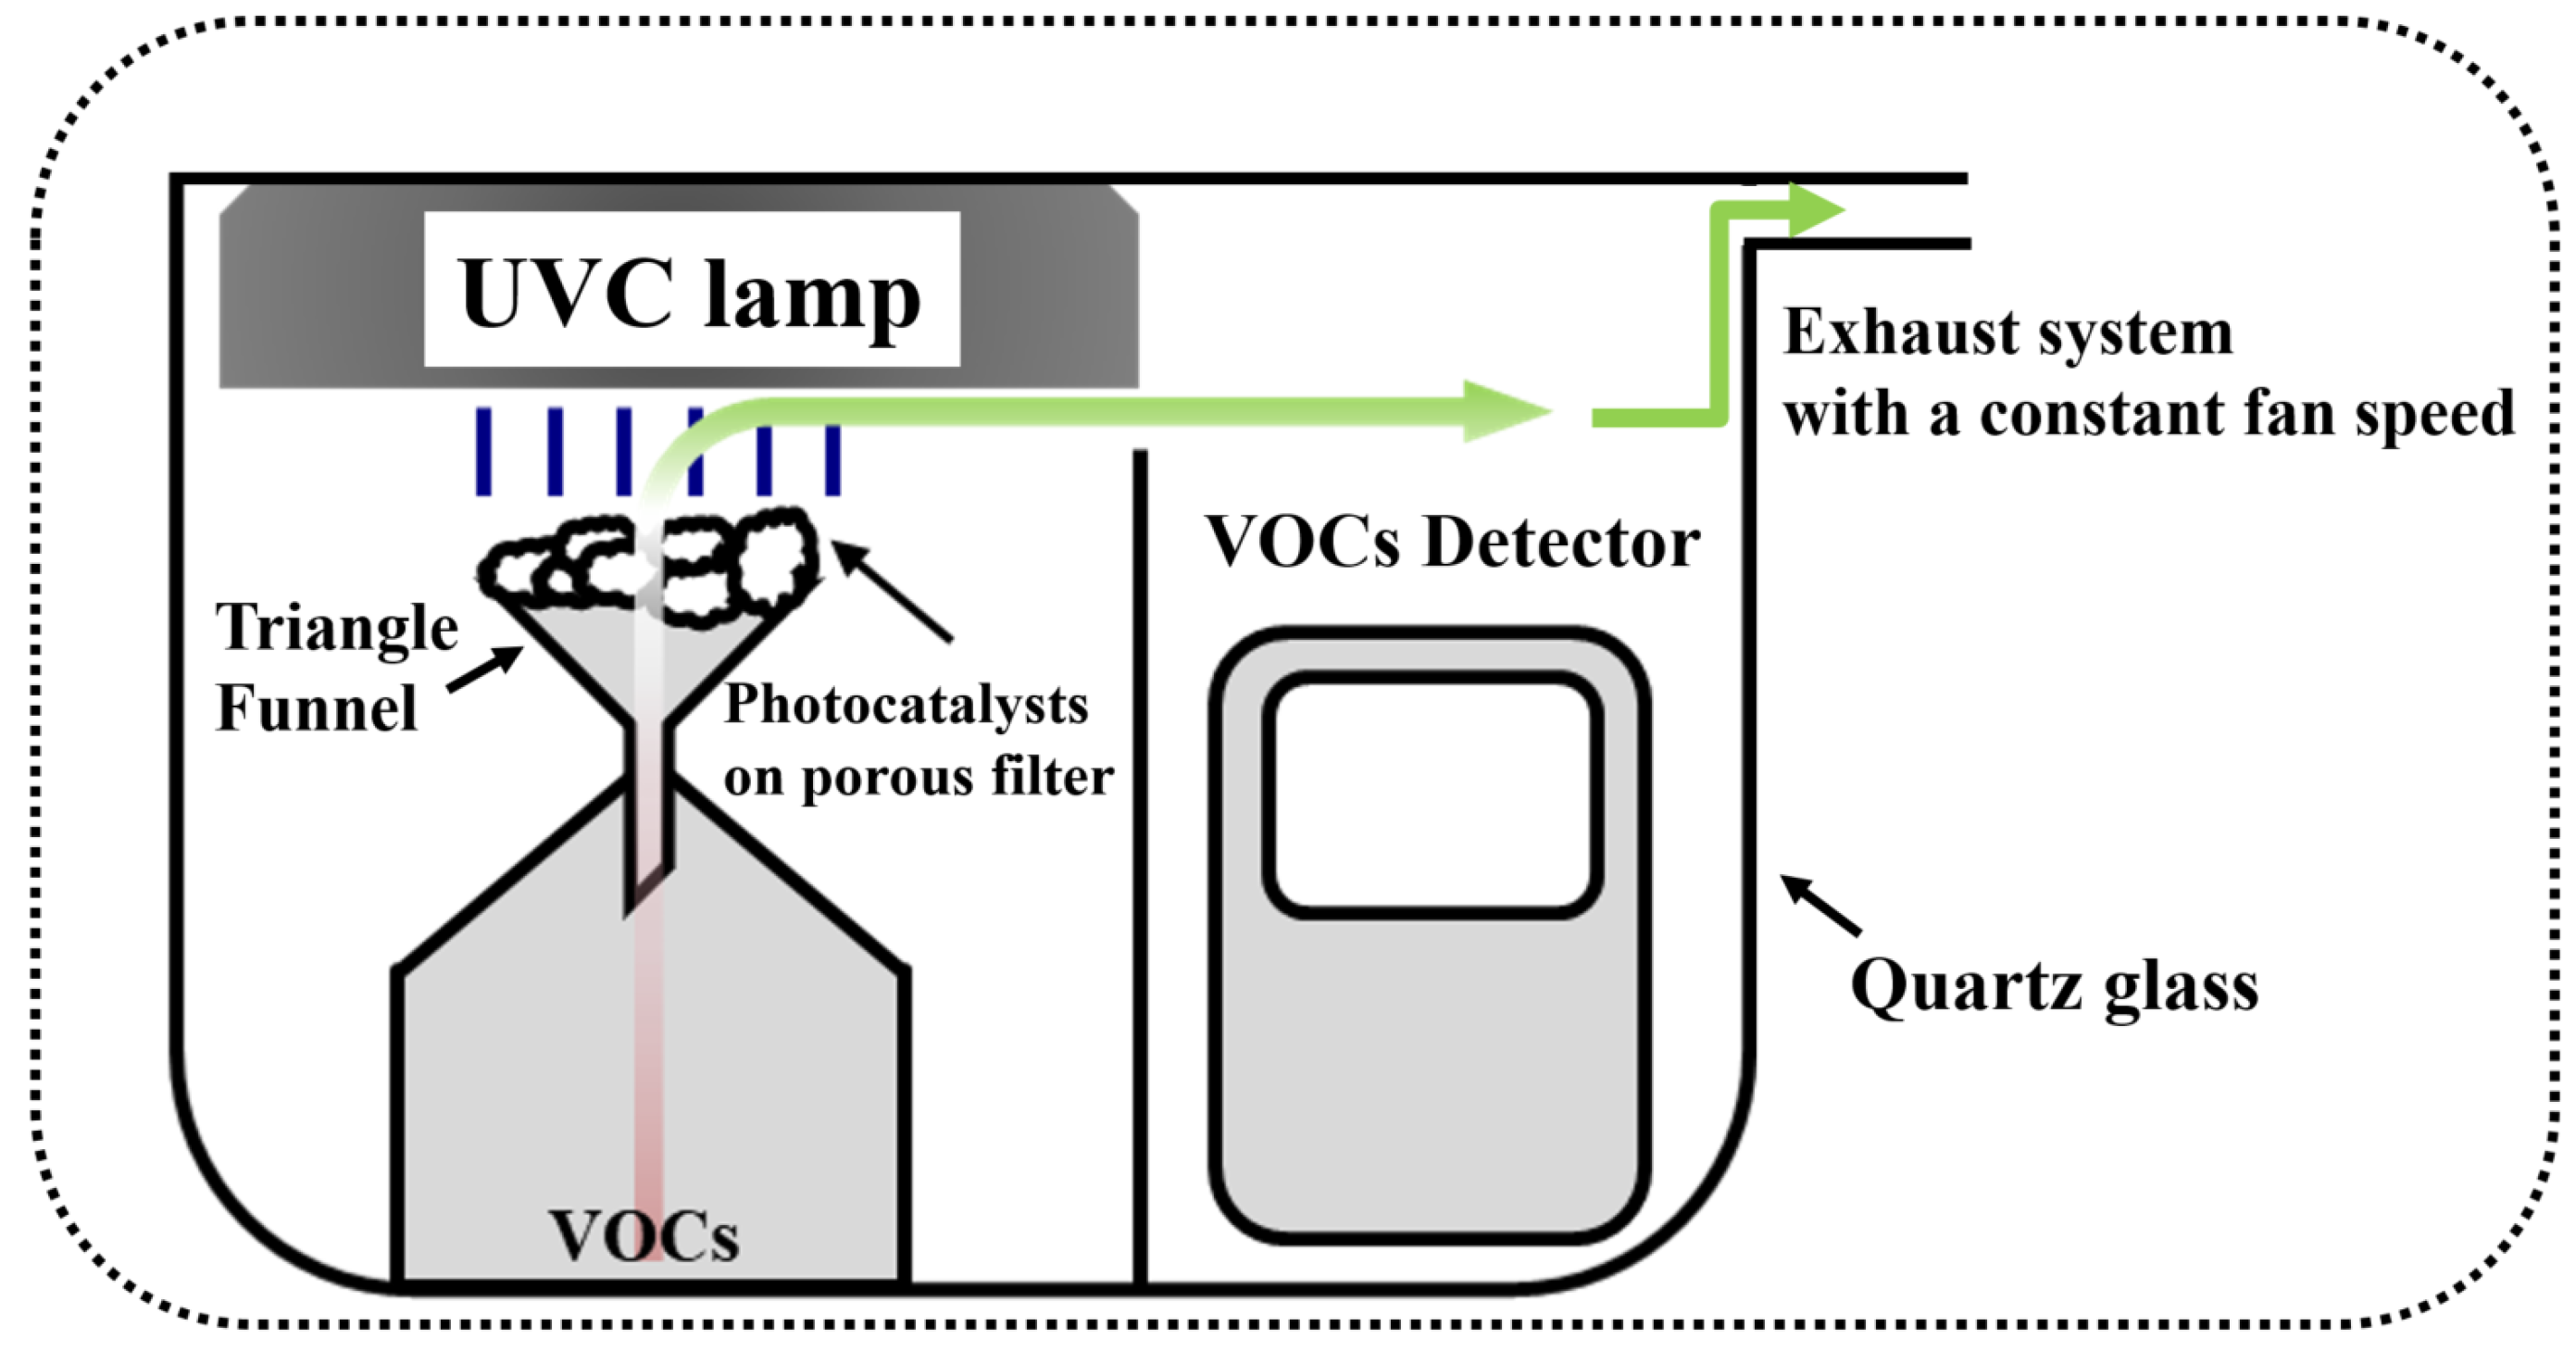
3.2. Photocatalytic Degradation

The photocatalytic experimental setup, including the position of UVC lamp, photocatalysts, VOCs, and VOCs detector, is shown in Figure 6. Each of the 5-g Ga2O3 and TiO2 photocatalysts were uniformly distributed on the porous filter so that all of the photocatalysts were exposed to the 4-W UVC lamp (UVG-11, Analytik Jena, Jena, Germany) with a wavelength centered at 254 nm (312 μW/cm2). The initial concentrations of formaldehyde, acetaldehyde, toluene, and styrene were diluted so that each VOC was set in a range from 8.00 to 9.90 mg/m3. The flow rate of the VOCs was kept constant at a fixed fan speed. The photocatalytic degradation values of the different VOCs with Ga2O3 and TiO2 were determined using a commercial VOC air detector (KHALDER: KD-001) at room temperature; the concentrations of acetaldehyde, toluene, and styrene were detected by summation of all VOC signals, while that of formaldehyde was detected via formaldehyde detection mode. All measurements were taken after reaching a steady state condition. As a control experiment, the degradation of each VOC was performed under only UVC in the absence of a photocatalyst.
To characterize the residual intermediates on the photocatalyst surface, a Fourier transform infrared spectrometer (FTIR, CARY670, Agilent, Santa Clara, CA, USA) was used in the wavenumber range of 4000–430 cm−1. To compare the long-term stability of the Ga2O3 and TiO2, cyclic testing was repeated for formaldehyde and toluene, which represented nonaromatic and aromatic compounds, respectively.

3.3. Kinetic Models Analysis

The photodegradation kinetics of the VOCs using Ga2O3 and TiO2 were evaluated using pseudo-first order kinetics with Equation (1) [24]. The kinetic traces were fitted using a linear function in the plot of ln(C/CO) versus time (t) to obtain the reaction rate constant (k, min−1). The above pseudo-first order kinetic analysis aptly captures the apparent rate constant of the catalytic photodegradation of the VOCs [25,26]. In addition, the VOC removal activity (%) was calculated using Equation (2).
ln(C/CO) = −kt
VOC removal activity = (CO − C)/CO × 100
where CO and C are the VOC concentrations measured at zero time (0 min) and a later time (t, min) after photocatalytic degradation under UVC irradiation, respectively.

4. Conclusions

Monoclinic Ga2O3 showed higher photocatalytic activity and stability than anatase TiO2 toward both nonaromatic compounds (formaldehyde and acetaldehyde) and nonaromatic compounds (toluene and styrene). The photocatalytic activity ratios of the Ga2O3 over TiO2 were categorized into two groups based on the VOC bonding energy—nonaromatic compounds and aromatic compounds. The superior photocatalytic activity of the Ga2O3 over TiO2 became more prominent toward the aromatic compounds. These findings will expedite the development of Ga2O3-based photocatalysts, which can outperform conventional TiO2-based photocatalysts, particularly with high-binding energy VOCs such as aromatic compounds.

Author Contributions

Conceptualization, W.S.H.; formal analysis and validation, I.G.L. and B.J.C; methodology, T.H.Y.; investigation, T.H.Y. and H.R.; writing—original draft, J.C. and W.S.H; writing—review and editing, I.G.L., J.C., B.J.C., and W.S.H. All authors have read and agreed to the published version of the manuscript.

Funding

This work was funded by the National Research Foundation of Korea (NRF) through the Basic Science Research Program (2017R1A2B4012278) and by the Center for Advanced Soft-Electronics funded by the Ministry of Science, ICT and Future Planning through the Global Frontier Project (CASE-2011-0031638).

Acknowledgments

The SEM/EDS and XRD analyses were conducted at the Korea Basic Science Institute (Busan Center).

Conflicts of Interest

The authors declare no conflict of interest.

References

  1. Cincinelli, A.; Martellini, T. Indoor air quality and health. Int. J. Environ. Res. Public Health 2017, 14, 1286–1290. [Google Scholar] [CrossRef] [Green Version]
  2. Huang, Y.; Ho, S.S.H.; Lu, Y.; Niu, R.; Xu, L.; Cao, J.; Lee, S. Removal of indoor volatile organic compounds via photocatalytic oxidation: A short review and prospect. Molecules 2016, 21, 56. [Google Scholar] [CrossRef] [Green Version]
  3. Yoo, T.H.; Ryou, H.; Lee, I.G.; Cho, B.J.; Hwang, W.S. Enhanced Photocatalytic Activity of Electrospun β-Ga2O3 Nanofibers via In-Situ Si Doping. Using Tetraethyl Orthosilicate. Catalysts 2019, 9, 1005. [Google Scholar] [CrossRef] [Green Version]
  4. Bae, H.J.; Yoo, T.H.; Kim, S.; Choi, W.; Song, Y.S.; Kwon, D.K.; Hwang, W.S. Enhanced Photocatalytic Degradation of 2-Butanone Using Hybrid Nanostructures of Gallium Oxide and Reduced Graphene Oxide Under Ultraviolet-C Irradiation. Catalysts 2019, 9, 449. [Google Scholar] [CrossRef] [Green Version]
  5. Fujishima, A.; Honda, K. Photolysis-decomposition of water at the surface of an irradiated semiconductor. Nature 1972, 238, 37–38. [Google Scholar] [CrossRef]
  6. Schneider, J.; Matsuoka, M.; Takeuchi, M.; Zhang, J.; Horiuchi, Y.; Anpo, M.; Bahnemann, D.W. Understanding TiO2 photocatalysis: Mechanisms and materials. Chem. Rev. 2014, 114, 9919–9986. [Google Scholar] [CrossRef]
  7. Zhao, X.; Zhang, G.; Zhang, Z. TiO2-based catalysts for photocatalytic reduction of aqueous oxyanions: State-of-the-art and future prospects. Environ. Int. 2020, 136, 105453. [Google Scholar] [CrossRef]
  8. Hou, Y.; Wang, X.; Wu, L.; Ding, Z.; Fu, X. Efficient decomposition of benzene over a β-Ga2O3 photocatalyst under ambient conditions. Environ. Sci. Technol. 2006, 40, 5799–5803. [Google Scholar] [CrossRef]
  9. Martra, G.; Coluccia, S.; Marchese, L.; Augugliaro, V.; Loddo, V.; Palmisano, L.; Schiavello, M. The role of H2O in the photocatalytic oxidation of toluene in vapour phase on anatase TiO2 catalyst: A FTIR study. Catal. Today 1999, 53, 695–702. [Google Scholar] [CrossRef]
  10. Mendez-Roman, R.; Cardona-Martínez, N. Relationship between the formation of surface species and catalyst deactivation during the gas-phase photocatalytic oxidation of toluene. Catal. Today 1998, 40, 353–365. [Google Scholar] [CrossRef]
  11. Girija, K.; Thirumalairajan, S.; Patra, A.K.; Mangalaraj, D.; Ponpandian, N.; Viswanathan, C. Enhanced photocatalytic performance of novel self-assembled floral β-Ga2O3 nanorods. Curr. Appl. Phys. 2013, 13, 652–658. [Google Scholar] [CrossRef]
  12. Hou, Y.; Zhang, J.; Ding, Z.; Wu, L. Synthesis, characterization and photocatalytic activity of β-Ga2O3 nanostructures. Powder Technol. 2010, 203, 440–446. [Google Scholar] [CrossRef]
  13. Hou, Y.; Wu, L.; Wang, X.; Ding, Z.; Li, Z.; Fu, X. Photocatalytic performance of α-, β-, and γ-Ga2O3 for the destruction of volatile aromatic pollutants in air. J. Catal. 2007, 250, 12–18. [Google Scholar] [CrossRef]
  14. Rumble, J. CRC Handbook of Chemistry and Physics, 100th ed.; CRC Press: Boca Raton, FL, USA, 2019; ISBN 9781138367296. [Google Scholar]
  15. Shayegan, Z.; Lee, C.S.; Haghighat, F. TiO2 photocatalyst for removal of volatile organic compounds in gas phase–a review. Chem. Eng. J. 2018, 334, 2408–2439. [Google Scholar] [CrossRef]
  16. Ryou, H.; Yoo, T.H.; Yoon, Y.; Lee, I.G.; Shin, M.; Cho, J.; Cho, B.J.; Hwang, W.S. Hydrothermal Synthesis and Photocatalytic Property of Sn-doped β-Ga2O3 Nanostructure. ECS J. Solid State Sci. Technol. 2020, 9, 045009. [Google Scholar] [CrossRef]
  17. Cho, J.; Sheng, A.; Suwandaratne, N.; Wangoh, L.; Andrews, J.L.; Zhang, P.; Banerjee, S. The middle road less taken: Electronic-structure-inspired design of hybrid photocatalytic platforms for solar fuel generation. Acc. Chem. Res. 2018, 52, 645–655. [Google Scholar] [CrossRef]
  18. Andrews, J.L.; Cho, J.; Wangoh, L.; Suwandaratne, N.; Sheng, A.; Chauhan, S.; Thakur, P.K. Hole extraction by design in photocatalytic architectures interfacing CdSe quantum dots with topochemically stabilized tin vanadium oxide. J. Am. Chem. Soc. 2018, 140, 17163–17174. [Google Scholar] [CrossRef]
  19. Praveen, P.; Viruthagiri, G.; Mugundan, S.; Shanmugam, N. Structural, optical and morphological analyses of pristine titanium di-oxide nanoparticles—Synthesized via sol–gel route. Spectrochim. Acta. A Mol. Biomol. Spectrosc. 2014, 117, 622–629. [Google Scholar] [CrossRef]
  20. Service, R.J.; Hillier, W.; Debus, R.J. Evidence from FTIR difference spectroscopy of an extensive network of hydrogen bonds near the oxygen-evolving Mn4Ca cluster of photosystem II involving D1-Glu65, D2-Glu312, and D1-Glu329. Biochemistry 2010, 49, 6655–6669. [Google Scholar] [CrossRef] [Green Version]
  21. Luo, Y.R. Comprehensive Handbook of Chemical Bond Energies; CRC Press: Boca Raton, FL, USA, 2007; ISBN 9780849373664. [Google Scholar]
  22. Brunauer, S.; Emmett, P.H.; Teller, E. Adsorption of gases in multimolecular layers. J. Am. Chem. Soc. 1938, 60, 309–319. [Google Scholar] [CrossRef]
  23. Fagerlund, G. Determination of specific surface by the BET method. Mat. Constr. 1973, 6, 239–245. [Google Scholar] [CrossRef]
  24. Ghodsi, V.; Jin, S.; Byers, J.C.; Pan, Y.; Radovanovic, P.V. Anomalous photocatalytic activity of nanocrystalline γ-phase Ga2O3 enabled by long-lived defect trap states. J. Phys. Chem. C 2017, 121, 9433–9441. [Google Scholar] [CrossRef]
  25. Rochetto, U.L.; Tomaz, E. Degradation of volatile organic compounds in the gas phase by heterogeneous photocatalysis with titanium dioxide/ultraviolet light. J. Air. Waste. Manag. Assoc. 2015, 65, 810–817. [Google Scholar] [CrossRef] [Green Version]
  26. Fox, M.A.; Dulay, M.T. Heterogeneous photocatalysis. Chem. Rev. 1993, 93, 341–357. [Google Scholar] [CrossRef]
Figure 1. SEM images of (a) Ga2O3 and (b) TiO2 photocatalysts (scale bar: 5 μm). In each image, the upper left and right insets show the XRD pattern and Brunauer–Emmett–Teller (BET) surface area plot, respectively. The bottom tick marks in the XRD indicate PDF Card No. 00-043-1012 for monoclinic Ga2O3 and PDF Card No 00-002-0406 for anatase TiO2.
Catalysts 10 00545 g001
Figure 2. (ad) Photocatalytic degradation kinetics with a linear fit for (a) formaldehyde, (b) acetaldehyde, (c) toluene, and (d) styrene, respectively, using Ga2O3, TiO2, and no catalyst under UVC irradiation and without UV irradiation at room temperature. (e) Comparison of the rate constants of volatile organic compound (VOC) photodegradation with Ga2O3, TiO2, and no catalyst. (f) Rate constant ratio of Ga2O3 over TiO2 as a function of dissociation energy of different VOCs.
Catalysts 10 00545 g002
Figure 3. Photocatalytic recycling tests of Ga2O3 and TiO2 for the degradation of (a) formaldehyde and (b) toluene.
Catalysts 10 00545 g003
Figure 4. (a) Optical absorbance spectra and Tauc plots (direct and indirect bandgap model) for Ga2O3 and TiO2, respectively, and (b) energy bandgap and band-edge positions of Ga2O3 and TiO2 along with the redox potentials in the normal hydrogen electrode (NHE) [8].
Catalysts 10 00545 g004
Figure 5. FTIR spectra of (a,b) Ga2O3 and (c,d) TiO2 surface before and after photocatalytic degradation of (a,c) formaldehyde and acetaldehyde, and (b,d) toluene and styrene. The used Ga2O3 and TiO2 were exposed to UVC under each VOC for 2 h.
Catalysts 10 00545 g005
Figure 6. Schematic image of photocatalytic experimental setup.
Catalysts 10 00545 g006
Table 1. Comparison of rate constant (k, min−1) and determination of coefficient (R2) in the linear fitting from acetaldehyde, formaldehyde, styrene, and toluene using Ga2O3, TiO2, and no photocatalyst under UVC irradiation at room temperature.
FormaldehydeAcetaldehydeTolueneStyrene
kGa2O30.1820.0480.2200.097
TiO20.0580.0240.0310.012
No photocatalyst
(only UVC)
0.0160.0090.0250.006
R2Ga2O30.9980.9980.9850.997
TiO20.9860.9940.9980.927
No photocatalyst
(only UVC)
0.9990.9970.9990.939
Table 2. Comparison of physical/chemical properties of different VOCs [14].
CompoundFormulaMolecular Weight
(g/mol)
Dissociation Energy
(kJ/mol)
Diffusion Coefficient in Air (cm2/s)
FormaldehydeCH2O30.031,5520.18
AcetaldehydeC2H4O44.052,7220.12
TolueneC7H892.146,5130.09
StyreneC8H8104.157,1240.07

