Article

The Effect of CO Partial Pressure on Important Kinetic Parameters of Methanation Reaction on Co-Based FTS Catalyst Studied by SSITKA-MS and Operando DRIFTS-MS Techniques

by
Michalis A. Vasiliades
1,
Konstantina K. Kyprianou
1,
Nilenindran S. Govender
2,
Ashriti Govender
2,
Renier Crous
2,
Denzil Moodley
2 and
Angelos M. Efstathiou
1,*
1
Heterogeneous Catalysis Laboratory, Chemistry Department, University of Cyprus, 2109 Nicosia, Cyprus
2
Sasol Group Technology, 1 Klasie Havenga Street, Sasolburg 1947, South Africa
*
Author to whom correspondence should be addressed.
Catalysts 2020, 10(5), 583; https://doi.org/10.3390/catal10050583
Submission received: 4 May 2020 / Revised: 17 May 2020 / Accepted: 20 May 2020 / Published: 22 May 2020
(This article belongs to the Special Issue In Situ and Operando Vibrational Spectroscopy in Catalysis)

Abstract

:
A 20 wt% Co-0.05 wt% Pt/γ-Al2O3 catalyst was investigated to obtain a fundamental understanding of the effect of CO partial pressure (constant H2 partial pressure) on important kinetic parameters of the methanation reaction (x vol% CO/25 vol% H2, x = 3, 5 and 7) by performing advanced transient isotopic and operando diffuse reflectance infrared Fourier transform spectroscopy–mass spectrometry (DRIFTS-MS) experiments. Steady State Isotopic Transient Kinetic Analysis (SSITKA) experiments conducted at 1.2 bar, 230 °C after 5 h in CO/H2 revealed that the surface coverages, θCO and θCHx and the mean residence times, τCO, and τCHx (s) of the reversibly adsorbed CO-s and active CHx-s (Cα) intermediates leading to CH4, respectively, increased with increasing CO partial pressure. On the contrary, the apparent activity (keff, s−1) of CHx-s intermediates, turnover frequency (TOF, s−1) of methanation reaction, and the CH4-selectivity (SCH4, %) were found to decrease. Transient isothermal hydrogenation (TIH) following the SSITKA step-gas switch provided important information regarding the reactivity and concentration of active (Cα) and inactive -CxHy (Cβ) carbonaceous species formed after 5 h in the CO/H2 reaction. The latter Cβ species were readily hydrogenated at 230 °C in 50%H2/Ar. The surface coverage of Cβ was found to vary only slightly with increasing CO partial pressure. Temperature-programmed hydrogenation (TPH) following SSITKA and TIH revealed that other types of inactive carbonaceous species (Cγ) were formed during Fischer-Tropsch Synthesis (FTS) and hydrogenated at elevated temperatures (250–550 °C). The amount of Cγ was found to significantly increase with increasing CO partial pressure. All carbonaceous species hydrogenated during TIH and TPH revealed large differences in their kinetics of hydrogenation with respect to the CO partial pressure in the CO/H2 reaction mixture. Operando DRIFTS-MS transient isothermal hydrogenation of adsorbed CO-s formed after 2 h in 5 vol% CO/25 vol% H2/Ar at 200 °C coupled with kinetic modeling (H-assisted CO hydrogenation) provided information regarding the relative reactivity (keff) for CH4 formation of the two kinds of linear-type adsorbed CO-s on the cobalt surface.

Graphical Abstract

1. Introduction

Low-temperature Fischer-Tropsch Synthesis (FTS) is a non-reversible, highly exothermic, and complex reaction (Equation (1)), which has been industrially applied for many decades for using syngas (CO and H2), which is mainly derived from natural gas, biogas, and coal, towards the formation of chemicals and fuels [1,2,3].
n   ( C O + 2 H 2 ) ( C H 2 ) n + n   H 2 O
Great efforts have been made toward understanding the FTS mechanism and kinetically relevant elementary reaction steps in order to design new and improved catalytic materials via different preparation methods with optimum metal loading, particle size, and chemical and structural promoters’ composition. Additionally, reaction conditions (e.g., temperature, pressure, reactor-type, syngas ratio) must be tuned for the optimization of selectivity and yield of specific products including olefins, higher hydrocarbons, and alcohols [4,5,6]. Cobalt supported on different metal oxides (e.g., γ-Al2O3, SiO2, TiO2) and usually promoted with a small amount of noble metal (e.g., Pt, Re) but also of other metals, such as Mn and La, were mainly investigated for low-T FTS [2,7,8,9,10].
The use of transient and isotopic techniques coupled with the operando methodology in elucidating FTS mechanisms and kinetics, but also the deactivation of Co-based catalysts is rather limited [11,12,13,14,15,16,17,18,19,20,21,22,23]. In particular, Steady State Isotopic Transient Kinetic Analysis (SSITKA) has been recognized as one of the most advanced techniques providing important kinetic information for a heterogeneous catalytic reaction under working reaction conditions, such as the concentration (mol g−1), surface coverage (θ), mean residence time (τ, s), and intrinsic site activity (k) of truly active reaction intermediates [14,24,25,26,27,28,29,30]. In addition, the intrinsic turnover frequency (TOFITK, s−1) based on the concentration of active reaction intermediates measured by SSITKA (not on the total exposed metal surface sites measured by selective chemisorption) leads to the given reaction product and can be estimated [11,13,14,15,16,18,19]. Density Functional Theory (DFT) computations and microkinetic modelling alone or coupled with DFT [31,32,33,34,35,36,37,38,39,40,41] have been applied over Co-based catalysts for CO hydrogenation aimed to discriminate rival mechanisms and extract important kinetic parameters of methanation and/or Fischer-Tropsch Synthesis, and identify kinetic reasons for the effects of variation of H2 and/or CO partial pressure on FTS product distribution. These advanced kinetic studies pointed out that hydrogenation of carbon derived from CO dissociation (e.g., CHx) appears to be the rate-determining step (RDS), and, by varying the H2 and CO partial pressures, there are differences in the rates of formation of CHx-s intermediates, which eventually affect their surface lifetime (τCHx, s) on the catalytic surface.
The present study aims to provide important mechanistic and kinetic information on the carbon pathway of methane formation at 230 °C (feed composition: x vol% CO/25 vol% H2/Ar, PT = 1.2 bar) over a commercially relevant FTS Co-based catalyst (supported on γ-Al2O3 and promoted with 0.05 wt% Pt) [42,43], when the CO partial pressure is varied (36–84 mbar) at a constant hydrogen partial pressure of 0.3 bar. Thus, the effect of PCO or syngas ratio (H2/CO) at constant PH2 on the following kinetic parameters was investigated.
(i)
The amount (NCO, μmol g−1) and surface coverage (θCO) of reversibly adsorbed CO-s;
(ii)
the amount (NCHx, μmol g−1) and surface coverage (θCHx) of active reaction CHx-s (Cα) intermediates;
(iii)
the mean residence time of CO-s (τCO, s) and active CHx-s (τCHx, s) intermediates;
(iv)
the turnover frequency leading to CH4, TOFchem, or TOFITK (s−1), respectively, estimated based on all Co surface metal atoms or on the active reaction intermediates (μmol g−1);
(v)
the amount (μmol g−1) of inactive carbonaceous species (Cβ) formed during FTS (230 °C) readily hydrogenated at 230 °C in 50% H2/Ar;
(vi)
the amount (μmol g−1) of the refractory carbonaceous species (Cγ) formed during FTS but hydrogenated at higher temperatures (230–550 °C);
(vii)
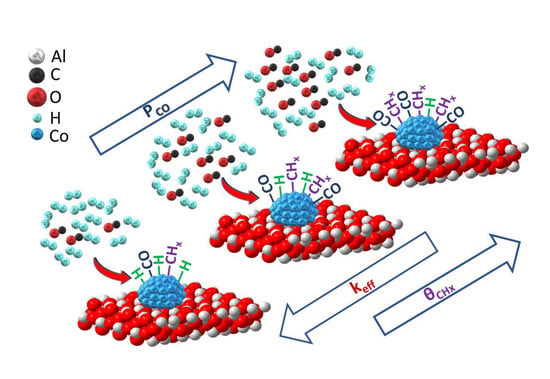
the relative reactivity (keff) of the various forms of linear-type adsorbed CO-s species formed over the Co surface during methanation after using operando transient DRIFTS-MS coupled with kinetic modelling.

2. Results

2.1. Co/γ-Al2O3 Catalyst Characterization

The powder X-ray diffraction (XRD) pattern of the 20 wt% Co-0.05 wt% Pt supported on Puralox SCCa γ-alumina carrier after calcination revealed the existence of a Co3O4 crystalline phase (35.5–38.5° 2θ range, JCPDS file No. 42-1467) as reported in our previous publication [19]. The mean Co particle size (dCo, nm) was found to be 10.1 nm (based on Scherrer equation for Co3O4 and the derived relationship between dCo and dCo3O4 particle size), resulting in a Co dispersion with DCo (%) of 9.5% and a Co metal surface area of 10.8 m2 g−1. This result was in good agreement with the DCo (%) estimated from H2 chemisorption/Temperature-programmed desorption (TPD) measurements [19]. TEM studies on the present catalyst [19] showed the formation of agglomerates of individual cobalt particles, which is in agreement with the literature [44]. The textural properties of the present Co/γ-Al2O3 catalyst were previously reported [19], where the specific surface area (SSA), pore volume (Vp), and average pore size (dp) were found to be 88 m2 g−1, 0.21 cm3 g−1, and 8.8 nm, respectively.

2.2. SSITKA-MS after 5 h in FTS

Figure 1A shows transient normalized concentration (Z) response curves of Kr (tracer gas), 13CO, and 13CH4 obtained during the SSITKA step-gas switch 3 vol% 12CO/25 vol% H2/Ar (5 h) → 3 vol% 13CO/25% H2/1% Kr/Ar (t) performed at 230 °C over the Co/γ-Al2O3 catalyst. It is seen that the Z(13CO) transient response curve lags behind that of Kr due to a measurable concentration (see Equation (5), Section 4.2)) of molecularly and reversibly chemisorbed CO formed after 5 h in FTS. The Z(13CH4) response of gas phase 13CH4 clearly lags behind that of Z(13CO), and this is attributed to the 13C-containing active reaction intermediates formed (following the 13CO-s pool), which are sequentially hydrogenated to 13CH4 (g), and the concentration of which is estimated via Equation (6) in Section 4.2.
Figure 1A,B, and Table 1 show that, by increasing the CO feed gas concentration from 3 to 7 vol% (36 to 84 mbar), the concentration (NCO, μmol g−1) and surface coverage (θCO) of reversibly adsorbed CO-s are increased (see Equations (5) and (7), Section 4.2), which are in agreement with the SSITKA work of Chen et al. [18]. Figure 1C presents the effect of CO partial pressure (PCO = 36–84 mbar) and, thus, of the H2/CO ratio (3.6–8.3, x vol% 12CO/25 vol% H2/Ar) on the transient dimensionless concentration of 13CH4 formed during the SSITKA step-gas switch. A clear increasing delay in the appearance of 13CH4 with respect to the Z(Kr) of the tracer is observed. This behavior relates to both the reactivity of CHX-s (named Cα) active intermediates, which lead to methane and their surface coverage. The amount and surface coverage of the active CHx-s intermediates, NCHx (μmol g−1) and θCHx, respectively, along with other important kinetic parameters are reported in Table 1. It is seen that NCHx and θCHx are increased to a significant extent with increasing PCO. An increase by a factor of 2.5 is observed after increasing PCO from 36 to 84 mbar.
Figure 2 presents transient rates (μmol g−1 s−1) of exchange, R C O e x , of adsorbed 12CO-s with 13CO(g) (Figure 2A) and 12CHx-s with 13CHx-s ( R C H x e x ,   Figure 2B) estimated from the SSITKA transient response curves recorded after 5 h in FTS at 230 °C (Figure 1, x vol% 12CO/25 vol% H2/Ar → x vol% 13CO/25 vol% H2/Kr/Ar, x = 3, 5, and 7). Estimation of these transient exchange rates was made after using Equations (3) and (4) (Section 4.2). The R C O e x   appears very fast, where, within the first ~8 s after the switch from the non-isotopic 12CO/H2 to the equivalent isotopic 13CO/H2 gas mixture, all reversibly adsorbed CO-s was exchanged. It is also illustrated that this R C O e x   rate of exchange increases with partial pressure of CO since it reflects the rate of adsorption of 13CO on the surface after a Co-s surface site is freed by the desorption of 12CO-s. The rate of the latter process is proportional to the surface coverage of 12CO-s. If the 12CO-s at steady-state is in equilibrium with gas-phase 12CO, then the rate of desorption of 12CO-s must be equal to the rate of adsorption or exchange for 13CO(g) during the SSITKA step-gas switch. Considering the shape profile of R C O e x   (Figure 2A), similar kinetics of 12CO-s/13CO(g) exchange occurs independently of PCO (36–84 mbar). The surface coverage of CO-s (θCO) in equilibrium with PCO increases with partial pressure of CO (area under the RCO vs. time response curve), as previously mentioned.
The RCHx (μmol g−1 s−1) transient rate response curve depicted in Figure 2B show a similar shape with increasing PCO, where the rate maximum is shifted to higher reaction times and presents a longer tail until completion of CHx-s exchange. By increasing the CO partial pressure (x = 3, 5, and 7 vol% CO) in the feed gas stream, the initial RCHx rate (during the very first few seconds of the transient) increases from 0.95 μmol g−1 s−1 to 1.23 and 1.35 μmol g−1 s−1, respectively, with the time required for complete exchange to occur at 50, 120 and 170 s, respectively. These features support the view of two kinds of CHx-s species formed in the CO/H2 reaction (230 °C, 5 h). One is hydrogenated to CH4 with a faster rate than a second one of a lower rate, where the latter is responsible for the appearance of a tail (Figure 2B). These features will be further discussed below.
The mean lifetimes τCO and τCHx (s) of the adsorbed CO-s and active CHx-s intermediates, respectively, were estimated based on the experimental results shown in Figure 1 after using Equations (8) and (9) (Section 4.2). The obtained results are given in Table 1 and Figure 3A as a function of the partial pressure of CO. The mean residence time τCO (s) is practically independent of PCO (0.35–0.5 s), while that of τCHx (s) largely increases with increasing PCO (Figure 3A and Table 1). An increase by ~3.3 times is seen after increasing the PCO from 36 to 84 mbar (4.8 vs. 16 s).
The concentration (μmol g−1) and surface coverage of adsorbed CO, θCO, were found to increase by 10% to 65% with increasing CO partial pressure, ca. θCO = 0.029, 0.032, and 0.048 for 36, 60, and 84 mbar PCO (Figure 3B and Table 1). A significantly larger increase is obtained for the concentration (μmol g−1) and surface coverage of CHx-s (Figure 3B), where θCHx increases from 0.047 to 0.085 and 0.117 for 36 to 60 and 84 mbar CO partial pressure, respectively. An increase by a factor of ~2.5 is obtained after increasing the PCO from 36 to 84 mbar. The latter values are in the range of those previously published over supported Co catalysts [8,39]. Carvalho et al. [45] reported that, for the methanation reaction at 250 °C over 20 wt% Co/SiO2 and 20 wt% Co-0.1 wt% Pt/SiO2 catalysts, the mean lifetime of CO-s and CHx-s active intermediates decreased with an increasing H2/CO gas ratio due to the greater surface coverage of hydrogen, θH, and the lower surface coverage of CO-s, θCO. They reported that these changes with H2/CO gas ratio were responsible for the increased hydrogenation rate of CHx-s. The decrease of θCO with an increasing H2/CO gas ratio was reported [46] to have a positive effect on the ratio of θH*H, where θ*H represents the surface coverage of empty sites on the Co surface. This θH*H parameter plays a crucial role in the FTS reaction discussed below.
The keff (s−1) value of the methanation reaction was estimated based on Equation (12) (Section 4.2). This is plotted against the partial pressure of CO as depicted in Figure 3C. It is noted that keff = kCHx θH. A three-fold decrease in keff (s−1) is observed with increasing CO partial pressure, namely, keff = 20.8, 8.31, and 6.26 × 10⁻² s−1, for 36, 60, and 84 mbar CO, respectively (Figure 3C).
Based on the surface coverages of θCO and θCHx, the τCO and τCHx values, the TOFchem and TOFITK (s−1) of CH4 formation were estimated (see Equations (10) and (11), Section 4.2) and results are shown in Figure 3D. The TOFchem (s−1) (estimated based on the total Co surface metal atoms) was found to slightly decrease with increasing PCO, namely: 9.74, 7.40, and 7.34 × 10⁻³ s−1, respectively, for 36, 60, and 84 mbar CO. However, in the case of TOFITK (s−1), which is estimated based on the total concentration of active CHx-s and reversibly adsorbed CO-s, this was found to decrease by 2.1 and 2.9 times, respectively, in the case of 60 and 84 mbar CO compared to the case of 36 mbar CO in the feed gas stream (TOFITK (s−1) = 127.7, 61.5, and 44.2 × 10⁻³ s−1, respectively, Figure 3D). These differences in TOFITK (s−1) are attributed to the different concentration of active sites accommodating CO-s and CHx-s that truly participate in the carbon-path of methanation reaction, which were both influenced by the partial pressure of CO (Figure 3B). The latter results are in good agreement with the work of Carvalho et al. [45] over the Co/SiO2 and CoPt/SiO2 catalysts, where, at higher hydrogen partial pressures (higher H2/CO), an increased θH favoured the rate of CO hydrogenation to methane. The TOFITK (s−1) was found to increase with an increasing H2/CO gas ratio. In fact, an increase by a factor of ~1.6 was reported for the TOFITK after an increase of H2/CO from 2 to 5 to be compared to the increase of ~1.4 in the present work (CoPt/γ-Al2O3, after increasing the H2/CO gas ratio from ~3.6 to 5.0 (Table 1, yfCO = 5 and 7 vol%).
Kinetic methane selectivity values SCH4(%) measured at 230 °C and for the applied partial pressures of H2 and CO are also reported in Table 1. It is clearly seen that SCH4(%) decreases substantially with increasing PCO. In particular, the increase of PCO from 36 mbar (3 vol%) to 60 (5 vol%) and 84 mbar (7 vol%) results in the decrease of CH4-selectivity by a factor of 1.55 and 1.71, respectively. Ma et al. [47] reported a very comprehensive kinetic study of methanation reaction over the 25 wt% Co/γ-Al2O3 catalyst at 220 °C and for a wide range of partial pressures of H2 and CO. The authors derived a CH4-selectivity relationship as a function of PH2, PCO, and PH2O (see Reference [47], Equation (9)). We have applied the latter relationship to the present kinetic experimental data considering that PH2O can be given by: PH2O = yH2O PT = (FCO, f XCO/FT) PT, where PT = 1.2 bar (total pressure), FCO, f = CO molar feed flow rate (mols CO/s), and FT = total feed molar flow rate (mols/s). It was found that SCH4(%) at the lowest PCO (36 mbar, 3 vol% CO) decreases by a factor of 1.4 and 1.78 with increasing PCO to 60 mbar (5 vol%) and 84 mbar (7 vol%), respectively. These values agree very well with the measured experimental values given in Table 1, considering the slightly different reaction T (230 vs. 220 °C) and Co mean particle size used in these studies.

2.3. Transient Isothermal and Temperature-Programmed Hydrogenation (TIH/TPH)

Figure 4 presents the transient rates (μmol g−1 s−1) of 12CH4 and 13CH4 obtained during hydrogenation of carbonaceous species formed after 5 h in the CO/H2 reaction at 230 °C, according to the following sequence of step-gas switches: x% 12CO/25% H2/Ar (5 h, 230 °C) → x% 13CO/25% H2/1% Kr/Ar (230 °C, 7 min, SSITKA) → Ar (3 min) → 50% H2/Ar (t), TIH (7 min, 230 °C) (see Section 4.3). The transient response curves of 12CH4 depicted in Figure 4A are due to the hydrogenation of inactive (spectator) 12C-containing species (named Cβ) not participating in the formation of CH4 under steady-state FTS reaction conditions. It is seen that PCO in the feed gas stream influences both the shape of the transient rate and the amount of Cβ. The former reflects the kinetics of hydrogenation of Cβ, which is expected to depend on its reactivity (k) and the rate-determining step (RDS) in the reaction path of hydrogenation [48,49]. Of interest is the long tail out for more than 100 s in the hydrogen stream, irrespective of the CO partial pressure used in the feed stream. This result is similar to the TIH of carbon formed after the CO/He reaction at 250 °C on a Rh/MgO catalyst [49].
The transient rate of 13CH4 (Figure 4B) reflects the hydrogenation of 13C-containing reaction intermediates exchanged at 230 °C after the SSITKA switch. It decays much faster than that of 12CH4 (Figure 4A), and its maximum is also higher than the corresponding one of 12CH4 (Figure 4A). These features show that the 12C-containing and 13C-containing species are different in reactivity towards hydrogenation to methane. The very sharp transient response of 13CH4 at t < 5 s is associated with the hydrogenation of the small amount of active CHx-s species (Cα) formed in CO/H2 (5 h) and exchanged (labelled 13CHx-s) under the SSITKA switch. It can be clearly seen that there is a small decrease in the maximum rate of 13CH4 formation by increasing the CO concentration in the feed gas stream from 3 to 5 vol% (4.4 vs. 4.0 μmol g−1 s−1, respectively), while a further increase to 7 vol% leads to an increase in the rate maximum by ~25% (5.5 μmol g−1 s−1). However, this appears practically at the same time, ca. 4–6 s. Part of the 13CH4 transient response (Figure 4B) is due to the hydrogenation of CO-s formed in CO/H2 (5 h) and exchanged under the SSITKA switch (Figure 1A,B, and Figure 3B). The hydrogenation of 13CO-s lasts for ~20 s in the case when 3 vol% CO was used in the feed. However, in the case of 5 and 7 vol% CO, the hydrogenation takes longer (~40 s). The amounts (μmol/g) and surface coverages (based on the exposed Co surface metal atoms) of the corresponding Cβ (12CH4 transient) and those of Cα and CO-s (13CH4 transient) are provided in Table 2. The θ(13CH4) was found to be 0.08, 0.12, and 0.17 for the 3, 5, and 7 vol% CO used in the feed gas stream, respectively. It is pointed out that the sum of the surface coverages of CO-s and Cα estimated during SSITKA is in very good agreement with the TIH results (θ(13CH4), Figure 4B). The amount (μmol g−1) of hydrogenated Cβ species given in Table 2 is found to be approximately the same irrespective of the partial pressure of CO in the feed gas stream, namely: 34.3 (θ = 0.10), 27.6 (θ = 0.08), and 30.4 (θ = 0.09) μmol g−1 for the 3, 5, and 7 vol% CO in the feed.
The 12CH4 transient response curves obtained during temperature-programmed hydrogenation (TPH), following 5 h in CO/H2 reaction and 7 min TIH at 230 °C, are reported in Figure 5 for the three CO concentrations used in the feed gas stream (3, 5, and 7 vol% CO). The several hydrogenation peaks and shoulders that appeared in these TPH traces are attributed to inactive carbonaceous species (named Cγ) formed during the FTS reaction, and which could not be hydrogenated at 230 °C, as opposed to the Cβ hydrogenated to methane at 230 °C (TIH, Figure 4A). As shown in Figure 5A, the amount of Cγ (Table 2) is influenced by the CO feed gas concentration, as opposed to the shape and Tmax (°C) of the 12CH4 traces. Furthermore, the fraction of the various types of Cγ carbonaceous species was found not to be influenced by the CO concentration in the feed, according to the deconvolution of the TPH traces performed (Figure 5B), and these results are reported in Table S1 (ESI). By increasing the CO concentration in the feed gas stream from 3 to 5 and 7 vol%, the amount of CH4 formed was found to increase, ca. 128, 228, and 252 μmol g−1, respectively. Additionally, the main peak maximum is ca. 290, 420, and 520 ppm, respectively (Figure 5A).

2.4. Operando DRIFTS—Transient Isothermal Hydrogenation (TIH) of CO

Operando DRIFTS-Mass spectrometry experiments were conducted in the DRIFTS cell (PFR performance) in which the outlet was connected to a mass spectrometer [19]. After 2 h of methanation reaction at 200 °C (5 vol% CO/25 vol% H2/Ar), the infra-red (IR) cell was purged with Ar for 3 min, which was followed by a step-gas switch to 50 vol% H2/Ar in order to study the transient kinetics of hydrogenation of each kind of adsorbed CO-s. Figure 6A shows the DRIFTS spectrum in the CO region (1800–2250 cm−1) and its deconvolution into five IR bands, following the deconvolution methodology previously described by us [19]. The IR bands marked (1) and (2) are due to the R and Q branches of gas-phase CO. The IR bands marked as (3) and (4) centered at 2015 and 1980 cm−1, respectively, are due to the presence of two linear-type reversibly chemisorbed CO-s. The third IR band centered at 1905 cm−1 is due to a bridged-type reversibly adsorbed CO-s [50,51,52,53,54]. At least one of these CO-s should be considered a precursor for methanation and higher HCs formation on the Co surface. The DRIFTS spectrum of Figure 6A is in agreement with our previous results (5 vol% CO, H2/CO = 2) and others reported for different H2/CO gas ratios [19,50,51,52,53,54].
The DRIFTS spectrum recorded after the 3-min Ar purge is shown in Figure 6B (Ar, t = 0 s) and its deconvolution into two kinds of linear CO-s (L1, L2) and one bridged-type CO-s (B) is depicted in Figure 6C. Upon the step-gas switch Ar → 50 vol% H2/Ar (t), the surface coverage of adsorbed CO-s (sum of L1, L2, and B) progressively decreases with time in hydrogen stream, and the maximum of the IR band shifts slightly to lower wavenumbers (Figure 6B). The latter is attributed to the effect of surface coverage of CO-s on its binding strength with the cobalt surface (lateral repulsive interactions between adjacent adsorbed CO-s). Thus, the bond energy between C and O within the adsorbed CO-s decreases, and, thereby, lowers the vibrational frequency as observed.
DRIFTS-TIH deconvoluted spectra with time of hydrogenation of the two linear-type (L1, L2) adsorbed CO-s species were further analysed by applying the microkinetic modelling described in detail [19]. Due to the small integral band area of the third bridged-type (B) adsorbed CO-s, no further analysis was attempted. Figure 7A,B show DRIFTS spectra of the evolution of the IR bands of L1 and L2 linear-type adsorbed CO-s with time in hydrogen gas stream, after following the same deconvolution procedure shown in Figure 6C (deconvolution in Ar gas stream). Both L1 and L2 adsorbed CO-s formed after 2 h in the CO/H2 reaction at 200 °C were hydrogenated towards methane within the first 3 min in 50 vol% H2/Ar. Figure 7C plots the integral band intensity (Abs cm−1) of the L1 and L2 as a function of time in 50%H2/Ar gas treatment. Assuming the same extinction coefficient for the two linear-type CO-s species, it is seen that the relative population of the two CO-s is L1:L2 ~65:35%. The integral bands of L1 and L2 follow a very similar decay with time in hydrogenation, which suggests similar kinetics of hydrogenation. This is confirmed by the following kinetic analysis.
The transient kinetics of hydrogenation of CO-s was modelled via the H-assisted CO dissociation mechanism [55,56,57], where the formation of hydroxymethylene species (HCOH-s) from the sequential hydrogenation of CO-s was considered as the rate-determined step (RDS) [19]. Based on this kinetic analysis, an apparent rate constant (keff, s−1) associated with this RDS was derived using Equation (2), where keff is the product of the intrinsic rate constant k times θH (keff = k θH).
ln [ a ] = k e f f t   ; a = A C O ( t ) A C O ( t = 0 )
In Equation (2), α is equal to the ratio of the integral IR band intensity for each individual linear-type adsorbed CO-s at a given time, t, in H2/Ar to the integral IR band intensity recorded at t = 0 (after the 3-min Ar purge before the H2/Ar step-gas switch was made).
Figure 7D presents linear plots of ln[α] versus time in H2/Ar for the two (L1, L2) linear adsorbed CO-s species. Based on Equation (2), the slope of the linear ln[α] vs. time plot provides the apparent rate constant (keff) of each of the two linear adsorbed CO-s. It is shown that the L1 and L2 adsorbed CO-s exhibit very similar reactivities (keff_L1/keff_L2 ~1, keff_L1 = 0.016 s−1) toward hydrogenation to CH4. Since keff = k θH, the L1 and L2 linear-type CO-s have very similar intrinsic reactivities (kL1 ~kL2). The keff value estimated is smaller than the one reported by us on the same Co/γ-Al2O3 catalyst at 230 °C and for H2/CO = 2 (5% CO, 10% H2). More precisely, keff_L1 = 0.021 and keff_L2 = 0.027 s−1 with kL1/kL2 to be 0.78 (230 °C). Assuming that the pre-exponential factors are the same for the two rate constants, then the kL1/kL2 ratio takes the value of 0.76 at 200 °C. Furthermore, the difference in the activation energies (E1-E2, kcal/mol) of hydrogenation of these two linear-type CO species was estimated to be ~0.3 kcal mol−1. The increase in the hydrogen partial pressure from 0.12 to 0.3 bar (10 to 25 vol% H2, P=1.2 bar) has a very small influence on the intrinsic rate constant of CO-s hydrogenation via the H-assisted CO dissociation mechanism (RDS: HCO-s + H-s → HCOH-s + s).
The transient evolution of CH4 formation during the DRIFTS-TIH experiment was recorded by online mass spectroscopy (operando methodology). This is depicted in Figure 8. At the same time, the gas-phase CO response was measured and compared to that of the Kr tracer, as shown in Figure 8. Based on the Kr and CO response curves, it is illustrated that desorption of CO during the 50%H2/Ar gas treatment of the catalyst sample was negligible. The CH4 transient response (Figure 8) presents two rate peak maxima. The first one, which appeared at ~8 s, is largely due to the CO-s and active CHx-s formed after 2 h of CO/H2 reaction at 200 °C, whereas the second peak centered at ~40 s is largely due to the Cβ species presented and discussed above (Section 2.3, Figure 4A). Integration of this transient response of CH4 provides the total amount (μmol/g or θ) of CO-s, and active CHx-s (Cα) and Cβ species formed after 2 h in CO/H2 reaction. This amount was found to be 31.1 μmol/g (θ = 0.09), as opposed to the value of θ = 0.20 obtained at 230 °C after 5 h in CO/H2 (Table 2). It is reasonable to suggest that, since θCO decreases with increasing rection T, and θCHx decreases with time-on-stream [11,21], then inactive Cβ appears to grow with an increasing reaction temperature from 200 to 230 °C.

3. Discussion

3.1. Influence of CO Partial Pressure on Intrinsic Kinetic Parameters of Methanation Reaction

The increase of CO partial pressure from 36 to 84 mbar (3–7 vol% CO, P = 1.2 bar), while keeping the H2 partial pressure constant at 300 mbar (25 vol%), led to significant variations in several intrinsic kinetic parameters of the methanation reaction conducted at 230 °C and after 5 h over the 20 wt% Co-0.05 wt% Pt/γ-Al2O3 commercially relevant catalyst. The θCO was found to be small, ca. 0.029, 0.032, and 0.049 for 36, 60, and 84 mbar, respectively, but with an increasing trend as the CO partial pressure increases and the H2/CO gas ratio decreases. An increase of θCO by a factor of ~1.68 was obtained as the CO partial pressure increases from 36 to 84 mbar. The latter result agrees with the characteristic features of Langmuir isotherm and the fast 12CO-s/13CO(g) exchange, which was revealed under SSITKA (see Figure 1A,B, and Figure 2A). The increase of θCO with PCO finds agreement with the SSITKA work conducted by Chen et al. [18] over the 17.1 wt% Co-0.04 wt% Pt/SiO2 catalyst. However, the reaction conditions of T = 260 °C and PH2 = 0.45 bar (PCO in the 15–90 mbar range) are different than in the present work (230 °C, PH2 = 0.3 bar). The authors reported that θCO increased from ~0.18 to ~0.30 in the examined PCO range. The differences in θCO between that work [18] and the present one must be seen as the result of the influence of several reaction parameters on θCO, which were not the same. For example, the reaction T, the time-on-stream (5 h in the present work vs. 16 h in Reference [18]), the H2 partial pressure, and the Co mean particle size (10 nm in the present work vs. 15 nm in Reference [18]).
The effect of La-promotion of Co/γ-Al2O3 catalysts toward methanation was investigated by Vada et al. [58] using the SSITKA technique at similar FTS reaction conditions (PCO = 0.036 bar, H2/CO = 10, T = 220 °C) to those used in this work. They found similar surface coverages of θCO = 0.11 and θCHx = 0.05 as in the present work (Figure 3B). Yang et al. [59] in their SSITKA work on Co/γ-Al2O3 using a CO partial pressure of PCO = 55 mbar, H2/CO = 10, T = 210 °C and PT = 1.85 bar, and, after 5 h on FTS reaction stream, they reported a similar θCHx value but larger θCO ~0.3. Thus, a larger PH2 (0.55 vs. 0.3 bar in the present work) and lower T (210 vs. 230 °C in the present work) led to larger θCO values. In the case of TOFchem, a value of ~12.5 × 10⁻³ (s−1) was reported [59] and compared to the present value of 7.4 × 10⁻³ (s−1) for very similar PCO (55–60 mbar) but larger PH2 (0.55 vs. 0.3 bar in the present work). A keff (CHx) value of ~0.1 s−1 was reported [59] compared to the value of 0.08 s−1 (Table 1) for the previously mentioned comparative experimental conditions.
Carvalho et al. [11,45] in their SSITKA works conducted at 250 °C over Co-based catalysts reported that θCO decreases and θCHx increases with an increasing H2/CO gas ratio. The authors claimed that higher θCHx could be linked to larger hydrogenation rates for higher hydrocarbons, which is in agreement with the decrease of SCH4 and increase of SC5+ [45]. These results are similar to those reported by Pena et al. [60] and those in the present work (Table 1), where, after increasing the CO partial pressure, an increase of θCHx and a concomitant decrease in SCH4 are obtained. In addition, Keyvanloo et al. [33] reported that, by increasing the CO partial pressure, while keeping the H2 partial pressure constant, the SCH4 decreases. This result is similar to our findings, where the SCH4 (%) behaviour with PCO and PH2 was presented and discussed in Section 2.2 in relation to kinetic modelling studies [47] conducted on the Co/γ-Al2O3. In the present work, it was found that, after increasing the H2/CO gas ratio (decrease of CO partial pressure), the ratio of θCOCHx grows toward unity. This result agrees with that found by Carvalho et al. [45], where, for H2/CO = 2, θCO was higher than θCHx, whereas, for H2/CO = 5, θCHx was higher than θCO. This trend of θCOCHx with the H2/CO gas ratio is attributed to the competitive H2 and CO chemisorption where, after increasing the hydrogen partial pressure in a given range, θH increases against θCO, which results in increasing rates for -CHx coupling and further hydrogenation to higher hydrocarbons (lowering the SCH4).
The mean residence time of active -CHx species (τCHx, s) leading to CH4, was found to increase ~2.5 times by increasing the CO feed gas concentration from 3 to 5 vol%, whereas a further increase to 7 vol% causes only a slight increase (~30%). This result agrees very well with previous works. More specifically, τCHx is in the range of 5–15 s for the present catalytic system and the FTS reaction conditions applied, which is similar to other previous SSITKA works over Co-based catalysts supported on SiO2 or Al2O3, where τCHx ranged from 8 to 25 s [8,11,15,16,59]. Vada et al. [58] for Co supported on alumina carrier found that, by decreasing the H2/CO gas ratio, the τCHx increases (7, 13, and 29 s for H2/CO = 15, 10, and 5, respectively, CO = 2 vol%). This result is in harmony with those of the present work. However, it should be noted that, in that work [58], the effect of H2/CO gas ratio was investigated by varying the PH2 as opposed to the present work where the PCO varied and PH2 was kept constant (Figure 3A).
According to the results shown in Table 1, the TOFchem (s−1) for CH4 formation at 230 °C decreases by ~25% when the PCO increases from 36 to 84 mbar. A similar behaviour was reported for the methanation reaction at 260 °C on Co/SiO2 (PH2 = 450 mbar) [18]. The drop in TOF of CH4 formation is attributed to the deterioration of site activity (keff) of the -CHx species and not of a possible decrease of the surface coverage of -CHx, as illustrated in Table 2. Given the fact that keff = k θH (see Section 4.2), it is reasonable to suggest that, as θH decreases with increasing PCO, then deterioration of intrinsic activity (k) of -CHx should be considered less than 25% in that range of PCO. Weststrate and Niemantsverdriet [46] pointed out the importance of θCHx and θV (coverage of empty catalytic sites) for hydrogen adsorption related to the hydrogenation of CO toward methane formation. The surface coverage of CO-s defines the amount of hydrogen able to chemisorb next to adsorbed CO-s for a given PCO, and, as a consequence, the τCHx strongly depends on the H2/CO gas ratio [46,58].
The TOFITK (s−1) of CH4 formation estimated based on the active CO-s and CHx-s intermediates measured by SSITKA shows large differences when compared to TOFchem for a given PCO, according to the results reported in Table 1. The influence of PCO on TOFITK is largely different than in the case of TOFchem. By increasing the CO partial pressure from 36 to 84 mbar, the TOFITK decreases by a factor of 2.9 (127.7 vs. 44.2 × 10⁻³ s−1) to be compared to the value of 1.3 for the TOFchem, which indicates the more sensitive nature of TOFITK on PCO. It is interesting to mention the variation of TOFITK/TOFchem with PCO, where a decrease from 13 to 6 is obtained by increasing the PCO from 36 to 84 mbar.
The exchange rates of CO-s and CHx-s in the SSITKA experiment were estimated (see Section 4.2, Equations (3) and (4)) and reported (Figure 2) for the first time to the best of our knowledge. It is clearly illustrated the significantly larger adsorption/desorption rate of CO, R C O e x , compared to that of hydrogenation of -CHx ( R C H x e x ) under working FTS reaction conditions (5–7 vol% CO in the feed), but the similar rates for the lowest feed concentration of 3 vol% CO. Furthermore, the shape profile of R C H x e x suggests the influence of PCO on the formation of different kinds of CHx-s in the methanation reaction path with different reactivity toward hydrogenation to methane. Bell and co-workers [61] were the first to describe an advanced mathematical analysis of the 13CH4-SSITKA response curve for the methanation reaction, which reveals the distribution of reactivity of -CHx-s (f(k)—reactivity distribution function). Thus, the heterogeneity of sites exists for this particular active reaction intermediate. Weststrate and Niemantsverdriet [46] pointed out that the long CHx-s residence time (e.g., 10 s) observed on the Co(0001) surface, which is similar to the τCHx values reported in Table 1, cannot be due to the existence of low values of θH or θH*H, where θ*H is the surface coverage of empty sites for hydrogen chemisorption. The authors proposed, based on DFT calculations and the θCHx values observed (0.1–0.2 ML), that CHx are formed on step edge sites, which then migrate to the terrace sites. The latter was considered the rate-determining step (RDS) that gives rise to residence times of ~10 s. Given the fact that more than one kind of step edge sites can be formed on the Co surface with a distribution that depends on the Co particle size, hydrogenation of such CHx-s species is more sensitive to the PCO, which is shown in the present work (Figure 2B). An increase of CO feed gas concentration from 3 to 7 vol% causes the increase of τCHx by ~3.5 times (Table 1).

3.2. The Influence of H2 Partial Pressure on the Reactivity of CO-s in the Methanation Reaction

Transient Isothermal Hydrogenation (TIH) of adsorbed CO-s coupled with DRIFTS performed at 200 °C after 2 h in 5 vol% CO/25 vol% H2/Ar along with microkinetic analysis, which was based on a hydrogen-assisted CO hydrogenation mechanism, revealed practically the same reactivity (k) for each of the two L1 and L2 linear-type adsorbed CO-s species populated on the present Co/γ-Al2O3 catalyst (Figure 7C,D). According to the results depicted in Figure 6C and Figure 7C, the initial surface coverage of L1 and L2 adsorbed CO-s is largely different. The θCO apparently had no influence on the hydrogenation activity of each of these two linear-type CO-s, thus, on the RDS (HCO-s + H-s → HCOH-s + s), in agreement with the recent work of Zijlstra et al. [34]. The authors based on Density Functional Theory (DFT) calculations reported that the C-O bond dissociation energy on step-edge sites is hardly affected by CO co-adsorbates. The comparison between the CO-s hydrogenation rate constant (k) found in the present work (Figure 7, Section 2.4) for a H2/CO gas ratio of 5 and that from previous results [19] for a H2/CO gas ratio of 2 (same 5% CO concentration was used in the FTS reaction) over the same catalyst, suggest that the H2/CO gas ratio hardly affects the k of RDS (H-assisted CO hydrogenation mechanism).
The results of the operando DRIFTS-Mass spectrometry methodology applied in the isothermal hydrogenation of adsorbed CO-s and in the transient mode, which are depicted in Figure 6, Figure 7 and Figure 8, combined with the SSITKA-MS results depicted in Figure 3B, allowed to learn about the nature of the various kinds of adsorbed CO-s, their distribution (individual θCO (Li), i = 1, 2), and their reactivity (ki, s−1) toward hydrogenation to CH4. On the other hand, the SSITKA-MS alone and the TIH-Mass spectrometry alone (Figure 4B) allowed to estimate only the total surface coverage of all types of CO-s and an effective reactivity, keff (s−1) for methanation associated with the active CHx-s formed from all these related adsorbed CO-s precursor species. Thus, the powerful combination of SSITKA with an operando methodology becomes clear from the results of the present example of methanation reaction on Co/γ-Al2O3, as demonstrated also in the WGS reaction and others reported therein [24].

3.3. Effect of CO Partial Pressure on the Formation of Inactive Cβ and Cγ Carbonaceous Species

Transient isothermal (TIH) and temperature programmed hydrogenation (TPH) conducted following the SSITKA step-gas switch (12CO/H213CO/H2) over alumina-supported cobalt for the first time was described in detail in our previous publication [19]. In the present work, the influence of CO partial pressure in the 36–84 mbar range (constant H2 partial pressure of 300 mbar) on the rate of formation of inactive carbonaceous species (based on the measured amount for a given time-on-stream, TOS) was investigated. The transient rate of 12CH4 formation estimated during TIH at 230 °C (Figure 4A) corresponds to the hydrogenation of inactive Cβ, CxHy-s (y ≠ 0), the structure of which was revealed via in situ DRIFTS [19], which is in agreement with other studies on Co-based FTS catalysts at similar reaction temperatures [46,62].
The amount of Cβ (Table 2) was found to be 1.2 and 1.1 times higher in the case where 3 vol% CO compared to 5 and 7 vol% CO, respectively, were used (34.3, 27.6, and 30.4 μmol C g−1, respectively). The shape of 12CH4 response (Figure 4A) revealed two kinds of inactive Cβ species (Cβ,I—small peak at ~5 s, and Cβ,II—broad peak with maximum at ~30 s) in the case where 3 vol% CO was used in the feed gas stream, as opposed to the case of 5 and 7 vol% CO, where only single and very similar in shape peaks were observed, which likely correspond to adsorbed carbonaceous species of the same chemical structure. Based on our previous DRIFTS work [19] and the results of Figure 4A (peak shapes), the Cβ,I—small peak could be attributed to the presence of a small concentration of HCOO-s (formate species) formed on the Co-alumina interface able to be hydrogenated at 230 °C. This assignment finds support from the TIH experiments reported by Paredes et al. [23].
The rate of hydrogenation of CO-s and active CHx-s (Figure 4B) is significantly larger than that of inactive Cβ (12CH4 response, Figure 4A), and this explains the accumulation of Cβ in CO/H2 reaction conditions, where θH is lower than that established in 50%H2/Ar gas treatment. In the former case, CO and H2 competes for Co active sites, where the former presents larger adsorption energy. Thus, θCO will depend largely on the partial pressure of CO only, as opposed to θH, which will also depend on the concentration of Co surface vacant sites [18]. As mentioned previously (see Section 3.1), by reducing θH, the concentration of active CHx-s formed will be reduced. As shown in Table 2 and Figure 4, with decreasing CO partial pressure in the feed gas stream (ca. 3 vol%), θCO and θCHx become smaller (Figure 3B), which leads to less blockage of Co active sites for H-s formation. Thus, more Cβ can be formed. The latter finds support from the literature [17], where -CHx monomers polymerization and termination (Cβ formation) proceed with faster rates than the H-assisted CO dissociation step at FTS reaction conditions. Based on the amounts of Cβ (Table 2), the effect of PCO is not that large. Approximately, a 15% decrease occurs by increasing the PCO from 36 to 84 mbar at 230 °C on the present Co/γ-Al2O3 commercially relevant catalyst.
The TPH results shown in Figure 5A,B, Table 2, and Table S1 (ESI) reveal the likely existence of four kinds of carbonaceous species of different distribution but of similar individual activity (note the similar TM values, Table S1), independent of CO partial pressure. The surface coverage of each of these Cγ carbonaceous species largely depends on PCO (Table 2). By increasing the CO feed concentration from 3 to 7 vol%, the total amount of Cγ was nearly increased by a factor of two (Table 2). The chemical structure of Cγ was reported [31,32,34] to include: (i) oligomeric strongly adsorbed hydrocarbon species (peaks 1, 2, and 3, TM = 320–390 °C) and (ii) polymeric carbon (Peak 4, TM = 400–450 °C). The latter species were not eliminated during DRIFTS-TIH at 230 °C as reported in our previous publication [19] (IR band centred at 2915 cm−1), but at higher temperatures (230 < T < 400 °C). It was reported [63] that larger amounts of polymeric carbon are formed with decreasing hydrogen partial pressure at constant PCO over Co-based FTS catalysts. The possibility that formates could be considered as part of Cγ should be excluded, as these were hydrogenated under DRIFTS-TPH at T < 300 °C [19].
Pena et al. [60] in support of the present findings showed that, by increasing the H2/CO gas ratio, higher amounts of polymeric carbon reacted with hydrogen under TPH. Keyvanloo et al. [33] showed via TPH following FTS reaction under industrial conditions that, by increasing the H2/CO ratio at a constant hydrogen partial pressure, more hydrogenated polymeric carbon was formed, which is similar to the present findings, where Cγ is larger in the case of 7 vol% CO with most of carbonaceous species to be hydrogenated at T > 350 °C but lower than 550 °C. Thus, this cannot be attributed to atomic (low Ts) or graphitic carbon (high Ts). It was reported [33,64] that, by increasing PCO at constant PH2, the deactivation rate increases, which might be due to the increase of hydrogen-deficient polymeric inactive carbonaceous species. Additionally, Pena and co-workers [60,65] showed via TPH and Scanning Transmission Electron Microscopy–Electron Energy Loss Spectroscopy (STEM-EELS) that, under low hydrogen partial pressures in FTS reaction conditions, more stable carbon species are formed with polymeric carbon and strongly adsorbed hydrocarbon-like species to be responsible for the deactivation of the catalyst at a lower H2/CO gas ratio. This result agrees with the present work where, at a lower H2/CO gas ratio, larger amounts of Cγ are formed.

4. Materials and Methods

4.1. Co/γ-Al2O3 Catalyst—Synthesis and Characterization

The 20 wt% Co supported on Sasol Germany’s Puralox SCCa γ-Al2O3 catalyst was prepared by SASOL S.A., as described elsewhere [19,42]. More precisely, 20 wt% Co and 0.05 wt% Pt were deposited on the alumina support via a slurry-phase impregnation procedure with aqueous metal precursor solutions described in References [42,43]. The resulting slurry was dried under vacuum and calcined in static air at 250 °C. Sequential impregnation and calcination steps were applied in order to achieve 20 wt% Co nominal loading. Prior to any catalytic and transient kinetic measurements, the catalyst was in situ reduced in pure H2 (1 bar, 50 NmL min−1) at 425 °C for 10 h (from room T to 425 °C, the temperature of the solid was increased at β = 1 °C min−1), which was followed by an He-purge and cooling to 230 °C for FTS. A 5 vol% O2/He (2 h) was applied at 30 °C, following catalytic measurements, for catalyst passivation. The latter sample was further used in DRIFTS studies (Section 4.4). The as-received commercially relevant catalyst in powder form was sieved to less than a 106-μm particle size for avoidance of internal mass transport resistances before catalytic and transient kinetic measurements. Textural (BET/BJH), structural (PXRD, HAADF-TEM), and H2-TPR/H2-TPD studies over the examined catalyst were described and presented in detail in our previous publication [19].

4.2. SSITKA-MS Following 5 h in FTS

Steady State Isotopic Transient Kinetic Analysis (SSITKA) experiments with the use of 13CO were conducted in order to investigate the effects of the variation of CO partial pressure (constant H2 partial pressure), or the H2/CO gas ratio, on the carbon pathway of methane formation at 230 °C. After 5 h in CO/H2 (x vol% 12CO/25 vol% H2/Ar, GHSV = 30,000 h−1), the SSITKA step-gas switch to x vol% 13CO/25 vol% H2/Ar (t) was made. At this point, it is worth mentioning that internal and external mass transport resistances in the catalytic bed placed in the quartz micro-reactor used were absent, as previously reported [19,66]. During the SSITKA step-gas switch, the mass numbers (m/z) 15, 17, 18, 28, 29, and 84, which correspond to 12CH4, 13CH4, H2O, 12CO, 13CO, and Kr, respectively, were continuously monitored by MS. The contribution of H2O (m/z = 18) to the m/z = 17 was considered for the analysis of 13CH4 signal to concentration (ppm or mol%) in the case a different signal at m/z = 18 in the two 12CO/H2 and 13CO/H2 gas mixtures would be recorded. An ideally designed and conducted 12CO/13CO-SSITKA experiment for FTS should provide the same signals at m/z = 18 [19,21].
The transient rates (μmol g−1s−1) of CO and active CHx-s intermediates which are exchanged (12CO-s is replaced for 13CO-s and 12CHx-s for 13CHx-s) during SSITKA were estimated based on Equations (3) and (4), respectively.
R C O e x   ( m o l g 1 s 1 ) = F T y C O f W [ A ( X C O s . s ( S C H 4 Z C   13 H 4 ( t ) + S C 2 Z C 2 ( t ) + S C 3 Z C 3 ( t ) + ) ) ]
  R C H x e x ( m o l g 1 s 1 ) = F T y C   13 H 4 W [ Z C   13 O ( t ) Z C   13 H 4 ( t ) ]  
where FT is the total molar flow rate (mol s−1), yfCO is the mole fraction of CO in the feed, X C O s . s is the CO conversion (%) at a steady state, W is the mass of the catalyst (g), y13CH4 is the mole fraction of 13CH4 at the effluent stream from the micro-reactor in the new steady-state obtained in 13CO/H2, Z is the dimensionless concentration of a given gas-phase species, and A(t) = ( Z K r ( t ) Z C   13 O ( t ) ) .
Equation (3) is based on the fact that the rate of 13CO fed in the reactor (mols 13CO/s) during the step-gas SSITKA switch (until the new steady-state is reached) must be equal to the sum of the rates of: (i) exchange of 13CO with 12CO-s ( R C O e x ), (ii) conversion of 13CO into 13CH4, (iii) conversion of 13CO into 13C2+-hydrocarbons, and (iv) the rate of non-reacted 13CO(g) leaving the reactor (rate of outlet flow of 13CO(g) from the micro-reactor). The ZC2, ZC3, and those of higher hydrocarbons (ZCn) that appear in Equation (3) represent the fractional change in 13C for the C2-, C3-, and Cn-hydrocarbons, respectively, and can only be measured after using the SSITKA-GS-MS methodology [17,67]. In the present work, only the ZC1 (Z(13CH4)) was measured by mass spectrometry. However, according to the experimental work of Rebmann et al. [67] on a 13 wt% Co/γ-Al2O3 catalyst, the ZC2 and ZC3 transient curves were very close (almost identical) to that of ZC1. Given the fact that, in the present work, the total carbon selectivity to C1-C3 is more than 85%, the ZCn (n > 3) terms in Equation (3) were neglected, and it was considered that ZC1 ~ZC2 ~ZC3. In Equations (3) and (4), the accumulation of 13CO(g) in the CSTR micro-reactor used [66] was found to be very small when compared to the other terms. Thus, it was also neglected.
The concentration (μmol g−1) of the reversibly adsorbed CO-s and active CHx-s intermediates leading to CH4 are given by the following material balance Equations (5) and (6), respectively [19].
N C O ( m o l g 1 ) = F T y C O f ( 1 X C O ) W 0 t s . s [ Z K r ( t ) Z C   13 O ( t ) ] d t
  N C H x ( m o l g 1 ) = F T y C   13 H 4 W 0 t s . s [ Z C   13 O ( t ) Z C   13 H 4 ( t ) ] d t  
The surface coverage, θ, and the mean residence time, τ (s), of the reversibly adsorbed CO-s and active CHx-s intermediates, can be estimated based on the following Equations (7)–(9).
θ i = N i N C o , s u r f ( i = C O ,   C H x )
  τ C O = 0 t s . s [ Z K r ( t ) Z C   13 O ( t ) ] d t  
  τ C H x = 0 t s . s [ Z C   13 O ( t ) Z C   13 H 4 ( t ) ] d t  
where ts.s. is the time at which the new steady-state is obtained under the 13CO/H2 gas mixture.
The kinetic rate TOF (s−1) of CH4 formation is estimated based on the Co dispersion, Equation (10) (TOFchem, s−1), or the concentration of active reaction intermediates (Equations (5) and (6)) found in the reaction path of CH4 formation, TOFITK (s−1), via Equation (11) [19]. In addition, the effective rate constant, keff (s−1), for the methanation reaction is estimated based on Equation (12), which holds when one of the hydrogenation steps of -CHx/CHxO intermediates is the RDS of the methanation reaction (hydrogenation and not CO dissociation of CO-s is the RDS).
T O F C h e m = F T y C H 4 W N C o , s u r f = θ C H x τ C H x
  T O F I T K = F T y C H 4 W ( N C O + N C H x )  
  k e f f = 1 τ C H x = k   θ H  
NCo,surf is the total number of surface cobalt per gram of catalyst (μmol g−1) estimated on the basis of the dispersion and loading values of the Co/γ-Al2O3 catalyst.

4.3. Transient Isothermal (TIH) and Temperature-Programmed Hydrogenation (TPH) Experiments

Transient hydrogenation experiments (Isothermal and Temperature-Programmed) were performed following the SSITKA step-gas switch: x% 13CO/25% H2/Kr/Ar (230 °C, 7 min) → Ar (3 min) → 50% H2/Ar, TIH (7 min, 230 °C) → TPH up to 600 °C (β = 10 °C min−1). During the TIH and TPH runs, the mass numbers (m/z) 15, 17, and 18 for 12CH4, 13CH4, and H2O were continuously monitored by online mass spectrometry. Under TIH at 230 °C, the 12CH4 response reflects the inactive carbon-containing species (named Cβ) formed during the non-isotopic 12CO/H2 gas mixture (5 h) and which cannot be exchanged with 13CO during the 13CO/H2-SSITKA switch. On the other hand, the 13CH4 response reflects both the adsorbed 13CO-s and active 13CHx-s species that are exchanged during the SSITKA switch. Under TPH, the response of 12CH4 is due to adsorbed refractory carbonaceous inactive species (CxHy-s, named Cγ) that were not hydrogenated at 230 °C. The transient concentration response curves of 12CH4(t) and 13CH4(t) recorded during TIH/TPH were converted into transient rates (mol g−1 s−1) using Equation (13) (the accumulation term in the Continuous Stirred Tank Reactor (CSTR, ~1.5 mL volume micro-reactor) was found negligible when compared to the outlet rate of CH4 from the micro-reactor) and after calibration of the MS signal with standard 1.04 mol% 12CH4/Ar and 2.1 mol% 13CH4/Ar gas mixtures.
R C H 4 ( m o l g 1 s 1 ) = F T   y C H 4 W

4.4. Operando DRIFTS—Mass Spectrometry—Transient Isothermal Hydrogenation (TIH) of CO

The reactivity toward hydrogen of the various types of chemisorbed CO-s formed after 2 h of CO/H2 reaction at 200 °C was determined by operando DRIFTS kinetic experiments. The temperature of 200 °C instead of 230 °C was selected since this allowed the recording of more spectra (lower hydrogenation rate of CO) during this transient experiment. DRIFTS spectra were collected by using a Perkin-Elmer Frontier FT-IR spectrometer equipped with an MCT detector and a high-temperature/high pressure temperature controllable DRIFTS reactor cell (Harrick Scientific, Praying Mantis) with CaF2 windows. An average spectrum was recorded after 256 scans (resolution of 4 cm−1, scanning speed rate of 2 cm s−1). The sieved and passivated catalyst sample (as described in Section 4.1) was placed in the DRIFTS reactor cell (~90 mg) and its temperature was increased to 425 °C and kept for 2 h in 50 vol% H2/Ar (50 NmL min−1), which was followed by cooling in H2/Ar gas flow to the methanation reaction temperature, T = 200 °C, for background spectrum of solid catalyst acquisition. The DRIFTS cell was subsequently purged in Ar gas flow for 20 min and then exposed to the CO/H2 feed gas stream (5 vol% CO/25 vol% H2/Ar) for 2 h. At the end of the reaction, an averaged DRIFTS spectrum was collected. The transient kinetics of hydrogenation of individual adsorbed CO-s species formed during the reaction step was investigated by transient isothermal hydrogenation (TIH) in 50 vol% H2/Ar gas flow. The recorded DRIFTS spectra in the CO region under CO/H2 and TIH reaction conditions were deconvoluted following the procedure previously described in detail [19]. In the case of a TIH reaction run, where no gas phase IR CO bands were observed, the following criteria for deconvolution were used: (i) FWHM < 100 cm−1, (ii) R2 > 0.99, and (iii) IR band center of the CO-s species was allowed for a small shift (< 20 cm−1) to lower wavenumbers (surface coverage effect). By considering fulfillment of the above three criteria, three IR bands of adsorbed CO-s were obtained.
During TIH, the gas-phase responses of CO and CH4 from the outlet of the DRIFTS reactor cell were continuously monitored by the connected mass spectrometer (MS), which were used for performing the SSITKA-MS and other transient kinetic experiments that followed (TIH/TPH).

5. Conclusions

The present study aimed at providing deeper fundamental understanding on how the CO partial pressure affects important kinetic parameters of the methanation reaction path at 230 °C and 1.2 bar total pressure over a commercially relevant 20 wt% Co-0.05 wt% Pt/γ-Al2O3 catalyst. Towards this goal, advanced SSITKA combined with transient isothermal and temperature-programmed hydrogenation experiments as well as transient operando DRIFTS-MS CO hydrogenation to CH4 coupled with a microkinetic modelling were performed.
For the first time, to the best of our knowledge, the exchange rates of CO-s and CHx-s related to the SSITKA experiment were estimated via strict application of 13C-material balances. The adsorption/desorption rate of CO-s, R C O e x   , was found to be significantly larger in comparison to the hydrogenation of CHx-s ( R C H x e x ), and its dependence on the partial pressure of CO was probed. The large influence of CO partial pressure on the formation of different kinds of active CHx-s during the methanation reaction was suggested by the shape of the transient rate profile of the CHx-s exchange.
By increasing the CO partial pressure, an increase of θCO was observed and this agrees with the characteristic features of the Langmuir isotherm and the fast CO exchange observed. Additionally, by increasing the CO partial pressure, an increase of θCHx and a concomitant decrease in SCH4 were observed, which was linked to the increase of θCOCHx by decreasing the CO partial pressure (competitive chemisorption of H2 and CO reactants) and the growing rate of -CHx coupling (increase of θCHx).
The amount (μmol/g) and reactivity in hydrogen of the inactive carbonaceous species formed after 5 h of FTS at 230 °C over the Co/γ-Al2O3 catalyst was estimated via TIH (Cβ) and TPH (Cγ) following SSITKA. The amounts of Cβ and Cγ were found to be influenced by the CO partial pressure (36–84 mbar, PH2 = 300 mbar). In particular, larger amounts of adsorbed active CHx-s and CO-s were found to react with hydrogen at 230 °C toward CH4 by increasing the CO partial pressure, as opposed to the amount of inactive carbonaceous species (-CxHy, named Cβ), which slightly decreased by increasing the CO concentration in the feed. The latter was related to the fact that θCO and θCHx become larger, which likely reduces the surface coverage of H-s, and, thus, the rate of formation of Cβ. The amount of inactive carbonaceous species Cγ was found to significantly increase with increasing CO partial pressure. The Cγ could be due to hydrogen-deficient polymeric carbon and strongly adsorbed hydrocarbon-like species, but not formate (HCOO), atomic, or graphitic carbon.
Based on microkinetic modelling performed on the operando DRIFTS Transient Isothermal Hydrogenation conducted at 200 °C following the methanation reaction (5 vol% CO/25 vol% H2/Ar, 2 h), the presence of two linear-type adsorbed CO-s species (L1 and L2) of a 65:35 (mol/mol) ratio but of very similar activity (k) was revealed. It was concluded that θCO had no influence on the hydrogenation activity of linear-type CO-s and on the RDS (HCO-s + H-s → HCOH-s + s) of the considered H-assisted CO hydrogenation mechanism.

Supplementary Materials

The following are available online at https://www.mdpi.com/2073-4344/10/5/583/s1, Table S1: Peak centers (°C) of each individual peak of the TPH profiles derived after deconvolution, Table S2: IR band position (cm−1) of each individual adsorbed CO-s (L1 and L2) formed after 2 h in FTS (5% CO/25% H2/Ar, 200 °C) recorded under Ar purge (after 3 min) and in 50 vol% H2/Ar gas mixture.

Author Contributions

Conceptualization, A.M.E. and M.A.V. Methodology, A.M.E. and M.A.V. Validation, A.M.E. and M.A.V. Formal analysis, K.K.K. and M.A.V. Resources, A.M.E. and A.G. Writing—original draft preparation, M.A.V. Final writing—review and editing, A.M.E. Visualization, A.M.E. and M.A.V. Supervision, A.M.E. and M.A.V. Project administration, A.M.E. and A.G. Funding acquisition, A.M.E., N.S.G., and A.G., R.C. and D.M. All authors have read and agreed to the published version of the manuscript.

Funding

SASOL South Africa Ltd. (Contract No. 123-17-GT) and the Research Committee of the University of Cyprus funded this research.

Acknowledgments

The authors would like to acknowledge financial support from SASOL South Africa Ltd. and the Research Committee of the University of Cyprus.

Conflicts of Interest

The authors declare no conflict of interest.

References

  1. Jahangiri, H.; Bennett, J.; Mahjoubi, P.; Wilson, K.; Gu, S. A review of advanced catalyst development for Fischer–Tropsch synthesis of hydrocarbons from biomass derived syn-gas. Catal. Sci. Technol. 2014, 4, 2210–2229. [Google Scholar] [CrossRef] [Green Version]
  2. Khodakov, A.Y.; Chu, W.; Fongarland, P. Advances in the Development of Novel Cobalt Fischer−Tropsch Catalysts for Synthesis of Long-Chain Hydrocarbons and Clean Fuels. Chem. Rev. 2007, 107, 1692–1744. [Google Scholar] [CrossRef] [PubMed]
  3. Chen, W.; Lin, T.; Dai, Y.; An, Y.; Yu, F.; Zhong, L.; Li, S.; Sun, Y. Recent advances in the investigation of nanoeffects of Fischer-Tropsch catalysts. Catal. Today 2018, 311, 8–22. [Google Scholar] [CrossRef]
  4. Krylova, A.Y. Products of the Fischer-Tropsch synthesis (A Review). Solid Fuel Chem. 2014, 48, 22–35. [Google Scholar] [CrossRef]
  5. Yang, J.; Ma, W.; Chen, D.; Holmen, A.; Davis, B.H. Fischer–Tropsch synthesis: A review of the effect of CO conversion on methane selectivity. Appl. Catal. A Gen. 2014, 470, 250–260. [Google Scholar] [CrossRef]
  6. Todic, B.; Ma, W.; Jacobs, G.; Davis, B.H.; Bukur, D.B. Effect of process conditions on the product distribution of Fischer-Tropsch synthesis over a Re-promoted cobalt-alumina catalyst using a stirred tank slurry reactor. J. Catal. 2014, 311, 325–338. [Google Scholar] [CrossRef]
  7. Den Breejen, J.P.; Sietsma, J.R.A.; Friedrich, H.; Bitter, J.H.; de Jong, K.P. Design of supported cobalt catalysts with maximum activity for the Fischer-Tropsch synthesis. J. Catal. 2010, 270, 146–152. [Google Scholar] [CrossRef]
  8. Den Breejen, J.P.; Radstake, P.B.; Bezemer, G.L.; Bitter, J.H.; Frøseth, V.; Holmen, A.; de Jong, K.P. On the Origin of the Cobalt Particle Size Effects in Fischer−Tropsch Catalysis. J. Am. Chem. Soc. 2009, 131, 7197–7203. [Google Scholar] [CrossRef]
  9. Iqbal, S.; Davies, T.E.; Hayward, J.S.; Morgan, D.J.; Karim, K.; Bartley, J.K.; Taylor, S.H.; Hutchings, G.J. Fischer Tropsch Synthesis using promoted cobalt-based catalysts. Catal. Today 2016, 272, 74–79. [Google Scholar] [CrossRef] [Green Version]
  10. Eschemann, T.O.; Oenema, J.; de Jong, K.P. Effects of noble metal promotion for Co/TiO2 Fischer-Tropsch catalysts. Catal. Today 2016, 261, 60–66. [Google Scholar] [CrossRef]
  11. Carvalho, A.; Ordomsky, V.V.; Luo, Y.; Marinova, M.; Muniz, A.R.; Marcilio, N.R.; Khodakov, A.Y. Elucidation of deactivation phenomena in cobalt catalyst for Fischer-Tropsch synthesis using SSITKA. J. Catal. 2016, 344, 669–679. [Google Scholar] [CrossRef]
  12. Chen, W.; Kimpel, T.F.; Song, Y.; Chiang, F.K.; Zijlstra, B.; Pestman, R.; Wang, P.; Hensen, E.J.M. Influence of Carbon Deposits on the Cobalt-Catalyzed Fischer-Tropsch Reaction: Evidence of a Two-Site Reaction Model. ACS Catal. 2018, 8, 1580–1590. [Google Scholar] [CrossRef] [PubMed]
  13. Efstathiou, A.M.; Gleaves, J.T.; Yablonsky, G.S. Transient Techniques: Temporal Analysis of Products and Steady State Isotopic Transient Kinetic Analysis. In Characterization of Solid Materials and Heterogeneous Catalysts: From Structure to Surface Reactivity; Wiley—VCH: Weinheim, Germany, 2012; Volume 1&2, pp. 1013–1073. [Google Scholar]
  14. Pansare, S.; Sirijaruphan, A.; Goodwin, J.G. Investigation of Reaction at the Site Level Using SSITKA. In Isotopes in Heterogeneous Catalysis, Catalytic Science Series, v. 4; Imperial College Press: London, UK, 2006; pp. 183–211. [Google Scholar]
  15. Frøseth, V.; Storsæter, S.; Borg, O.; Blekkan, E.A.; Rønning, M.; Holmen, A. Steady state isotopic transient kinetic analysis (SSITKA) of CO hydrogenation on different Co catalysts. Appl. Catal. A Gen. 2005, 289, 10–15. [Google Scholar] [CrossRef]
  16. Yang, J.; Chen, D.; Holmen, A. Understanding the kinetics and Re promotion of carbon nanotube supported cobalt catalysts by SSITKA. Catal. Today 2012, 186, 99–108. [Google Scholar] [CrossRef]
  17. Chen, W.; Filot, I.A.W.; Pestman, R.; Hensen, E.J.M. Mechanism of Cobalt-Catalyzed CO Hydrogenation: 2. Fischer–Tropsch Synthesis. ACS Catal. 2017, 7, 8061–8071. [Google Scholar] [CrossRef] [PubMed]
  18. Chen, W.; Pestman, R.; Zijlstra, B.; Filot, I.A.W.; Hensen, E.J.M. Mechanism of Cobalt-Catalyzed CO Hydrogenation: 1. Methanation. ACS Catal. 2017, 7, 8050–8060. [Google Scholar] [CrossRef]
  19. Vasiliades, M.A.; Kalamaras, C.M.; Govender, N.S.; Govender, A.; Efstathiou, A.M. The effect of preparation route of commercial Co/γ-Al2O3 catalyst on important Fischer-Tropsch kinetic parameters studied by SSITKA and CO-DRIFTS transient hydrogenation techniques. J. Catal. 2019, 379, 60–77. [Google Scholar] [CrossRef]
  20. Frennet, A.; de Bocarmé, T.V.; Bastin, J.-M.; Kruse, N. Mechanism and Kinetics of the Catalytic CO−H2 Reaction:  An Approach by Chemical Transients and Surface Relaxation Spectroscopy. J. Phys. Chem. B 2005, 109, 2350–2359. [Google Scholar] [CrossRef]
  21. Petallidou, K.C.; Vasiliades, M.A.; Efstathiou, A.M. Deactivation of Co/γ-Al2O3 in CO methanation studied by transient isotopic experiments: The effect of Co particle size. J. Catal. 2020. accepted for publication. [Google Scholar]
  22. Lorito, D.; Paredes-Nunez, A.; Mirodatos, C.; Schuurman, Y.; Meunier, F.C. Determination of formate decomposition rates and relation to product formation during CO hydrogenation over supported cobalt. Catal. Today 2016, 259, 192–196. [Google Scholar] [CrossRef]
  23. Paredes-Nunez, A.; Lorito, D.; Guilhaume, N.; Mirodatos, C.; Schuurman, Y.; Meunier, F.C. Nature and reactivity of the surface species observed over a supported cobalt catalyst under CO/H2 mixtures. Catal. Today 2015, 242, 178–183. [Google Scholar] [CrossRef]
  24. Efstathiou, A.M. Elucidation of Mechanistic and Kinetic Aspects of Water-Gas Shift Reaction on Supported Pt and Au Catalysts via Transient Isotopic Techniques. Catalysis 2016, 28, 175–236. [Google Scholar]
  25. Efstathiou, A.M.; Bennett, C.O. The CO/H2 reaction on Rh/Al2O3: II. Kinetic study by transient isotopic methods. J. Catal. 1989, 120, 137–156. [Google Scholar] [CrossRef]
  26. Kalamaras, C.M.; Americanou, S.; Efstathiou, A.M. “Redox” vs “associative formate with –OH group regeneration” WGS reaction mechanism on Pt/CeO2: Effect of platinum particle size. J. Catal. 2011, 279, 287–300. [Google Scholar] [CrossRef]
  27. Kalamaras, C.M.; Gonzalez, I.D.; Navarro, R.M.; Fierro, J.L.G.; Efstathiou, A.M. Effects of Reaction Temperature and Support Composition on the Mechanism of Water–Gas Shift Reaction over Supported-Pt Catalysts. J. Phys. Chem. C 2011, 115, 11595–11610. [Google Scholar] [CrossRef]
  28. Vasiliades, M.A.; Djinović, P.; Davlyatova, L.F.; Pintar, A.; Efstathiou, A.M. Origin and reactivity of active and inactive carbon formed during DRM over Ni/Ce0.38Zr0.62O2-δ studied by transient isotopic techniques. Catal. Today 2018, 299, 201–211. [Google Scholar] [CrossRef]
  29. Vasiliades, M.A.; Djinović, P.; Pintar, A.; Kovač, J.; Efstathiou, A.M. The effect of CeO2-ZrO2 structural differences on the origin and reactivity of carbon formed during methane dry reforming over NiCo/CeO2-ZrO2 catalysts studied by transient techniques. Catal. Sci. Technol. 2017, 7, 5422–5434. [Google Scholar] [CrossRef]
  30. Vasiliades, M.A.; Makri, M.M.; Djinović, P.; Erjavec, B.; Pintar, A.; Efstathiou, A.M. Dry reforming of methane over 5 wt% Ni/Ce1-xPrxO2-δ catalysts: Performance and characterization of active and inactive carbon by transient isotopic techniques. Appl. Catal. B Environ. 2016, 197, 168–183. [Google Scholar] [CrossRef]
  31. Zhuo, M.; Tan, K.F.; Borgna, A.; Saeys, M. Density Functional Theory Study of the CO Insertion Mechanism for Fischer−Tropsch Synthesis over Co Catalysts. J. Phys. Chem. C 2009, 113, 8357–8365. [Google Scholar] [CrossRef]
  32. Yu, M.; Liu, L.; Jia, L.; Li, D.; Wang, Q.; Hou, B. Equilibrium morphology evolution of FCC cobalt nanoparticle under CO and hydrogen environments. Appl. Surf. Sci. 2020, 504, 144469. [Google Scholar] [CrossRef]
  33. Keyvanloo, K.; Fisher, M.J.; Hecker, W.C.; Lancee, R.J.; Jacobs, G.; Bartholomew, C.H. Kinetics of deactivation by carbon of a cobalt Fischer–Tropsch catalyst: Effects of CO and H2 partial pressures. J. Catal. 2015, 327, 33–47. [Google Scholar] [CrossRef]
  34. Zijlstra, B.; Broos, R.J.P.; Chen, W.; Oosterbeek, H.; Filot, I.A.W.; Hensen, E.J.M. Coverage Effects in CO Dissociation on Metallic Cobalt Nanoparticles. ACS Catal. 2019, 9, 7365–7372. [Google Scholar] [CrossRef] [Green Version]
  35. Chen, P.-P.; Liu, J.-X.; Li, W.-X. Carbon Monoxide Activation on Cobalt Carbide for Fischer–Tropsch Synthesis from First-Principles Theory. ACS Catal. 2019, 9, 8093–8103. [Google Scholar] [CrossRef]
  36. Petersen, M.A.; van den Berg, J.-A.; Ciobîcă, I.M.; van Helden, P. Revisiting CO Activation on Co Catalysts: Impact of Step and Kink Sites from DFT. ACS Catal. 2017, 7, 1984–1992. [Google Scholar] [CrossRef]
  37. Van Helden, P.; van den Berg, J.-A.; Weststrate, C.J. Hydrogen Adsorption on Co Surfaces: A Density Functional Theory and Temperature Programmed Desorption Study. ACS Catal. 2012, 2, 1097–1107. [Google Scholar] [CrossRef]
  38. Ledesma, C.; Yang, J.; Blekkan, E.A.; Holmen, A.; Chen, D. Carbon Number Dependence of Reaction Mechanism and Kinetics in CO Hydrogenation on a Co-Based Catalyst. ACS Catal. 2016, 6, 6674–6686. [Google Scholar] [CrossRef]
  39. Ledesma, C.; Yang, J.; Chen, D.; Holmen, A. Recent Approaches in Mechanistic and Kinetic Studies of Catalytic Reactions Using SSITKA Technique. ACS Catal. 2014, 4, 4527–4547. [Google Scholar] [CrossRef]
  40. Otarod, M.; Happel, J.; Walter, E. Transient isotopic tracing of methanation kinetics with parallel paths. Appl. Catal. A Gen. 1997, 160, 3–11. [Google Scholar] [CrossRef]
  41. Yang, J.; Qi, Y.; Zhu, J.; Zhu, Y.A.; Chen, D.; Holmen, A. Reaction mechanism of CO activation and methane formation on Co Fischer-Tropsch catalyst: A combined DFT, transient, and steady-state kinetic modeling. J. Catal. 2013, 308, 37–49. [Google Scholar] [CrossRef]
  42. Van Berge, P.J.; van de Loosdrecht, J.; Visagie, J.L. Process for Producing Hydrocarbons with Cobalt Catalysts. Europe Patent EP1299503B1, 15 August 2007. [Google Scholar]
  43. Van de Loosdrecht, J.; Barradas, S.; Caricato, E.A.; Ngwenya, N.G.; Nkwanyana, P.S.; Rawat, M.A.S.; Sigwebela, B.H.; van Berge, P.J.; Visagie, J.L. Calcination of Co-Based Fischer–Tropsch Synthesis Catalysts. Top. Catal. 2003, 26, 121–127. [Google Scholar] [CrossRef]
  44. Borg, Ø.; Dietzel, P.D.C.; Spjelkavik, A.I.; Tveten, E.Z.; Walmsley, J.C.; Diplas, S.; Eri, S.; Holmen, A.; Rytter, E. Fischer–Tropsch synthesis: Cobalt particle size and support effects on intrinsic activity and product distribution. J. Catal. 2008, 259, 161–164. [Google Scholar] [CrossRef]
  45. Carvalho, A.; Ordomsky, V.V.; Marcilio, N.R.; Khodakov, A.Y. Number and intrinsic activity of cobalt surface sites in platinum promoted zeolite catalysts for carbon monoxide hydrogenation. Catal. Sci. Technol. 2020, 10, 2137–2144. [Google Scholar] [CrossRef]
  46. Weststrate, C.J.; Niemantsverdriet, J.W. Understanding FTS selectivity: The crucial role of surface hydrogen. Faraday Discuss. 2017, 197, 101–116. [Google Scholar] [CrossRef] [PubMed]
  47. Ma, W.; Jacobs, G.; Das, T.K.; Masuku, C.M.; Kang, J.; Ramana, V.; Pendyala, R.; Davis, B.H.; Klettlinger, J.L.S.; Yen, C.H. Fischer-Tropsch Synthesis: Kinetics and Water Effect on Methane Formation over 25%Co/γ-Al2O3 Catalyst. Ind. Eng. Chem. Res. 2014, 53, 2157–2166. [Google Scholar] [CrossRef]
  48. Bianchi, D.; Gass, J.L. Hydrogenation of carbonaceous adsorbed species on an iron/alumina catalyst, I. Experiments in isothermal conditions and exploitation by a kinetic model. J. Catal. 1990, 123, 298–309. [Google Scholar] [CrossRef]
  49. Efstathiou, A.M.; Chafik, T.; Bianchi, D.; Bennett, C.O. CO chemisorption and hydrogenation of surface carbon species formed after CO/He reaction on Rh/MgO: A transient kinetic study using FTIR and mass spectroscopy. J. Catal. 1994, 147, 24–37. [Google Scholar] [CrossRef]
  50. Couble, J.; Bianchi, D. Experimental Microkinetic Approach of the Surface Reconstruction of Cobalt Particles in Relationship with the CO/H2 Reaction on a Reduced 10% Co/Al2O3 Catalyst. J. Phys. Chem. C 2013, 117, 14544–14557. [Google Scholar] [CrossRef]
  51. Paredes-Nunez, A.; Lorito, D.; Schuurman, Y.; Guilhaume, N.; Meunier, F.C. Origins of the poisoning effect of chlorine on the CO hydrogenation activity of alumina-supported cobalt monitored by operando FT-IR spectroscopy. J. Catal. 2015, 329, 229–236. [Google Scholar] [CrossRef]
  52. Weststrate, C.J.; van de Loosdrecht, J.; Niemantsverdriet, J.W. Spectroscopic insights into cobalt-catalyzed Fischer-Tropsch synthesis: A review of the carbon monoxide interaction with single crystalline surfaces of cobalt. J. Catal. 2016, 342, 1–16. [Google Scholar] [CrossRef]
  53. Schweicher, J.; Bundhoo, A.; Frennet, A.; Kruse, N.; Daly, H.; Meunier, F.C. DRIFTS/MS studies during chemical transients and SSITKA of the CO/H2 reaction over Co-MgO catalysts. J. Phys. Chem. C 2010, 114, 2248–2255. [Google Scholar] [CrossRef]
  54. Cheng, Q.; Tian, Y.; Lyu, S.; Zhao, N.; Ma, K.; Ding, T.; Jiang, Z.; Wang, L.; Zhang, J.; Zheng, L.; et al. Confined small-sized cobalt catalysts stimulate carbon-chain growth reversely by modifying ASF law of Fischer-Tropsch synthesis. Nat. Commun. 2018, 9, 3250. [Google Scholar] [CrossRef] [PubMed] [Green Version]
  55. Hibbitts, D.; Dybeck, E.; Lawlor, T.; Neurock, M.; Iglesia, E. Preferential activation of CO near hydrocarbon chains during Fischer–Tropsch synthesis on Ru. J. Catal. 2016, 337, 91–101. [Google Scholar] [CrossRef] [Green Version]
  56. Ojeda, M.; Li, A.; Nabar, R.; Nilekar, A.U.; Mavrikakis, M.; Iglesia, E. Kinetically Relevant Steps and H2/D2 Isotope Effects in Fischer−Tropsch Synthesis on Fe and Co Catalysts. J. Phys. Chem. C 2010, 114, 19761–19770. [Google Scholar] [CrossRef] [Green Version]
  57. Ojeda, M.; Nabar, R.; Nilekar, A.U.; Ishikawa, A.; Mavrikakis, M.; Iglesia, E. CO activation pathways and the mechanism of Fischer–Tropsch synthesis. J. Catal. 2010, 272, 287–297. [Google Scholar] [CrossRef]
  58. Vada, S.; Chen, B.; Goodwin, J.G., Jr. Isotopic transient study of La promotion of Co/Al2O3 on CO hydrogenation. J. Catal. 1995, 153, 224–231. [Google Scholar] [CrossRef]
  59. Yang, J.; Frøseth, V.; Chen, D.; Holmen, A. Particle size effect for cobalt Fischer-Tropsch catalysts based on in situ CO chemisorption. Surf. Sci. 2016, 648, 67–73. [Google Scholar] [CrossRef]
  60. Peña, D.; Griboval-Constant, A.; Lancelot, C.; Quijada, M.; Visez, N.; Stéphan, O.; Lecocq, V.; Diehl, F.; Khodakov, A.Y. Molecular structure and localization of carbon species in alumina supported cobalt Fischer-Tropsch catalysts in a slurry reactor. Catal. Today 2014, 228, 65–76. [Google Scholar] [CrossRef]
  61. De Pontes, M.; Yokomizo, G.H.; Bell, A.T. A novel method for analyzing transient response data obtained in isotopic tracer studies of CO hydrogenation. J. Catal. 1987, 104, 147–155. [Google Scholar] [CrossRef]
  62. Van Helden, P.; van den Berg, J.A.; Ciobîcǎ, I.M. Hydrogen-assisted CO dissociation on the Co(211) stepped surface. Catal. Sci. Technol. 2012, 2, 491–494. [Google Scholar] [CrossRef]
  63. Moodley, D.J.; van de Loosdrecht, J.; Saib, A.M.; Niemantsverdriet, J.W. Advances in Fischer-Tropsch Synthesis, Catalysts and Catalysis; Davis, B.H., Occelli, M.L., Speight, J.G., Eds.; CRC Press: Boca Raton, FL, USA, 2010; Chapter 4; pp. 49–81. [Google Scholar]
  64. Sadeqzadeh, M.; Chambrey, S.; Piché, S.; Fongarland, P.; Luck, F.; Curulla-Ferré, D.; Schweich, D.; Bousquet, J.; Khodakov, A.Y. Deactivation of a Co/Al2O3 Fischer–Tropsch catalyst by water-induced sintering in slurry reactor: Modeling and experimental investigations. Catal. Today 2013, 215, 52–59. [Google Scholar] [CrossRef]
  65. Peña, D.; Griboval-Constant, A.; Lecocq, V.; Diehl, F.; Khodakov, A.Y. Influence of operating conditions in a continuously stirred tank reactor on the formation of carbon species on alumina supported cobalt Fischer-Tropsch catalysts. Catal. Today 2013, 215, 43–51. [Google Scholar] [CrossRef]
  66. Costa, C.N.; Christou, S.Y.; Georgiou, G.; Efstathiou, A.M. Mathematical modeling of the oxygen storage capacity phenomenon studied by CO pulse transient experiments over Pd/CeO2 catalyst. J. Catal. 2003, 219, 259–272. [Google Scholar] [CrossRef]
  67. Rebmann, E.; Fongarland, P.; Lecocq, V.; Diehl, F.; Schuurman, Y. Kinetic modeling of transient Fischer-Tropsch experiments over Co/Al2O3 catalysts with different microstructures. Catal. Today 2016, 275, 20–26. [Google Scholar] [CrossRef]
Figure 1. Normalized concentration (Z) transient response curves of (A) Kr, 13CO, and 13CH4 obtained after the Steady State Isotopic Transient Kinetic Analysis (SSITKA) step-gas switch 3 vol% CO/25 vol% H2/Ar (5 h) → 3 vol% 13CO/25 vol% H2/1 vol% Kr/Ar (t), (B) Kr and 13CO obtained after the SSITKA switch with 7 vol% CO in the feed gas composition, and (C) Kr and 13CH4 obtained after the SSITKA switch to x vol%13CO/25 vol% H2/1 vol% Kr/Ar (t) at 230 °C over the 20 wt% Co/γ-Al2O3 catalyst, x = 3 (a), 5 (b), and 7 (c).
Catalysts 10 00583 g001
Figure 2. Transient rates (μmol g−1 s−1) of (A) 12CO-s exchange and (B) 12CHx-s exchange as a function of time estimated after the SSITKA step-gas switch x vol% 12CO/25 vol% H2/Ar (5 h) → x vol% 13CO/25 vol% H2/1 vol% Kr/Ar (t) at 230 °C performed on the 20 wt% Co/γ-Al2O3 catalyst, x = 3 (a), 5 (b) and 7 (c).
Catalysts 10 00583 g002
Figure 3. (A) Mean residence time of CO-s (τCO, s) and active CHxCHx, s), (B) surface coverages of CO-s (θCO) and active CHxCHx), (C) effective rate constant (keff, s−1) of methane formation, and (D) intrinsic kinetic rates of methane formation in terms of TOFITK and TOFchem (s−1) as a function of CO partial pressure (bar) obtained after the SSITKA step-gas switch following 5 h in the CO/H2 reaction over the 20 wt% Co/γ-Al2O3 catalyst.
Catalysts 10 00583 g003
Figure 4. (A) Transient rates of 12CH4 formation due to the isothermal hydrogenation (TIH) of 12C-containing species, and (B) transient rates of 13CH4 formation due to the isothermal hydrogenation of 13C-containing species obtained during the last step of the sequence of step-gas switches conducted at 230 °C: x% 12CO/25% H2/Ar (5 h) → SSITKA (7 min) → Ar (3 min) → 50% H2/Ar (t), TIH, x = 3 (a), 5 (b), and 7 (c).
Catalysts 10 00583 g004
Figure 5. (A) 12CH4-temperature programmed hydrogenation (TPH) traces of 12C-containing species formed after 5 h in CO/H2 reaction at 230 °C over Co/γ-Al2O3 using x% 12CO/25% H2/Ar, x = 3 (a), 5 (b), and 7 (c). (B) Deconvolution of the 12CH4 -TPH trace obtained following the CO/H2 reaction with 3 vol% CO in the feed.
Catalysts 10 00583 g005
Figure 6. (A) DRIFTS spectrum in the CO region recorded in 5 vol% CO/25 vol% H2/Ar (200 °C, 2 h) and its deconvolution. (B) DRIFTS spectra of adsorbed CO recorded in 50 vol% H2/Ar (t) following CO/H2 (2 h) reaction at 200 °C and 3-min Ar purge (t = 0). (C) Deconvolution of the spectrum recorded in Ar (t = 0) before the step-gas switch to 50 vol% H2/Ar (t).
Catalysts 10 00583 g006
Figure 7. DRIFTS spectra of the L1 adsorbed CO-s (A) and L2 adsorbed CO-s (B) formed after 2 h in CO/H2 reaction at 200 °C and recorded after 3-min Ar purge (IR band marked Ar (0 s)) and during the 50 vol% H2/Ar gas treatment (t), following Ar purge. (C) Evolution of integral band intensity with time in 50 vol% H2/Ar gas treatment. (D) Plot of ln[α] vs. time (s) in H2/Ar for the L1 and L2 adsorbed CO-s species.
Catalysts 10 00583 g007
Figure 8. Normalized concentration of Kr (tracer) and CO, and transient rate of CH4 formation (μmol g−1 s−1) obtained during the operando DRIFTS-MS transient isothermal hydrogenation (TIH) conducted at 200 °C over the Co/γ-Al2O3 catalyst.
Catalysts 10 00583 g008
Table 1. Important kinetic parameters obtained after SSITKA following 5 h in CO/H2 reaction at 230 °C over the 20 wt% Co/γ-Al2O3 catalyst with various feed gas compositions (x vol% CO/25 vol% H2/Ar; x = 3, 5, and 7).
CONCOθCONCHxθCHxyCH4, s.s (ppm)TOFchemTOFITKτCHx (s)keffSCH4 (%)
vol%(μmol g−1)(μmol g−1)(× 103, s−1)(× 103, s−1)(× 102, s−1)
310.00.02915.80.04738709.7127.74.820.860
510.80.03228.80.08526907.461.512.08.338.5
716.50.04839.70.11743807.344.216.06.335
Table 2. Amounts (μmol g−1) and surface coverages (θ) of carbonaceous species formed at 230 °C after 5 h in FTS reaction (x%CO/25%H2/Ar), and which are hydrogenated at 230 °C (TIH) and during TPH (240–600 °C).
vol% COΤΙHΤΙH ΤΙHΤΙHΤPHΤPH
N (12CH4) or Cβθ (12CH4)N (13CH4)θ (13CH4)N (12CH4) or Cγθ (12CH4)
(μmol g−1) (μmol g−1) (μmol g−1)
334.30.1027.60.081280.38
527.60.0840.20.122280.67
730.40.0956.30.172520.74

