Abstract
In this paper, the effect of cathode configuration on the performance of a membrane-less microbial fuel cell (MFC) was evaluated using three different arrangements: an activated carbon bed exposed to air (MFCE), a wetland immersed in an activated carbon bed (MFCW) and a cathode connected to an aeration tower featuring a water recirculation device (MFCT). To evaluate the MFC performance, the efficiency of the organic matter removal, the generated voltage, the power density and the internal resistance of the systems were properly assessed. The experimental results showed that while the COD removal efficiency was in all cases over 60% (after 40 days), the MFCT arrangement showed the best performance since the average removal value was 82%, compared to close to 70% for MFCE and MFCW. Statistical analysis of the COD removal efficiency confirmed that the performance of MCFT is substantially better than that of MFCE and MFCW. In regard to the other parameters surveyed, no significant influence of the different cathode arrangements explored could be found.
1. Introduction
Water is at the core of sustainable development and is critical for socio-economic dynamics, ecosystem evolution, energy, food production and human survival. The development of human societies in the 21st century should consider ensuring access to safe water and sanitation services [1]. In this context, several physical and chemical processes have been developed for wastewater treatment; particularly, special attention has been given to the ability of these technology- oriented approaches to remove biologically active pollutants at a reasonable cost [2]. In this regard, conventional treatment of wastewater is characterized by several drawbacks among which, probably the most important, is the high-energy consumption; for example, in activated sludge, most of the total cost is associated with energy consumption [3]. The use of microbial fuel cells (MFCs) to decrease energy consumption in wastewater plants has become relevant in recent years, since this approach relies on a clean, safe, quiet performance, low emissions, and a highly efficient system [4]. The use of MFCs is also attractive because it implies energy recovery from waste, and complements the oxidation of organic contaminants with a concurrent process to generate electricity [5]. The microbial fuel cell is a biological–electrochemical process that uses microorganisms to convert chemical energy from biodegradable substrates to electrical energy via microbial-catalyzed redox reactions [6,7,8]. Traditionally, MFCs consist of two chambers (anodic and cathodic), separated by a proton exchange membrane (PEM) [4,6]. The two-chamber arrangement, however, has some important disadvantages, such as the high cost of PEMs [9], their periodic fouling due to suspended solids [10] and the high internal resistance of the cell. An alternative approach is the use of membrane-less MFCs where the PEM membrane has been eliminated and the anodic and cathodic zones are configured to preserve the working conditions of the electrodes [4,11]. The elimination of the membrane allows a high proton transfer rate, high power density, lower costs and simpler configurations [12].
In this context, microbial fuel cells have been proposed and studied using several synthetic substrates [13] and real wastewater [6,14], different electrode configurations [9,14] and oxygen feeding strategies, such as passive aeration [7] and wetland modified cathodes [15,16,17,18,19], among others. When MFCs are used in wastewater systems, oxygen is employed as the electron acceptor species in the cathode [20,21] therefore, the electro-active surface area and the related O2 reduction kinetics are important to maintain proper MFC performance [22].
Regarding the use of tridimensional carbon anodes in MFCs, some important reports can be found in the literature. In this context, the use of a 3D reticulated carbon vitreous (RVC) electrode has reached power density values of 170 mW/m2 and over 90% of COD removal efficiency [23]. Graphite granules have also been used as a bed anode in a single-chambered continuous system, achieving coulombic efficiencies of 75% and 59% when using as substrates acetate and glucose, respectively [24]. For the specific case of GAC, a 20 L pilot-scale arrangement was designed, constructed and tested, showing that this material is not only capable of effectively supporting biomass growth, but also of reaching 80% of COD removal of domestic wastewater with a hydraulic retention time (HRT) of 20 h, and a loading rate between 0.19 and 0.66 kg/m3/day [25]. Additionally, a report on a GAC bed electrode using multiple inserted graphite rods in an up-flow arrangement showed that with 20 h of HRT, the COD removal could reach values between 47% and 94% in a 4-month period [26].
The use of tridimensional cathodes in an MFC has also been reported, finding that the activated carbon cathode produces a power density of about 676 mW/m2, a value that is higher than that of semi-coke, graphite and carbon felts which in packed bed air electrodes produce 376, 122 and 60 mW/m2, respectively [27]. An MFC-constructed wetland (MFC-CW) using a GAC anode 2.5 cm in depth was also explored for decolorization of azo dye solutions and electricity generation, showing that the color removal can reach 91%, with an associated voltage output of about 610 mV [16]. A similar arrangement of an MFC-CW in a single chamber was designed and used to study the effects of organic loading rates, electrode spacing and circuit connection on the performance of the cell. The experimental results indicate that it is possible to remove 99% of COD (starting with COD of 624 mg/L in synthetic wastewater), 46% of NO3− and 96% of NH4+ using an HRT of one day [28]. A similar arrangement with an MFC-CW using activated carbon, graphite and stainless steel mesh cathodes, showed that the system can be used to monitor COD concentration in wastewater in a 0–500 mg/L range [29], and that the power can be increased from 31 to 165 mW/m2 when the cathode collector is positioned 1.5 cm above the water level [30].
The increasing number of MFC-related reports that test arrangements, explore materials and suggest wastewater treatment technology development directions is due to the fact that these devices can efficiently remove contaminants from aqueous solutions, while generating electric energy in a particularly attractive, environmentally friendly approach. In this scenario, however, there is scarce information on the structural and functional properties of GAC 3D cathodes, and particularly on their influence in the whole performance of an MFC. For this reason, the aim of this work is to study the effect of three GAC cathodic configurations on the performance of a membrane-less passive aeration microbial fuel cell.
2. Results and Discussion
2.1. COD Removal Efficiency
COD removal efficiencies for the three systems under study during the 30 days adaptation period of the corresponding microorganisms, fell between 40% and 95%. After this period, the removal efficiencies remained above 60%, reaching values over 90% in all cases (Figure 1a). The MFCT system (a cathode connected to an aeration tower featuring a water recirculation device) presented the best performance when compared to the other two systems, maintaining removal efficiencies between 65% and 95%. The average removal efficiency for the three cells were 82% for MFCT, 70.6% for the MFCE system (an activated carbon bed exposed to air) and 70% for the MFCW system (a wetland immersed in an activated carbon bed). It is also important to point out that the obtained COD removal efficiency values for the three MFCs under study, fell in the range (between 80% and 90%) of what has been previously reported [4,11,15].
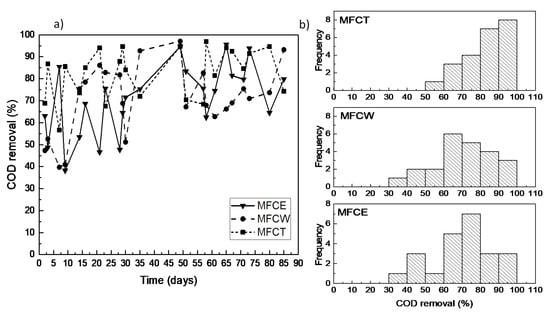
Figure 1.
(a) COD removal in the microbial fuel cells (MFCs); (b) distribution of COD removal.
In an attempt to analyze the stability of the MFCs, as well as to obtain descriptive parameters of the average performance of the electrochemical devices and the effects under study, the frequency of the measured efficiency values of the cells was obtained. A preliminary inspection of Figure 1b shows that the frequency dispersion of the COD removal efficiencies for the MFCT system is characterized by the smallest variation, as well as by the largest frequency, with values above 80%. In contrast, for MFCE and MFCW, the most frequent removal values fell in the 60% to 80% range. To properly analyze the data that could shed light on the effect of the cathode design of the cells on the COD removal efficiency, a statistical analysis was performed using the Kruskal–Wallis and Kolmogorov–Smirnov non-parametric tests. The resulting data show that MFCW and MFCE do not show significant differences between each other, which indicates that the presence of the wetland in the cathodic zone has no statistically relevant effect on the COD removal efficiency. The results for MFCT, on the other hand, reveal that the cathode design, and particularly the forced aeration that characterizes the cell, results in a significant difference, which shows a positive effect on the organic load removal efficiencies (Table 1).

Table 1.
Kruskal–Wallis and Kolmogorov–Smirnov tests for the COD removal efficiencies.
2.2. Electric Parameters
The systems under study showed large variations in voltage generation during the first 90 days of operation (Figure 2a). The observed dispersion ranged between 50 and 900 mV, with the most frequent values falling in the 150 to 400 mV range. As can be seen in Figure 2b, where the frequencies of the generated voltage values are presented, MFCW and MFCT show that the most frequent values of the generated produced voltage are located between 100 and 350 mV. In contrast, MFCE is characterized by substantially lower values in the 0 to 100 mV range. It is also important to point out that voltage generation in MFCs usually reaches maximum values between 300 and 700 mV, depending on the operating conditions, temperature and configuration [6,31]. According to these reports, voltage production in our systems is within the typical range that is expected for a microbial fuel cell.
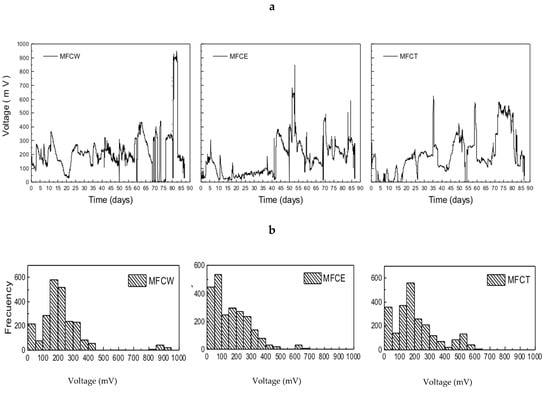
Figure 2.
(a) Voltage in microbial fuel cells, (b) frequency of generated voltages.
2.3. Internal Resistance
As can be seen in Figure 3, internal resistance values for the three MFCs under study fell in the 700 to 1700 Ω range. The highest internal resistance values were observed for MFCW (750−1700 Ω), which can be attributed to the presence of plants and radicular tissue in the cathodic zone. For MFCE and MFCT, on the other hand, similar resistance values for the two cells, ranging from 750 to 1000 Ω, were observed by Song et al., 2013 [19].
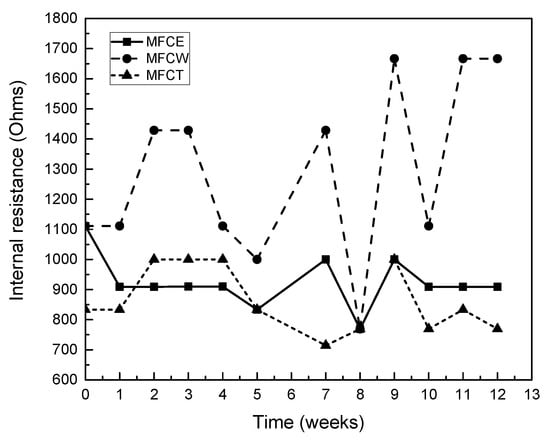
Figure 3.
Internal resistance of the MFCs.
2.4. Power Density
As expected, the evolution in power density for the three systems was incremental during the first 7 weeks (Figure 4a). For MFCW, the power density was about 0.015 W/m3 after 2 weeks of operation, and steadily increased until reaching a value of 0.08 W/m3 in week 9; later, the power decreased until reaching a value of 0.02 W/m3. For MFCT and MFCE, on the other hand, the power values obtained during the first 4 weeks were low (0.005 W/m3 or less) and steadily increased until the maximums of 0.05 W/m3 and 0.095 W/m3 were obtained. The frequencies of the observed values for power density are shown in Figure 4b, where it can be easily noticed that the highest values of power were more frequent for MFCW, followed by MFCT and MFCE.
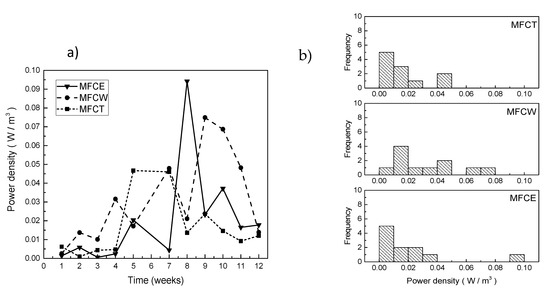
Figure 4.
(a) Power density in the MFC, (b) frequency of generated power.
Power density can also be expressed as power per unit volume of the substrate or per unit of the anode electrode area. In order to determine if there is a relevant difference between the power density values for each of the systems, a statistical analysis using the Kolmogorov–Smirnov and Kruskal–Wallis tests, was carried out for the data presented in Figure 4b. As can be seen in Table 2, all of the obtained values are larger than 0.05, indicating that cathode configuration has no influence on power generation. Consistent with this observation, Cheng and Logan showed that under low substrate concentration conditions, the power of the MFC is usually hindered by the anode and does not reflect cathode performance [32].
Table 2.
Kruskal–Wallis and Kolmogorov–Smirnov tests for the Power densities.
As was previously pointed out, the power density values obtained are based on the configuration of the cell, the substrate, the time of residence and the bio-film structure and dynamics. It is also well known that a pure culture produces a higher power output compared to mixed cultures [20]. In this context, and in order to compare the performance of the MFCs under study with those of other systems, the generated power densities in the MFCs surveyed—based on the surface of the electrodes—were calculated. The values obtained in this work are similar to those reported in the literature, thus showing that the tested configurations are competitive in terms of power density production [19,33].
2.5. Coulombic Efficiency
Coulombic efficiency was also analyzed for the fuel cells under study. As can be seen in Figure 5, while the values obtained during the first 25 days were higher for MFCW (3.5%) and lower for MFCE and MFCT, an increase in the efficiency between 3% and 6%, was observed and maintained for all the systems under study. In this way, the maximum coulombic efficiency for MFCT was 6.49%, and the corresponding values for MFCW and MFCE were 5.95% and 6.1%, respectively. It is interesting to note that these low efficiency values are typical in microbial fuel cells, and are fully explained because not all organic matter can be converted into electrical energy, since an important fraction is used by microorganisms to perform their vital functions [16]. While low coulombic efficiencies indicate that a large part of the organic matter did not contribute to energy generation, low coulombic efficiency values are also due to substrate consumption by mixed microbial consortiums that populate the system [31].
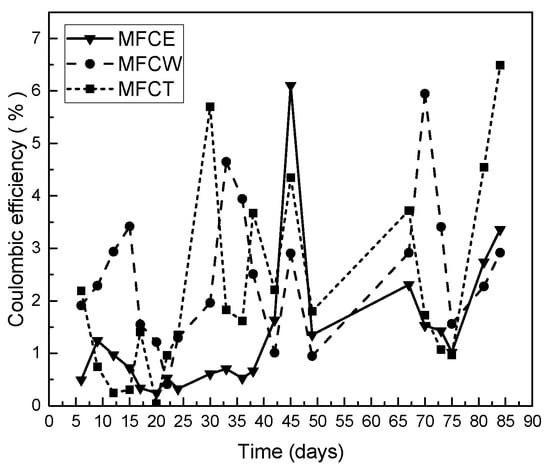
Figure 5.
Coulombic efficiency on the MFC.
3. Materials and Methods
3.1. Microbial Fuel Cell Arrangements
Three MFCs using different cathode configuration arrangements were designed, built and evaluated. In this way, an exposed cathode without a built-in wetland (Figure 6a), and with a built-in wetland (Figure 6b) were studied along an MFC with a cathode immersed in a recirculation tower (Figure 6c). The three anodic zones consisted of an acrylic tube that was 9 cm in diameter and 65 cm in height. The anode material was an activated carbon packed bed (CLARIMEX CAGR 8 X 30) that filled up 25 cm of the acrylic cylinder. This electrode was placed 5 cm over the water influent inlet and electrical connection was made using a copper cylinder (25 cm in height) immersed in a column of activated carbon (AC). Above the carbon anode, there was a tubular section of 25 cm high acrylic tube that connected the anodic and cathodic zones at the top of the MFC device.
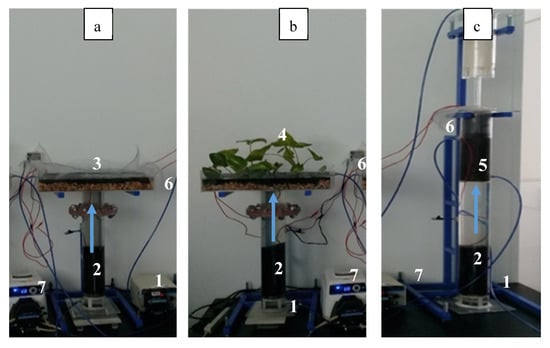
Figure 6.
Experimental arrangement of the 3 up-flow MFCs under study (a) MFCE, (b) MFCW and (c) MFCT. (1) Wastewater influent (2) GAC anodes, (3) GAC cathode, (4) GAC cathode-wetland, (5) GAC cathode with a recirculation tower, (6) treated wastewater effluent, (7) peristaltic pump.
In the exposed cathode fuel cell (MFCE) arrangement, the cathode was built in an acrylic box, 30 cm wide, 50 cm long and 9.5 cm high (Figure 6a). The cathode consisted of 2.5 cm of AC supported on 2 cm of gravel bed, joined to a copper plate for electrical connection. The electrodes (the anode and cathode in the upper and lower parts of Figure 6a) were connected using a plastic-coated copper wire. A resistance of 1 Ohm was placed between the electrodes.
For the Microbial fuel cell with wetland (MFCW) setup (Figure 6b), most of the elements of MFEC were kept, but in this case, the cathodic zone was modified with a constructed wetland based on the Epipremnum aureum species. As can be seen in the corresponding figure, a well-defined density of plants on top of the cathode arrangement was anticipated to affect the performance of the electrode.
In the case of the microbial fuel cell with a recirculation tower (MFCT) arrangement, the water treated in the anode goes through a recirculation tower, where the oxygen in air is transferred to the aqueous phase, thus enhancing oxygen distribution. As can be seen in Figure 6c, this setup consists of a 9 cm diameter column that is 107 cm in height and built in acrylic. As in the previous cases, the anode was mounted using an activated carbon column (25 cm), which was electrically connected to the cathode by means of a copper wire and using an external resistance of 1000 Ω. Water was pumped to the top of the column and then fell due to gravity across a packaging section filled with grooves.
3.2. MFC Inoculation and Feeding
Inoculation of the three MFCs was carried out using anaerobic sludge obtained from a wastewater treatment plant from CIDETEQ. Mud, on the other hand, was collocated by sequentially placing 2 cm of an activated carbon (AC) bed and 20 mL of sludge in the anode column. This process was repeated several times until 24 cm of activated carbon and 240 mL of sludge were obtained.
The feeding of the three MFCs under study was carried out using a 10 mM sodium acetate solution that also contained 0.1 mL/L of the following nutrient solutions: phosphate buffer pH 7.2 (8.5 g KH2PO4, 21.75 g K2HPO4, 33.4 g Na2HPO4·7H2O and 1.7g NH4Cl/L), CaCl2 (27.5 g/L), FeCl3·6H2O (0.25 g/L) and MgSO4·7H2O (22.5 g/L) [34]. This acetate nutrition solution corresponds to an approximate concentration of 600 mg COD/L. A peristaltic pump from Cole-Parmer was used to maintain a retention time of 24 h.
3.3. Chemical Oxygen Demand and Electrical Performance Measurements
COD was measured in the feeding solution and in the effluent of the anodic and cathodic zones (APHA method 5220D). The sample was filtered using a 0.45 μm filter (Whatman) and then digested at 150 °C for 2 h in a Hach digester apparatus. The COD value was then determined by measuring the absorbance of the sample solution at 600 nm using a Hach Spectrometer DR 6000.
The voltage produced by the MFCs under study was determined every 60 min using a data acquisition system connected to a PC, and using an external resistance of 1000 Ω [35]. The polarization curves, on the other hand, were obtained using a Biologic SP-150 potentiostat. With this piece of equipment, linear scanning voltammetry (LSV) experiments with a potential sweep ranging from the open circuit potential to 0 V at 20 mV/s were carried out. From the data obtained, the normalized power and current densities (to the volume of the anode) were calculated.
4. Conclusions
After running the experiments with the MFCs under study, COD removal efficiencies in the three cells were all over 60% and remained between this value and 95%. Statistical analysis of the removal efficiency also showed that while there is a significant difference in the case of MFCT compared to MFCW and MFCE, the difference is not relevant to the two later arrangements. The observed difference between the performance of MFCT and the other two systems surveyed (MFCW and MFCE) could be related to a better oxygenation process produced by the mechanical aeration tower that was coupled to the cathode. The average voltage generated by the systems, on the other hand, was found to fall between 100 and 400 mv, but in the case of MFCT there is a fraction of measurements that is above this value. While the power densities generated by the systems are low (below 0.09 W/m3) and did not show a significant statistical difference, the coulombic efficiency was, on average, maintained between 1% and 6.5%. Despite the fact that there is a difference in the removal efficiency, there is no significant evidence of the difference between the other cell parameters. According to this, the MFCT arrangement shows the best performance among those studied, and reflects that cathode arrangement can in fact influence the overall device performance.
Author Contributions
Conceptualization, C.H.B., F.J.R.-V.; methodology, C.H.B., F.J.R.-V.; software, M.L.J.G.; validation, Z.A.J.; formal analysis, M.L.J.G., C.H.B., F.J.R.-V.; investigation, M.L.J.G.; resources, I.R.; data curation, Z.A.J.; writing—original draft preparation, M.L.J.G., E.Z.P.; writing—review and editing, Z.A.J., V.Á.R.C., I.R., L.A.G., F.J.R.-V.; visualization, L.A.G., V.Á.R.C.; supervision, F.J.R.-V., E.Z.P.; project administration, F.J.R.-V.; funding acquisition, F.J.R.-V. All authors have read and agreed to the published version of the manuscript.
Funding
The authors thank Consejo Nacional de Ciencia y Tecnología (CONACYT) for financial support of this project (attention to the main national problems, 2015-01-1217). MEJG also acknowledges the support of CONACYT in the form of a graduate fellowship.
Conflicts of Interest
The authors declare no conflict of interest.
References
- United Nations. Water Annual Report; UN-Water Technical Advisory Unit: Genève, Switzerland, 2018. [Google Scholar]
- Zamudio-Pérez, E.; Torres, L.G.; Chairez, I. Two-Stage Optimization of Coliforms, Helminth Eggs, and Organic Matter Removals from Municipal Wastewater by Ozonation Based on the Response Surface Method. Ozone Sci. Eng. 2014, 36, 570–581. [Google Scholar] [CrossRef]
- Mizuta, K.; Shimada, M. Benchmarking energy consumption in municipal wastewater treatment plants in Japan. Water Sci. Technol. 2010, 62, 2256–2262. [Google Scholar] [CrossRef] [PubMed]
- Ghangrekar, M.M.; Shinde, V.B. Performance of membrane-less microbial fuel cell treating wastewater and effect of electrode distance and area on electricity production. Bioresour. Technol. 2007, 98, 2879–2885. [Google Scholar] [CrossRef]
- Logan, B.E. Simultaneous wastewater treatment and biological electricity generation. Water Sci. Technol. 2005, 52, 31–37. [Google Scholar] [CrossRef]
- Du, Z.; Li, H.; Gu, T. A state of the art review on microbial fuel cells: A promising technology for wastewater treatment and bioenergy. Biotechnol. Adv. 2007, 25, 464–482. [Google Scholar] [CrossRef]
- Logan, B.E.; Hamelers, B.; Rozendal, R.; Schröder, U.; Keller, J.; Freguia, S.; Aelterman, P.; Verstraete, W.; Rabaey, K. Microbial fuel cells: Methodology and technology. Environ. Sci. Technol. 2006, 40, 5181–5192. [Google Scholar] [CrossRef]
- Oh, S.E.; Logan, B.E. Proton exchange membrane and electrode surface areas as factors that affect power generation in microbial fuel cells. Appl. Microbiol. Biotechnol. 2006, 70, 162–169. [Google Scholar] [CrossRef] [PubMed]
- Liu, H.; Logan, B.E. Electricity Generation Using an Air-Cathode Single Chamber Microbial Fuel Cell in the Presence and Absence of a Proton Exchange Membrane. Environ. Sci. Technol. 2004, 38, 4040–4046. [Google Scholar] [CrossRef]
- Flimban, S.G.A.; Hassan, S.H.A.; Rahman, M.M.; Oh, S.E. The effect of Nafion membrane fouling on the power generation of a microbial fuel cell. Int. J. Hydrog. Energy 2018. [Google Scholar] [CrossRef]
- Jang, J.K.; Pham, T.H.; Chang, I.S.; Kang, K.H.; Moon, H.; Cho, K.S.; Kim, B.H. Construction and operation of a novel mediator- and membrane-less microbial fuel cell. Process. Biochem. 2004, 39, 1007–1012. [Google Scholar] [CrossRef]
- Li, W.; Sheng, G.; Liu, X.; Yu, H. Recent advances in the separators for microbial ful cells. Bioresour. Technol. 2011, 102, 244–252. [Google Scholar] [CrossRef] [PubMed]
- Thung, W.E.; Ong, S.A.; Ho, L.N.; Wong, Y.S.; Oon, Y.L.; Oon, Y.S.; Lehl, H.K. Simultaneous wastewater treatment and power generation with innovative design of an upflow membrane-less microbial fuel cell. Water Air Soil Pollut. 2015, 226. [Google Scholar] [CrossRef]
- Tremouli, A.; Martinos, M.; Bebelis, S.; Lyberatos, G. Performance assessment of a four-air cathode single-chamber microbial fuel cell under conditions of synthetic and municipal wastewater treatments. J. Appl. Electrochem. 2016, 46, 515–525. [Google Scholar] [CrossRef]
- Liu, S.; Song, H.; Li, X.; Yang, F. Power generation enhancement by utilizing plant photosynthate in microbial fuel cell coupled constructed wetland system. Int. J. Photoenergy 2013, 2013, 172012. [Google Scholar] [CrossRef]
- Fang, Z.; Song, H.L.; Cang, N.; Li, X.N. Performance of microbial fuel cell coupled constructed wetland system for decolorization of azo dye and bioelectricity generation. Bioresour. Technol. 2013, 144, 165–171. [Google Scholar] [CrossRef]
- Corbella, C.; Puigagut, J. Improving domestic wastewater treatment efficiency with constructed wetland microbial fuel cells: Influence of anode material and external resistance. Sci. Total Environ. 2018, 631, 1406–1414. [Google Scholar] [CrossRef] [PubMed]
- Doherty, L.; Zhao, X.; Zhao, Y.; Wang, W. The effects of electrode spacing and flow direction on the performance of microbial fuel cell-constructed wetland. Ecol. Eng. 2015, 79, 8–14. [Google Scholar] [CrossRef]
- Song, H.; Zhang, S.; Long, X.; Yang, X.; Li, H.; Xiang, W. Optimization of bioelectricity generation in constructed wetland-coupled microbial fuel cell systems. Water 2017, 9, 185. [Google Scholar] [CrossRef]
- Jung, S.P.; Pandit, S. Important Factors Influencing Microbial Fuel Cell Performance. In Microbial Electrochemical Technology; Venkata, S.M., Pandey, A., Varjani, S., Eds.; Elsevier: Amsterdam, The Netherlands, 2019; pp. 377–406. [Google Scholar] [CrossRef]
- Zhu, F.; Wang, W.; Zhang, X.; Tao, G. Electricity generation in a membrane-less microbial fuel cell with down-flow feeding onto the cathode. Bioresour. Technol. 2011, 102, 7324–7328. [Google Scholar] [CrossRef] [PubMed]
- Rahimnejad, M.; Adhami, A.; Darvari, S.; Zirepour, A.; Oh, S. Microbial fuel cell as new technology for bioelectricity generation: A review. Alexandria Eng. J. 2015, 54, 745–756. [Google Scholar] [CrossRef]
- He, Z.; Minteer, S.; Angenent, L. Electricity generation from artificial wastewater using upflow microbial fuel cell. Environ. Sci. Technol. 2005, 39, 5262–5267. [Google Scholar] [CrossRef] [PubMed]
- Rabaey, K.; Clauwaert, P.; Aelterman, P.; Verstraete, W. Tubular microbial fuel cells for efficient electricity generation. Environ. Sci. Technol. 2005, 39, 8077–8082. [Google Scholar] [CrossRef]
- Jiang, D.; Curtis, M.; Troop, E.; Scheible, K.; McGrath, J.; Hu, B.; Suib, S.; Raymond, D.; Li, B. A pilot-scale study on utilizing multi-anode/cathode microbial fuel cells (MAC MFCs) to enhance the power production in wastewater treatment. Int. J. Hydrog. Energ. 2011, 36, 876–884. [Google Scholar] [CrossRef]
- Li, B.; Scheible, K.; Curtis, M. Electricity Generation from Anaerobic Wastewater Treatment in Microbial Fuel Cells; Water Environment Research Foundation, New York State Energy Research and Development Authorithy (NYSERDA): Alexandria, VA, USA, 2011. [Google Scholar]
- Zhang, X.; Shi, J.; Liang, P.; Wei, J.; Huang, X.; Zhang, C. Power generation by packed-bed air-cathode microbial fuel cells. Bioresour. Technol. 2013, 142, 109–114. [Google Scholar] [CrossRef] [PubMed]
- Oon, Y.L.; Ong, S.; Ho, L.; Wong, Y.; Dahalan, F.; Oon, Y.S.; Lehl, H.; Thung, W. Synergistic effect of up-flow constructed wetland and microbial fuel cell for simultaneous wastewater treatment and energy recovery. Bioresour. Technol. 2016, 203, 190–197. [Google Scholar] [CrossRef] [PubMed]
- Xu, L.; Zhao, Y.; Fan, C.; Fan, Z.; Zhao, F. Fisrt study to explore the feasibility of applying microbial fuel cells into constructed wetland for COD monitoring. Bioresour. Technol. 2017, 243, 846–854. [Google Scholar] [CrossRef]
- Yang, Y.; Zhao, Y.; Tang, C.; Mao, Y.; Shen, C. Significance of water level in affecting cathode potential in electro-wetland. Bioresour. Technol. 2019, 285, 121345. [Google Scholar] [CrossRef]
- Liu, H.; Cheng, S.; Logan, B.E. Production of electricity from acetate or butyrate using a single-chamber microbial fuel cell. Environ. Sci. Technol. 2005, 39, 658–662. [Google Scholar] [CrossRef]
- Cheng, S.; Logan, B.E. Increasing power generation for scaling up single-chamber air cathode microbial fuel cells. Bioresour. Technol. 2011, 102, 4468–4473. [Google Scholar] [CrossRef]
- Srivastava, P.; Yadav, A.K.; Garaniya, V.; Abbassi, R. Constructed Wetland Coupled Microbial Fuel Cell Technology: Development and Potential Applications. In Microbial Electrochemical Technology; Venkata, S.M., Varjani, S., Pandey, A., Eds.; Elsevier: Amsterdam, The Netherlands, 2019; pp. 1021–1036. [Google Scholar] [CrossRef]
- APHA. APHA Standard Methods for the Examination of Water and Waste Water, 22nd ed.; APHA: Washington, DC, USA, 2012. [Google Scholar]
- Catalina, G.N.; Godínez, L.A.; Chávez, A.U.; Cercado, B.; Arriaga, L.G.; Rodríguez-Valadez, F.J. Study of different carbon materials for their use as bioanodes in microbial fuel cells. Water Sci. Technol. 2016, 73, 2849–2857. [Google Scholar] [CrossRef][Green Version]


© 2020 by the authors. Licensee MDPI, Basel, Switzerland. This article is an open access article distributed under the terms and conditions of the Creative Commons Attribution (CC BY) license (http://creativecommons.org/licenses/by/4.0/).