Abstract
The electrooxidation kinetics of ethanol is key to making direct ethanol fuel cells and electrocatalytically reforming ethanol viable technologies for a more sustainable energy conversion. In this study, the electrooxidation of ethanol was investigated on nickel hydroxide (Ni(OH)2) catalysts synthesized using a facile solvothermal method. Variations in the temperature, heating time, and the addition of oleylamine in the precursor enabled the phase and morphology control of the catalysts. X-ray diffraction and scanning electron microscopy show that the addition of oleylamine in the precursor resulted in microspheres with a high surface area, but favored the formation of β-phase Ni(OH)2. Elevated temperatures or prolonged periods of heating in a controlled environment, on the other hand, can lead to the formation of the ethanol oxidation reaction-active α-phase. Among the synthesized catalysts, the α-Ni(OH)2 microspheres with nanoflakes achieved the highest activity for ethanol oxidation with a current density of 24.4 mA cm−2 at 1.55 V (vs. RHE, reversible hydrogen electrode) in cyclic voltammetry tests and stable at 40 mA cm−2 in chronoamperometric tests at the same potential, comparatively higher than other Ni-based catalysts found in the literature. While the overpotential is beyond the useful range for direct ethanol fuel cells, it may be useful for understanding the mechanism of ethanol oxidation reactions on transition metal hydroxides at their oxidizing potential for ethanol electroreforming.
1. Introduction
The need to reduce greenhouse gas emissions has driven the development of technologies for clean energy conversion. One of these technologies are fuel cells, devices that convert hydrogen and oxygen to electricity directly. As the most abundant chemical element in the universe, hydrogen is considered as a key energy carrier for the future and can be produced using various methods. Much of the industrial hydrogen production currently comes from the steam reforming of natural gas [1]. Water electrolysis has also gained more attention in recent years for allowing the clean and direct production of pure hydrogen with relatively high efficiency (>70%) [2].
Other types of fuels for fuel cell applications have also been explored—for instance, ethanol has been of interest in recent years due to its high energy density of ~8 kWh kg−1, which makes it an alternative energy carrier to hydrogen [3]. Existing supply chain infrastructure for ethanol is already in place and large quantities may be produced from the agricultural industry due to the high demand for bioethanol compliance [3,4,5]. Ethanol is either directly fed to fuel cells, such as the case of direct ethanol fuel cells (DEFCs), or electroreformed to produce hydrogen. However, the performance of DEFCs (0.1 W cm−2) is still an order of magnitude lower than fuel cells fed with hydrogen (1 W cm−2) due to the sluggish kinetics of ethanol oxidation reaction (EOR) in the anode [6]. EOR may also be applied in the electroreforming of aqueous ethanol to produce pure hydrogen at much lower overpotentials (0.8–0.9 V (vs. SHE, standard hydrogen electrode) at 100 mA cm−2) than water electrolysis, reducing the required energy by half [6]. However, EOR also suffers from sluggish kinetics due to the difficulty of breaking the C–C bond, which results in the high overpotentials and partial oxidation that produce acetaldehyde and acetic acid, yielding two and four electrons, respectively:
instead of the 12-electron pathway to CO2 from ethanol’s full oxidation [7,8,9,10]:
C2H5OH → CH3CHO + 2H+ + 2e−; E° = 0.247 V
C2H5OH + H2O → CH3COOH + 4H+ + 4e−; E° = 0.054 V
C2H5OH + 3H2O → CO2 + 12H+ + 12e−; E° = 0.089 V
Thus, ethanol’s potential as an energy carrier can only be realized through the development of a suitable electrocatalyst.
Pt and Pt-based alloys are widely used electrocatalyst materials with high catalytic activity for EOR in acidic media [4,11]. However, Pt is expensive and degrades over time due to the self-poisoning effect of adsorbed CO or other carbonated species on the catalyst surface, resulting in blocked active sites [12]. To address these issues, numerous non-Pt based catalysts such as Pd [13,14,15,16,17], Au [17,18], W [19], and Ir [20] are being explored to improve the electrocatalytic activity of EOR in alkaline media.
Ni-based electrodes have been used in electrochemical applications because of their excellent electrochemical properties and their low cost [21,22]. Ni-based catalysts have also shown less poisoning effects compared to Pt [23]. Ni electrodeposited on glassy carbon electrodes, which formed an oxide film, has been previously studied for glucose [24] and methanol [25] electrocatalytic oxidation in alkaline media and has shown activity indicating its potential as an active electrocatalyst for the oxidation of small organic molecules. Polycrystalline Ni foam [26] and Ni nanotube catalysts [27] have been reported to achieve a current density of 16.3 and 19.2 mA cm−2 for EOR, respectively. In the past, it has been suggested that EOR activity catalyzed by Ni is dependent on the Ni(OH)2/NiOOH redox pair, wherein the Ni(OH)2 is first oxidized to NiOOH and then oxidizes ethanol. NiOOH is reduced back to Ni(OH)2 to repeat the cycle, resulting in an autocatalytic cycle [26,27,28,29]. Therefore, EOR on Ni occurs at overpotentials much higher than those reported for Pd or Pt.
Ni(OH)2 is known to exist in two polymorphs—α- and β-phases [30]. β-Ni(OH)2 consists of a brucite-like structure (similar to Mg(OH)2), whereas α-Ni(OH)2 are layers of β-Ni(OH)2 intercalated with water or anions that incorporate more structural disorder, which often translates to better electrochemical activity [30,31,32]. In this work, a nanostructured Ni(OH)2 electrode catalyst synthesized using a hydrothermal procedure is used as a catalyst for EOR in alkaline conditions. Oleylamine is added to act as the surfactant, co-solvent, stabilizer, and reducing agent [22,33]. The effects of varying the synthesis parameters—temperature, duration, and amount of oleylamine—on the structure and morphology of the catalyst are observed. The EOR activity and stability are then analyzed.
2. Results
Our group successfully synthesized α- and β-Ni(OH)2 by using a modified surfactant-assisted solvothermal procedure found in the literature [31], in which we varied the synthesis parameters such as the temperature and duration of heating, as well as the amount of surfactant used. The synthesis procedure is discussed in the Materials and Methods section. In this work, oleylamine was used as the surface-active and reducing agent in the one-pot synthesis procedure.
Experimental XRD patterns (Figure 1a) are found to be consistent with the typical diffraction peaks for α- (ICDD PDF4 + 00-022-0752) [31] and β-phases (ICDD 00-014-0117) [34]. On the other hand, SEM images (Figure 1b) show variations in the surface morphology.
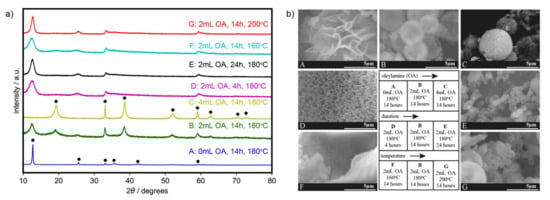
Figure 1.
(a) X-ray diffraction patterns (α: ●; β: ◆; phases of Ni(OH)2) and (b) scanning electron microscopy (SEM) images of the synthesized catalysts.
We investigated the effect of adding oleylamine by varying the added amount from 0 to 4 mL (samples A–C), heated for 14 h at 180 °C. In the absence of oleylamine, 3D flowerlike α-Ni(OH)2 nanoflakes (sample A, Figure 1) were formed. Adding 2 mL of oleylamine, on the other hand, formed microspheres with nanoflakes (sample B, Figure 1). The β-phase was formed together with the α-phase, as depicted by the presence of peaks from both structures in the diffraction patterns. Such crystallography likely includes the known interstratification of the α/β phase [30], wherein the two phases can exist in the same crystal, rather than just a mixture of crystal phases. A further increase in oleylamine to 4 mL retains the 3D morphology, but peaks in the XRD pattern show selectivity towards the β-phase (sample C, Figure 1). Upon the addition of oleylamine, the intercalated species in between the layers of Ni(OH)2 are possibly kept out, hence favoring the formation of the β phase. An increase in the amount of added oleylamine results to less intercalation and to a more ordered structure.
The effect of the duration of the solvothermal synthesis was then investigated by varying the heating time from 4 to 24 h with 2 mL oleylamine at 180 °C (samples D, B, and E). Similarly, the effect of the synthesis temperature was also investigated by varying the heating temperature from 160 to 200 °C in the presence of 2 mL oleylamine and heated for 14 h (samples F, B, and G). It was found that, at a shorter duration of 4 h (sample D) and a lower temperature of 160 °C (sample F), the microspheres do not form and only nanoflakes are present. Extending the duration (sample E) and elevating the temperature (sample G) resulted in smaller microspheres, instead of particle growth and agglomeration, probably because of the surface stabilizing properties of oleylamine [33]. Longer heating times and higher temperatures, however, favor the formation of the α-phase even in the presence of oleylamine as seen in the XRD patterns.
Table 1 summarizes the variations in morphologies due to the modification of the synthesis parameters. Nanoflake thickness and microsphere diameter are also measured and are shown in Figures S1 and S2. When comparing samples with only α-Ni(OH)2 (samples A, E, and G), the XRD peaks for the α-phase in samples E and G were broader than that of sample A, implying smaller crystallite sizes or crystal lattice strains. We were not able to determine the specific species intercalated in between the layers of Ni(OH)2, but they possibly affected the lattice strain [34].

Table 1.
Summary of morphologies of fabricated Ni(OH)2 samples.
The Ni(OH)2 catalysts produced using the reported oleylamine-assisted solvothermal synthesis method were then tested for ethanol electrooxidation in alkaline electrolyte. The Ni(OH)2 catalysts deposited on the glassy carbon electrode were cycled from 1.18 V to 1.63 V for 100 times. Cyclic voltammograms and chronoamperometric data after 100 cycles are reported to consider the increase in activity and stabilization from the first to the 100th cycle (Figure S3, Supplementary Materials). In alkaline conditions, α- and β-Ni(OH)2 easily oxidizes to γ-NiOOH and β-NiOOH, respectively [27]. Thus, the activity enhancement upon cycling may be ascribed to the formation of γ- or β-NiOOH.
Figure 2 shows the comparison between the activity in the presence and absence of ethanol for a representative α-Ni(OH)2 catalyst (sample G), where we confirm that the activity was due to ethanol oxidation. In the absence of ethanol, the initial onset of activity around 1.37 V may be attributed to the oxidation of α-Ni(OH)2 to γ-NiOOH, which then reaches its first peak at 1.42 V. The current then momentarily drops as the α-Ni(OH)2 sites are consumed and become γ-NiOOH. As the potential is increased further, the oxygen evolution reaction (OER) activity starts to set in. In the reverse scan, the peak for the reduction of γ-NiOOH back to α-Ni(OH)2 can be seen at 1.31 V. In the presence of ethanol, the same onset for the oxidation of α-Ni(OH)2 to γ-NiOOH can be seen. However, it is immediately followed by the onset of EOR at around 1.38 V and then continues to increase until it peaks around 1.55 V, after which the current begins to drop as the reaction becomes limited by the diffusion of ethanol to the active sites, which slows down because of the formation of intermediate products near the surface of the electrode or other possible poisoning species.
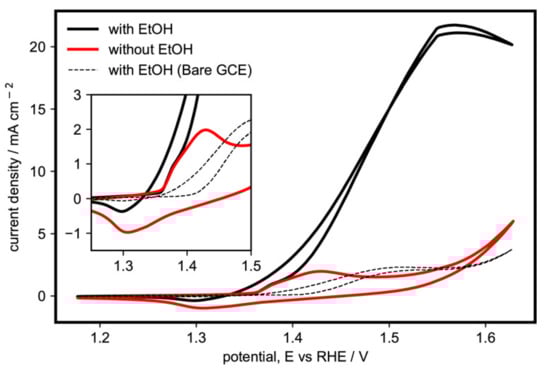
Figure 2.
Cyclic voltammogram of α-Ni(OH)2 microspheres with nanoflakes (sample G) in the presence and absence of 1 M ethanol in 1 M KOH (potassium hydroxide) at 20 mV s−1. Inset: Ni(OH)2/NiOOH redox region.
The electrocatalytic activity of Ni-based electrodes in alkaline media has been suggested to depend on the Ni(OH)2/NiOOH redox pair (Equation (1)) [28]:
Ni(OH)2 + OH– ⇌ NiOOH + H2O + e−
This mechanism between ethanol and Ni(OH)2/NiOOH has also been discussed in other studies investigating alkaline EOR on Ni-based electrodes [26,27,29]. It is an autocatalytic mechanism, wherein Ni(OH)2 is first electrochemically oxidized to NiOOH. The latter then chemically oxidizes ethanol, while simultaneously being chemically reduced back to Ni(OH)2, thus completing a cycle. As seen in the inset of Figure 2, the redox peak on the reverse scan is significantly lower than that without ethanol, since the γ-NiOOH has already been chemically reduced back to α-Ni(OH)2 in the oxidation of ethanol, in accordance with the aforementioned autocatalytic mechanism. A similar voltammogram for the β-Ni(OH)2 (sample C) is shown in Figure S4 (Supplementary Materials), showing a similar initial peak corresponding to its oxidation to β-NiOOH but with lower current density for ethanol oxidation. From these results, we conclude that α-Ni(OH)2 is the more active phase of Ni(OH)2 for ethanol oxidation.
To confirm that this activity is primarily due to EOR and not because of OER, we verified the onset of OER by extending the potential window scan. Figure S5 shows that a later onset in activity at about 1.6 V corresponds to OER. It is important to note that the analysis of products and intermediates is needed to further confirm the selectivity of the reaction at higher potentials since the activity is influenced by both EOR and OER, as confirmed by the voltammogram in the absence of ethanol.
The voltammograms of samples A to G are shown together for comparison in Figure 3. The samples containing the β-phase, pure or with the α-phase, are shown as broken lines (samples B–D and F). Those with only pure α-phase are depicted as solid lines (samples A, E, and G). The pure β-Ni(OH)2, sample C, was the least active of all. On the other hand, samples with both α- and β-Ni(OH)2 (samples B, D and F) showed significantly higher activity compared to sample C, but still lower than the catalysts with a pure α-phase. The trend in EOR activities shows that α-Ni(OH)2 is more catalytically active than β-Ni(OH)2, in agreement with the literature [30,31,32].
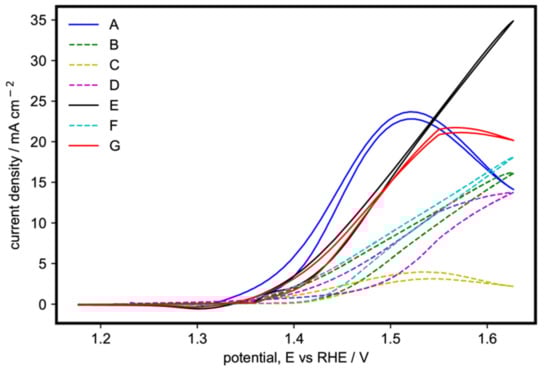
Figure 3.
Cyclic voltammogram of the 100th cycle of the Ni(OH)2 catalysts with varying synthesis parameters on 1 M ethanol and 1 M KOH at 20 mV s−1.
Sample A, containing the α-Ni(OH)2 nanoflakes arranged in a 3D flower-like morphology, had the lowest onset potential. Its current density quickly increased as the potential was increased until it reached a peak at 23.7 mA cm−2 at around 1.52 V. Samples E and G, containing the α-Ni(OH)2 with both microspheres and nanoflakes, had higher onset potentials compared to sample A but showed higher current densities compared to the catalysts that contained the β-phase. Sample G peaked at 1.55 V with 21.5 mA cm−2 then decreased after suggesting that it had become diffusion-limited. On the other hand, sample E reached 24.4 mA cm−2 at 1.55 V and continued to increase as the potential was scanned to more positive values, and probably becomes diffusion-limited at a higher potential. The smaller microspheres of sample E (Table S1 and Figure S2, Supplementary Materials) translate to a higher surface area, enabling the more efficient diffusion of ethanol molecules from the bulk solution to the electrode surface.
To the best of our knowledge, this is the first time a Ni(OH)2 catalyst prepared using this method was tested for ethanol oxidation. For a better comparison of the EOR performance of the catalysts, we tabulated the current densities of the samples at 1.55 V to avoid the onset of OER. We also compared our results with catalyst performances reported for ethanol oxidation found in the literature, as listed in Table 2 [26,27]. The resulting activity of samples A and E were superior to other nickel-based catalysts. However, as discussed, ethanol oxidation on nickel-based catalysts is dependent on the Ni(OH)2/NiOOH redox pair. Therefore, the activity occurs at higher overpotentials, since EOR only starts after Ni(OH)2 is first oxidized to NiOOH, which is then followed by the autocatalytic mechanism. Other groups used palladium and nickel alloys to lower the potentials and to generate high activity [35,36].
Table 2.
Reported current densities from cyclic voltammograms of alkaline ethanol electrooxidation on various catalysts in the literature.
To test the stability, chronoamperometry with a constant applied potential of 1.55 V (vs. RHE) for 30 min was also performed on four representative samples of Ni(OH)2 (samples A, B, E, and F). All samples were found to be stable after the 30-min test (Figure 4). In agreement with the cyclic voltammetry data, sample E, containing the α-Ni(OH)2 microspheres with nanoflakes, showed superior activity (40 mA cm−2), followed by sample A, containing the α-Ni(OH)2 nanoflakes arranged in a 3D flowerlike structure (24.5 mA cm−2). The stability observed in Figure 4 is consistent with previous works where the conversion between α-Ni(OH)2 and γ-NiOOH can be realized without mechanical deformation and material swelling of the catalyst [31,37].
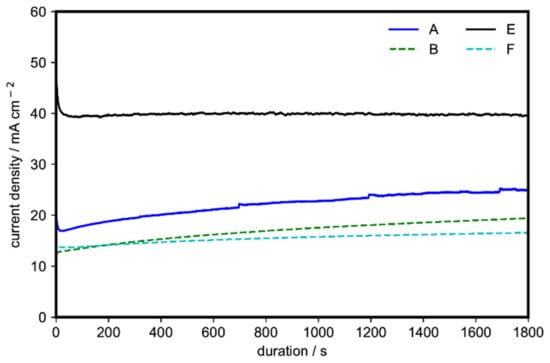
Figure 4.
Chronoamperometry at a constant applied potential of 1.55 V (vs. RHE) of four representative morphologies of Ni(OH)2 for 30 min on 1 M ethanol and 1 M KOH.
Though the results showed great stability over the chronoamperometric tests and extensive cycling, the overpotential considered here is beyond the useful range for DEFCs because of the proposed dependence on the autocatalytic mechanism via the Ni(OH)2/NiOOH redox pair [28]. The catalytic activity of Ni-based catalysts only takes effect once the Ni(OH)2 is oxidized first to NiOOH, which causes the active potential region to be at more positive potentials compared to other catalysts. These results, however, are still useful for understanding the mechanism of EOR on Ni(OH)2 at elevated potentials for ethanol electroreforming, since the potential range is still below that of OER. Additionally, it would also be advantageous if this mechanism could be utilized in other transition metal hydroxides that have a similar M(OH)2/MOOH (M = metal, e.g. Fe) redox pair at lower potentials.
3. Materials and Methods
3.1. Chemicals and Materials
Nickel nitrate hexahydrate (Ni(NO3)2·6H2O, ≥ 98.5%), oleylamine (C18H37N, technical grade, 70%), ethanol (98%), cyclohexane (99.5%), isopropyl alcohol (99%) and Nafion 117 solution (5 wt%) were all purchased from Sigma-Aldrich (Singapore). All the chemicals were used without further purification. Deionized water was used in all experiments.
3.2. Synthesis of Ni(OH)2 Catalysts
In a modification of a previously developed procedure [31], 1 mmol (291 mg) of nickel nitrate was mixed with 20 mL of ethanol. Varied amounts of oleylamine and 10mL of ethanol were quickly added after 5 min followed by 30 min more of continuous stirring. The resulting homogenous solution was then transferred into a 50-mL Teflon-lined autoclave that was maintained at a temperature of 160, 180, or 200 °C for a duration of 4, 14, or 24 h before cooling down to room temperature. The final product was thoroughly washed with cyclohexane, ethanol, then deionized water to remove organics, ions, and possible remnants. It was then dried in a vacuum oven at 60 °C for 6 h.
3.3. Characterization
X-ray diffraction (XRD) was used to determine the crystal phase and crystallinity of the samples. The samples were scanned from ϴ = 10° to 80° using a Rigaku Miniflex Desktop XRD with Cu Kα radiation (λ = 1.5418 Å) at a scan rate of 5° min−1 with an accelerating voltage of 40 kV and an applied current of 40 mA. Scanning electron microscopy (SEM) was used to identify the morphology of the samples. The catalyst powder samples were first transferred to carbon tape and were then sputtered with platinum to increase the electron conductivity for SEM imaging. SEM imaging was performed using a Hitachi S-3400N scanning electron microscope with an accelerating voltage of 20 kV for 2k, 10k, and 30k magnification.
3.4. Electrochemical Measurements
All electrochemical tests were performed using a three-electrode setup at room temperature using a glassy carbon electrode (GCE) with a 3-mm diameter (0.071 cm2 geometric area) as the working electrode, connected to a potentiostat (Autolab PGSTAT302N, Metrohm, Switzerland). Before each test, the glassy carbon electrode was first polished with alumina, then washed thoroughly with deionized water. Pt wire was used as a counter electrode and an Ag/AgCl electrode (M KCl, Metrohm, Switzerland) was used as the reference electrode.
To prepare a homogeneous catalyst ink, the dispersion of 5mg of catalyst powder in 750 µL of deionized water, 250 µL of isopropyl alcohol, and 45 µl of Nafion 117 were ultrasonicated for 1 h. In total, 8 μL of this catalyst ink was drop-casted to the glassy carbon electrode, leading to a catalyst loading of ~0.5 mg cm−2. The catalyst film was then air-dried at room temperature. A bare GCE was also tested to provide a comparison for the absence of the catalyst.
The electrolyte solutions were 1 M KOH with and without 1 M ethanol. All solutions were purged with N2 for 30 min before testing to remove dissolved O2 in the electrolyte solution.
The potentials reported in this work were referenced to the reversible hydrogen electrode. RHE conversion was done to consider the effect of pH in the cell potential, where E(Ag/AgCl) is the working potential, pH = 14 and E°(Ag/AgCl) = 0.210 V, which gives:
E(RHE) = E(Ag/AgCl) + 1.036 V
The cyclic voltammograms were obtained by sweeping the potentials from 1.18–1.63 V (0.15 to 0.6 V vs. Ag/AgCl) with a scan rate of 20 mV/s at room temperature. For stability evaluations, the electrodes were also cycled 100 times before chronoamperometry data were collected for 30 min at 1.55 V (0.52 V vs. Ag/AgCl). All tests were conducted at room temperature.
4. Conclusions
In conclusion, phase- and morphology-controllable Ni(OH)2 catalysts were prepared by a solvothermal method through variations in the temperature, the period of heating, and the addition of oleylamine. We were able to prevent the agglomeration of Ni(OH)2 particles through the addition of oleylamine, which resulted in smaller microspheres. Increasing the temperature and/or increasing the duration of the solvothermal synthesis procedure favored the crystal structure from the β- to the α-phase, obtaining the more active polymorph phase.
Notably, sample E, containing the α-Ni(OH)2 microspheres with nanosheets, achieved the highest current density for ethanol oxidation in cyclic voltammetry and chronoamperometry tests among the catalysts produced in this study and among other nickel-based catalysts tested for ethanol oxidation that we found in the literature. For all samples, the chronoamperometric tests showed excellent stability. The performance of the different structures and morphologies towards OER are ranked as follows: α-Ni(OH)2-microspheres with nanosheets > 3D flowerlike α-Ni(OH)2 nanoflakes > α/β-Ni(OH)2 microspheres with nanoflakes > α/β-Ni(OH)2 nanoflakes > β-Ni(OH)2 microspheres with nanoflakes.
To give further insights into the catalytic mechanism and performance of the Ni(OH)2 developed, the determination of products of ethanol oxidation using more sophisticated characterization techniques, and in situ investigations of intermediates on the electrolyte/electrode interface are suggested. These will also elucidate the selectivity of the reaction.
Supplementary Materials
The following are available online at https://www.mdpi.com/2073-4344/10/7/740/s1, Table S1: Peak analysis of X-ray diffraction data, Figure S1: Nanoflake thickness measurement example (sample B), Figure S2: Microsphere diameter measurement example (sample F), Table S1: Peak analysis of X-ray diffraction data, Figure S3: Cyclic voltammograms of the 1st and 100th cycle of the different morphologies of Ni(OH)2 catalysts deposited on a glassy carbon electrode with a loading of ~0.5 mg cm−2 in a solution of 1 M KOH with 1 M ethanol with a scan rate of 20 mV s−1, Figure S4: Cyclic voltammogram of β-Ni(OH)2 microspheres with nanoflakes (sample C) in the presence and absence of 1 M ethanol in 1 M KOH at 20 mV s−1, Figure S5: Extended cyclic voltammogram of α-Ni(OH)2 microspheres with nanoflakes (sample E) deposited on a glassy carbon electrode with a loading of ~0.5 mg cm−2 in a solution of 1 M KOH with and without 1 M ethanol with a scan rate of 20 mV s−1.
Author Contributions
Conceptualization, catalyst preparation, reaction experiments and writing—original draft preparation, J.J.B.L. and J.D.O.; characterization of catalysts, J.J.B.L. and J.A.D.d.R.; supervision, methodology, further data analysis and writing—review and editing, J.D.O. and J.A.D.d.R. All authors have read and agreed to the published version of the manuscript.
Funding
This research was funded through a research grant by the Engineering Research and Development for Technology (ERDT) Program of the Department of Science and Technology (DOST) and the University of the Philippines Emerging Interdisciplinary Research Program through the Office of the Vice President for Academic Affairs (UP EIDR C08-003).
Conflicts of Interest
The authors declare no conflict of interest.
References
- Baykara, S.Z.Z. Hydrogen: A brief overview on its sources, production and environmental impact. Int. J. Hydrog. Energy 2018, 43, 10605–10614. [Google Scholar] [CrossRef]
- Barbir, F. PEM electrolysis for production of hydrogen from renewable energy sources. Sol. Energy 2005, 78, 661–669. [Google Scholar] [CrossRef]
- Badwal, S.P.S.; Giddey, S.S.; Munnings, C.; Bhatt, A.I.; Hollenkamp, A.F. Emerging electrochemical energy conversion and storage technologies. Front. Chem. 2014, 2, 1–28. [Google Scholar] [CrossRef]
- Kamarudin, M.Z.F.; Kamarudin, S.K.; Masdar, M.S.; Daud, W.R.W. Review: Direct ethanol fuel cells. Int. J. Hydrog. Energy 2013, 38, 9438–9453. [Google Scholar] [CrossRef]
- Badwal, S.P.S.; Giddey, S.; Kulkarni, A.; Goel, J.; Basu, S. Direct ethanol fuel cells for transport and stationary applications—A comprehensive review. Appl. Energy 2015, 145, 80–103. [Google Scholar] [CrossRef]
- Lamy, C.; Jaubert, T.; Baranton, S.; Coutanceau, C. Clean hydrogen generation through the electrocatalytic oxidation of ethanol in a Proton Exchange Membrane Electrolysis Cell (PEMEC): Effect of the nature and structure of the catalytic anode. J. Power Sources 2014, 245, 927–936. [Google Scholar] [CrossRef]
- Kavanagh, R.; Cao, X.M.; Lin, W.F.; Hardacre, C.; Hu, P. Origin of low CO 2 selectivity on platinum in the direct ethanol fuel cell. Angew. Chem. Int. Ed. 2012, 51, 1572–1575. [Google Scholar] [CrossRef]
- Camara, G.A.; Iwasita, T. Parallel pathways of ethanol oxidation: The effect of ethanol concentration. J. Electroanal. Chem. 2005, 578, 315–321. [Google Scholar] [CrossRef]
- Monyoncho, E.A.; Steinmann, S.N.; Sautet, P.; Baranova, E.A.; Michel, C. Computational screening for selective catalysts: Cleaving the C–C bond during ethanol electro-oxidation reaction. Electrochim. Acta 2018, 274, 274–278. [Google Scholar] [CrossRef]
- Wang, H.; Jusys, Z.; Behm, R.J. Ethanol Electrooxidation on a Carbon-Supported Pt Catalyst: Reaction Kinetics and Product Yields. J. Phys. Chem. B 2004, 108, 19413–19424. [Google Scholar] [CrossRef]
- Akhairi, M.A.F.; Kamarudin, S.K. Catalysts in direct ethanol fuel cell (DEFC): An overview. Int. J. Hydrog. Energy 2016, 41, 4214–4228. [Google Scholar] [CrossRef]
- Zignani, S.C.; Baglio, V.; Linares, J.J.; Monforte, G.; Gonzalez, E.R.; Aricò, A.S. Endurance study of a solid polymer electrolyte direct ethanol fuel cell based on a Pt–Sn anode catalyst. Int. J. Hydrog. Energy 2013, 38, 11576–11582. [Google Scholar] [CrossRef]
- Del Rosario, J.A.D.; Ocon, J.D.; Jeon, H.; Yi, Y.; Lee, J.K.; Lee, J. Enhancing Role of Nickel in the Nickel–Palladium Bilayer for Electrocatalytic Oxidation of Ethanol in Alkaline Media. J. Phys. Chem. C 2014, 118, 22473–22478. [Google Scholar] [CrossRef]
- Ma, L.; He, H.; Hsu, A.; Chen, R. PdRu/C catalysts for ethanol oxidation in anion-exchange membrane direct ethanol fuel cells. J. Power Sources 2013, 241, 696–702. [Google Scholar] [CrossRef]
- Zhang, Z.; Xin, L.; Sun, K.; Li, W. Pd–Ni electrocatalysts for efficient ethanol oxidation reaction in alkaline electrolyte. Int. J. Hydrog. Energy 2011, 36, 12686–12697. [Google Scholar] [CrossRef]
- He, Y.; Yan, D.; Wang, S.; Shi, L.; Zhang, X.; Yan, K.; Luo, H. Topological Type-II Dirac Semimetal and Superconductor PdTe2 for Ethanol Electrooxidation. Energy Technol. 2019, 7, 1–6. [Google Scholar] [CrossRef]
- Zhou, L.; Xie, X.; Xie, R.; Guo, H.; Wang, M.; Wang, L. Facile synthesis of AuPd nanowires anchored on the hybrid of layered double hydroxide and carbon black for enhancing catalytic performance towards ethanol electro-oxidation. Int. J. Hydrog. Energy 2019, 44, 25589–25598. [Google Scholar] [CrossRef]
- Chen, Y.; Zhuang, L.; Lu, J. Non-Pt Anode Catalysts for Alkaline Direct Alcohol Fuel Cells. Chin. J. Catal. 2007, 28, 870–874. [Google Scholar] [CrossRef]
- Oh, Y.; Kim, S.K.S.; Peck, D.H.D.; Jang, J.S.J.J.S.; Kim, J.; Jung, D.H. ScienceDirect Improved performance using tungsten carbide/carbon nanofiber based anode catalysts for alkaline direct ethanol fuel cells. Int. J. Hydrog. Energy 2014, 39, 4–9. [Google Scholar] [CrossRef]
- Cao, L.; Sun, G.; Li, H.; Xin, Q. Carbon-supported IrSn catalysts for a direct ethanol fuel cell. Electrochem. Commun. 2007, 9, 2541–2546. [Google Scholar] [CrossRef]
- Kiani, M.A.; Mousavi, M.F.; Ghasemi, S. Size effect investigation on battery performance: Comparison between micro- and nano-particles of  -Ni (OH) 2 as nickel battery cathode material. J. Power Sources 2010, 195, 5794–5800. [Google Scholar] [CrossRef]
- Rajamathi, M.; Kamath, P.V. On the relationship between α-nickel hydroxide and the basic salts of nickel. J. Power Sources 1998, 70, 118–121. [Google Scholar] [CrossRef]
- Dong, L.; Chu, Y.; Sun, W. Controllable synthesis of nickel hydroxide and porous nickel oxide nanostructures with different morphologies. Chem. A Eur. J. 2008, 14, 5064–5072. [Google Scholar] [CrossRef] [PubMed]
- Jafarian, M.; Forouzandeh, F.; Danaee, I.; Gobal, F.; Mahjani, M.G. Electrocatalytic oxidation of glucose on Ni and NiCu alloy modified glassy carbon electrode. J. Solid State Electrochem. 2009, 13, 1171–1179. [Google Scholar] [CrossRef]
- Danaee, I.; Jafarian, M.; Forouzandeh, F.; Gobal, F.; Mahjani, M.G. Electrocatalytic oxidation of methanol on Ni and NiCu alloy modified glassy carbon electrode. Int. J. Hydrog. Energy 2008, 33, 4367–4376. [Google Scholar] [CrossRef]
- Barbosa, A.F.B.; Oliveira, V.L.; van Drunen, J.; Tremiliosi-Filho, G. Ethanol electro-oxidation reaction using a polycrystalline nickel electrode in alkaline media: Temperature influence and reaction mechanism. J. Electroanal. Chem. 2015, 746, 31–38. [Google Scholar] [CrossRef]
- Hutton, L.A.; Vidotti, M.; Patel, A.N.; Newton, M.E.; Unwin, P.R.; Macpherson, J.V. Electrodeposition of Nickel Hydroxide Nanoparticles on Boron-Doped Diamond Electrodes for Oxidative Electrocatalysis. J. Phys. Chem. C 2011, 115, 1649–1658. [Google Scholar] [CrossRef]
- Fleischmann, M.; Korinek, K.; Pletcher, D. The oxidation of organic compounds at a nickel anode in alkaline solution. J. Electroanal. Chem. Interfacial Electrochem. 1971, 31, 39–49. [Google Scholar] [CrossRef]
- Motheo, A.J.; Machado, S.A.S.; Rabelo, F.J.B.; Santos, J.R.J. Electrochemical study of ethanol oxidation on nickel in alkaline media.pdf. J. Braz. Chem. Soc. 1994, 5, 161–165. [Google Scholar] [CrossRef]
- Hall, D.S.; Lockwood, D.J.; Bock, C.; MacDougall, B.R. Nickel hydroxides and related materials: A review of their structures, synthesis and properties. Proc. R. Soc. A Math. Phys. Eng. Sci. 2014, 471, 20140792. [Google Scholar] [CrossRef]
- Gao, M.; Sheng, W.; Zhuang, Z.; Fang, Q.; Gu, S.; Jiang, J.; Yan, Y. Efficient water oxidation using nanostructured α-nickel-hydroxide as an electrocatalyst. J. Am. Chem. Soc. 2014, 136, 7077–7084. [Google Scholar] [CrossRef] [PubMed]
- Aghazadeh, M.; Ghaemi, M.; Sabour, B.; Dalvand, S. Electrochemical preparation of α-Ni(OH)2 ultrafine nanoparticles for high-performance supercapacitors. J. Solid State Electrochem. 2014, 18, 1569–1584. [Google Scholar] [CrossRef]
- Mourdikoudis, S.; Liz-Marzán, L.M. Oleylamine in Nanoparticle Synthesis. Chem. Mater. 2013, 25, 1465–1476. [Google Scholar] [CrossRef]
- Xu, L.; Ding, Y.Y.S.; Chen, C.C.H.; Zhao, L.; Rimkus, C.; Joesten, R.; Suib, S.L.L. 3D Flowerlike α-Nickel Hydroxide with Enhanced Electrochemical Activity Synthesized by Microwave-Assisted Hydrothermal Method. Chem. Mater. 2008, 20, 308–316. [Google Scholar] [CrossRef]
- Shen, S.Y.; Zhao, T.S.; Xu, J.B.; Li, Y.S. Synthesis of PdNi catalysts for the oxidation of ethanol in alkaline direct ethanol fuel cells. J. Power Sources 2010, 195, 1001–1006. [Google Scholar] [CrossRef]
- Du, W.; Mackenzie, K.E.; Milano, D.F.; Deskins, N.A.; Su, D.; Teng, X. Palladium–Tin Alloyed Catalysts for the Ethanol Oxidation Reaction in an Alkaline Medium. ACS Catal. 2012, 2, 287–297. [Google Scholar] [CrossRef]
- Vidotti, M.; Torresi, R.; De Torresi, S.I.C. Nickel hydroxide modified electrodes: A review study concerning its structural and electrochemical properties aiming the application in electrocatalysis, electrochromism and secondary batteries [Eletrodos modificados por hidróxido de níquel: Um estudo de]. Quim. Nova 2010, 33, 2176–2186. [Google Scholar] [CrossRef]


© 2020 by the authors. Licensee MDPI, Basel, Switzerland. This article is an open access article distributed under the terms and conditions of the Creative Commons Attribution (CC BY) license (http://creativecommons.org/licenses/by/4.0/).