Article

Modeling of Urea Decomposition in Selective Catalytic Reduction (SCR) for Systems of Diesel Exhaust Gases Aftertreatment by Finite Volume Method

Institute of Chemical Technology and Engineering, Poznan University of Technology, ul. Berdychowo 4, 60-965 Poznań, Poland
*
Author to whom correspondence should be addressed.
Catalysts 2020, 10(7), 749; https://doi.org/10.3390/catal10070749
Submission received: 3 June 2020 / Revised: 26 June 2020 / Accepted: 30 June 2020 / Published: 6 July 2020
(This article belongs to the Section Computational Catalysis)

Abstract

:
This study presents modeling of selective catalytic reduction (SCR) for systems of diesel exhaust gases aftertreatment. The main purpose of this work is to develop the modeling approach that allows accurate prediction of urea–water solution behavior (UWS) in the real diesel exhausts in temperature range 373 K to 873 K. The UWS is a key element of catalytic reduction of diesel NOx which utilizes ammonia as reducing specie. The finite volume method (FVM) extended by the nonrandom two liquids (NRTL) phase equilibrium model was used to perform the calculations. The results obtained were verified with experimental measurements. The comparison show that the NRTL extension introduced in this work allows reproducing the actual process conditions in the diesel exhaust environment. The accuracy of the results permits the model to be used for the design purposes and simulation approaches as well.

Graphical Abstract

1. Introduction

Traditionally, diesel engine emissions have been controlled by means of improvements to the engine itself, rather than by the use of aftertreatment devices. Such approach has changed over the last few years, in the light of the increasing requirements imposed by environmental standards. Not only the efficiency of engines, but also the treatment of combustion gases has proven to be an important element in improving the diesel environmental impact. One important part of the pollutants in the exhaust gases are the nitrogen oxides NOx. The formation of nitrogen oxide is directly related to the temperature of the combustion chamber. An increased combustion temperature leads to higher NOx emissions. The reduction in nitric oxide emissions results from a reduction in peak combustion temperatures and a reduction in the duration of high combustion chamber temperatures. Nitrogen oxides together with volatile organic compounds (VOCs) are precursors in the photochemical reaction which forms tropospheric ozone. There is much evidence to suggest that ozone can cause adverse effects on the respiratory system, including chest pain, coughing and shortness of breath, which are most severely affecting people with damaged respiratory systems, children and outside workers. Furthermore, NOx and VOCs can directly harm human health. Besides the effects on human health, ozone, NOx and VOCs are also associated with other negative effects on the environment. Ozone reduces crop and forest yields and harms ornamental plants. NOx and in some cases VOCs, contribute to secondary formation of particulate matter (PM) [1]. The development of new engine technologies, such as recirculation of cooled exhaust gases and electronically controlled fuel injection systems, can reduce NOx emissions from 1000 ppm to 200 ppm [2].
Nowadays, the preferred technology to meet the increasingly stringent NOx emissions standards for automotive diesel engines is the use of selective catalytic reduction (SCR) with ammonia as a reducing agent [3]. SCR reaction runs according to the following stoichiometric Equation [4]:
4 N H 3 + 4 N O + O 2 4 N 2 + 6 H 2 O
In the case when the diesel exhaust gas contains equimolar amounts of NO and NO2, the reduction of NOx converts at a higher rate due to the fast SCR reaction which reads [5]:
4 N H 3 + 2 N O + 2 N O 2 4 N 2 + 6 H 2 O
Providing ammonia by means of storage can be both troublesome and dangerous. Instead the in situ generation of ammonia in the reaction of thermal urea decomposition is used. The basic car urea-based SCR system is schematically shown in Figure 1.
In an automotive urea-based SCR system, the urea–water solution (UWS) is sprayed into the exhaust gas stream before the SCR catalyst. The hot exhaust gas heats up the injected UWS droplets, which results in a reduction agent to be produced. At the first water, which is more volatile than urea, evaporates from the droplet solution. In the second stage the urea evaporates and decomposes to create ammonia and isocyanic acid according to reaction:
H 2 N C O N H 3 N H 3 + H N C O
The last step is the gas phase hydrolysis of isocyanic acid to give an additional mole of ammonia and carbon dioxide as side product:
H N C O + H 2 O N H 3 + C O 2
Ammonia then is consumed in the reduction reaction of NOx gases to obtain nitrogen. In this sense, an effective reduction mechanism requires equal amounts of moles of ammonia and NOx generated by fuel combustion. Unfortunately, the introduction of an insufficient amount of ammonia deteriorates the efficiency of the SCR system. The main design objective for an efficient urea-based SCR system is to guarantee the injection of a sufficient quantity of UWS to generate the required amount of ammonia.
Since a UWS drop is basically a binary mixture, the process of distribution of UWS droplets can be presented by two successive stages: total evaporation of the water and then reduction of urea amount by evaporation and/or its decomposition [6]. The evaporation of water from non-ideal solutions can be modeled using a suitable thermodynamic model to take account of changing urea concentrations in UWS solution. For example, the model proposed by Ström [6] assumes that after complete evaporation of the water content, pure solid urea droplets are heated to 425 K without exchanging mass with the gaseous phase. When the drop reaches 425 K, all heat is transferred from the surrounding gas phase to the drop’s surface and is used to vaporize the urea.
The functioning of urea–SCR systems greatly depends on the ammonia distribution at the catalyst inlet. Uneven distribution of ammonia results in lower efficiency and may cause dangerous excess of ammonia that is present in the final exhaust [7]. Additional significant factor is the interaction of UWS with the exhaust system walls. Under certain conditions of wall cooling by UWS drops, unwanted biuret, cyanuric acid and melamine byproducts may be produced [8]. The formation of liquid wall layers may transform into solid deposition [9]. When it occurs at the catalyst inlet, the backpressure increases considerably, which influences the engine operating conditions and enlarges fuel consumption. Therefore, to model the behavior of an SCR after-treatment system, numerous physicochemical processes must be taken into account, mostly the evaporation of water from the UWS and thermolysis of urea.
NH3 is used as a reducing agent for the reaction in the SCR chamber and is obtained from 32.5% pure aqueous urea solution by decomposition. The melting point of pure urea is 405.65 K. It is evaporated and then by melting to a gaseous state at a temperature above 413 K. When the temperature is higher than 425 K the urea decomposes almost completely to NH3 and HNCO. Research on the evaporation of UWS in the SCR system [5] focuses mainly on a low-temperature environment, which is limited by the temperature of the exhaust usually below 873 K.
The main aspect of this work is the appropriate selection and strict determination of parameters of a suitable thermodynamic method for the UWS system. Due to the fact that the UWS system is characterized by a wide range of boiling temperatures of both components, the correct estimation of the coefficients of activity of both components is crucial for the accuracy and fidelity of the real representation of the mixture. In order to maintain the accuracy of the description of the system’s non-ideality, the non-random two liquid (NRTL) activity thermodynamic model was selected, and corresponding model and binary interaction coefficients were accurately determined. In this work, therefore the NRTL coefficients were calculated to obtain as accurate representation of the system as possible, based on the literature data. The model selected has wide possibilities so that it allows to estimate the non-ideality for solutions of polar substances and azeotropic mixtures also in multicomponent systems. However, the UWS solution does not exhibit azeotropic characteristics, a wide range of boiling temperatures is typically a numeric problem for simpler models, which is related to the difficulty of reflecting the strong and steep dependence of boiling temperature and vapor pressure on urea concentration.
The selection of the NRTL thermodynamic model with such a wide range of applicability gives a great advantage from a practical and research point of view. First of all, from a practical point of view, it allows to take into account the widest possible range of properties of mixtures and, in case of possible modification, it is easily expandable to multicomponent systems. From a research point of view, the introduction of the flexibility of NRTL model offers more options for testing and simulation for systems not yet tested. One of the advantages of using the NRTL model is also the relatively wide availability of data characterizing the mixtures and the good establishment of this method in practical engineering applications guarantees reliable results.

2. Results and Discussion

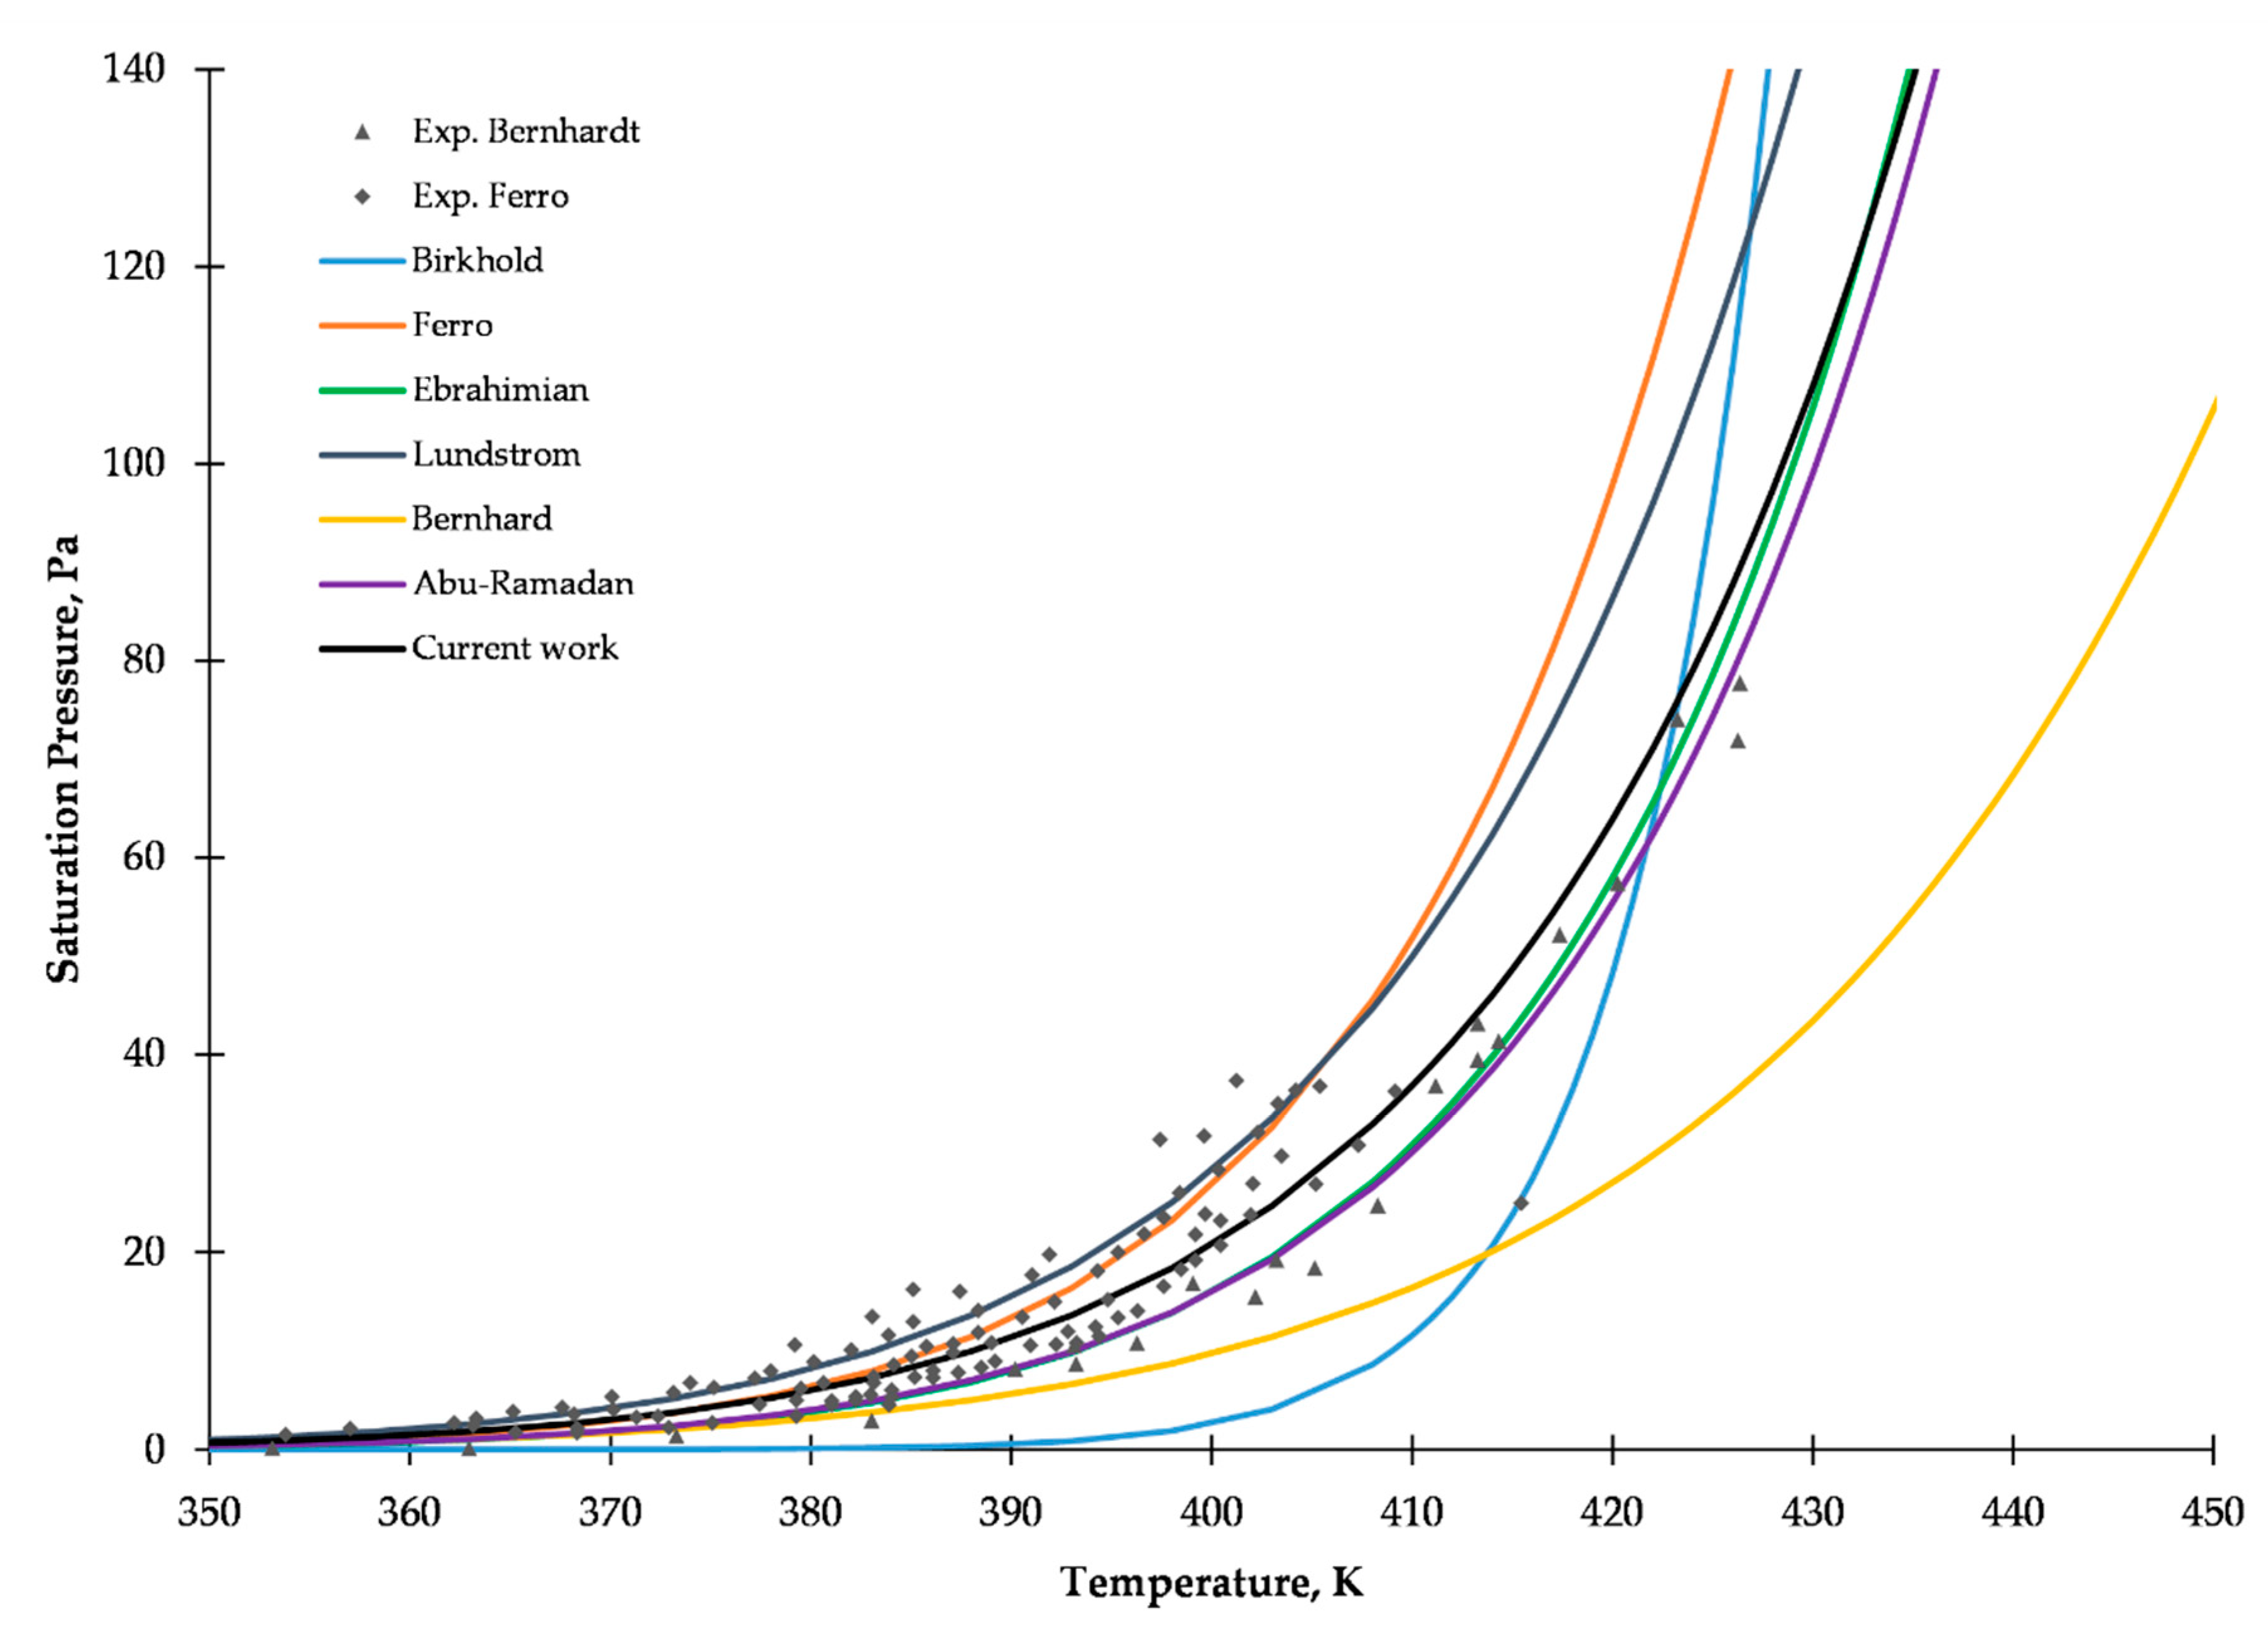
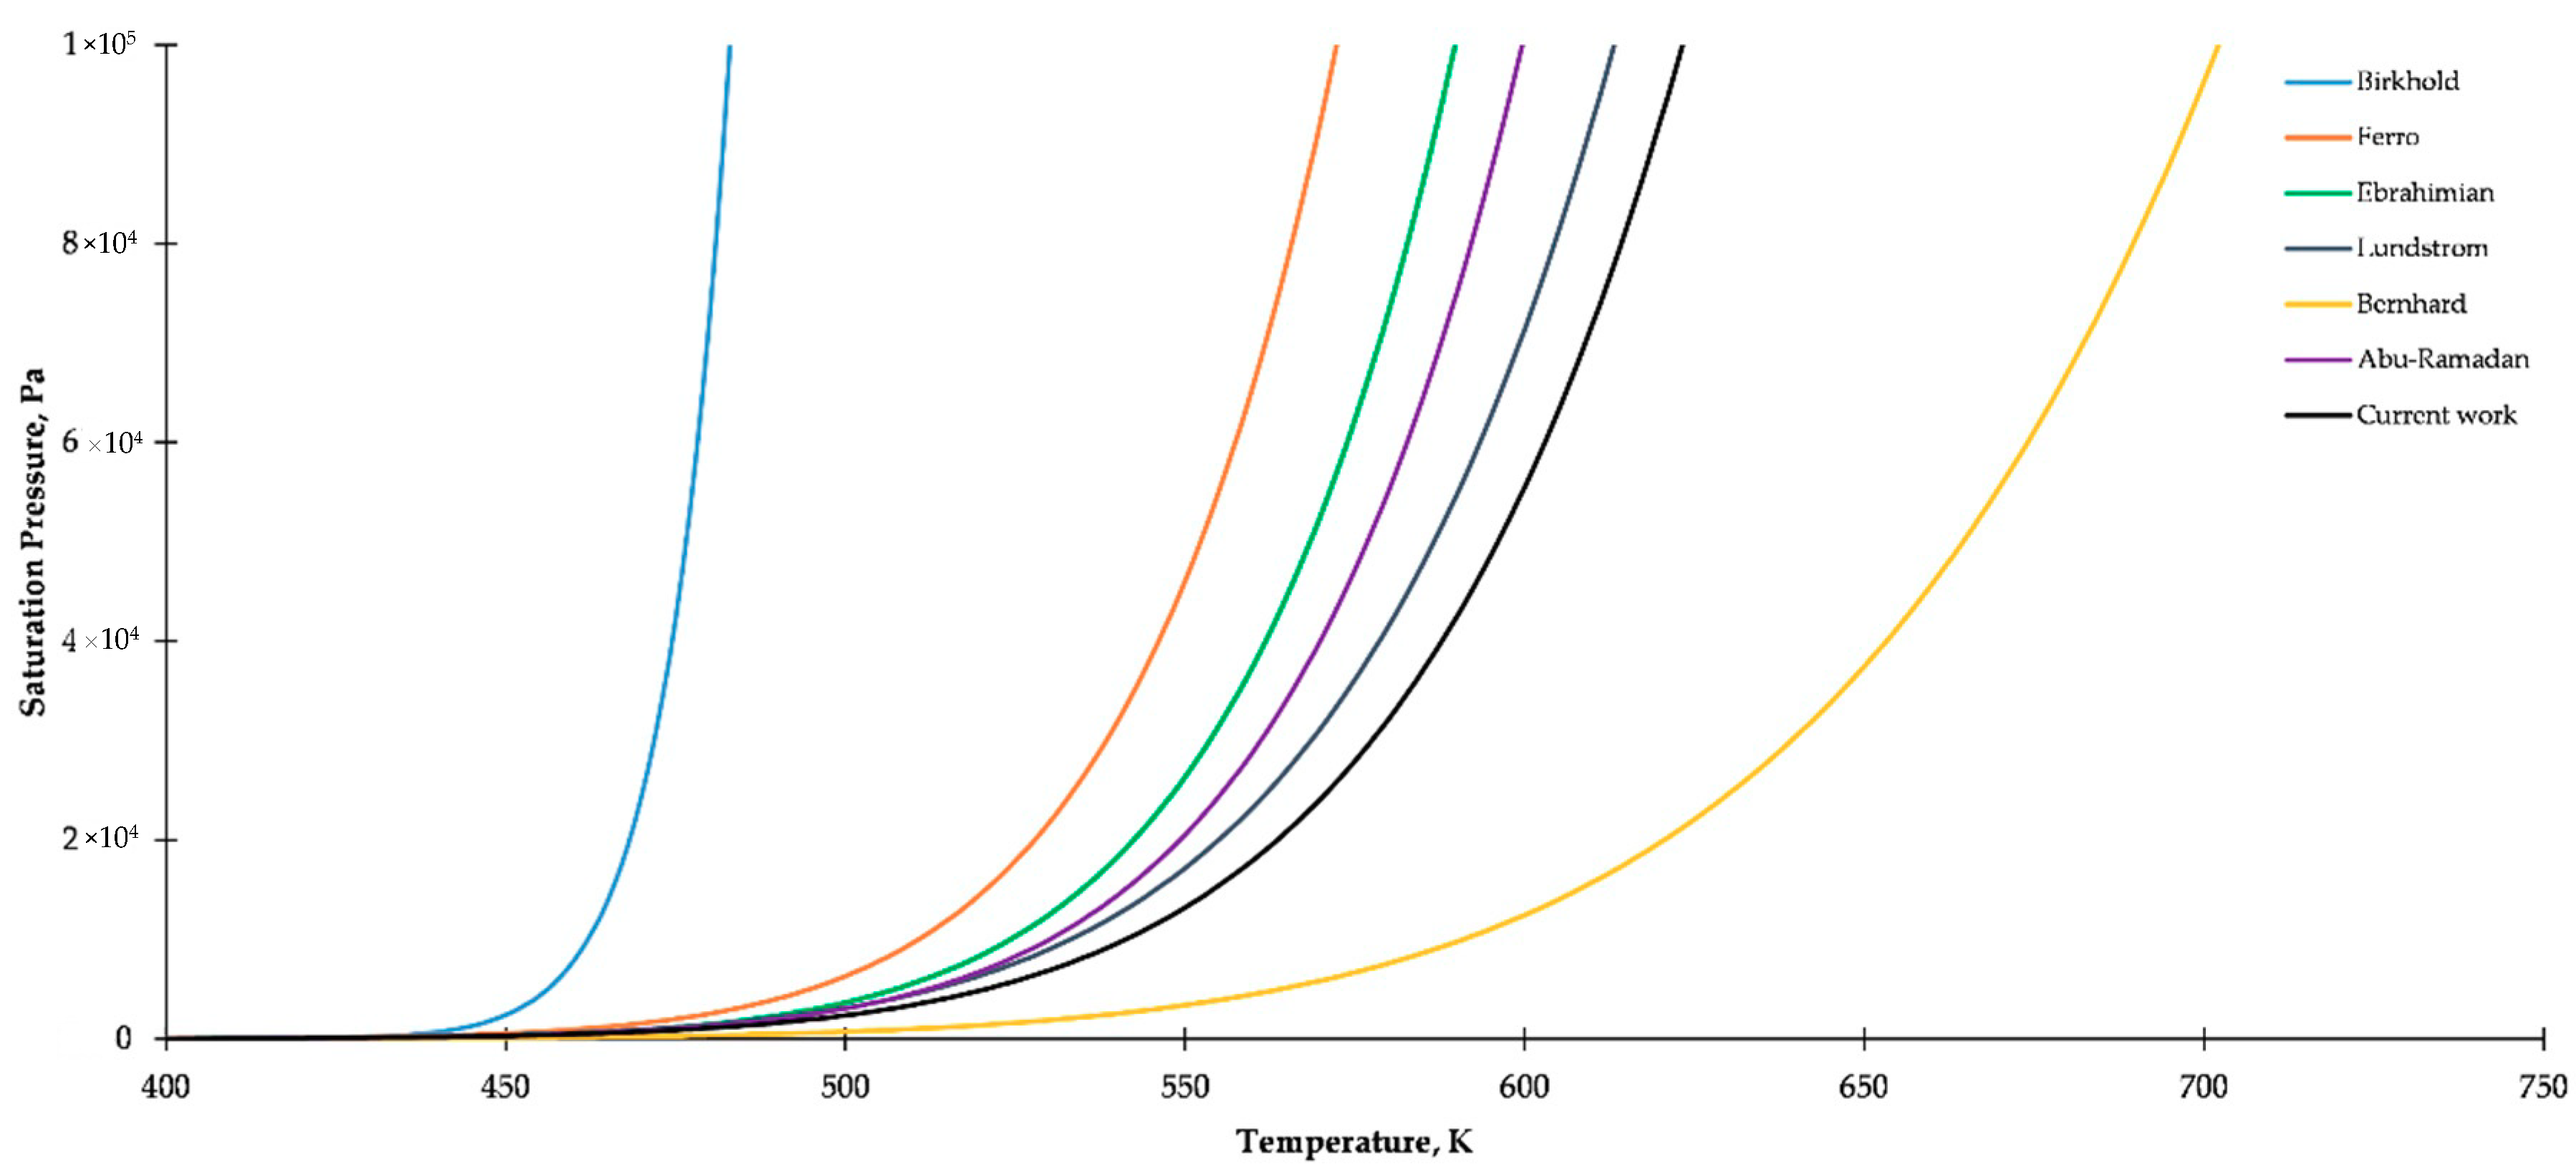
2.1. Saturated Vapor Pressure

To calculate the vapor–liquid equilibrium of the urea–water solution, it is necessary to correctly determine the saturated vapor pressure. In the case of water, the relationship is precisely defined by the use of reliable data, while in the case of urea, there is inconsistency in the literature. Birkhold suggested vapor pressure estimation based on an experiment carried out in his work [10]. A different approach was used by Abu-Ramadan et al. [11] and Lundstrom et al. [12] who determine the vapor pressure based on the Clausius–Clapeyron equation. Other values are presented in the work of Ebrahimian et al. [13] who applied the sublimation pressure instead of vapor pressure, basing on the DIPPR database. The saturation curve proposed in this work is based on the linear regression of the experimental results presented by Ferro et al. [14] and extended by the experimental results from Bernhard et al. [15].
A comparison of the saturation vapor pressure curve obtained in this work along with experimental results is presented on Figure 2, while Figure 3 presents a comparison of various vapor pressure values applied in references [10,11,12,13,14,15], which was calculated by Antoine equation, as follows:
l o g P s a t = A + B T + C
Fitted Antoine equation parameters were presented in Table 1.

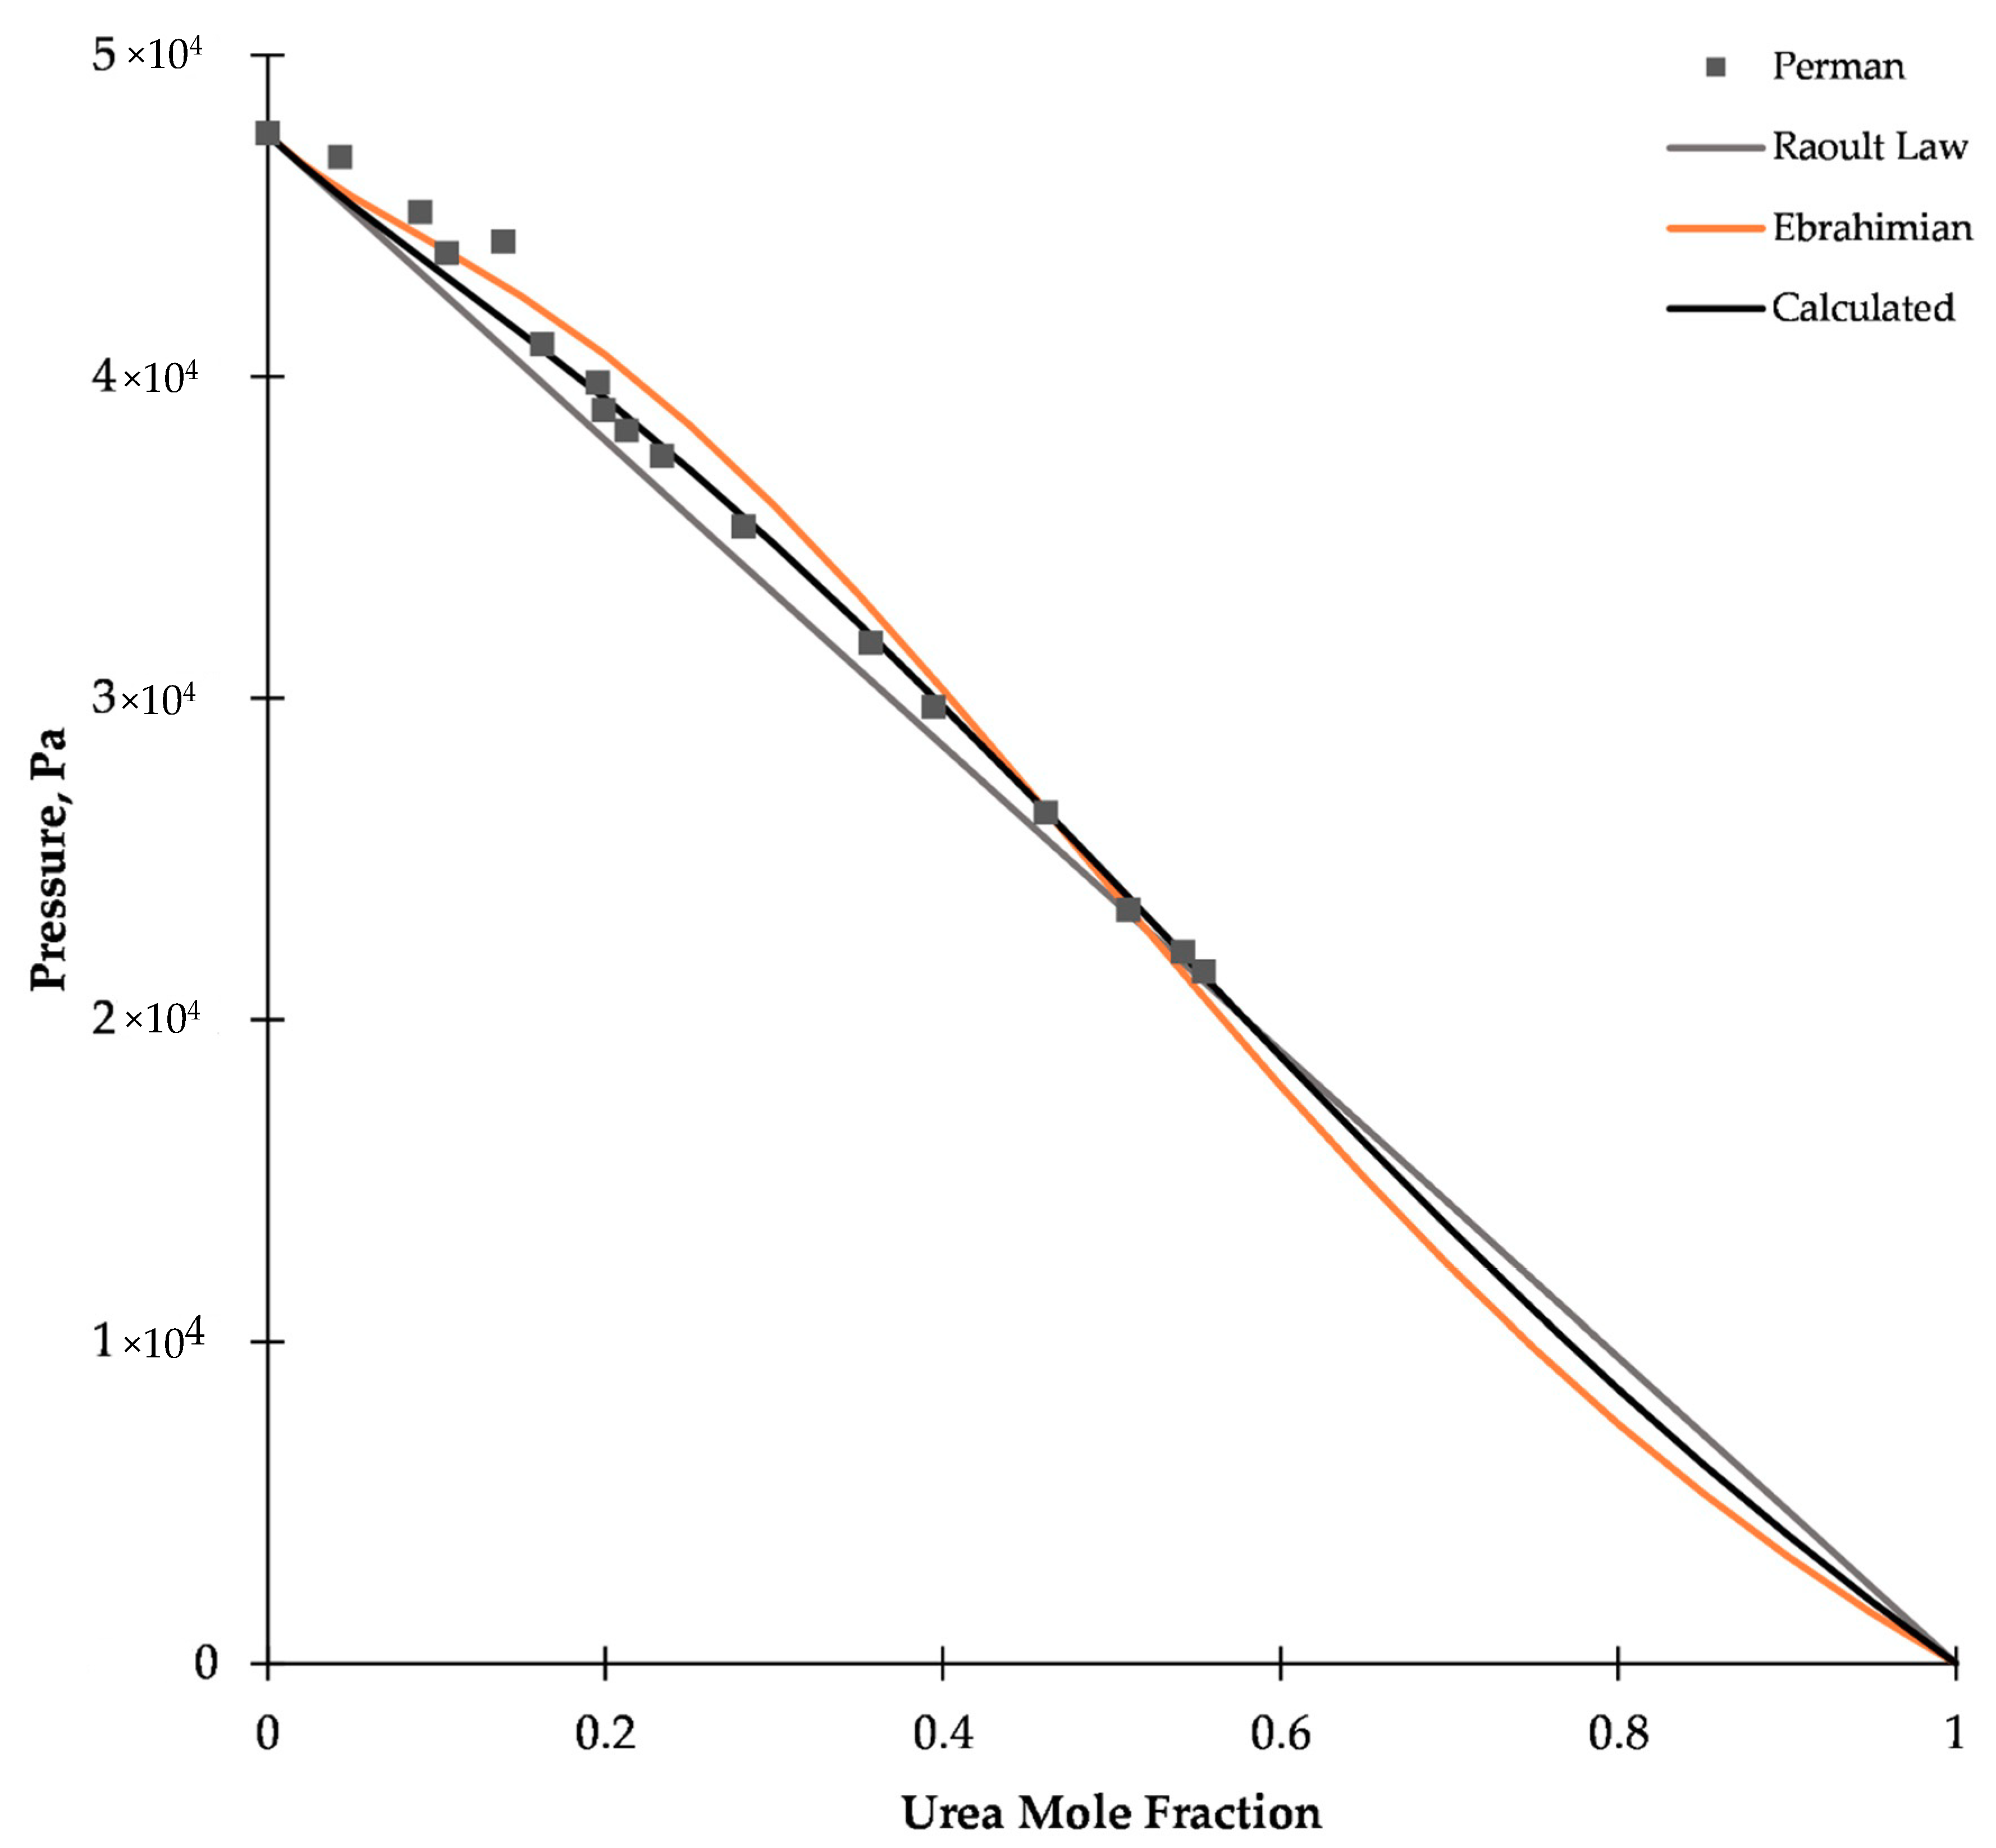
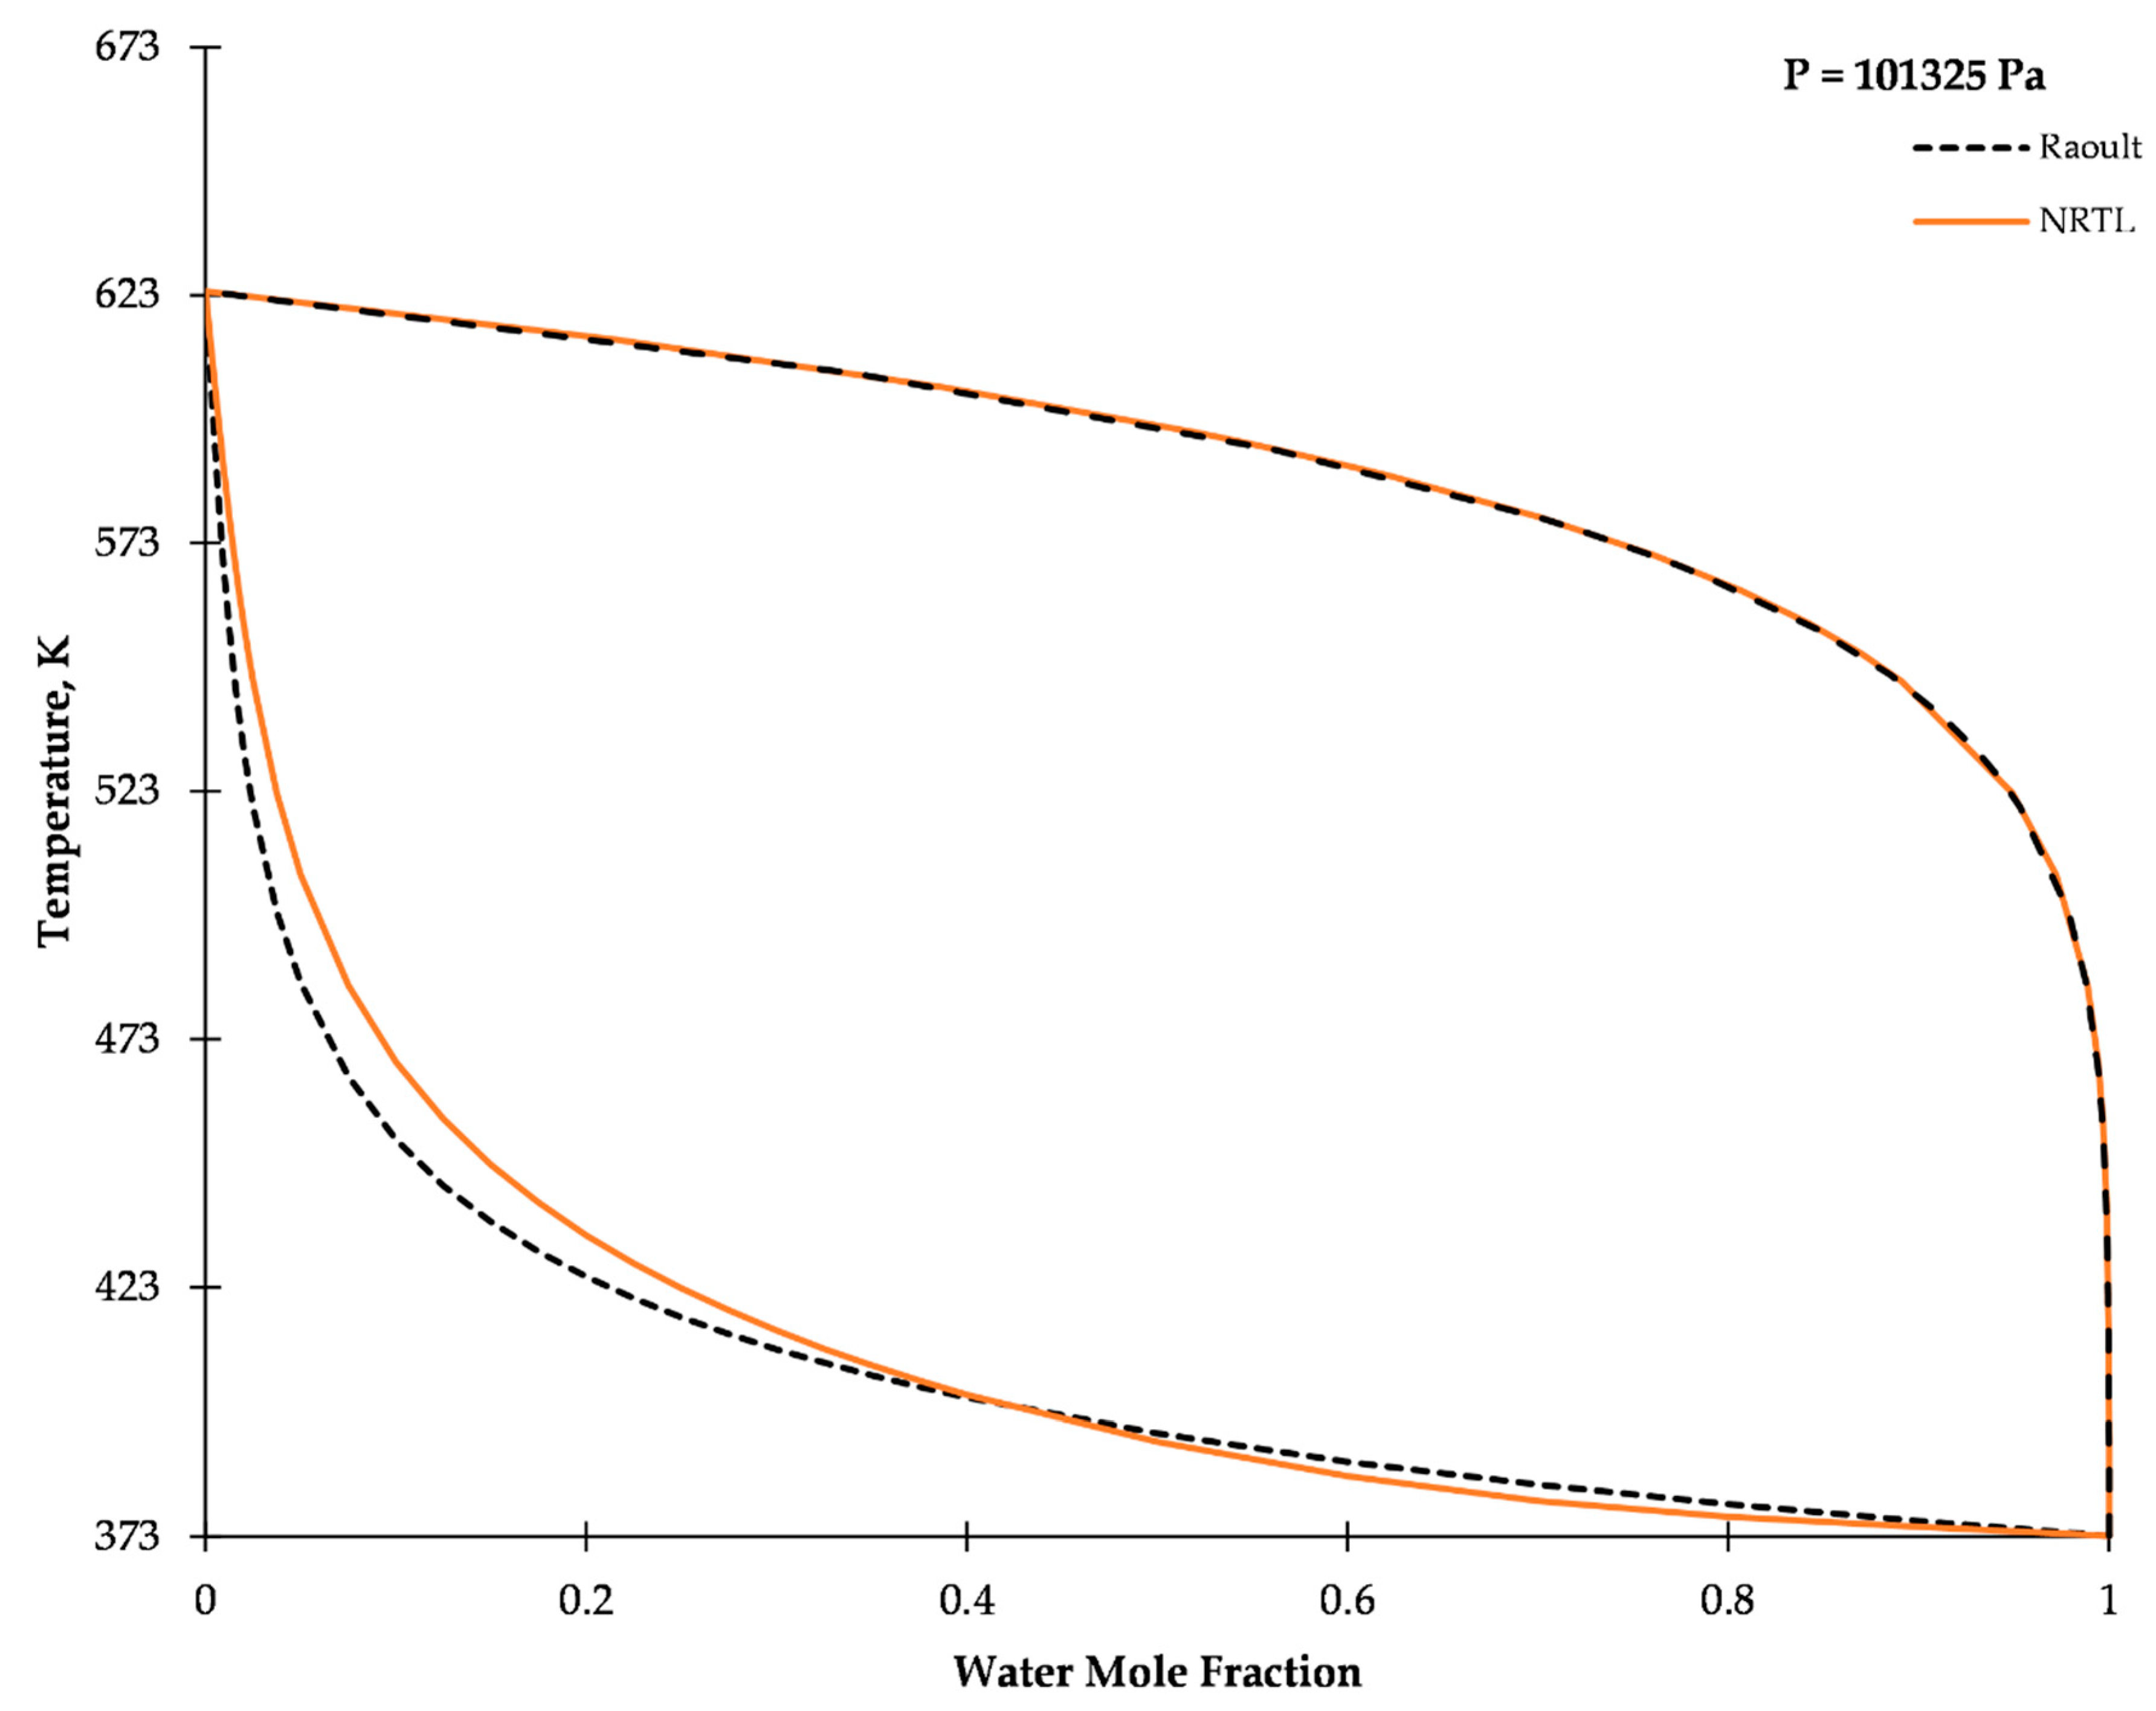
2.2. Vapor–Liquid Equilibrium

Simulations of the UWS droplet evaporation process have been supplemented with the non-random two liquid (NRTL) model—an activity coefficient model which allows to reflect the nonidealities of real solution in phase equilibrium relationship [16]. A binary system of urea–water solution is represented by following equations
l n γ i = x j 2 [ τ j i ( G j i x i + x j G j i ) 2 + ( G i j τ i j ( x j + x i G i j ) 2 ) ]
l n γ j = x i 2 [ τ i j ( G i j x j + x i G i j ) 2 + ( G j i τ j i ( x i + x j G j i ) 2 ) ]
τ i j = a i j + b i j T + c i j T 2
τ j i = a j i + b j i T + c j i T 2
G i j = exp ( α τ i j )
A set of binary interaction parameters for presented Equations (6)–(10) was obtained as a result of fitting data from reference [17] and was summarized in Table 2. A comparison of experimental results along with model presented by Ebrahimian et al. [13] and currently developed model was presented in Figure 4.
Direct comparison with Raoult’s law and experimental results reveal that binary system of urea and water shows minor deviation from the ideal solution behavior. The consequence of application of a model presented in a reference [13] is introduction of higher shift from Raoult’s law, while currently suggested set of coefficients provides both a compromise between two presented options and a good fit to reference data. It should also be mentioned that due to the limited amount of data, the model fit was carried out for a relatively narrow temperature range, compared to the temperature range of the SCR systems. The equilibrium plots present wide range of the boiling points for the UWS system (Figure 5).

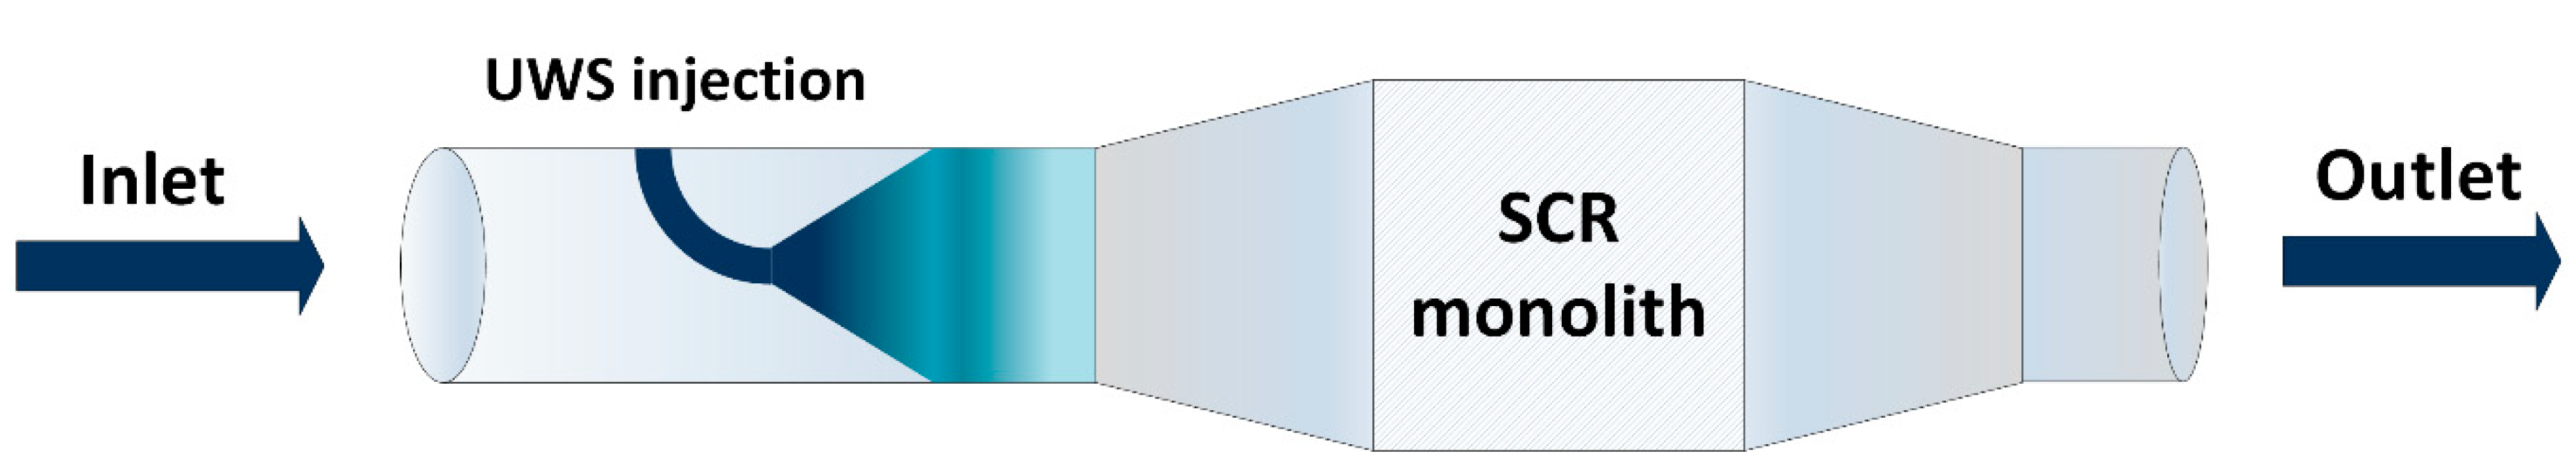
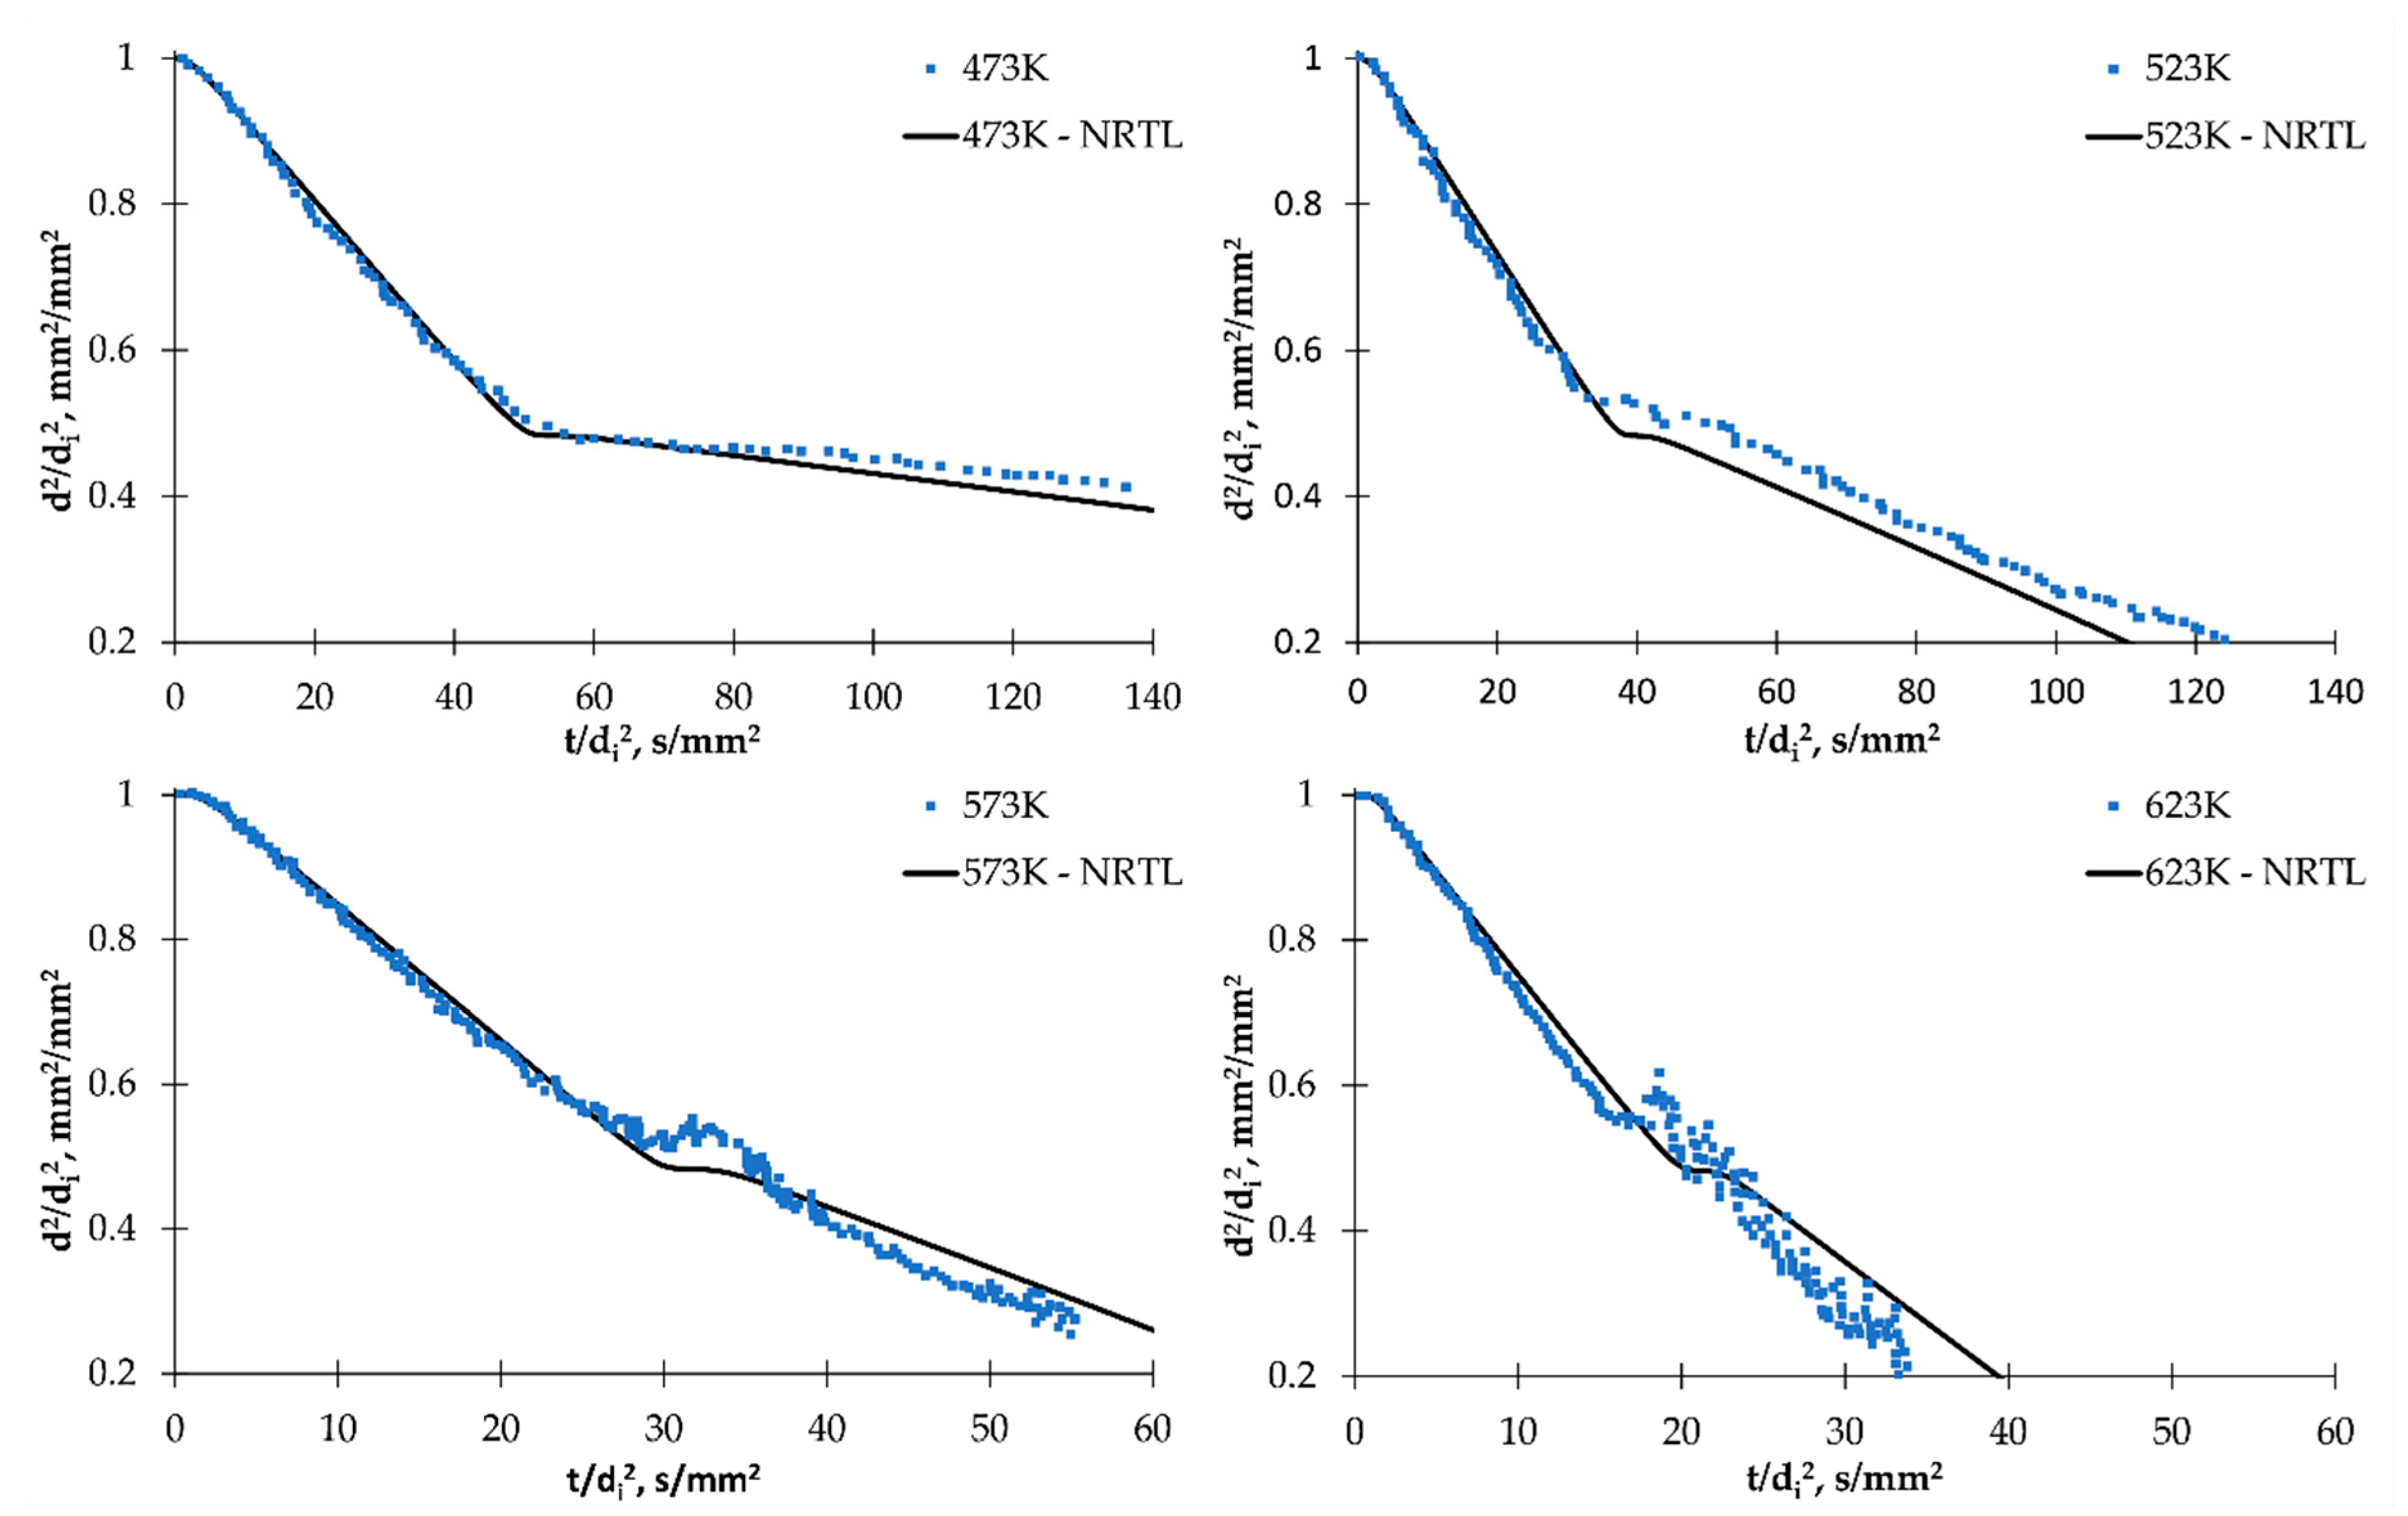
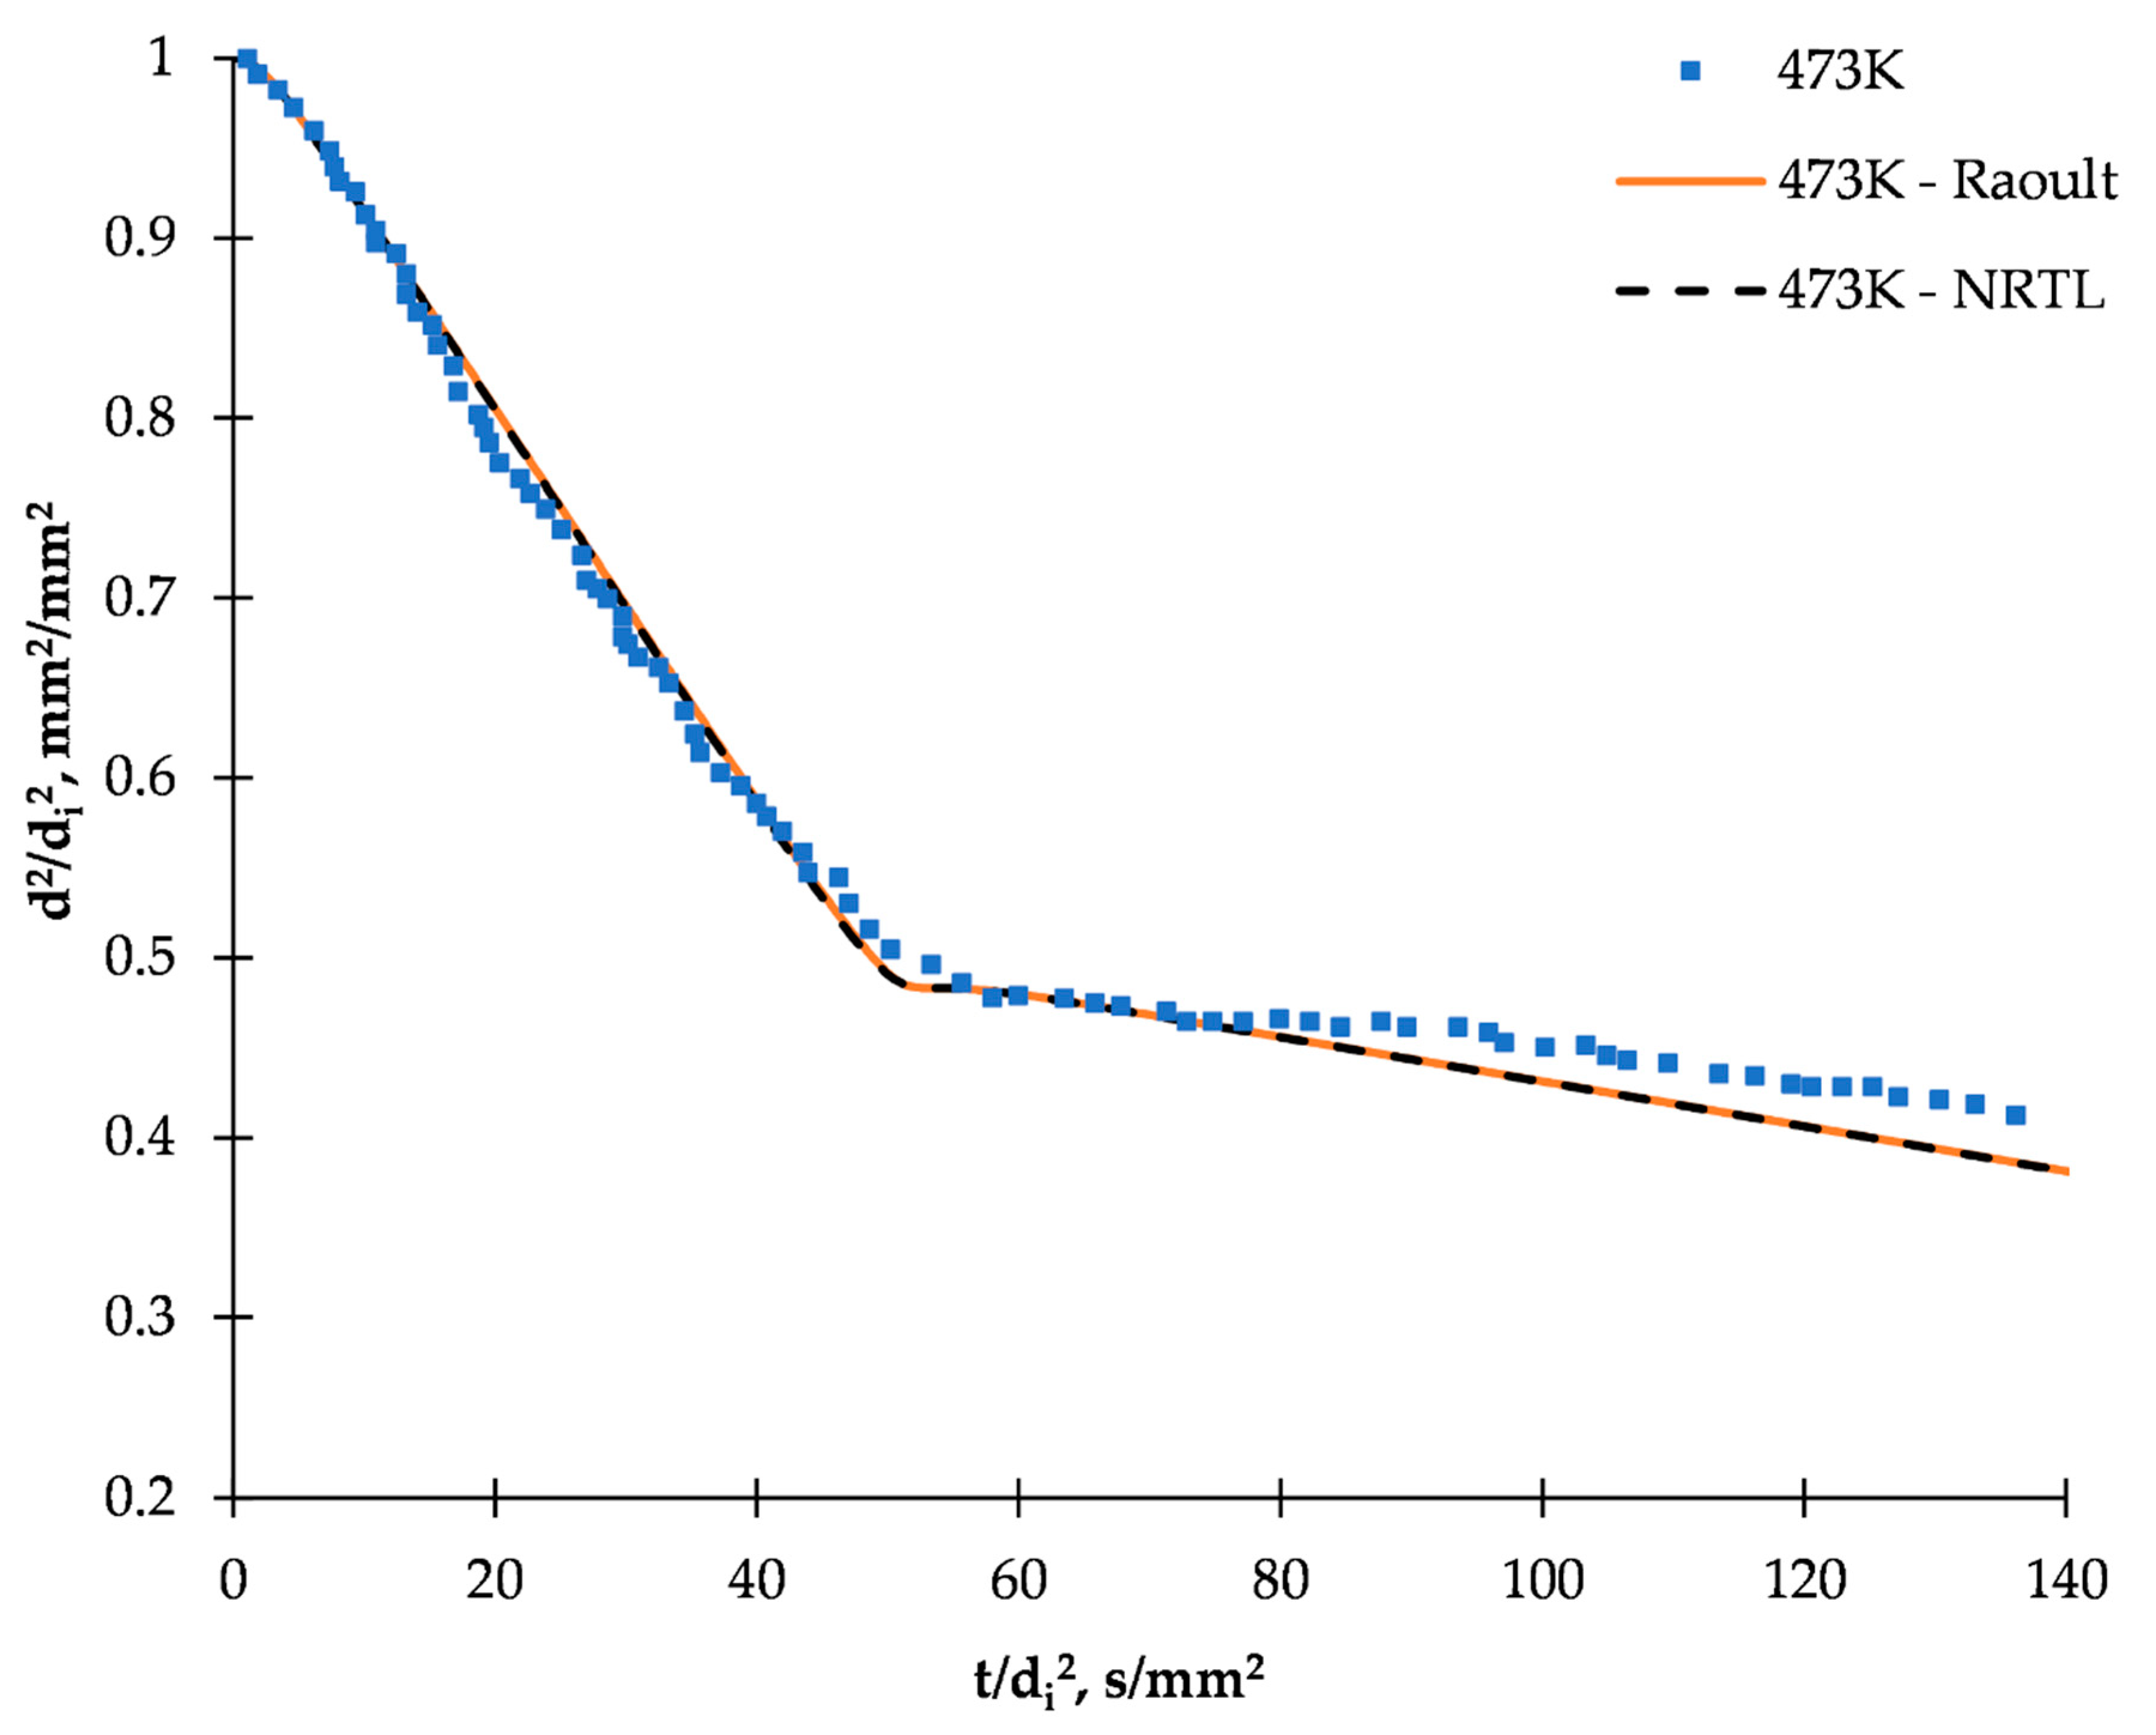
2.3. Simulation and Model Validation

In this section, the concept of the UWS droplet evaporation model is presented, in which calculations were made on the basis of the Ansys Fluent 19 R3 program. The following set of Equations (11)–(18) represent the method of calculating the results. Calculations performed by the Fluent program are supplemented with user code in the C language introducing the NRTL activity coefficient model into the evaporation process of the urea–water solution, as well as a newly developed set of the coefficients for the Antoine (5) equation for urea. Transient analysis is carried out by means of multiphase modeling using the Lagrange method and species transport approach to account for diffusion. The heat and mass transfer inside the droplet is neglected, and thus an even distribution of temperature and composition of the whole drop is assumed. This approach was described in the literature as a rapid mixing model, and presented as a reasonable alternative to more detailed, and computationally expensive diffusion-limited approach which takes into account internal recirculation and composition gradient in droplet [10]. The approach proposed in this work assumes no flow around the droplet modeled and thus no momentum exchange with the environment. The droplet mass transfer is defined using a convection/diffusion-controlled vaporization model:
d m i d t = A p d d S h A B D i , m ρ g ln ( 1 + B m , i )
in which Spalding mass transfer number is given by:
B m = Y i , s Y i , 1 Y i , s
Heat transport through a multicomponent particle is calculated on the basis of transient energy balance equation that reads:
m p c p d T d t = h A p ( T T p ) + d m i d t ( h v a p , i )
During the simulation, the impact of radiation heat transfer is omitted, and the heat transfer coefficient is defined by means of correlation:
N u = h d p k = ln ( 1 + B T ) B T ( 2 + 0.6 R e d 1 2 P r 1 3 )
B T = ( 1 + B m ) ϕ 1
ϕ = k c p g ρ D i , m · S h N u · c p v c p g
Assumption of gas film properties and temperature for the droplet mass, and heat transfer equation were made with use of the 1/3 rule, and calculated using Equations (17) and (18)
T r e f = T s + α T ( T g T s )
T r e f = Y s + α T ( Y g Y s )
where α T ,   α d are equal to 1/3. The equations were solved in a cylindrical domain corresponding to the dimensions of the experimental setup from the work of Wang et al. [18], on which further validation of the model was based. The procedure of conducting the experiment in related work included heating the electric furnace to a temperature corresponding to the measurement being carried out, in a position distant from the droplet delivery system, along with simultaneous purification of the experimental domain by providing pressurized dry air at room temperature in the experimental chamber, which was a cylindrical vessel with inner diameter of 0.15 m and height of 0.8 m. Then, after a certain ambient temperature was obtained, a portion of the 32.5% UWS solution was delivered through the quartz fiber forming a single suspended drop. Final step of experimental procedure was lowering the electric furnace to the position of the droplet which provided the uniform ambient temperature. The method of measurement involved observation and measurement of the diameter of the drop through a sight glass placed in the stand, using a high-speed charge coupled device camera. Reconstructed experimental domain was discretized using hexahedral mesh with additional refinement in a spherical area within a diameter 0.1 m with a droplet in the center of the domain. The mesh size was chosen to ensure the smallest mesh possible while maintaining the ratio of droplet volume to cell volume below 10%, which should provide the most realistic results without impacting the quality of the numeric calculations. During calculations, a single droplet of UWS solution with a diameter of 1 mm was injected into the center of the domain filled with stagnant air, composed of the 21 weight % oxygen and 79 weight % nitrogen at the temperature of the given experiment. Injected droplet temperature was set to the 293 K, with initial velocity equal to zero, as was presented in Figure 6. In the work presented by Lundstrom et al. [12] it is assumed that part of the water could evaporate before the beginning of the measurement, the same assumption was made in this work as a result as a boundary condition it was assumed 40 weight % urea content in the solution. The equations were solved using the pressure based solver using SIMPLE algorithm with second-order discretization. The entire domain surface used a non-slip wall boundary condition with a temperature corresponding to the temperature of the experiment. The urea reaction was solved as a volumetric rate with use of reaction kinetics described in the Section 3.2, while species transport uses Fick’s diffusion. Diffusion coefficients, reaction kinetics and other information on material definitions were described in Section 3.1.
In terms of validation, it is worth to note a very good fit of the model in the whole tested range to the experimental results presented in [18]. The accuracy of the model reflects well the behavior of the UWS drop, with the biggest difference being the offset of the points of inflection of the curves, which may be caused by the possibility of earlier evaporation of some of the water from a droplet. In addition, a slightly larger deviation from the experimental results in the case of higher temperatures can be noted, which may be the influence of thermal radiation on the heat transfer process (Figure 7). In all cases, characteristic slope alterations are visible in simulation results (black line), which represent moment of transition from water evaporation to urea thermolysis. This typical change of slope due to the initial evaporation of water and then to the gasification of urea followed by its immediate decomposition was observed by other authors [18].
Figure 8 depicts comparison of simulation using the NRTL model and Raoult’s law. It shows that a slight deviation from the ideal solution behavior has an almost negligible difference in the simulation of evaporation of a single UWS droplet (the difference between results is less than 1%) and justifies the use of Raoult’s law as a reliable alternative. Nevertheless, the benefit of a minimal increase in the computational cost resulting from the use of the NRTL model, in favor of including an ideal behavior, may have an effect on injection simulation for the entire SCR system, but the quantification of the influence of this model remains in the matter of further investigation.

3. Materials

3.1. Material Definition

The use of the evaporation model requires a precise definition of the physical properties of each component in the gas mixture and the liquid used in the simulation. Due to the wide temperature range, the definition of density, viscosity, thermal conductivity and specific heat of all materials used in the simulation were determined by temperature-dependent functions based on tabulated or experimental data. The exception is isocyanic acid, for which specific heat, viscosity and thermal conductivity were calculated on the basis of kinetic theory. Kinetic theory was also used to define the gas diffusion coefficients, which use a modification of the Chapman–Enskog Equation (27) for which Lennard–Jones parameters were taken from the Fluent library. Water density was based on tabulated data from reference [19], while urea density was set to the constant value of 1335 kg/m3 [20], which corresponds to the density of solid urea. The gas density of each component was calculated based on ideal gas law, assuming the incompressibility of gases in the simulation. The methods of calculating the physical properties of gas and liquid mixtures used in this work are presented in Table 3, while full description of sources of material data for each of the components is summarized in Table 4.
where:
Φ i j = ( 1 + ( μ i μ j ) 1 2 ( M w , j M w , i ) 1 4 ) 2 ( 8 ( 1 + M w , j M w , i ) ) 1 / 2
The diffusion coefficient correlation (27) is based on the Yaws [19].
Calculations of saturated vapor pressure for water were based on the Antoine Equation (5) using the coefficients from Dortmund data bank [22], implemented in the form of the user defined function (UDF)—an option that allows the solver to extend its capabilities with user code written in C. The enthalpy value of urea evaporation was calculated based on the difference between sublimation enthalpy taken from reference [23] and the heat of fusion from reference [14], resulting in a value of 1.35 × 10⁶ J/kg. The effect of temperature on the heat of evaporation is taken into account by Equation (29):
h f g = T d T b p c p , g d T + h f g , b p + T d T b p c p , d d T

3.2. Reaction Kinetics

The model used in this work assumes the evaporation of urea, followed by the thermolysis of urea and hydrolysis of isocyanic acid. The kinetics of these reactions was described by the Arrhenius Equation (17), to which activation energy and pre-exponential factor were determined in the work of Yim et al. [24]. The frequency factor for the thermolysis reaction (3) is given by 4.9 × 10³ s−1 and activation energy 2.3 × 10⁷ J/kmol, while for hydrolysis reaction (4) is described using the frequency factor equal to 2.5 × 10⁵ s−1 and activation energy of 6.22 × 10⁷ J/kmol, respectively.
k = A e E a R T

4. Conclusions

A new set of coefficients for the Antoine equation for calculating the saturated vapor pressure has been proposed—as well as the new set of binary interaction coefficients for the NRTL thermodynamic model. A comparison of the NRTL results and Raoult’s law shows that small deviations from the ideal behavior have—in the case of the calculations for this work—slight impacts on the simulation of the evaporation of a single drop of UWS. However, as research on the SCR process for NOx reduction is still ongoing [25], it seems justified to use a thermodynamic description, which is more flexible and covers a wider range of different types of mixtures. In addition, such a model opens up new calculation possibilities for new systems research. A slight increase in the computational cost resulting from taking into account the non-ideal fluid phase interactions is certainly valuable also in the case of simulations of entire SCR systems. A complete model of multicomponent particle evaporation simulation based on reliable data applied in the form of temperature-dependent formulas was described and validated based on experimental results from reference. The developed model was solved using Ansys software and provides the basis for further application in simulations of the complete SCR system.

Author Contributions

Individual contributions of the authors: conceptualization, F.K. and M.S.; methodology, software, F.K. and M.S.; calculations and visualization, F.K.; writing—original draft preparation, review and editing, F.K., K.S., M.S.; supervision, project administration, K.S. and M.S. All authors have read and agreed to the published version of the manuscript.

Funding

This research was funded by the Ministry of Higher Education and Science, Poland, grants No. 0912/SBAD/2007 and 0912/SBAD/2010.

Conflicts of Interest

The authors declare no conflict of interest.

Notation

mmass (kg)
Addroplet surface area (m2)
ρdensity (kg/m3)
Mwmolecular weight (kg/kmol)
ShSchmidt number
NuNusselt number
Ddiffusion coefficient (m2/s)
cpspecific heat (J/kg)
μkinematic viscosity (Pa·s)
kthermal conductivity (W/(m·K))
ddiameter (m)
BmSpalding mass transfer number
BTSpalding heat transfer number
Ymass fraction
xmolar fraction
Ppressure (Pa)
ΩDdiffusion collision integral
σLennard–Jones length (Angstrom)
Ttemperature (K)
hflatent heat (J/kg)
Apre-exponential factor (1/s)
Eaactivation energy (kcal/kmol)
a, b, cbinary interaction coefficients
A, B, CAntoine equation parameters
αnonrandomness constant for binary interactions
γactivity coefficient
τdimensionless interaction parameter
Gdimensionless interaction parameter

Subscripts

ggas
ddroplet
i, jindices of species
ssurface
ambient
absabsolute
satsaturation
bpboiling point
refreference
vvapor
H2Owater
Ttemperature
Ymass fraction
0initial

References

  1. Final Rule for Control of Emissions of Air Pollution from 2004 and Later Model Year Heavy-Duty Highway Engines and Vehicles; Revision of Light-Duty On-Board Diagnostics Requirements. Federal Register; Volume 65, No. 195; 6 October 2000; Rules and Regulations. Available online: https://www.epa.gov/regulations-emissions-vehicles-and-engines/final-rule-control-emissions-air-pollution-2004-and-later (accessed on 13 May 2020).
  2. Kröcher, O.; Elsener, M.; Jacob, E. A model gas study of ammonium formate, methanamide and guanidinium formate as alternative ammonia precursor compounds for the selective catalytic reduction of nitrogen oxides in diesel exhaust gas. Appl. Catal. B Environ. 2009, 88, 66–82. [Google Scholar] [CrossRef]
  3. Johnson, T. Review of diesel emissions and control. SAE Int. J. Fuels Lubr. 2010, 3, 16–29. [Google Scholar] [CrossRef]
  4. Staszak, K.; Wieszczycka, K. Energy Industry. Phys. Sci. Rev. 2018, 3, 20180023. [Google Scholar]
  5. Koebel, M.; Elsener, M.; Kleemann, M. Urea-SCR: A promising technique to reduce NOx emissions from automotive diesel engines. Catal. Today 2000, 59, 335–345. [Google Scholar] [CrossRef]
  6. Ström, H.; Lundström, A.; Andersson, B. Choice of urea-spray models in CFD simulations of urea-SCR systems. Chem. Eng. J. 2009, 150, 69–82. [Google Scholar] [CrossRef]
  7. Ström, L.; Ström, H.; Darnell, A.; Carlsson, P.; Skoglundh, M.; Härelind, H. Quantification of Urea-spray Non-uniformity Effects on the H2-assistedNO Reduction and NH3 Slip over an Ag/Al2O3 Catalyst. Energy Procedia 2015, 75, 2317–2322. [Google Scholar] [CrossRef] [Green Version]
  8. Brack, W.; Heine, B.; Birkhold, F.; Kruse, M.; Schoch, G.; Tischer, S.; Deutschmann, O. Kinetic modeling of urea decomposition based on systematic thermogravimetric analyses of urea and its most important by-products. Chem. Eng. Sci. 2014, 106, 1–8. [Google Scholar] [CrossRef]
  9. Birkhold, F.; Meingast, U.; Wassermann, P.; Deutschmann, O. Analysis of the Injection of Urea-Water-Solution for Automotive SCR DeNOx-Systems: Modeling of Two-Phase Flow and Spray/Wall-Interaction. SAE Tech. Paper 2006, 1, 0643. [Google Scholar]
  10. Birkhold, F. Selektive Katalytische Reduktion von Stickoxiden: Untersuchung der Einspritzung von Harnstoffwasserlösung. Ph.D. Thesis, Fakultät für Maschinenbau, Universität Karlsruhe, Karlsruhe, Germany, 2007. [Google Scholar]
  11. Abu-Ramadan, E.; Saha, K.; Li, X. Modeling the Depleting Mechanism of Urea-Water-Solution Droplet for Automotive Selective Catalytic Reduction System. AIChE J. 2011, 57, 3210–3225. [Google Scholar] [CrossRef]
  12. Lundström, A.; Waldheim, B.; Ström, H.; Westerberg, B. Modelling of urea gas phase thermolysis and theoretical details on urea evaporation. Proc. Inst. Mech. Eng. D-J. Automob. 2011, 225, 1392–1398. [Google Scholar] [CrossRef]
  13. Ebrahimian, V.; Nicolle, A.; Habchi, C. Detailed modeling of the evaporation and thermal decomposition of urea-water solution in SCR Systems. AIChE J. 2012, 58, 1998–2009. [Google Scholar] [CrossRef] [Green Version]
  14. Ferro, D.; Barone, G.; Della Gatta, G.; Piacente, V. Vapour pressures and sublimation enthalpies of urea and some of its derivatives. J. Chem. Thermodyn. 1987, 19, 915–923. [Google Scholar] [CrossRef]
  15. Bernhard, M.; Czekaj, I.; Elsener, M.; Wokaun, A.; Krӧcher, O. Evaporation of urea at atmospheric pressure. J. Phys. Chem. A 2011, 115, 2581–2589. [Google Scholar] [CrossRef] [PubMed]
  16. Perry, R.H.; Green, D.W. Perry’s Chemical Engineers’ Handbook; McGraw-Hill: New York, NY, USA, 2008. [Google Scholar]
  17. Perman, E.P.; Lovett, T. Vapour pressure and heat dilution of aqueous solutions. Trans. Faraday Soc. 1926, 22, 1–19. [Google Scholar] [CrossRef]
  18. Wang, T.J.; Baek, S.W.; Lee, S.Y.; Kang, D.H.; Yeo, G.K. Experimental investigation on evaporation of urea–water-solution droplet for SCR applications. AIChE J. 2009, 55, 3267–3276. [Google Scholar] [CrossRef]
  19. Yaws, C.L. Yaws’ Critical Property Data for Chemical Engineers and Chemists; Knovel: New York, NY, USA, 2012. [Google Scholar]
  20. Yaws, C.L. Yaws’ Thermophysical Properties of Chemicals and Hydrocarbons; Knovel: New York, NY, USA, 2010. [Google Scholar]
  21. Yaws, C.L. Yaws’ Handbook of Properties of the Chemical Elements; Knovel: New York, NY, USA, 2011. [Google Scholar]
  22. Available online: http://ddbonline.ddbst.de/AntoineCalculation/AntoineCalculationCGI.exe?component=Water (accessed on 13 May 2020).
  23. Emelyaneko, V.N.; Kabo, G.J.; Verevkin, S.P. Measurement and prediction of thermochemical properties: Improved increments for the estimation of enthalpies of sublimation and standard enthalpies of formation of akryl derivatives of urea. J. Chem. Eng. Data 2006, 51, 79–87. [Google Scholar] [CrossRef]
  24. Yim, S.D.; Kim, S.J.; Baik, J.H.; Nam, I.; Mok, Y.S.; Lee, J.H.; Cho, B.K.; Oh, S.H. Decomposition of urea into NH3 for the SCR process. Ind. Eng. Chem. Res. 2004, 43, 4856–4863. [Google Scholar] [CrossRef]
  25. Kim, H.-S.; Kasipandi, S.; Kim, J.; Kang, S.-H.; Kim, J.-H.; Ryu, J.-H.; Bae, J.-W. Current Catalyst Technology of Selective Catalytic Reduction (SCR) for NOx Removal in South Korea. Catalysts 2020, 10, 52. [Google Scholar] [CrossRef] [Green Version]
Figure 1. Typical urea-based selective catalytic reduction (SCR) system in the exhaust pipe.
Catalysts 10 00749 g001
Figure 2. Comparison of saturated vapor pressure used in the references [10,11,12,13,14,15] with experimental results.
Catalysts 10 00749 g002
Figure 3. Comparison of saturation pressure curves.
Catalysts 10 00749 g003
Figure 4. Vapor liquid equilibrium (VLE) results comparison.
Catalysts 10 00749 g004
Figure 5. T–xy chart for urea–water system.
Catalysts 10 00749 g005
Figure 6. Mesh refinement and temperature profile of the urea–water solution behavior (UWS) droplet.
Catalysts 10 00749 g006
Figure 7. Evolution of square droplet diameter: results comparison (black line—model, blue points—literature date from [18]).
Catalysts 10 00749 g007
Figure 8. Comparison of the results from the application of nonrandom two liquids (NRTL) model and Raoult’s law.
Catalysts 10 00749 g008
Table 1. Fitted Antoine equation parameters.
ParameterABC
Value4.60341150
Table 2. Binary interaction parameters for NRTL equations for the urea–water system.
Parameteraijajibijbjiαcij
Value2.538−1.430−2.8910.5390.30
Table 3. Methods of calculating the physical properties of mixed gas and liquids used in this work.
ParameterGas PhaseDroplet (Liquid Phase)
Density ρ g = P R T i Y i M w , i (19) ρ d = 1 i Y i ρ i (20)
Viscosity μ g = i X i μ i j X j Φ i j (21) μ d = i Y i μ i (22)
Thermal conductivity k g = i X i k i j X j Φ i j (23) k d = i Y i k i (24)
Specific heat c p , g = i Y i c p , i (25) c p , d = i Y i c p , i (26)
Diffusion coefficient D i j = 0.00188 ( T 3 ( 1 M w , i + 1 M w , j ) ) 1 / 2 P a b s σ i j 2 Ω D (27)
Table 4. Sources physical of gaseous and liquid materials used in the study.
PropertyGasSourceLiquidSource
Thermal conductivity viscosity specific heatNitrogen[21]Water[19]
Oxygen[21]Urea[19]
Carbon Dioxide[19]
Water[19]
Urea[19]
Ammonia[19]
Isocyanic acidKinetic theory

