Article

Carbide-Modified Pd on ZrO2 as Active Phase for CO2-Reforming of Methane—A Model Phase Boundary Approach

1
Institute of Physical Chemistry, University of Innsbruck, Innrain 52 c, A-6020 Innsbruck, Austria
2
Institute of Applied Physics, TU Wien, Wiedner Hauptstr. 8-10/134, 1040 Wien, Austria
3
Fritz-Haber-Institut der Max-Planck-Gesellschaft, Anorganische Chemie, Faradayweg 4–6, D-14195 Berlin, Germany
4
Helmholtz-Zentrum Berlin für Materialien und Energie GmbH, BESSY II, Albert-Einstein-Straße 15, D-10623 Berlin, Germany
5
Max Planck Institute for Chemical Energy Conversion, Department of Heterogeneous Reactions, Stiftstraße 34-36, D-45470 Mülheim an der Ruhr, Germany
6
Institut für Werkstoffwissenschaften und -technologien, Fachgebiet Keramische Werkstoffe, Technische Universität Berlin, D-10623 Berlin, Germany
7
Advanced Light Source, Lawrence Berkeley National Laboratory, Berkeley, CA 94720, USA
8
Scientific Center for Optical and Electron Microscopy, ScopeM, ETH Zürich, 8093 Zürich, Switzerland
*
Author to whom correspondence should be addressed.
Catalysts 2020, 10(9), 1000; https://doi.org/10.3390/catal10091000
Submission received: 13 July 2020 / Revised: 21 August 2020 / Accepted: 24 August 2020 / Published: 2 September 2020
(This article belongs to the Special Issue Palladium-Catalyzed Reactions)

Abstract

:
Starting from subsurface Zr0-doped “inverse” Pd and bulk-intermetallic Pd0Zr0 model catalyst precursors, we investigated the dry reforming reaction of methane (DRM) using synchrotron-based near ambient pressure in-situ X-ray photoelectron spectroscopy (NAP-XPS), in-situ X-ray diffraction and catalytic testing in an ultrahigh-vacuum-compatible recirculating batch reactor cell. Both intermetallic precursors develop a Pd0–ZrO2 phase boundary under realistic DRM conditions, whereby the oxidative segregation of ZrO2 from bulk intermetallic PdxZry leads to a highly active composite layer of carbide-modified Pd0 metal nanoparticles in contact with tetragonal ZrO2. This active state exhibits reaction rates exceeding those of a conventional supported Pd–ZrO2 reference catalyst and its high activity is unambiguously linked to the fast conversion of the highly reactive carbidic/dissolved C-species inside Pd0 toward CO at the Pd/ZrO2 phase boundary, which serves the role of providing efficient CO2 activation sites. In contrast, the near-surface intermetallic precursor decomposes toward ZrO2 islands at the surface of a quasi-infinite Pd0 metal bulk. Strongly delayed Pd carbide accumulation and thus carbon resegregation under reaction conditions leads to a much less active interfacial ZrO2–Pd0 state.

1. Introduction

Among multiple worldwide and local approaches and strategies toward the mitigation of global warming, the methane dry reforming reaction (DRM) is regarded as a potential method to simultaneously deal with the two major climate-harming greenhouse gases, methane and carbon dioxide, and to further convert them to useful syngas following the reaction CH4 + CO2 → 2H2 + 2CO. At 100% selectivity, a H2:CO = 1:1 ratio is obtained, which is directly suitable for follow-up reactions like carbonylation or hydro-formylation processes [1,2,3]. Higher H2 contents can in principle be achieved via membrane reactor operation or a combination with the water-gas shift reaction and/or methane steam reforming to attain the optimum H2/CO ratio of 2 required for the synthesis of renewable fuels [4,5]. In this respect, loss of H2 selectivity at elevated pressures due to the water-gas shift equilibrium [6], as well as coking issues, especially on Ni-based catalysts [7,8,9,10], represent the major application-oriented obstacles.
From a fundamental scientific viewpoint, a group of highly active catalysts on noble metal basis exhibiting enhanced coking resilience deserve particular attention [8,9,11,12,13,14,15,16,17]. In a recent near-ambient-pressure in-situ X-ray photoelectron spectroscopy (NAP-XPS) study of our group, the particular anti-coking and carbon-converting role of the Pd/ZrO2 phase boundary was highlighted [18]. Empirically, attempts to enhance the Ni coking resistance, while simultaneously keeping a high activity, yielded promising bimetallic DRM catalysts. In this respect, the NiPd/ZrO2 system stood out, particularly in terms of the desired combination of excellent catalytic performance and coking resistance [19]. However, despite the promising empirical data that have been compiled on the latter, the mechanistic benefit of alloying of Ni especially with Pd has not been resolved yet. Regarding the methane-activating role of the intermetallic component, ensemble and electronic structure effects at the bimetallic surface are conceivable [20,21,22,23,24], whereas for the potential mechanistic role of intermetallic–oxidic phase boundary sites different levels of metal–oxide bi-functional synergisms can be anticipated, which essentially depend on the intrinsic activities of the individual alloy components toward CO2 and CH4 [15]. Focusing on a potential mechanistic difference between Ni and Pd, pure Ni surfaces are in principle capable of simultaneous CH4 and CO2 activation [24,25,26,27], which might be interpreted in terms of a less prominent co-catalytic role of the Ni–support interface, especially on rather inert supports. Conversely, the degree of bi-functional operation can be steered by different degrees of alloying of Ni with an outstanding methane activator such as Pd, which exhibits at the same time inferior carbon dioxide activation properties in its pure state [15,28,29]. Consequently, in the limiting “pure Pd case,” the promotion of CO2 activation and subsequent CO product formation requires particularly active and abundant oxide support–Pd interface sites, which are therefore essential for a high dry reforming activity.
As a general strategy derived from these considerations, the knowledge-based empirical development of DRM catalyst preparation should aim at an extended (bi)metal–oxide interface with superior methane activation properties at the intermetallic and superior carbon dioxide activation kinetics at the oxidic component. For the latter, surface reducibility toward CO2-activating vacancy sites and/or reactivity of a basic oxidic component toward CO2 to form reactive carbonate species under reaction conditions are specifically important catalyst optimization parameters [30,31,32].
To unravel mechanistic details of a catalytically operating (bi)metal–oxide interface, the use of model systems is highly advantageous, especially if further steps to close the material’s gap, that is, the transfer of mechanistic ideas to technologically more relevant catalyst materials, are attempted. With respect to studies employing intermetallic precatalyst samples, bulk intermetallic compounds can be partially or quantitatively decomposed toward metal–oxide systems, e.g., using leaching techniques-prior to reaction [33], yielding supported powder catalysts, or subjected to in-situ activation in the respective reaction atmosphere. The latter approach is a particularly efficient way to generate a large amount of phase-boundary sites, as has been shown both for the Cu–Zr and Pd–Zr systems [34]. Especially the near-surface regions of a bulk Pd–Zr precatalyst are oxidatively decomposed under realistic DRM conditions, whereby the resulting Pd0 nanoparticles provide an appropriate near-surface carbon loading at the resulting Pd0 nanoparticle/ZrO2 interface. This favors fast supply of reactive carbon atoms toward the phase boundary, whereas redox-active Zr sites assist in CO2 activation and the transfer of CO2-derived oxygen to the latter [18]. In contrast, it has also been shown that a CVD-prepared Zr0 subsurface alloy state on a Pd foil was only slightly more active than its individual components ZrO2 and Pd0 [35].
If this “in-situ corrosive” activation is limited to near-surface regions and does not suppress the electric conductivity of the 3D corrosion layers below XPS-compatible levels, the resulting system will still encompass the electronic advantages of fully bulk-metal-based “inverse” ultrahigh-vacuum (UHV) model systems, thus allowing for in-situ spectroscopic characterization with vacuum-based electron spectroscopic techniques without charging. Nevertheless, the selectively corroded top layers consist typically of a quasi-3-dimensional oxide–metal composite, which resembles a supported catalyst quite closely.
This “intermetallic precursor” concept is somewhat complementary to the ex-solution behavior of complex oxide materials such as perovskites, which—especially under reductive treatments—show ex-solution of metallic nanoparticles and the formation of a catalytically operating three-dimensional interface on top of an oxidic material. Both approaches provide additional pylons supporting the materials-gap-spanning bridge the between UHV/bulk-metal-based “inverse” model catalysts and technologically used powder catalysts.
In the present work, we exemplify this strategy for the Pd–Zr system in the methane dry reforming reaction—a Pd-metal-foil-based subsurface Zr–Pd alloy model system will be directly compared to a bulk-intermetallic Pd–Zr intermetallic phase and a conventionally prepared, supported Pd/ZrO2 reference catalyst.
Clearly, the detailed understanding and directional steering of the material-specific carbon chemistry is one of the pending issues in the development of prospective DRM catalyst materials, as coking is the most limiting factor in the catalyst lifetime. Various ways of controlling coke formation and optimizing its conversion are discussed. Among others, these include efficient gasification of coke, for example, by addition of water to the feed, adjustment of the surface chemical properties of support materials with respect to basicity, redox activity and oxygen storage capacity, control of nanoparticle size and interfacial stabilization (including exploiting metal-support interaction effects), directional alloying to suppress nucleation and growth of graphitic and/or carbon nanotube (CNT)-type species, redox-cycling for intermediate coke abatement, catalyst passivation by sulphur and the addition of H2 and/or H2O to the feed to suppress thermal gas phase composition of methane and other small hydrocarbons. A comprehensive review of these strategies is provided in Reference [36]. However, much more detailed knowledge about the growth, reactivity and lifetime of the distinct carbon species or carbonaceous deposits can expected from in-situ model catalyst studies under realistic reaction conditions. Hence, we provide a detailed in-situ XPS analysis focusing on the synopsis of all core-level trends of the involved elements Zr, Pd, C and O and attempt to bridge the materials gap completely by including the comparative assessment of a technologically relevant Pd/ZrO2 catalyst.
In-situ spectroscopic and structure-determining methods such as synchrotron-based near ambient pressure XPS (NAP-XPS at HZB/BESSY II) and in-situ X-ray diffraction (XRD) (at ALS/Berkeley) were used to achieve complementary characterization of bulk-related phase changes vs. the active surface/interface state of the working catalyst in a realistic DRM atmosphere.

2. Results and Discussion

2.1. Precatalyst Characterization

2.1.1. CVD Process toward the Pd(111) and Pd Foil-Based Subsurface Zr0–Pd Alloy Precatalysts

Figure 1 shows the thermal evolution of the ZrOx layer prepared by chemical vapor deposition (CVD; decomposition of Zirconium (IV) tert-butoxide at 400 °C, see Section 3.1) on Pd(111) upon annealing in ultrahigh vacuum (UHV base pressure < 1 × 10⁻¹⁰ mbar). The initial as-prepared CVD state shows a mix of bulk- and ultrathin zirconia and already a minor contribution of intermetallic Zr0 but no remaining C from the precursor, as evidenced by the absence of any C 1s intensity (not shown). The subsequent intermediate stages of annealing show a decrease of the ZrOx components and finally the full conversion of the last remaining ultrathin oxide patches to Zr0, leaving a purely bimetallic (alloyed) state behind after a total time of 40 min at 450 °C.
XPS quantification of panel B (annealed 10 min at 400 °C) revealed that ≈31% of the Zr 3d signal originate from deposited Zr was fully reduced and alloyed with the Pd(111) substrate (binding energy BE = 179.6 eV, very similar to Zr in Pt3Zr [37,38]. Another 25.5% of the Zr signal originate from bulk-like ZrO2 (BE ≈ 182.8 eV when slightly substoichiometric [39]) and the remaining 43.5% are present in the form of the ultrathin zirconia film (BE = 180.9 eV [37]). In contrast to previous work [37,40,41], newer results indicate that oxygen-deficient ultra-thin ZrOx is obtained by reduction of ZrO2 on Pt(111), Rh(111) and Ru(0001) [42], different from the previously assumed stoichiometric ZrO2 “trilayer” film [37,40,41]. The intermediate occurrence of related substoichiometric ZrOx films (Figure 1a–d, green component) appears also likely for our Pd substrates.
The scanning tunneling microscopy (STM)-observed structure of the final annealing state after 50 min at 450 °C corresponding to panel (e) of Figure 1 is shown in Reference [35]. It is strongly reminiscent of a previously described subsurface V/Pd(111) alloy [43], as it also exhibits a modified Pd (1 × 1) base lattice with similar chemical contrast phenomena and apparent height modulations. The latter are likely due to the variable local presence of subsurface Zr0. The proof of its fully subsurface Zr0-converted nature via low-energy ion scattering (LEIS) is also provided in Reference [35]. In combination with the XPS data of Figure 1e, showing exclusively metallic Zr0, the LEIS data provide unambiguous experimental evidence for the absence of any Zr species in the topmost metal layer or in oxidic surface layers.
Generally, the reduction to and dissolution of Zr0 appears to be kinetically enhanced by the continuous removal of oxygen atoms resulting from the zirconia decay at the extended zirconia-metal interface under the effectively strongly reducing, non-equilibrium UHV conditions. Thermodynamically, the high enthalpy of Zr0 dissolution is helpful for dissolving it in the Pd bulk, as well as the availability of a large Pd bulk volume leading to a positive dissolution entropy change, especially in case of “deep” dissolution. In 3D bulk alloys, the coordination of Zr0 with Pd and Pt is energetically strongly favorable [44].
We further emphasize that all Zr0 species, irrespective of their structural environment prior to DRM, become quantitatively oxidized under DRM reaction conditions toward an active state involving only Zr+4 species at the surface, as will be shown in the context of the NAP-XP spectra discussed in Section 3.2.1. This implies that the clarification of the exact location of the Zr0 atoms is catalytically not crucial. A detailed microstructural characterization of the intermediate and final annealing states will thus become part of an independent study based on DFT (density functional theory) and STM.
In view of catalytic relevance, the fully subsurface-Zr0 reduced state (panel (e) in Figure 1) was chosen as the most suitable precatalyst due to its higher structural uniformity and the rather isotropic electronic modification of potential Pd active sites by bulk- and subsurface-dispersed Zr0. This high atomic dispersion was also regarded as a useful prerequisite for in-situ growth of equally dispersed oxidized Zr species under reaction conditions, with the expectation of a maximized Pd–ZrOx phase boundary induced by the reaction. For the catalytic DRM tests both in the combined XPS—high-pressure batch reactor setup (cf. Section 3.2.2) and in the NAP-XPS system at BESSY II (cf. Section 3.2.5), the subsurface Zr0–Pd alloy was prepared on a Pd foil using the identical preparation conditions as used for Pd(111). The reproducible formation of a fully bimetallic subsurface Zr0 state was again only achieved under excellent UHV conditions and could also be verified via the above-discussed combination of XPS and LEIS (data not shown). In essence, the preparation routines on the single- and polycrystalline substrates were found to be fully compatible.

2.1.2. Characterization of the PdxZry Bulk-Intermetallic Precatalyst

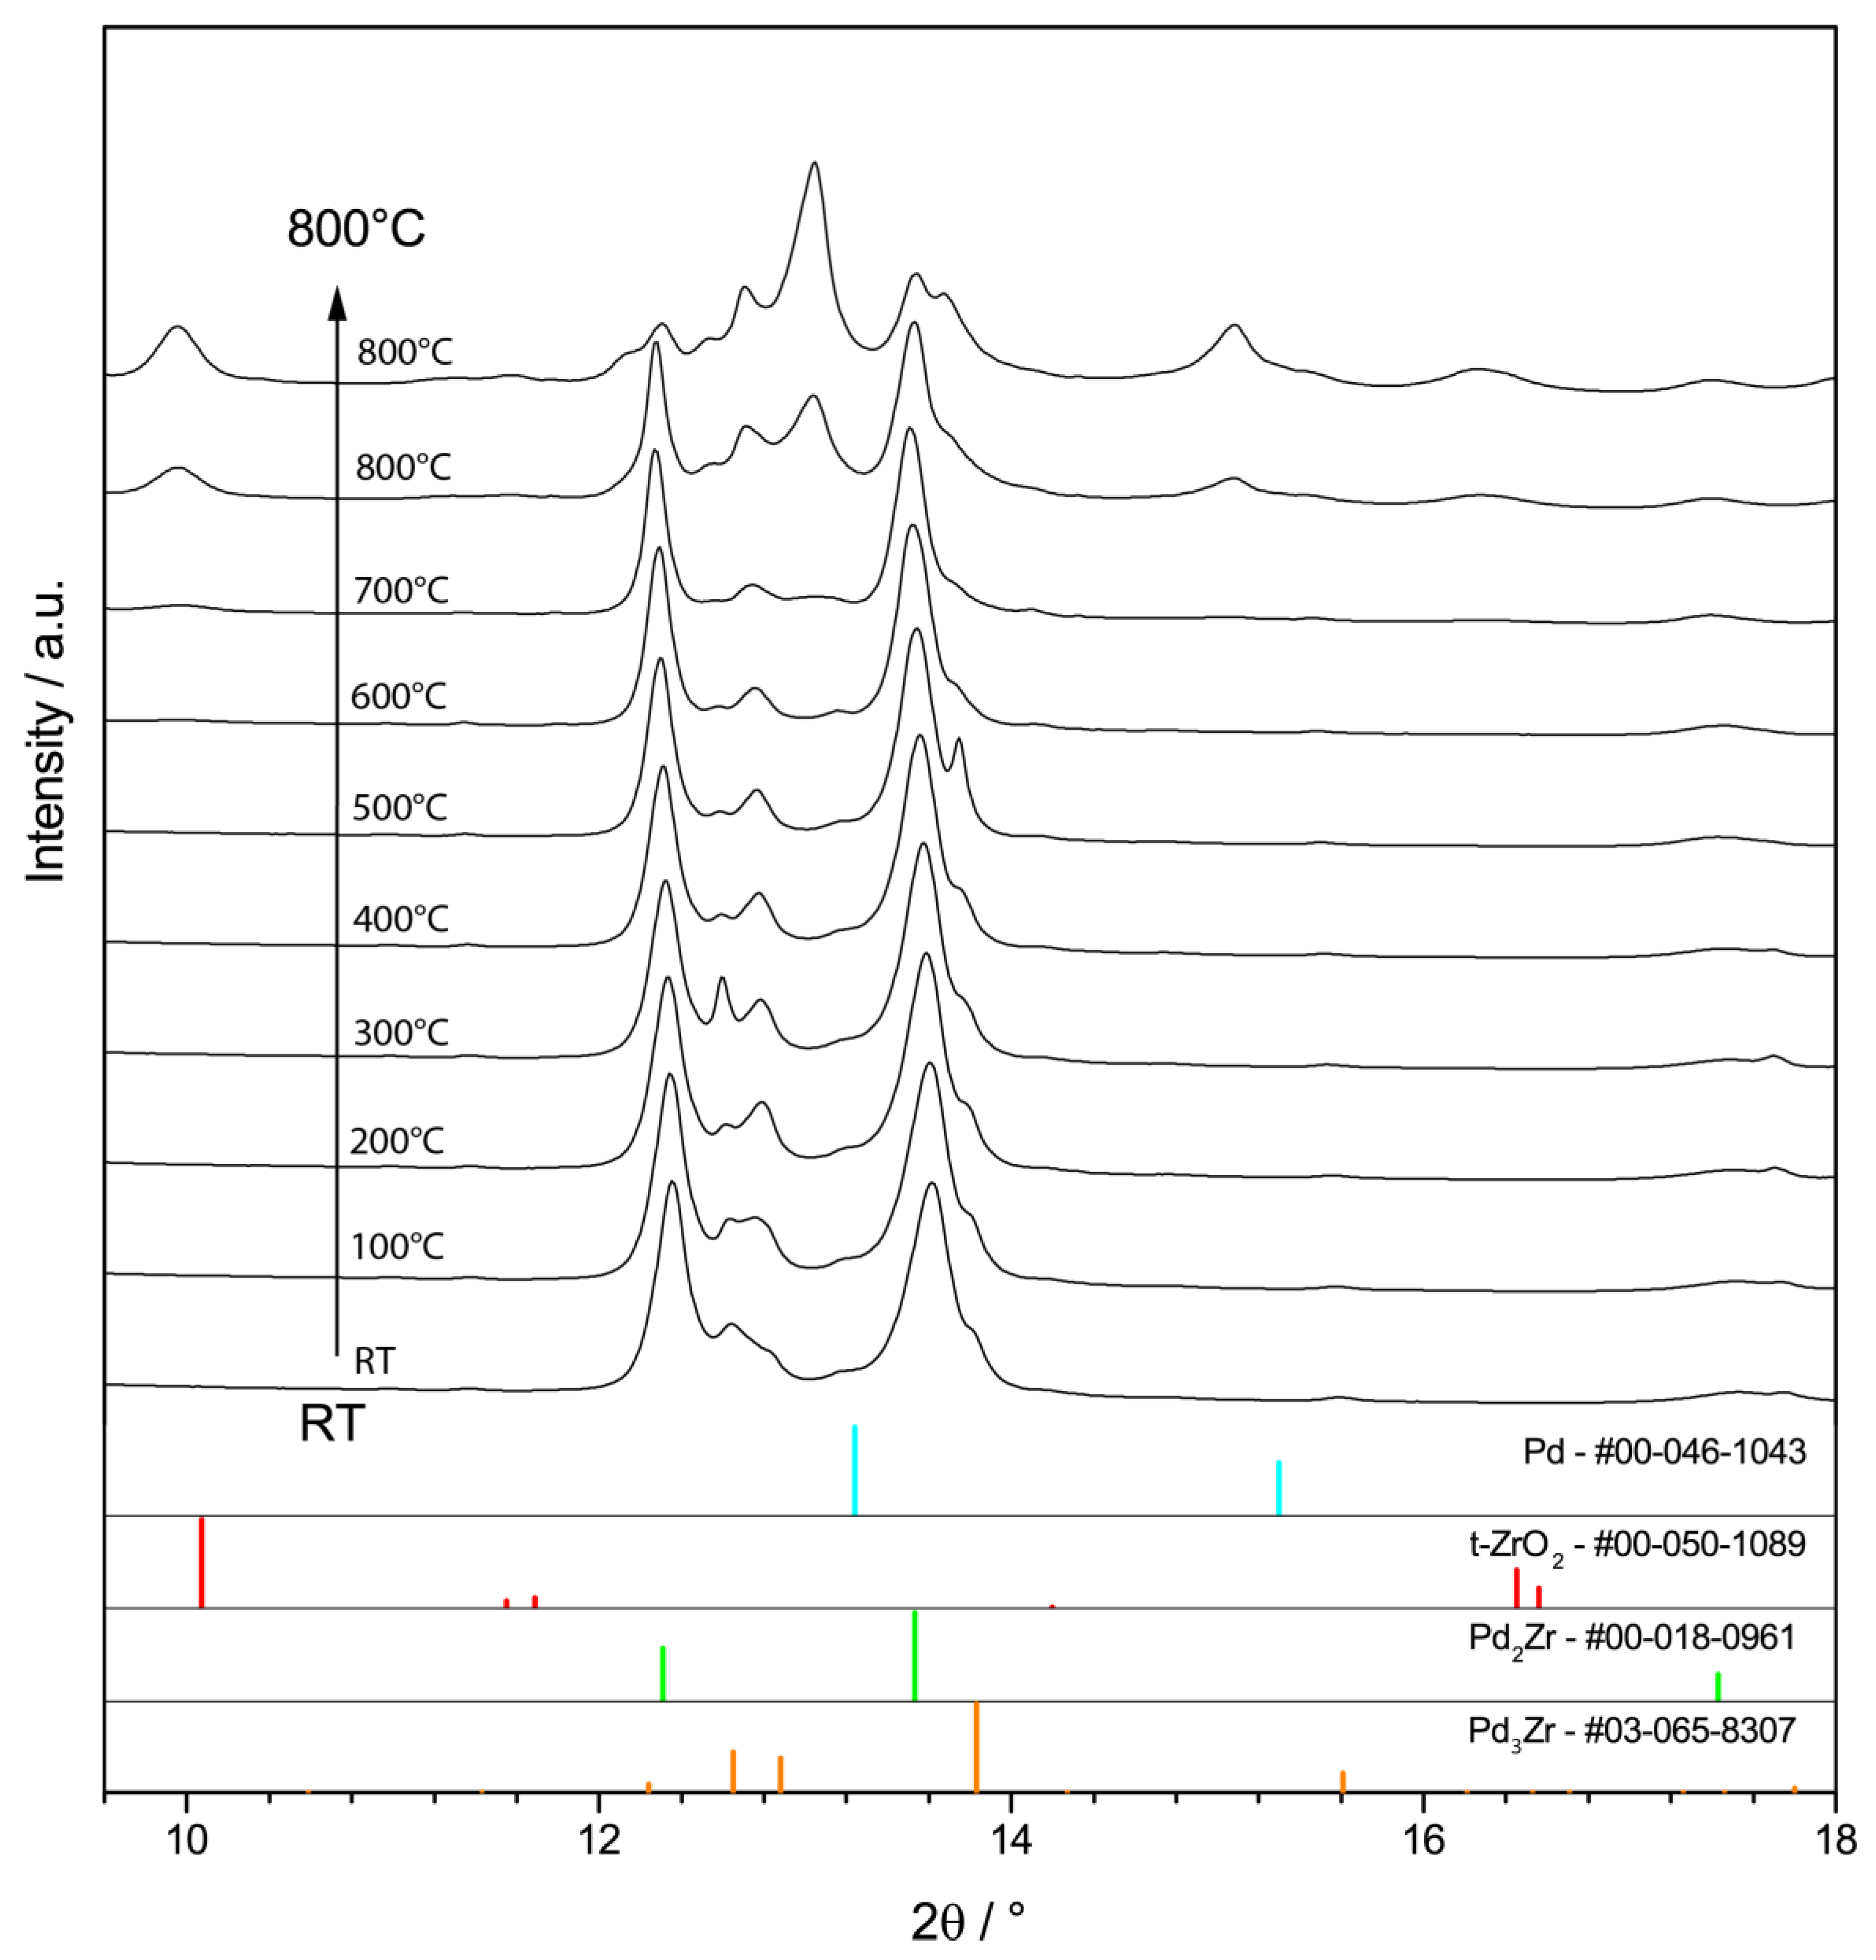
In contrast to the Zr0–Pd subsurface alloy, which was prepared under excellent UHV conditions as described in the section above, the co-melted bulk-intermetallic precatalyst was prepared under high-vacuum conditions (base pressure ~10−7 mbar), transferred in a Schlenk flask in inert gas atmosphere and finally transferred through ambient air into the in-situ NAP-XPS chamber at BESSY II (cf. Section 3.2.5). Figure 2a displays the Pd 3d5/2, Zr 3d, C 1s and O 1s core level spectra of this precatalyst. Despite the dominance of Zr+4 species in the Zr 3d region, the intermetallic Zr0 component is clearly visible at a BE of 179.6 eV [37,38]. Obviously, the short contact to the ambient during transfer to the NAP-XPS chamber already caused environmental corrosion of bimetallic Zr0 toward bulk-like Zr+4Ox at the surface. In contrast, the Zr0–Pd foil subsurface alloy sample (cf. Section 2.1.1) exhibited a lower degree of oxidative Zr segregation after the similar transfer procedure (cf. NAP-XPS data discussed in Section 2.3.1, “as-prepared” spectra), probably due to the subsurface location of Zr0 protected by the pure Pd top layer. In the Pd 3d region, only metallic Pd is observed on the PdxZry bulk-intermetallic precatalyst at a BE of 335.0 eV (we note that the Pd 3d5/2 region is superimposed by the second harmonic component of the O 1s signal at a nominal BE of 333.5 eV). In the C 1s region, a certain amount of graphite-type C is already present before DRM. The XRD data of Figure 2b reveal the coexistence of the intermetallic phases Pd3Zr and Pd2Zr in the sample bulk and the absence of XRD-detectable amounts of Pd metal and/or ZrO2 phases.

2.1.3. Characterization of the Supported Pd–ZrO2 Powder Catalyst

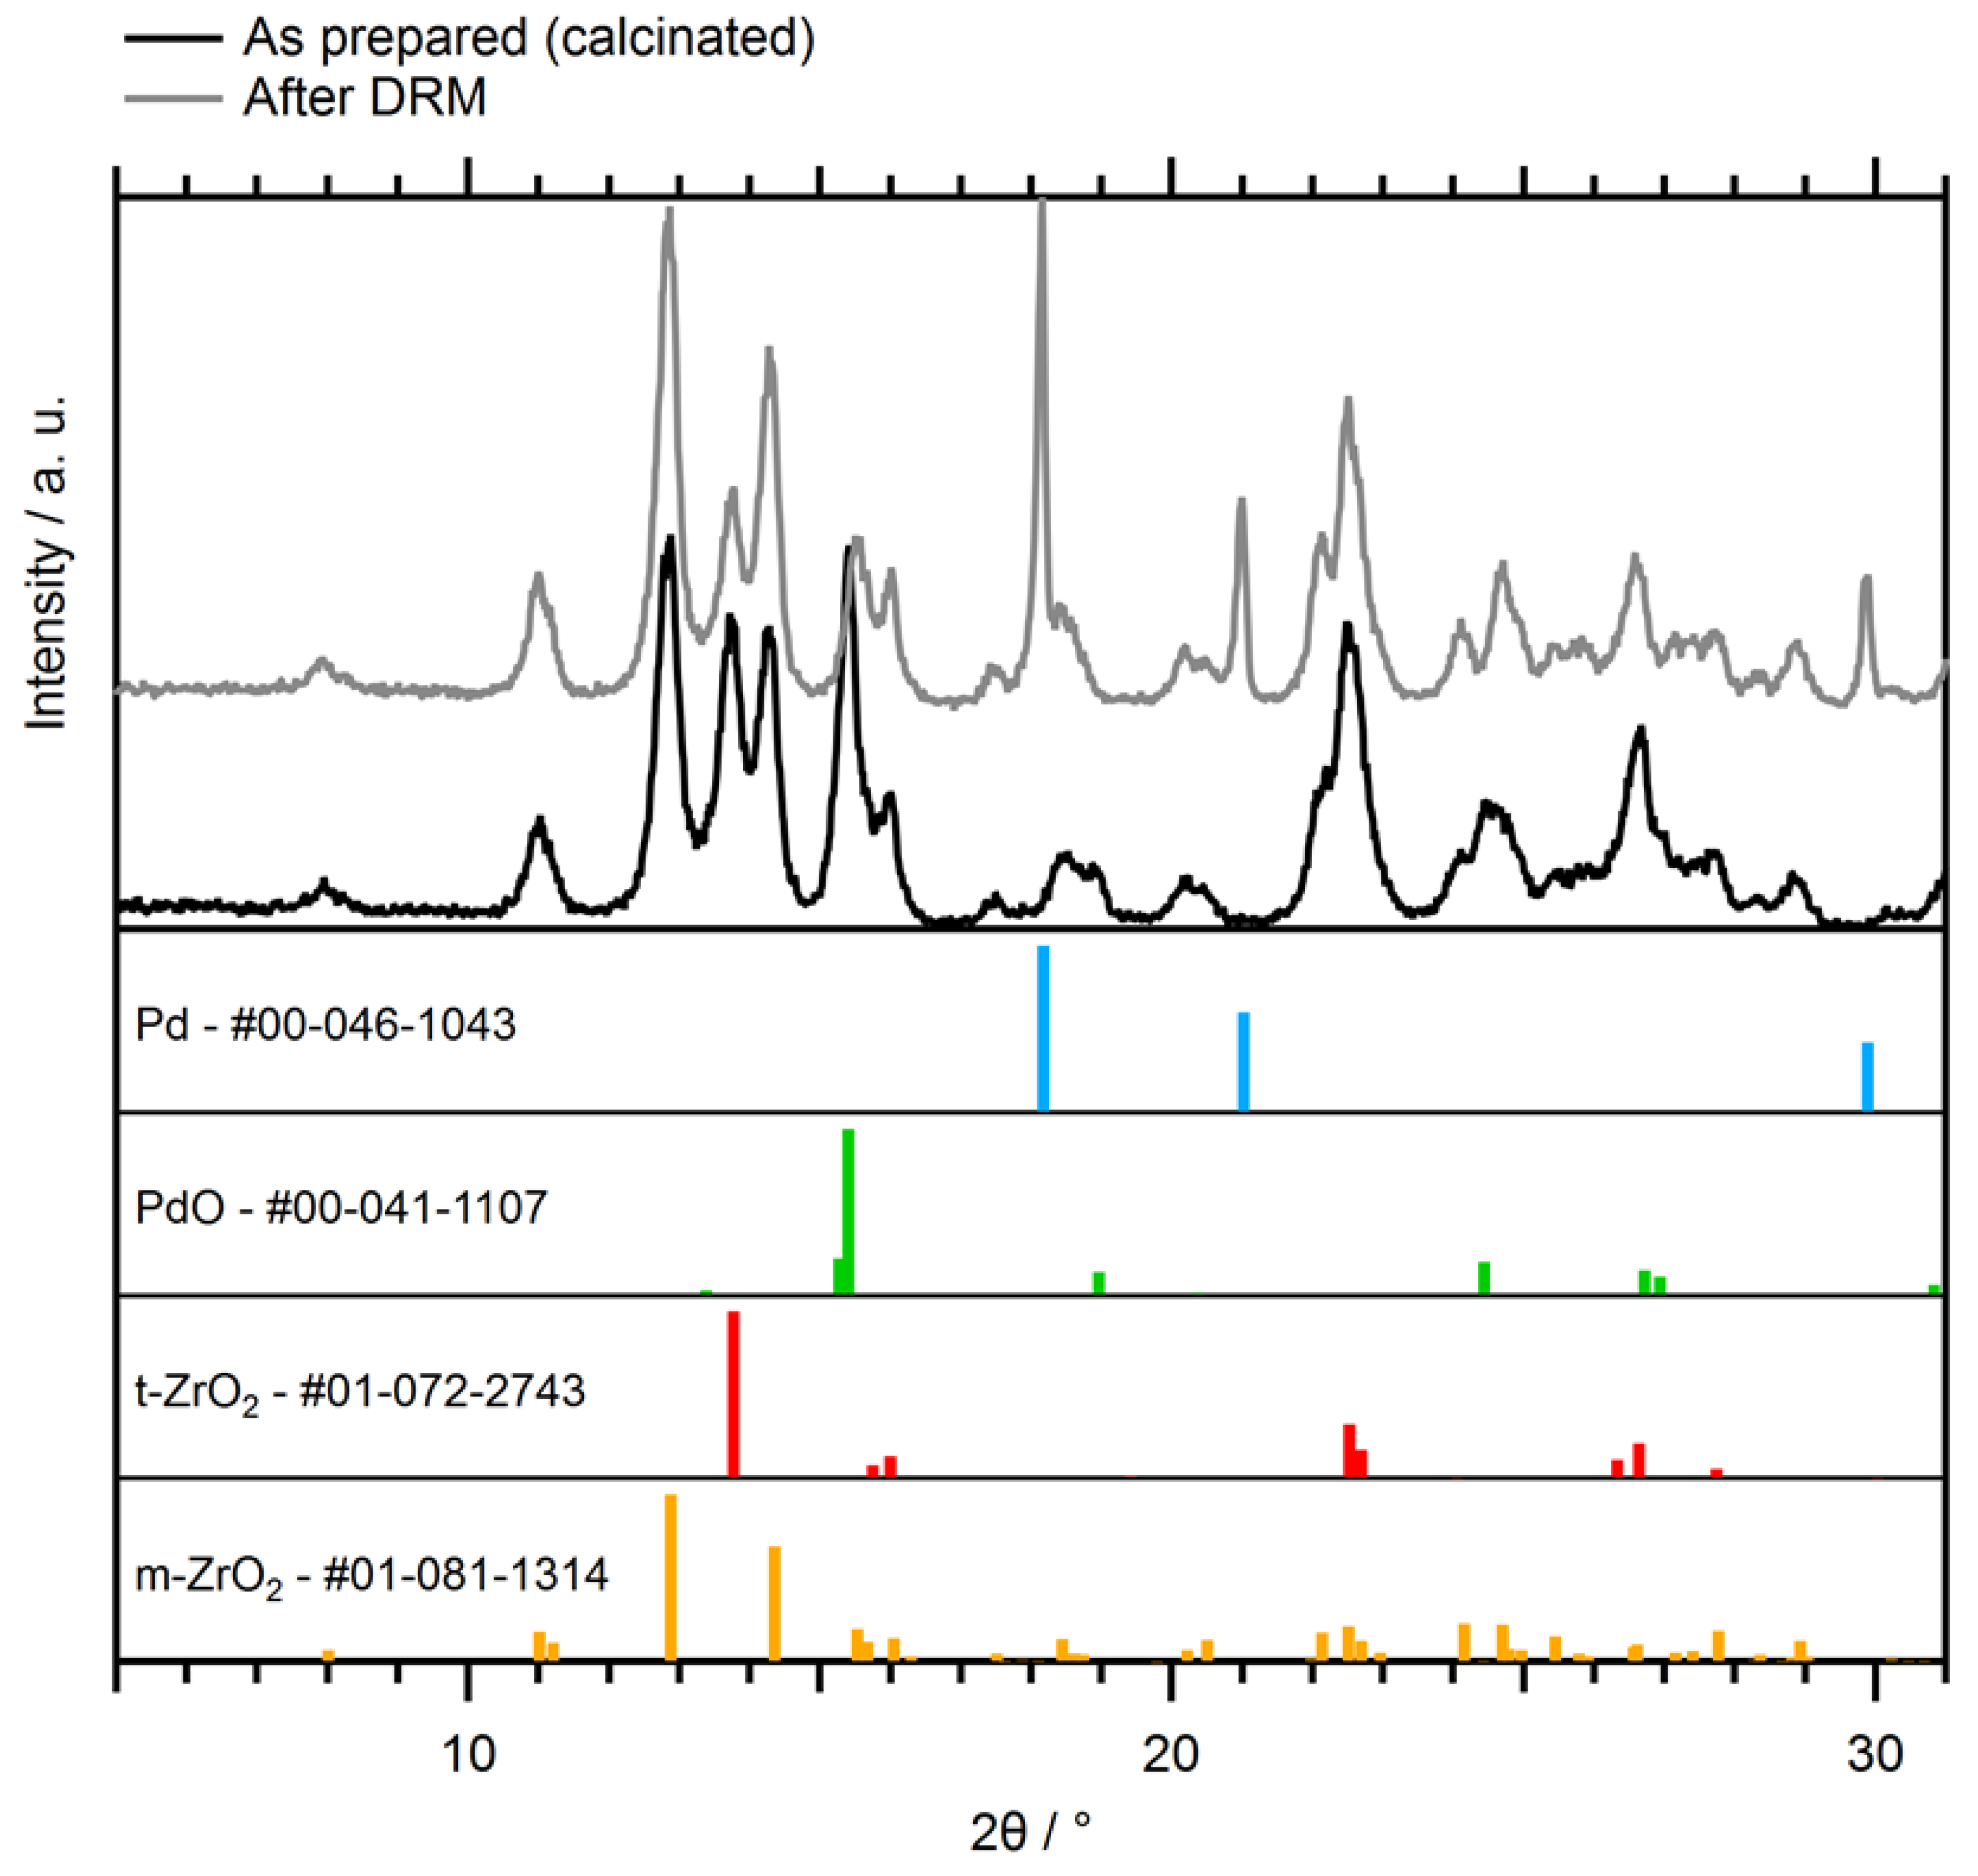
Figure 3 shows the ex-situ XRD data obtained on the supported reference catalyst after calcination and before H2 reduction, as well as the post-DRM state.
After calcination, a mixture of monoclinic and tetragonal ZrO2 species is present, together with PdO but no Pd metal is detectable. Already after H2 prereduction at 600 °C in 1 bar pure H2 for 1h, full conversion of PdO to Pd0 was obtained (not shown, practically identical to the post-DRM diffractogram). The fully metallic state of Pd is not changed by the DRM reaction (light gray diffractogram). After 5 DRM cycles to 800 °C, ZrO2 appears to contain a larger fraction of the thermodynamically stable monoclinic polymorph, as can be deduced from the changed intensity ratio of the main reflections of the two coexisting phases at 12.87 and 13.77°.
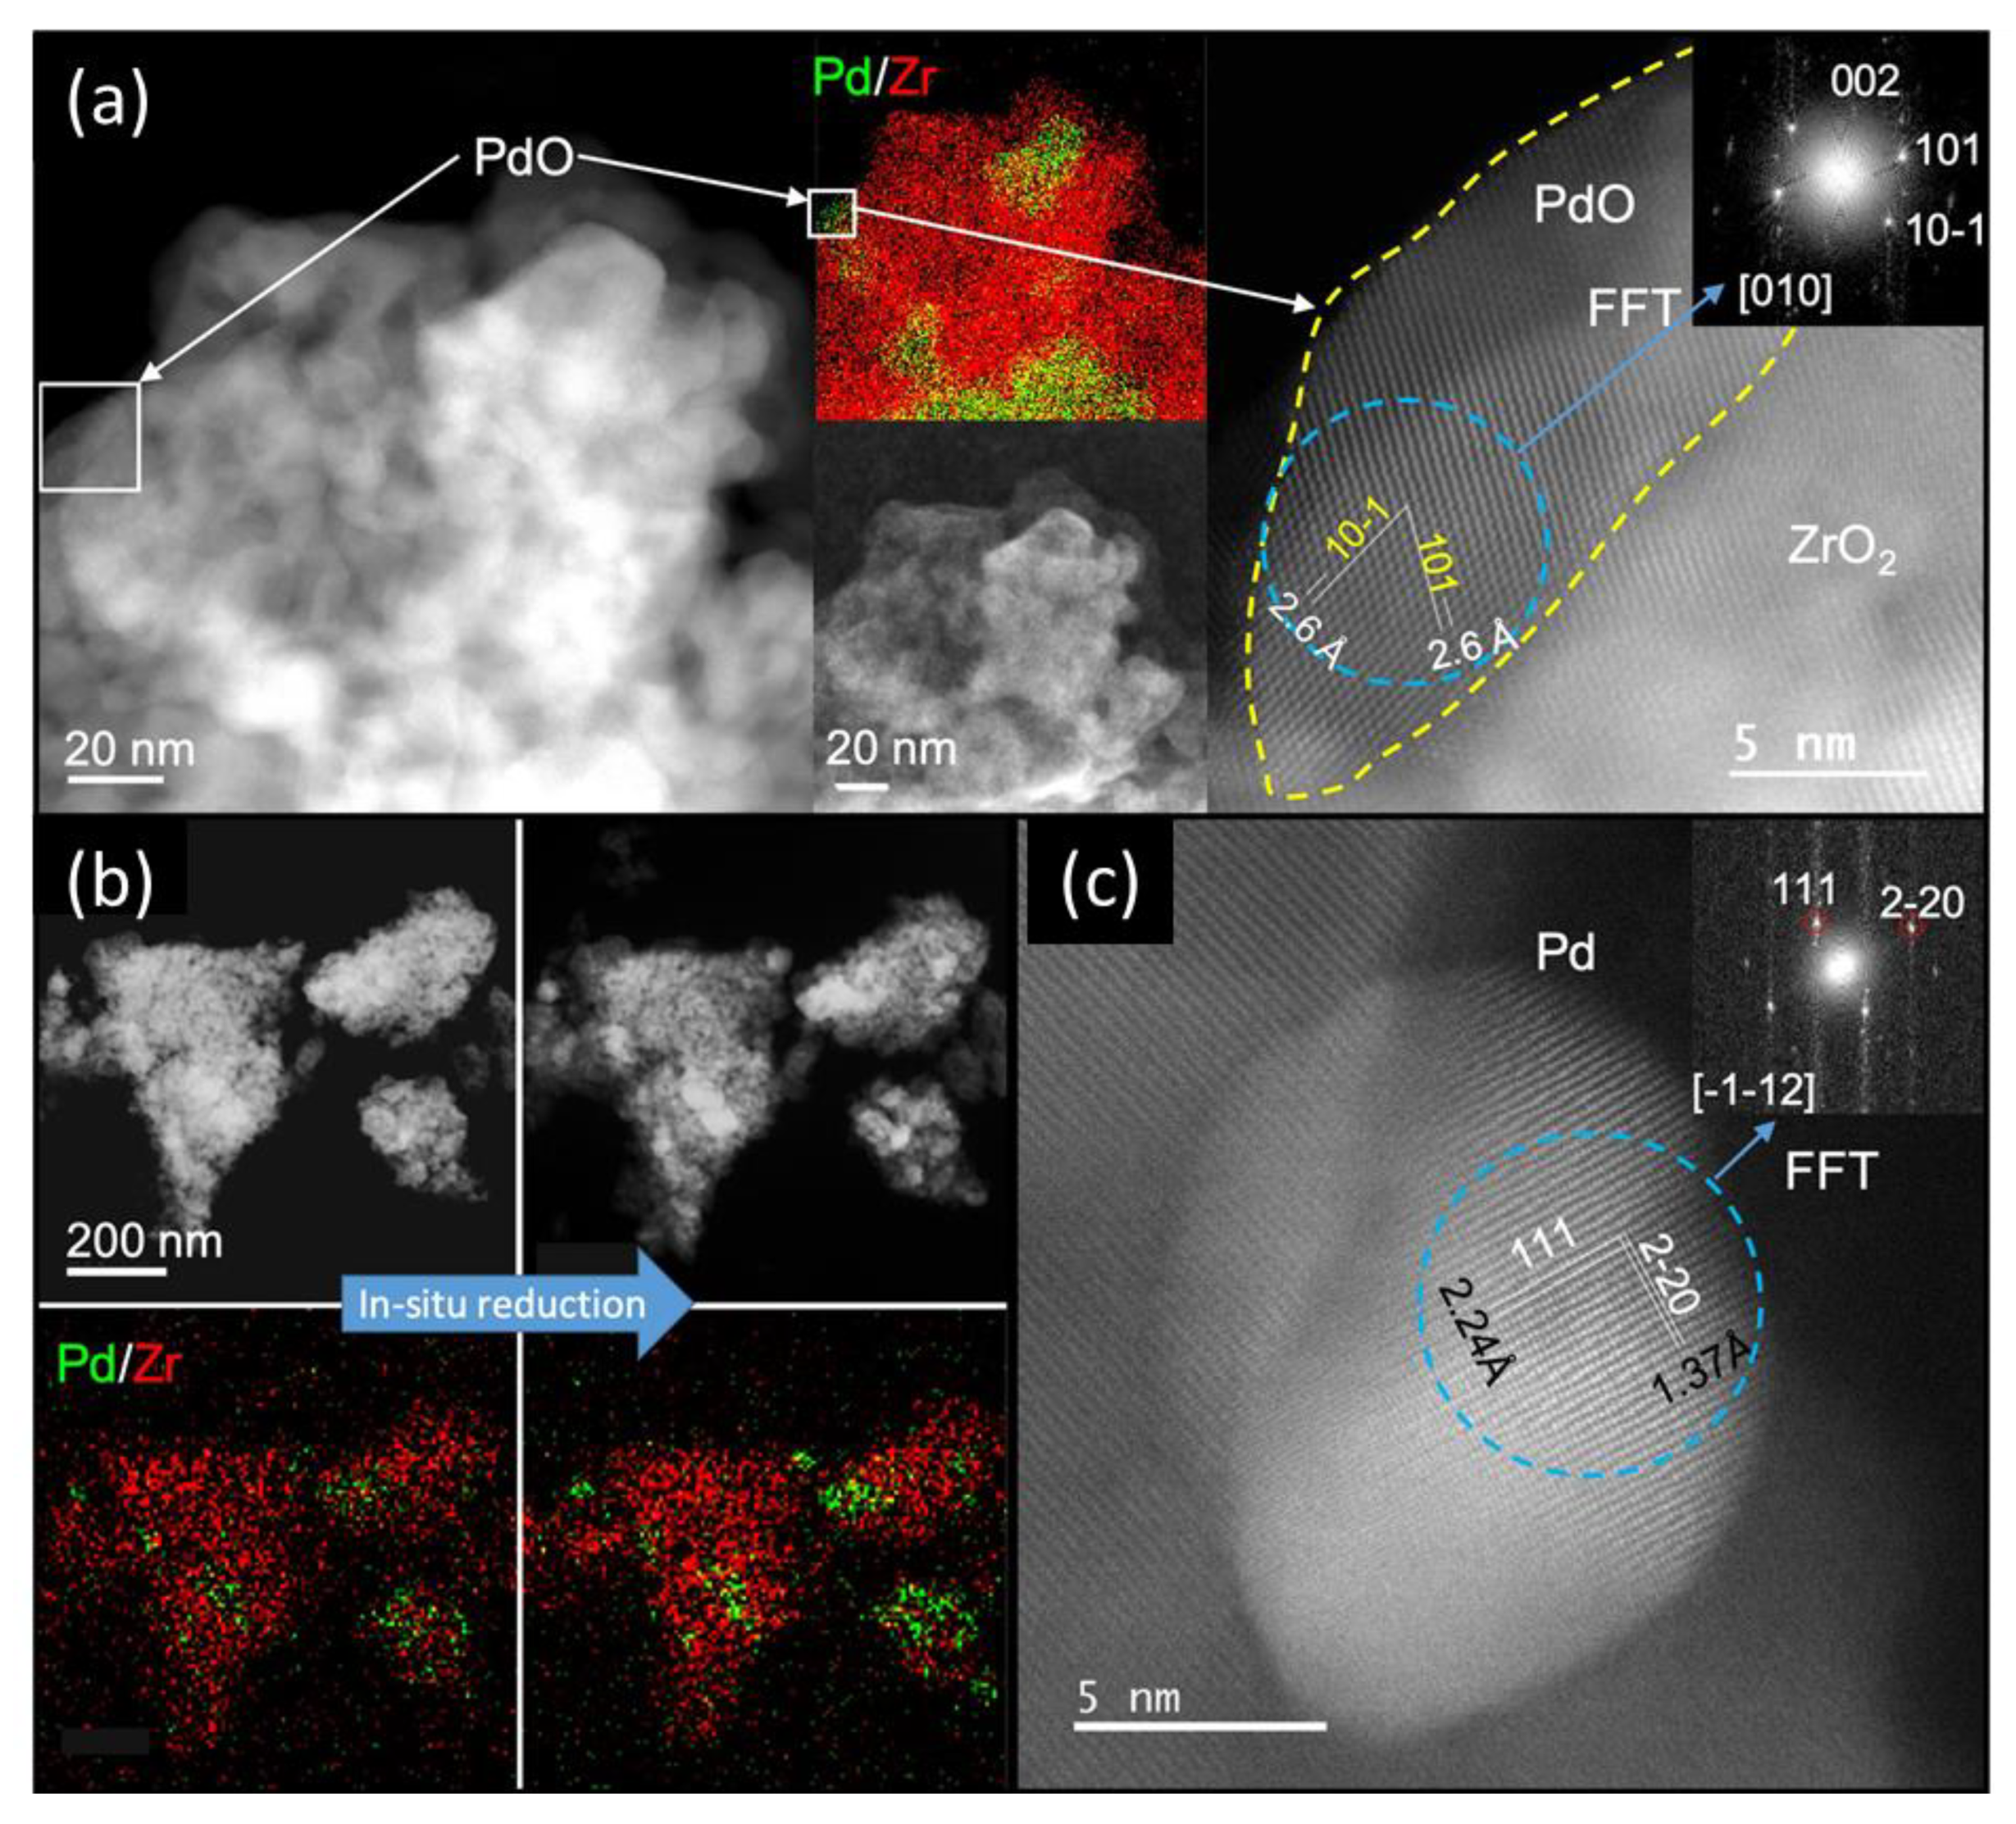
Figure 4 shows a summary of the electron microscopic characterization of the calcined Pd–ZrO2 powder catalyst before and after in-situ reduction (scanning transmission electron microscopy STEM and energy-dispersive X-ray analysis EDX). The annular dark field image in Figure 4a reveals the particulate structure of the calcined catalyst but does not show features with clear contrast due to the presence of PdO and ZrO2, with similar scattering properties. According to the STEM EDX map, Pd is present in relatively large patches that are irregularly distributed on the surface of the ZrO2 particles. Secondary electron imaging reveals the surface morphology and indicates that the PdO islands are smoothly covering the ZrO2 particles. At high magnification, lattice fringe imaging confirms that Pd is present in the form of PdO structures that show a good wetting of the ZrO2 particles. During in-situ reduction in H2 at 600 °C, shrinkage of PdO patches and simultaneous increase in contrast due to the reduction of PdO is observed (see panel (b), Figure 4). Lattice fringes recorded in HAADF STEM after reduction confirm the formation of metallic Pd0 (see panel (c), Figure 4). The resulting particles are mostly rather large and show a partial de-wetting and thus more roundish shape but some are smaller and still well interfaced to the surface of the ZrO2 particles, as shown in Figure 4c.
In conclusion, the chosen impregnation routine using an aqueous ZrO2 suspension (see Section 3.1) yielded, after calcination and reduction, a supported Pd–ZrO2 catalyst with rather low dispersion (~0.6%) and—in average—rather large Pd metal domains. The average Pd particle size derived from the dispersion calculation based on CO adsorption and temperature-programmed desorption (TPD) measurements (cf. Section 3.1) amounts to ~130 nm, assuming half-embedded spherical particles. Thus, the catalyst exhibits a plethora of large particles. The size of the particular, rather small Pd particle shown in Figure 4c is ~15 nm but it was chosen for high-resolution imaging as also a potentially much more active local phase boundary region to ZrO2 is well resolved, allowing for verification of the presence of a stabilized Pd metal-support interface. The catalytic importance of the latter will be elaborated in detail in the following sections.

2.2. Catalytic Testing via Temperature-Programmed DRM Experiments

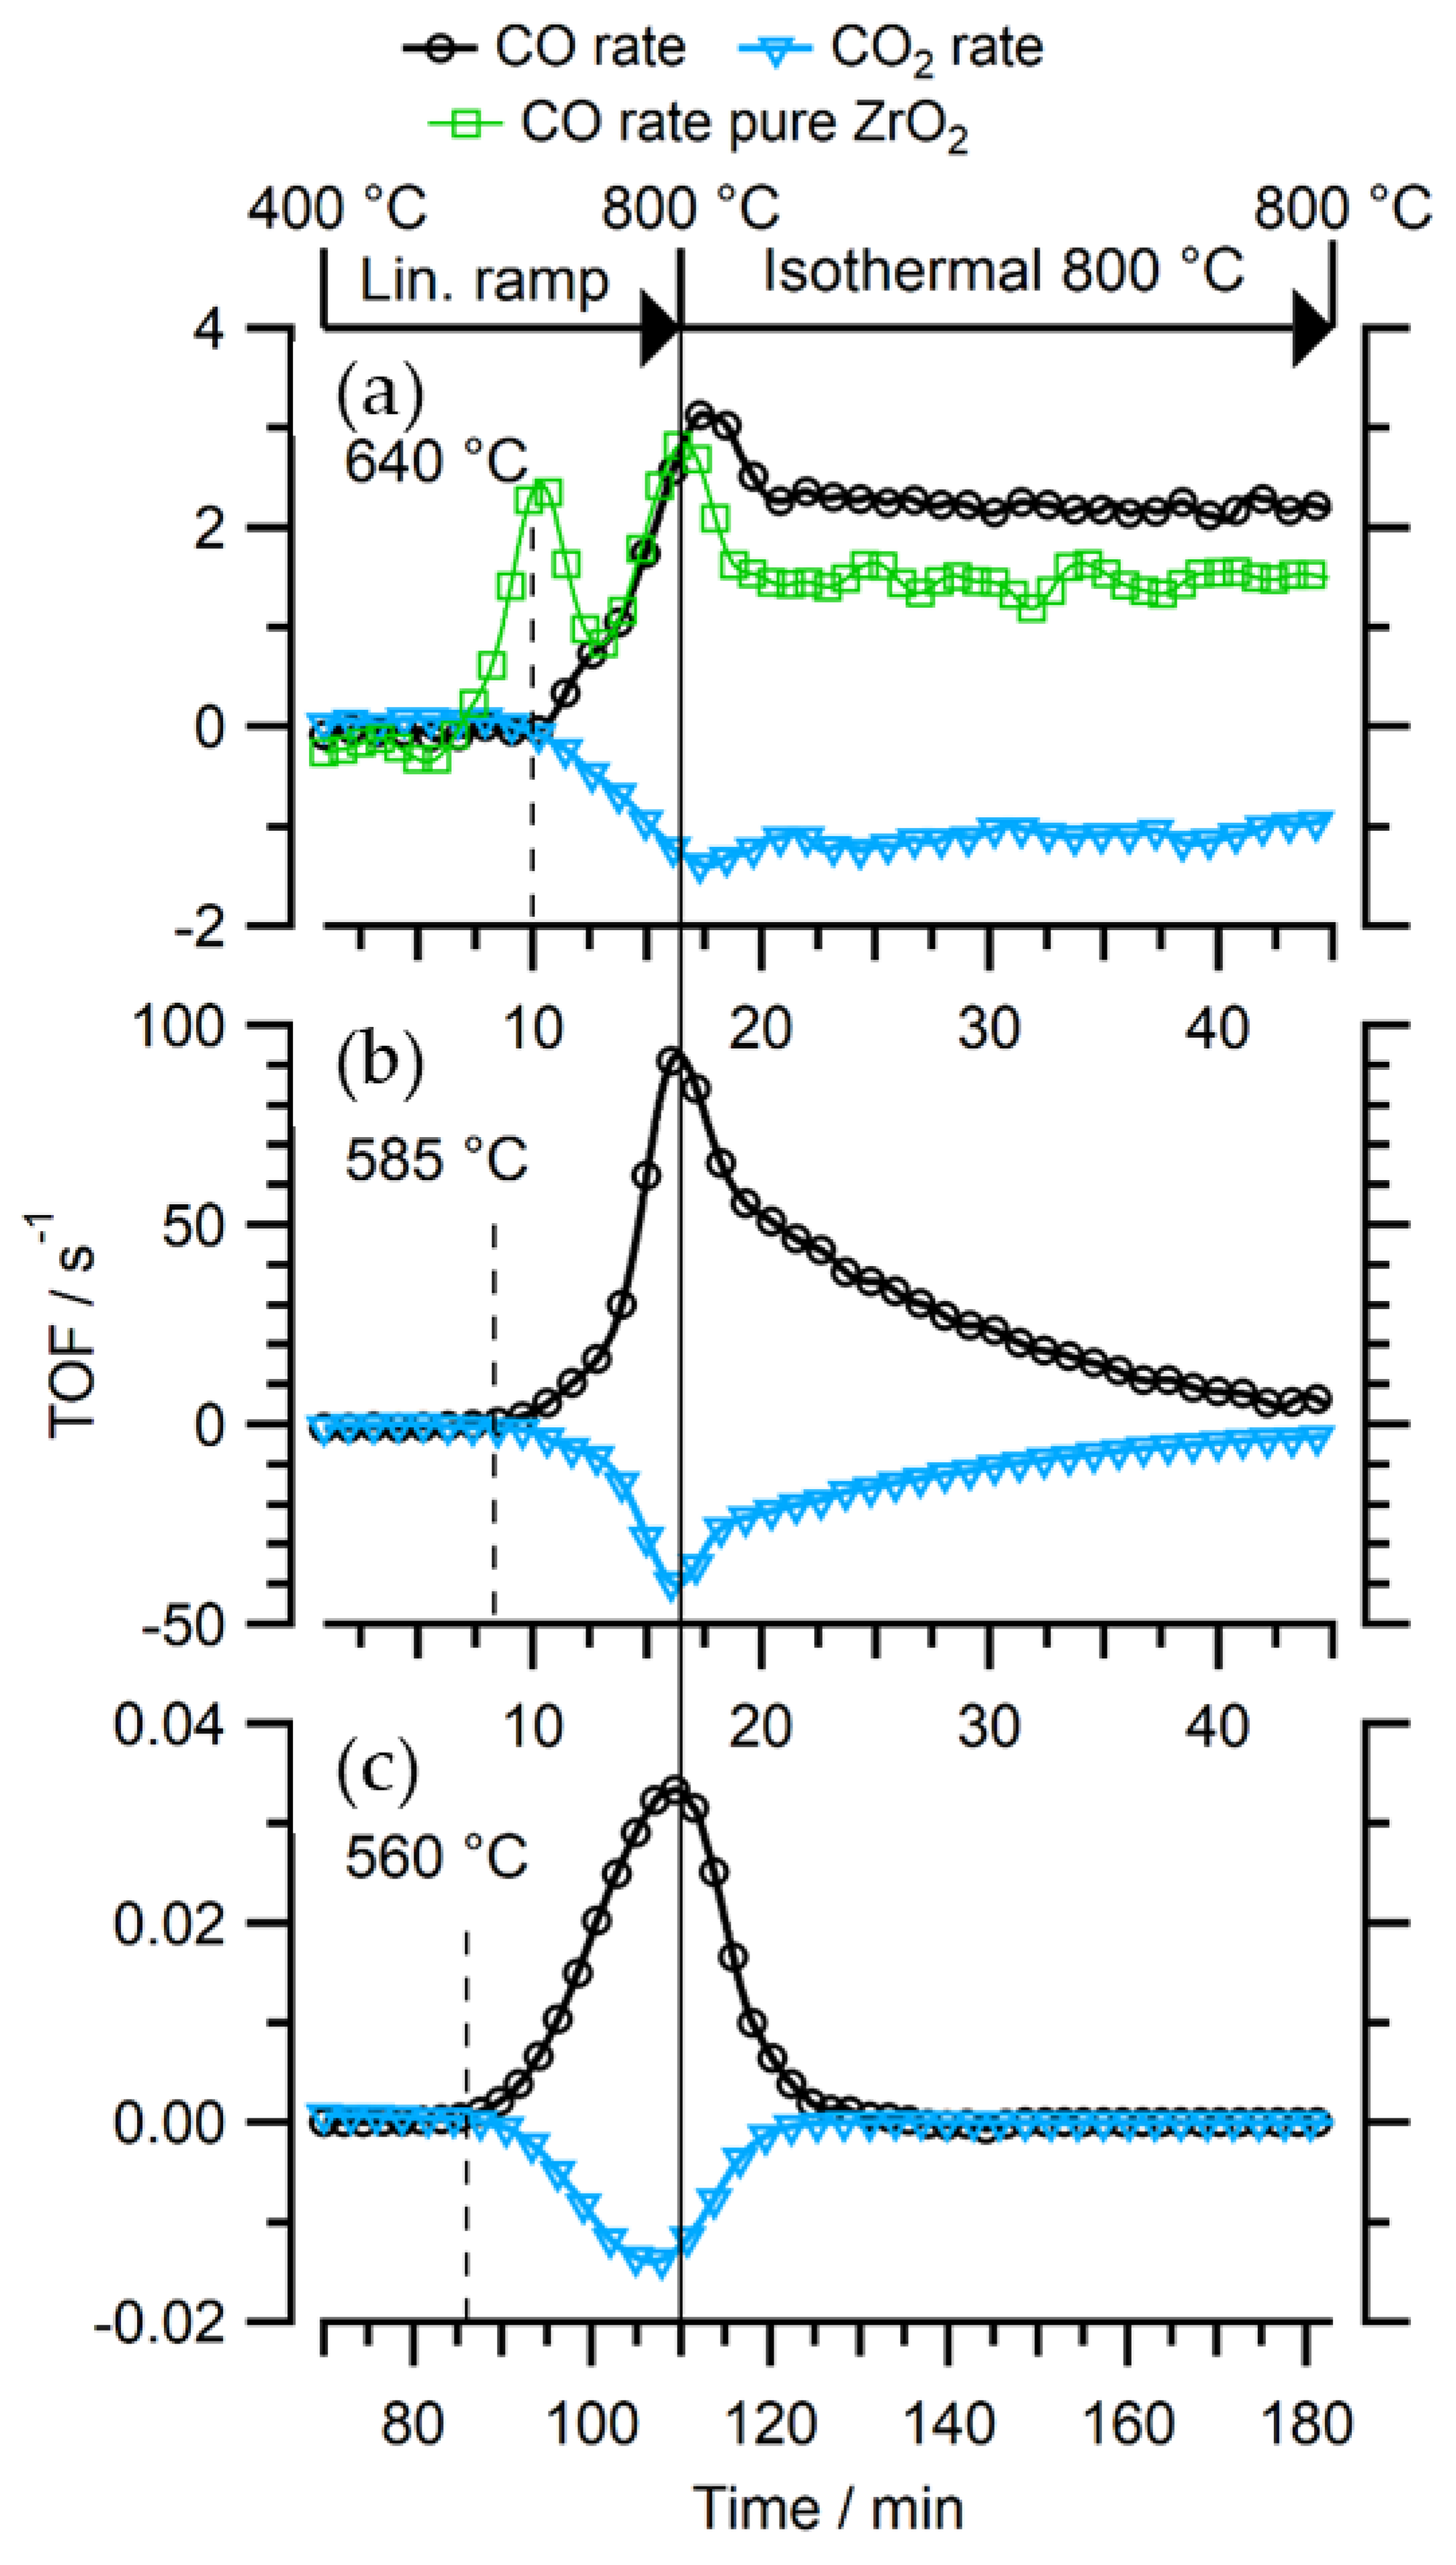
As shown in Figure 5, panel (a), only a slight promotion of DRM activity relative to phase-pure ZrO2 was observed on the subsurface Zr0–Pd foil precatalyst prepared by CVD. The first peak of the pure ZrO2-CO signal is assigned to the partial oxidation of methane (POM) to CO due to an increased level of O2 in the admitted DRM reaction mixture. The subsequent DRM onset at ~700 °C is nevertheless clearly visible. The activity of the undoped ultra-pure Pd foil is not shown, as it is below the experimental detection level. Panel (b) shows the DRM experiment for the PdxZry bulk intermetallic precatalyst. As a result of using a batch reactor with fixed initial molar amounts of reactants, the decrease of the CO2 formation rate in the isothermal region in panel (b) is caused by progressive reactant consumption—the CH4/CO2 conversion on the initially PdxZry bulk intermetallic catalyst after 28 min isothermal reaction at 800 °C amounts to ~90%. This effect is even more pronounced for the Pd–ZrO2 powder catalyst (panel C), on which quantitative conversion is attained already after ~20 min at 800 °C.
It is important to emphasize that the TOF differences at maximum rate between the initially bulk-intermetallic PdxZry precursor and the supported Pd–ZrO2 reference catalyst are not only due to different “intrinsic” (i.e., sample-specific) activities, but—to a large part—also due to external differences of the initial CH4:CO2 partial pressures, the slopes of the temperature ramps and the recirculating batch reactor volumes (Figure 5b: setup described in Section 3.2.2, 50:50 mbar, 25 K/min, Vreactor = 296.0 mL; Figure 5c: setup in Section 3.2.3, 15:15 mbar, 10 K/min, Vreactor = 13.8 mL). The initial molar amount of reactants in Figure 5c was thus ≈70 times lower than in Figure 5b. Obviously, the reactant conversion on the supported reference powder catalyst is already beyond 50% at the beginning of the isothermal period at 800 °C. This means that the remaining reactant pressures of only ≈7 mbar strongly contribute to the lowered maximum rate relative to the initially bulk-intermetallic PdxZry catalyst. To partly compensate for this difference, the corresponding TOF of the CO formation rate on the latter was read out after 23 min isothermal operation, corresponding to a similar remaining CO2 partial pressure of ~7 mbar. At this point it amounts to ~8 s−1, in contrast to only ~0.035 s−1 on the Pd–ZrO2 powder catalyst. We emphasize that the direct comparison of these TOF values, although now determined at comparable reactant pressures, still remains misleading for two reasons. Firstly, the inactivity of ultra-clean Pd proves the pronounced structure sensitivity of the DRM reaction on Pd/ZrO2. Consequently, normalization of the rates to the—unfortunately experimentally unavailable—number of Pd–ZrO2 interface sites on each catalyst system would be mandatory. Secondly, the estimation of the number of Pd surface atom sites both on the bulk- and subsurface-intermetallic PdxZry precursors is based on the simplified consideration of the macroscopic geometric surface area (rough estimation of ~1.2 × 10¹⁶ surface Pd atoms within the reactor on each). This number is directly applicable to the CVD-prepared subsurface-Zr0 precatalyst but in case of the in-situ corroded bulk-intermetallic precursor—although exhibiting the same geometrical size—both the effective Pd metal surface area of the corroded near-surface region and the number of Pd–ZrO2 interface sites within this region are experimentally very difficult to access. During DRM, it nevertheless develops a similar total number of XPS-detectable Pd atoms at the surface as being present on the foil-based CVD-prepared catalyst, which was the basis of using the same number of surface Pd atoms for both systems. A reliable quantitative comparison and therefore a direct numerical estimation of the total amount of Pd atoms present on top of the corrosion layer is not possible based on XPS, due to different base intensities, mainly caused by different carbon surface coverages on the post-DRM state, and due to the unknown depth profile. Nevertheless, quantitative comparison of the atomic ratios of the activated states lead to a surface composition of 68% Pd and 32% ZrO2 for the post-DRM CVD-prepared catalyst and a surface composition of 46% Pd and 54% ZrO2 for the DRM-corroded bulk intermetallic system. Thus, the (clearly oversimplified) assumption of an equal number of geometrically accessible surface Pd sites appears not entirely unjustified. We admit that measuring this number by CO adsorption would basically be preferable, as there might be some porosity and/or accessible “internal” Pd surface within the corrosion layer but unfortunately, CO TPD on the post-DRM sample is experimentally not accessible. Thus, we consider the TOF numbers on the bulk-intermetallic precursor the least reliable ones.
Finally, the supported catalyst reproduces the salient kinetic features (w.r.t. light-off temperature, general activity trace in the T-programmed region, activation energy of around 140 kJ/mol) of the initial PdxZry bulk-intermetallic precatalyst quite well, although the TOF level is generally much lower. Most likely, this can be explained by its quite low dispersion (~0.6%) and Pd dewetting tendency upon H2 prereduction (see Section 2.1.2) and thus the inherently low ratio of interfacial vs. surface Pd atom sites.
Nevertheless, the direct rate comparison between Figure 5a,b is straightforward (identical reaction conditions, same reactor) and clearly shows the strong promotion of DRM activity on the initially bulk-intermetallic precatalyst when compared with the CVD-prepared initially subsurface Zr0 system. Anticipating the subsequently shown in-situ XPS results, the strong DRM promotion on the bulk PdxZry precursor is caused by accumulation of reactive, dissolved/carbidic carbon species in oxidatively segregated Pd nanoparticles under DRM conditions. The absence of this type of reactive C accumulation on the CVD-prepared model catalyst surface will also be shown.
The CVD preparation of sub-monolayer ZrOx islands on Pd(111) and in due course, of our “inverse” subsurface Zr0-intermetallic precatalysts on bulk Pd foil, was originally motivated by a potentially scalable promotional role of variable Pd–ZrO2 phase boundary dimensions for the DRM activity. But as a matter of fact, all “inverse” systems turned out to be (if at all) only slightly more active than the sum of their individual oxidic and metallic surface components. Thus, also changes of the initial bimetallic Zr0 amount between 40% and 90% of a monolayer led only to minor differences in the observed activities (not shown). In practice, these tiny differences are anyway not scalable with the dimensions of the “inverse” ZrO2-on-Pd phase boundary, which is formed in situ under DRM conditions on the initial subsurface Zr0–Pd foil precatalyst. This holds firstly because of the poor signal-to-noise ratio of the rate measurements due to low overall activity (Figure 5a) and is secondly due to the experimentally hardly accessible island density of reactively segregated ZrOx from the subsurface Zr0–Pd precursor. From the surface microscopy viewpoint, the exact amount of this special type of phase boundary sites can hardly be quantified, and—as these do not represent particularly active interface sites for DRM, anyway—the highly demanding attempt to normalize such tiny rate differences to an in-situ variable number of these interface sites appears to be of little use.

2.3. In-Situ Characterization under DRM Reaction Conditions

2.3.1. In-Situ Characterization of Precatalyst Activation

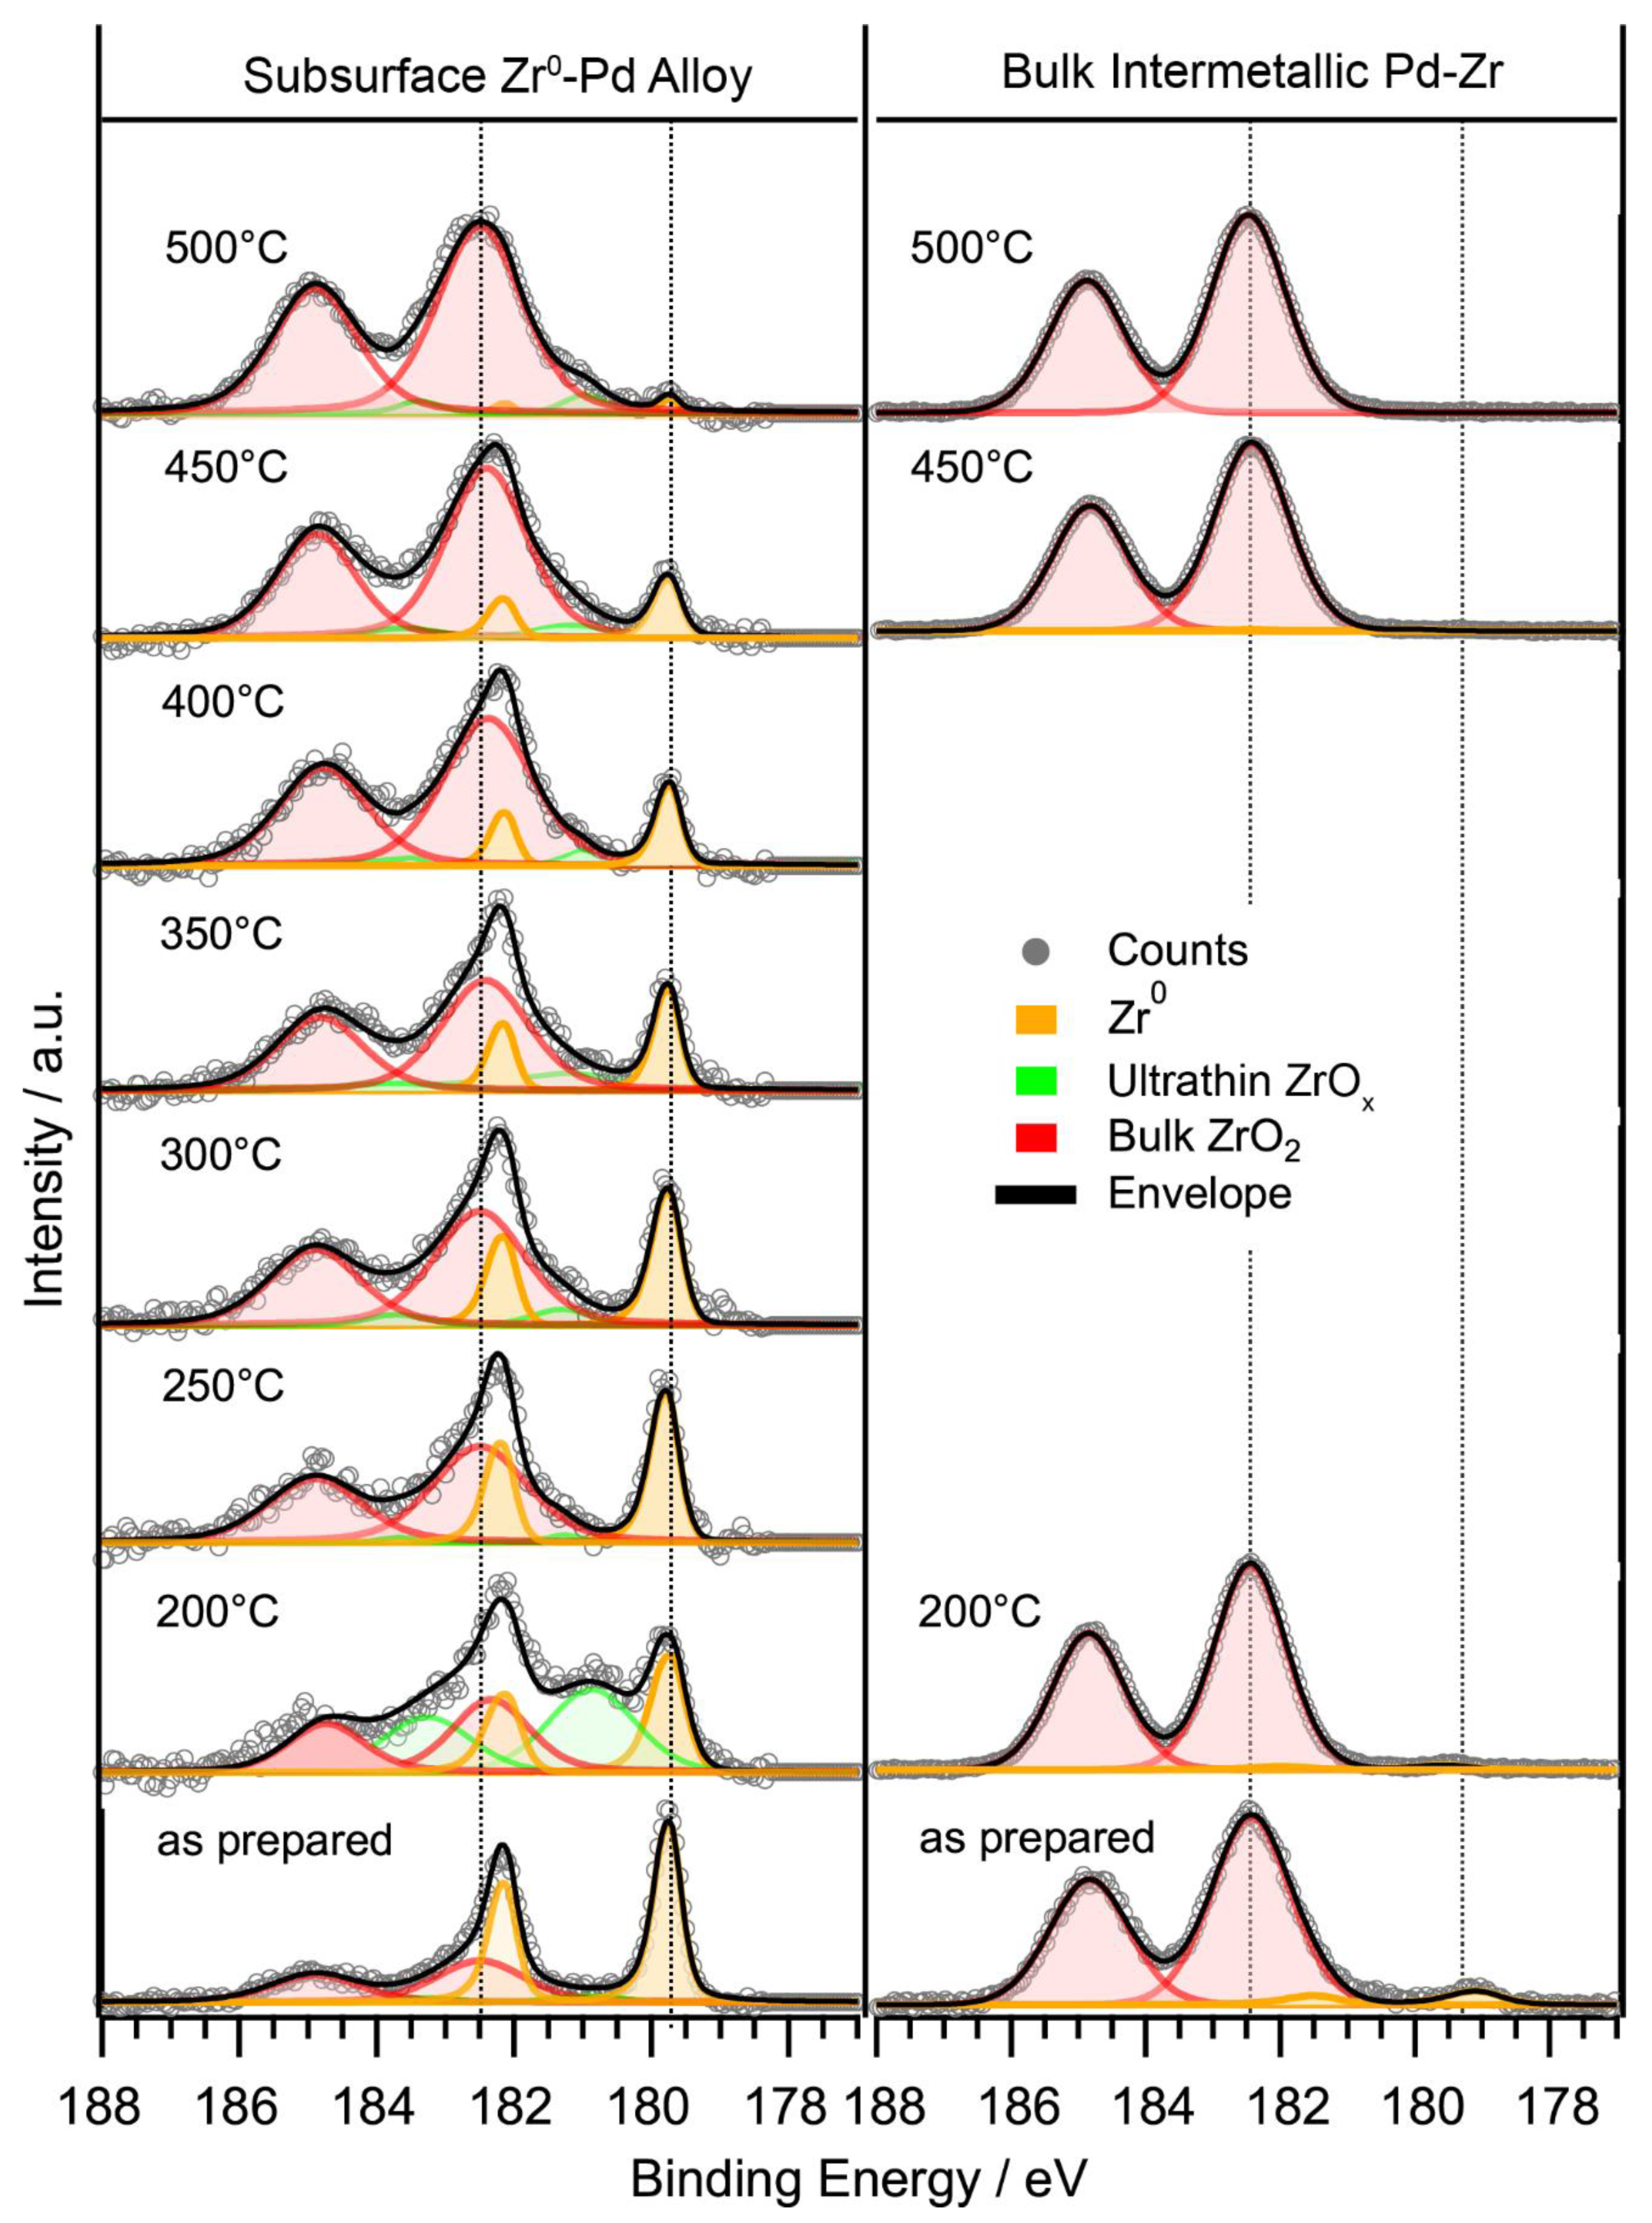
Figure 6 displays the XPS analysis of the oxidative segregation behavior of Zr0 species on both the CVD-prepared initial subsurface Zr0–Pd foil catalyst and the initial PdxZry bulk-intermetallic precatalyst under close-to-real DRM conditions as a function of the sample temperature. As mentioned in Section 2.1.2, the contact to the ambient during transfer to the NAP-XPS chamber already caused corrosive segregation of Zr0 toward a top layer of Zr+4Ox on the PdxZry bulk-intermetallic precatalyst, along with some “adventitious” carbon deposition. This effect was less pronounced on the initial Zr0–Pd foil subsurface alloy sample, most likely due to its protective Pd0 surface termination.
The DRM-induced sequence of oxidatively segregated species on the CVD-prepared initial subsurface Zr0–Pd foil catalyst is somewhat complex—the decrease of the intermetallic Zr0 component leads to an intermediate increase of the ultrathin ZrOx components around 200 °C. The surface-wetting ultrathin film is subsequently converted to a bulk ZrO2 species at and above 250 °C. Upon reaching 500 °C, almost all Zr0 is converted to bulk-like ZrO2 at the surface.
On the PdxZry bulk-intermetallic precatalyst, the heating process leads to the loss of the residual weak Zr0 intensity in the spectra due to progressively “deeper” oxidation of the sample. As can be seen in Figure 7, displaying the complementary in-situ XRD information obtained on the initial PdxZry bulk-intermetallic precatalyst, a treatment at 500 °C in DRM atmosphere is not sufficient to induce XRD-detectable deep bulk corrosion of the intermetallic precursor, since the intermetallic reflections still remain dominant and the Pd0 and ZrO2 reflections below the detection limit. Nevertheless, we note that the catalysis-relevant near-surface regions probed by NAP-XPS did already approach the fully segregated Pd0–ZrO2 state around 500 °C. The respective Pd 3d spectra are not shown in Figure 6, as both precatalysts preserve their unaltered metallic Pd state and do not exhibit noticeable changes in the Pd 3d spectra up to 500 °C. The as-prepared intermetallic initial state consists of a phase mix of Pd3Zr and Pd2Zr and with coarse crystallites (spotty, that is, not completely continuous rings) and exhibits no detectable contributions from segregated Pd0 or ZrO2 species, which means that they can be present only within a few layers at the top. First signs of these species appear in XRD above 700 °C and between 700 °C and 800 °C their contribution to the diffractogram becomes dominant, at the cost of the parent intermetallic phases, meaning that “deep” corrosion happens around 750 °C. As the time span between the diffractograms is 5 min, corrosion kinetics must be very slow up to ~700 °C. At this point kinetics become fast enough for the Pd0 and tetragonal (t-)ZrO2 phases to clearly exceed the ~1% XRD detection limit. The overall sequence confirms the buildup of a corrosion layer consisting of crystalline Pd0 (reflections shifted by ~0.2° due to combined C-dissolution and thermal expansion) and t-ZrO2, which grows in thickness with increasing temperature and time and finally extends over most of the spatial regions accessible to X-ray diffraction. The catalytic data in Figure 5b suggest that this in-situ corrosion process gives rise to a particularly DRM-active state.
Both newly formed phases—Pd0 and tetragonal (t-)ZrO2—appear as completely continuous rings in the detector image and, therefore, exhibit a nanocrystalline morphology. Both the mean crystallite size and the lattice constant of Pd0 were estimated via Rietveld analysis, yielding values of ≈7.5 nm and 3.914 Å, respectively, during DRM at 800 °C [18].

2.3.2. In-Situ NAP-XPS under Transient Reaction Conditions

Subsurface Zr0–Pd Foil Precatalyst

Figure 8 displays the isothermal in-situ NAP-XPS spectra on the CVD-prepared Zr0–Pd foil catalyst (where Zr was initially subsurface) at 700 °C under realistic DRM conditions. The intensity trends (based on peak integration) associated with changing gas-phase conditions are depicted in the bar graphs at the right side. Complete carbon clean-off, including the oxygenate and CHx components above 285 eV [45,46,47], is observed upon switching to pure CO2. According to the relative intensity trends, the mostly graphitic carbon present after growth in clean CH4 appears to be rather located on top of the ZrO2 islands (Zr 3d increasing, Pd 3d hardly affected), which were already pre-formed in situ under DRM conditions around 500 °C (cf. Figure 6, left panel). The principal possibility of graphite deposition from thermally activated CH4 on ZrO2 surfaces above ~750 °C has been shown previously [48] and is most likely enhanced by the strongly ionized gas environment of the NAP-XPS experiment. A lower steady-state carbon concentration than that growing in pure CH4 builds up in the 1:1 DRM reactant mixture and eventually becomes time-independent. The Pd 3d spectra remain qualitatively unchanged in the metallic state upon gas-phase variation and neither carbidic nor oxidic Pd components are present.

Bulk-Intermetallic PdxZry Precatalyst

From the combination of the reactivity data (Section 2.2), the XPS and the XRD information (Section 2.3.1), we conclude that a composite Pd0-nanoparticle/t-ZrO2 active phase is formed in situ via oxidative decomposition of an increasing fraction of the parent intermetallic PdxZry under DRM conditions. This in-situ corrosion process starts in the near-surface regions and finally affects the entire XRD-detectable bulk region of the parent intermetallic phase.
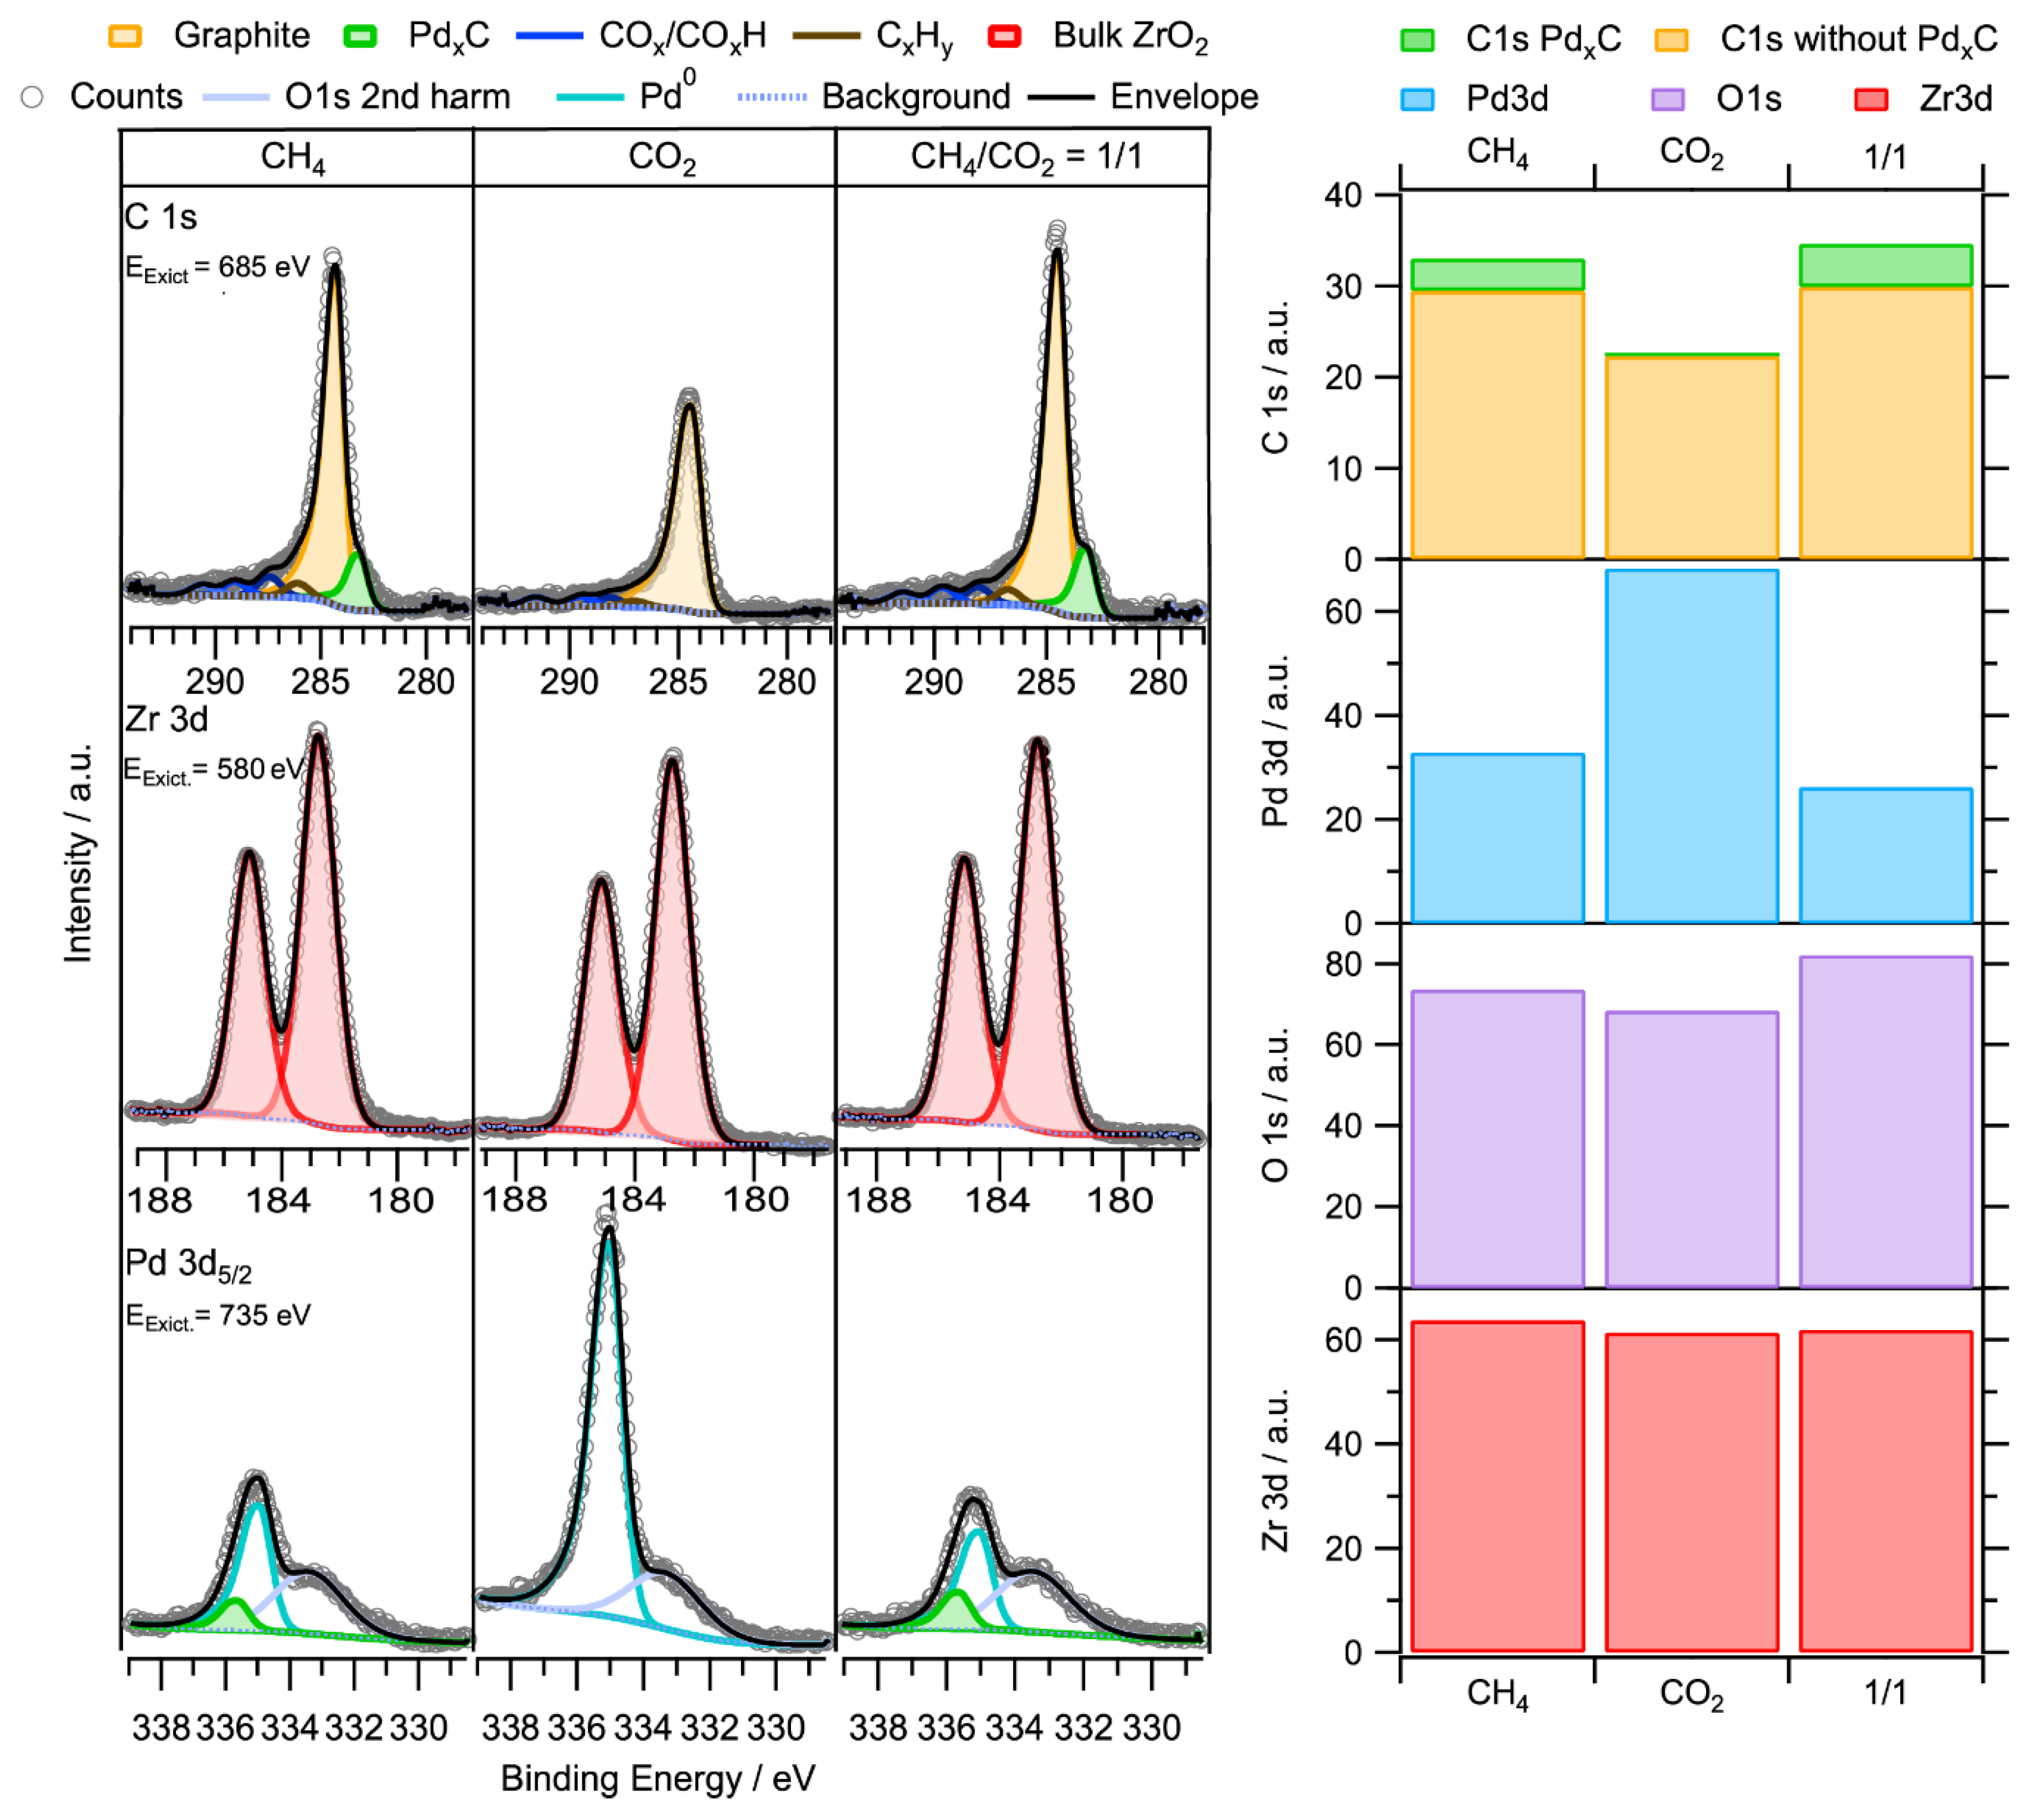
As can be indirectly deduced from the preceding Figure 7 and Figure 8, the main difference between the initial subsurface and bulk-intermetallic precatalysts is the formation of two distinctly different Pd0–ZrO2 active states via DRM-induced “corrosive” activation. As one starts from minute submonolayer amounts of Zr0 atoms on the CVD-prepared catalyst, its segregated state must be constituted of 2- to 3-dimensional ZrO2 islands on top of an otherwise hardly changed, almost infinite Pd0 bulk, whereas the intermetallic PdxZry exhibits extended 3-dimensional growth of ZrO2 and Pd and thus contains Pd0 nanoparticles in intimate contact with 3D t-ZrO2 domains. The combined structural information of the XRD-derived Pd nanoparticle size, together with the chemical surface composition from XPS analysis, strongly suggest the scenario of a “quasi-3D” decay toward a conglomerate “selective-corrosion” layer on top of the PdZr substrate. In Figure 9, this fundamental morphological difference manifests itself in the simultaneous occurrence of a carbidic/dissolved carbon PdxC component in the Pd 3d and C 1s spectra (Cbulk at a binding energy of 283.0 eV and Pdcarbidic at 335.6 eV [49,50], which becomes populated if methane is present in the gas phase. These components are clearly absent on the CVD-prepared initial subsurface Zr0–Pd foil catalyst under otherwise identical conditions (cf. Figure 8, left side, clean CH4). Regarding reactivity, the initially bulk-intermetallic PdxZry catalyst is ~30 times more active than its CVD-prepared counterpart (Section 2.2, panels (a) and (b) in Figure 5), suggesting a major catalytic relevance of the observed carbidic/dissolved C species. Strong support for their role as the most reactive C intermediates comes from the transient response to the gas-phase composition. As soon as the gas supply is switched from CH4 to CO2, the Cbulk signal disappears immediately, whereas the Cgraphite-component decreases at a much slower rate. Obviously, Cbulk is much more reactive than Cgraphite with respect to the carbon clean-off reaction in pure CO2. This fast response (at least on the timescale of ≈5 min, required for collecting two subsequent sets of XPS spectra), also holds for the Cbulk build-up upon re-activating the CH4 supply. In the 1:1 DRM reaction mixture, both the Cbulk and Cgraphite species are reversibly populated and eventually become time-independent by reaching a steady-state value. The intensity bar graphs displayed on the top right side of Figure 9 summarize the quantification of the relative Cbulk vs. Cgraphite intensity trends and highlight the faster and quantitative response of the carbidic carbon species upon switching from CH4 to CO2 and to the 1:1 DRM mixture. The Pd 3d intensity trends are interpreted in terms of preferential growth of the carbonaceous species on the Pd domains/particles, since the Pd 3d intensity is clearly suppressed in the presence of CH4, both in clean methane and the DRM mixture. As the Zr 3d intensity exhibits little changes (or slightly tends toward the reverse trend), preferential shielding of Pd by methane-induced carbon deposits is obvious. We emphasize that essentially the opposite trend, namely preferential shielding of ZrO2 domains, was observed on the initial subsurface Pd–Zr0 precatalyst (Figure 8, Pd 3d bar graph).
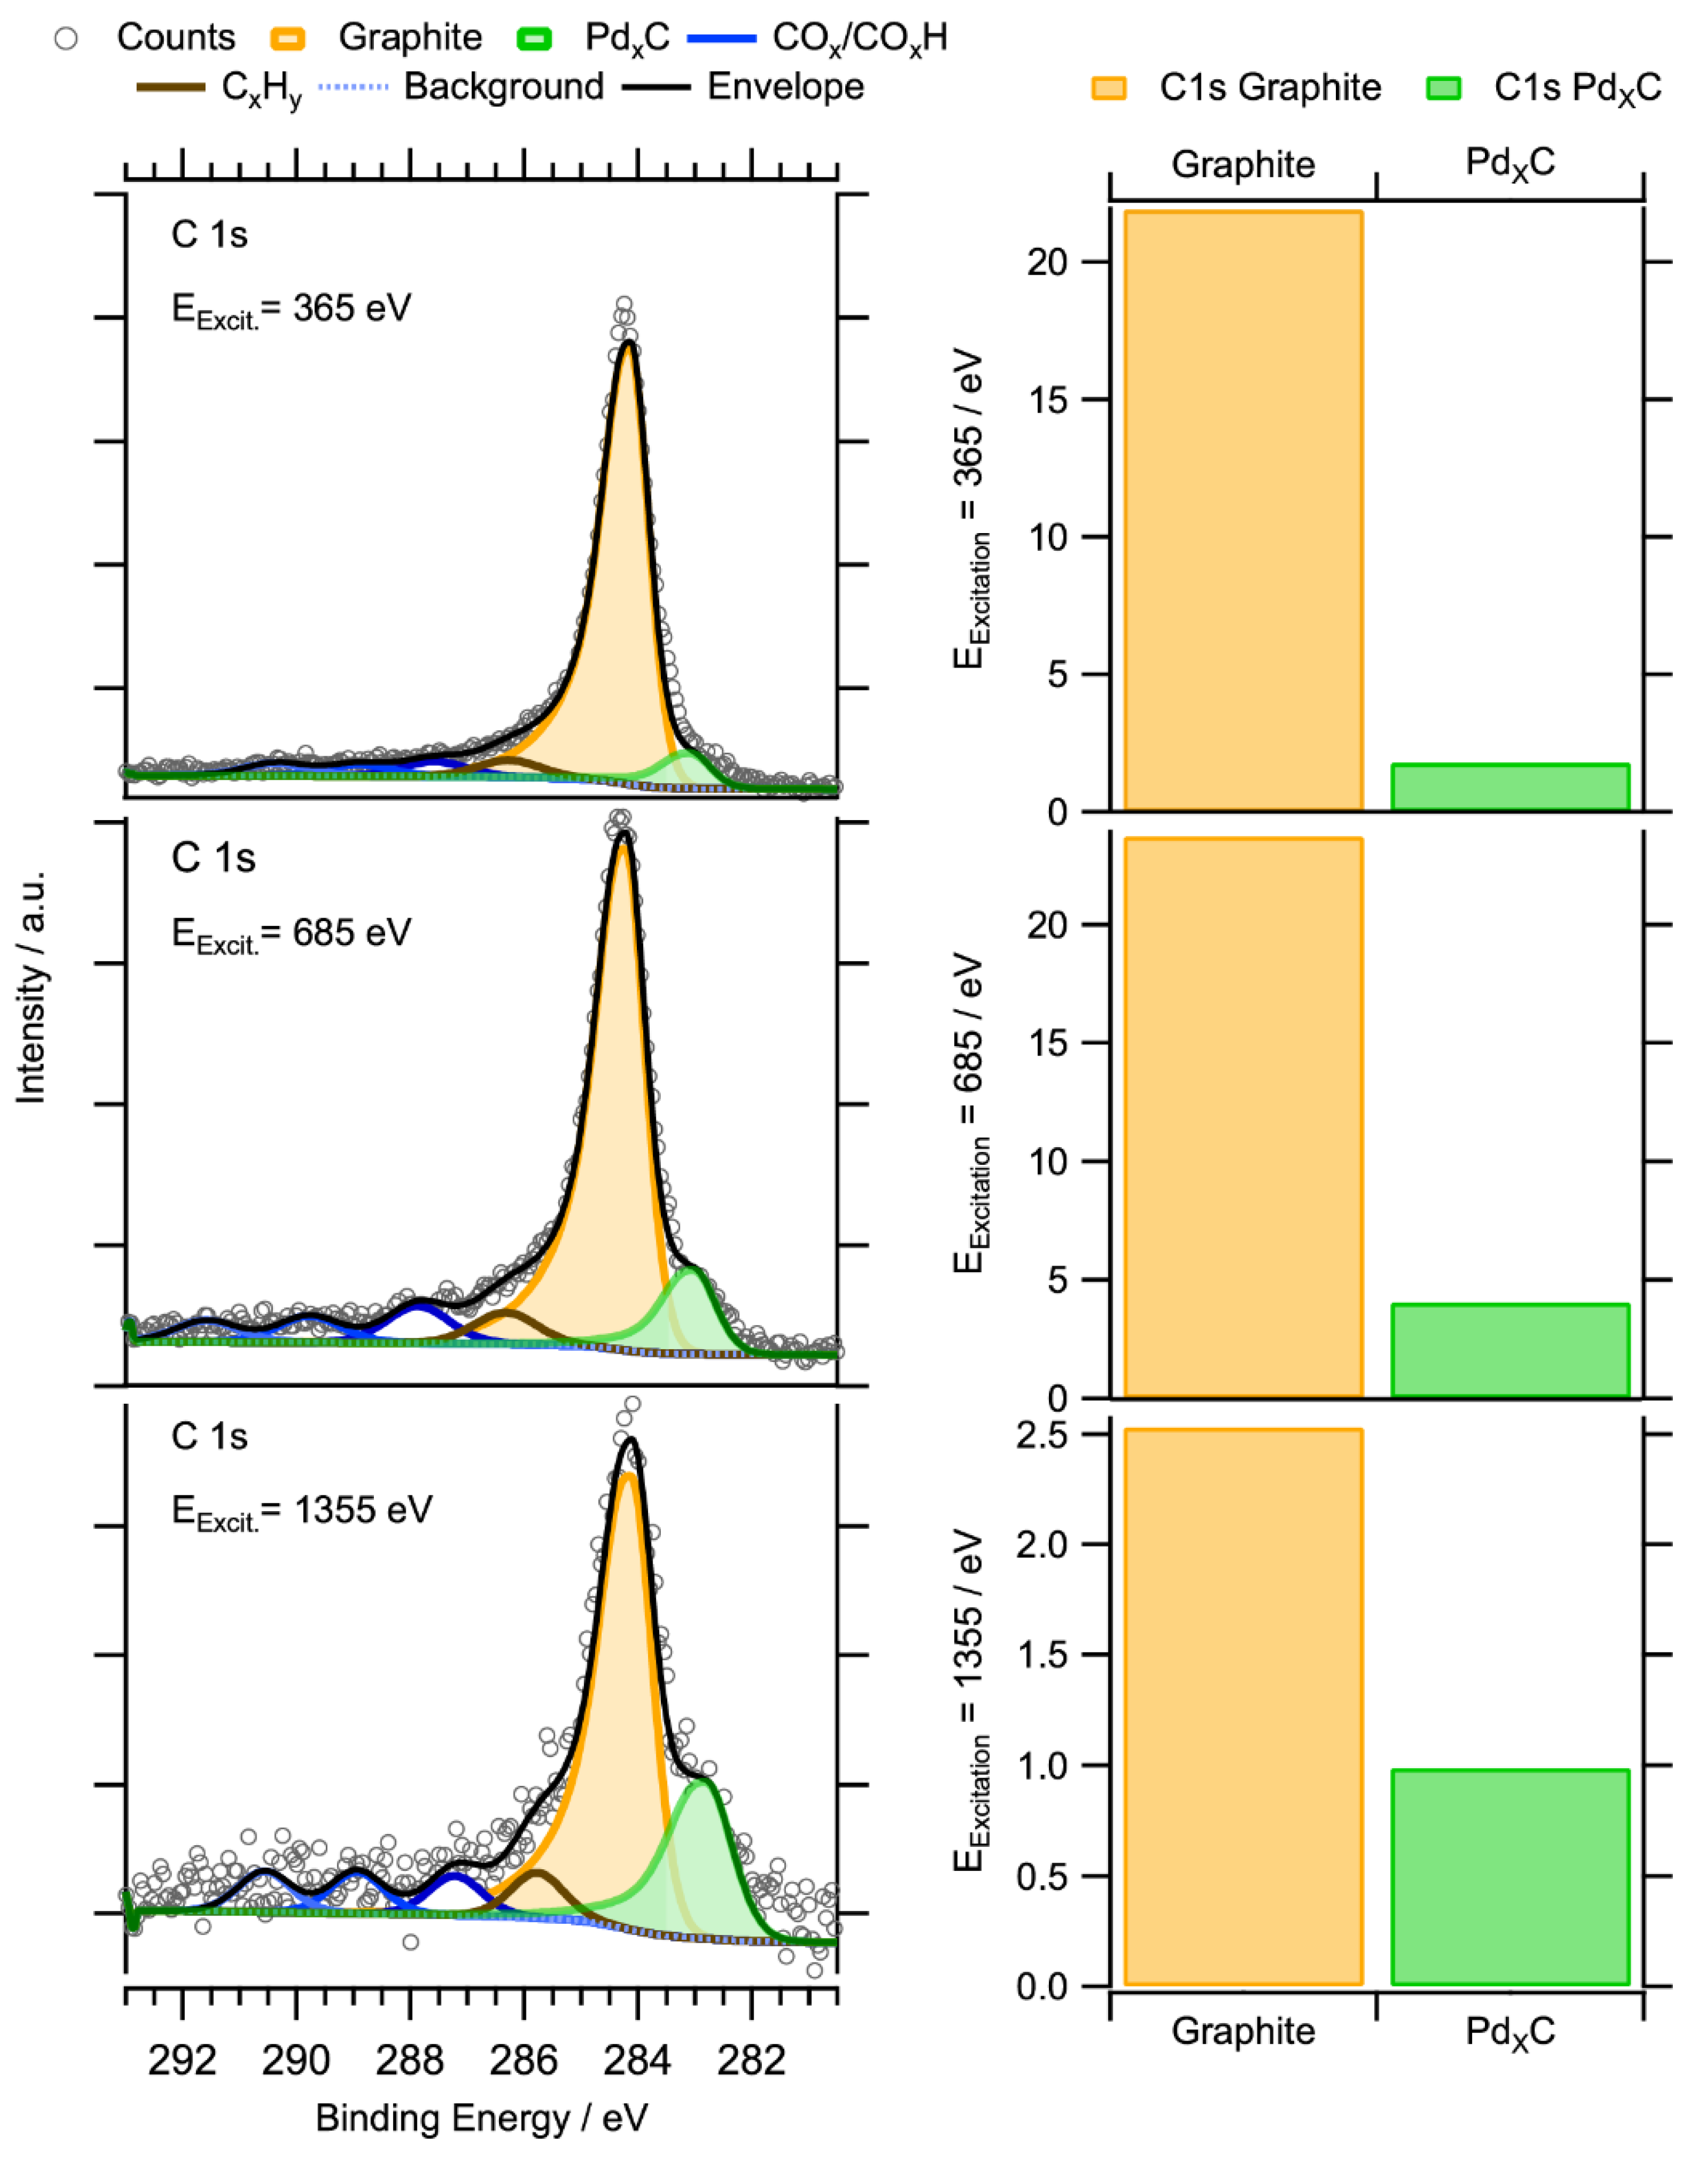
In due course, the subsurface/dissolved character of the Cbulk species vs. the preferential accumulation of the Cgraphite species at the Pd surface was verified by depth profiling via photoelectron kinetic energy variation.
As shown in Figure 10, the resulting intensity variations of the Cbulk and Cgraphite intensities clearly exhibit a relative enhancement of the Cbulk component with increasing XPS probing depth. We note that also the C1s region of oxygenated species (COx, COxH) exhibits an apparent intensity increase at higher photoelectron kinetic energies. It is safe to say that a volume-dissolved species such as Cbulk, as compared to graphene/graphite layers at the surface, should exhibit reduced signal attenuation with increasing probing depth. Interestingly, the oxygenated C 1s intensity appears to be also less attenuated relative to Cgraphite. As we suggest that the corrosion of the PdxZry bulk intermetallic leads to a “conglomerate“ 3D layer of nanosized Pd0 and t-ZrO2 domains, the latter may inherently contain a large amount of “buried“ Pd-ZrO2 interface sites. An enhanced concentration of oxygenated species at these sites would result in a “quasi-3D“ depth distribution perpendicular to the outer (geometrical) surface and thus to a similar response to photon energy variations as for Cbulk. As the poor signal-to-noise ratio and the ambiguity of the background subtraction in the oxygenate C 1s region does not allow for reliable quantitative assignments of intensity trends, this explanation is rather speculative.
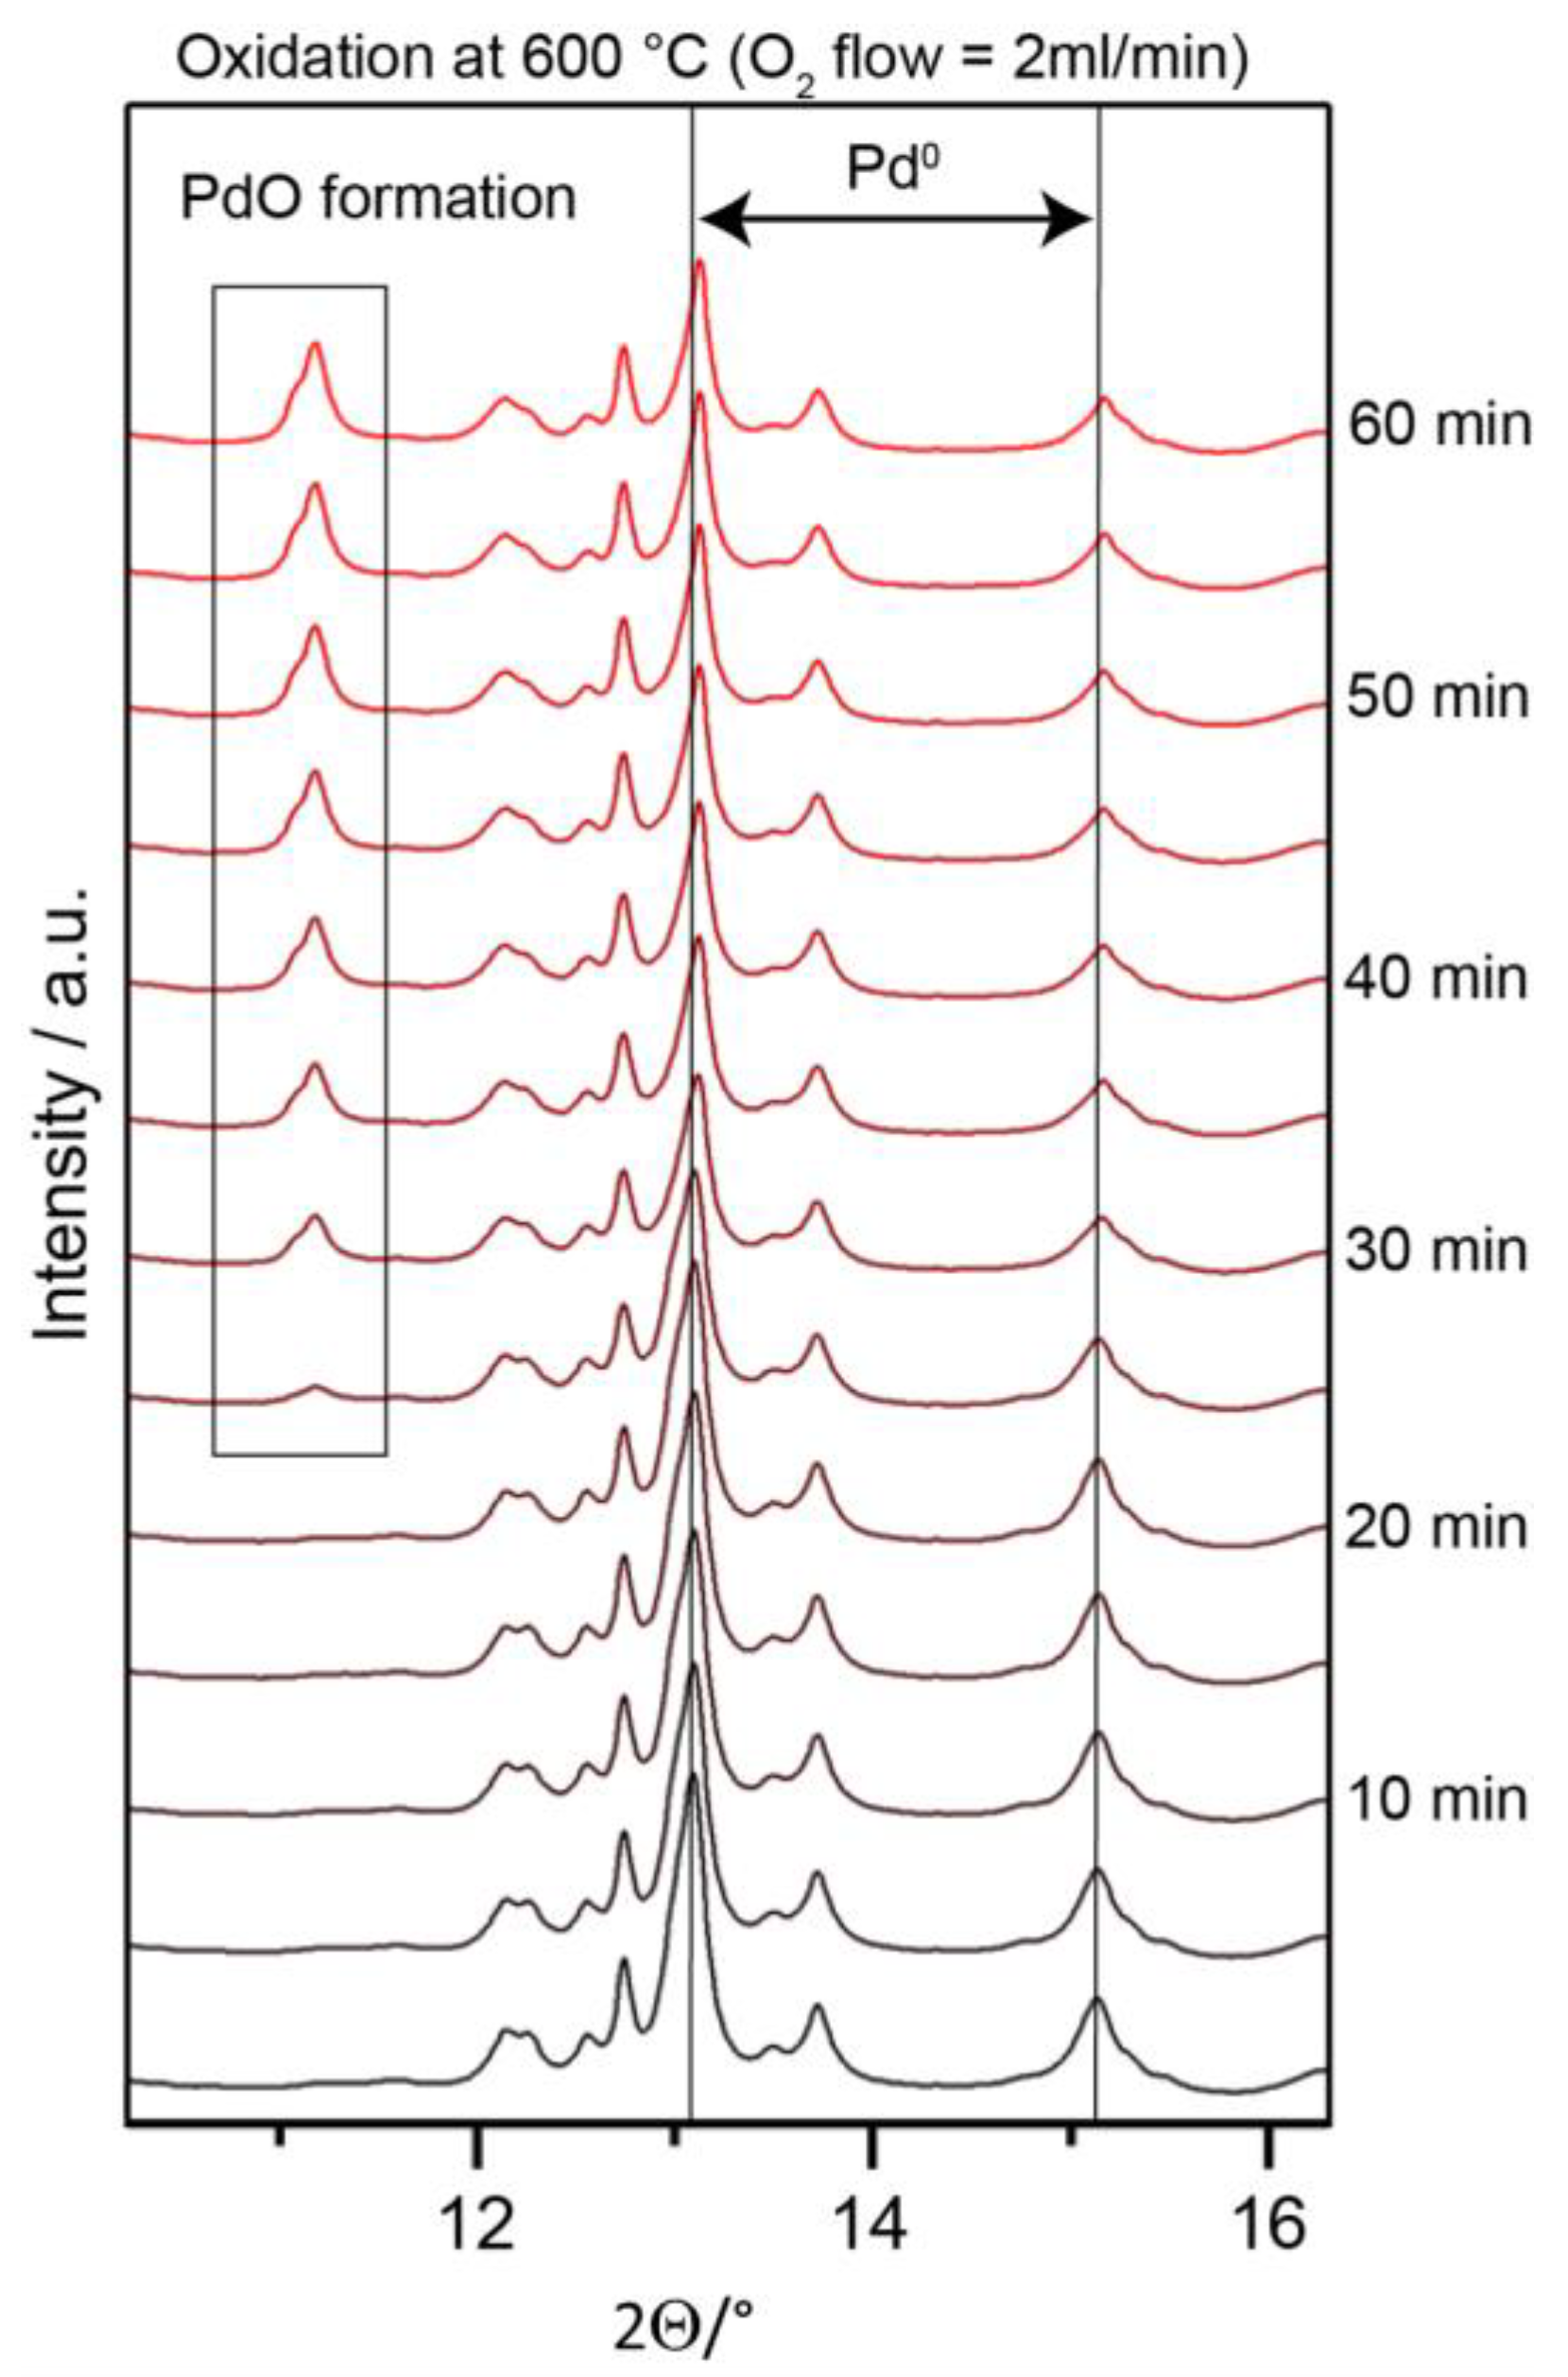
By means of in-situ XRD analysis during O2 re-oxidation of the initial bulk-intermetallic PdxZry precatalyst directly after DRM, the verification of the “solid solution” character of Cbulk within the Pd particles was attempted. Figure 11 shows the changes of the respective diffraction data over time on the post-DRM sample in a flow of 2 mL/min clean oxygen at ambient pressure and 600 °C.
Both a change of the Pd lattice parameter and of the particle size (determined via Rietveld analysis) with time can be deduced. Between 25 min and 35 min oxygen exposure, that is, at the onset of partial Pd0 oxidation to PdO, a lowering of the lattice parameter by ≈0.016 Å (from 3.914 Å to 3.898 Å, that is, ~0.4%) takes place and the mean crystallite size increases from ≈7.5 nm to ≈10.3 nm. We conclude that the partial oxidation of Pd0 toward PdO is accompanied by simultaneous carbon depletion of the Pd bulk, thus leading to a lowering of the lattice parameter of the metallic entities due to Cbulk-depletion. This result suggests that the DRM-induced carbidic Cbulk resides not only in the XPS-detectable near-surface regions but throughout the bulk of the Pd0 particles. The 0.4% change of the lattice parameter corresponds to a lowering of the post-DRM Cbulk concentration from ≈2% to zero, as deduced from the relation between the solid-solution C-concentration and the lattice parameter [49,51].
Finally, after isothermal variation of the reactant pressures, the reversibility of the steady-state carbon chemistry as a function of the reaction temperature was tested under fixed 1:1 DRM gas-phase conditions. Figure 12 displays the relative NAP-XPS intensity changes of the steady-state Cbulk and Cgraphite components as a function of temperature under in-situ DRM conditions. Between 600 and ≈700 °C, both components show increasing intensities, beyond ≈700 °C they both decrease, whereby the relative response of Cbulk appears to be generally stronger. The simultaneous presence of Cgraphite and Cbulk in the so called “coking window” of DRM [52] represents a novel aspect for the mechanistic interpretation of this temperature region and the enhancement of reversible de-coking processes at higher temperatures.
Up to ≈700 °C, the increasing carbon amount may be caused by the increase of C solubility and the simultaneously accelerated CH4 decomposition rate with increasing temperature, meaning that the Pd particles exhibit enhanced (net) carbon dissolution. Beyond ≈700 °C, thermodynamics generally favor carbon depletion. The equilibrium of the methane decomposition reaction CH4 ⇄ 2H2 + Cgraphite is shifted toward H2 formation and carbon deposition with increasing temperature due to the respective positive entropy change but to a lower extent than that of the equally exoentropic but much more endothermic carbon-converting inverse Boudouard reaction CO2 + Cgraphite ⇄ 2CO. The approximate temperature below which Cgraphite deposition exceeds carbon oxidation by CO2 is around 725 °C, as reported in Reference [26].
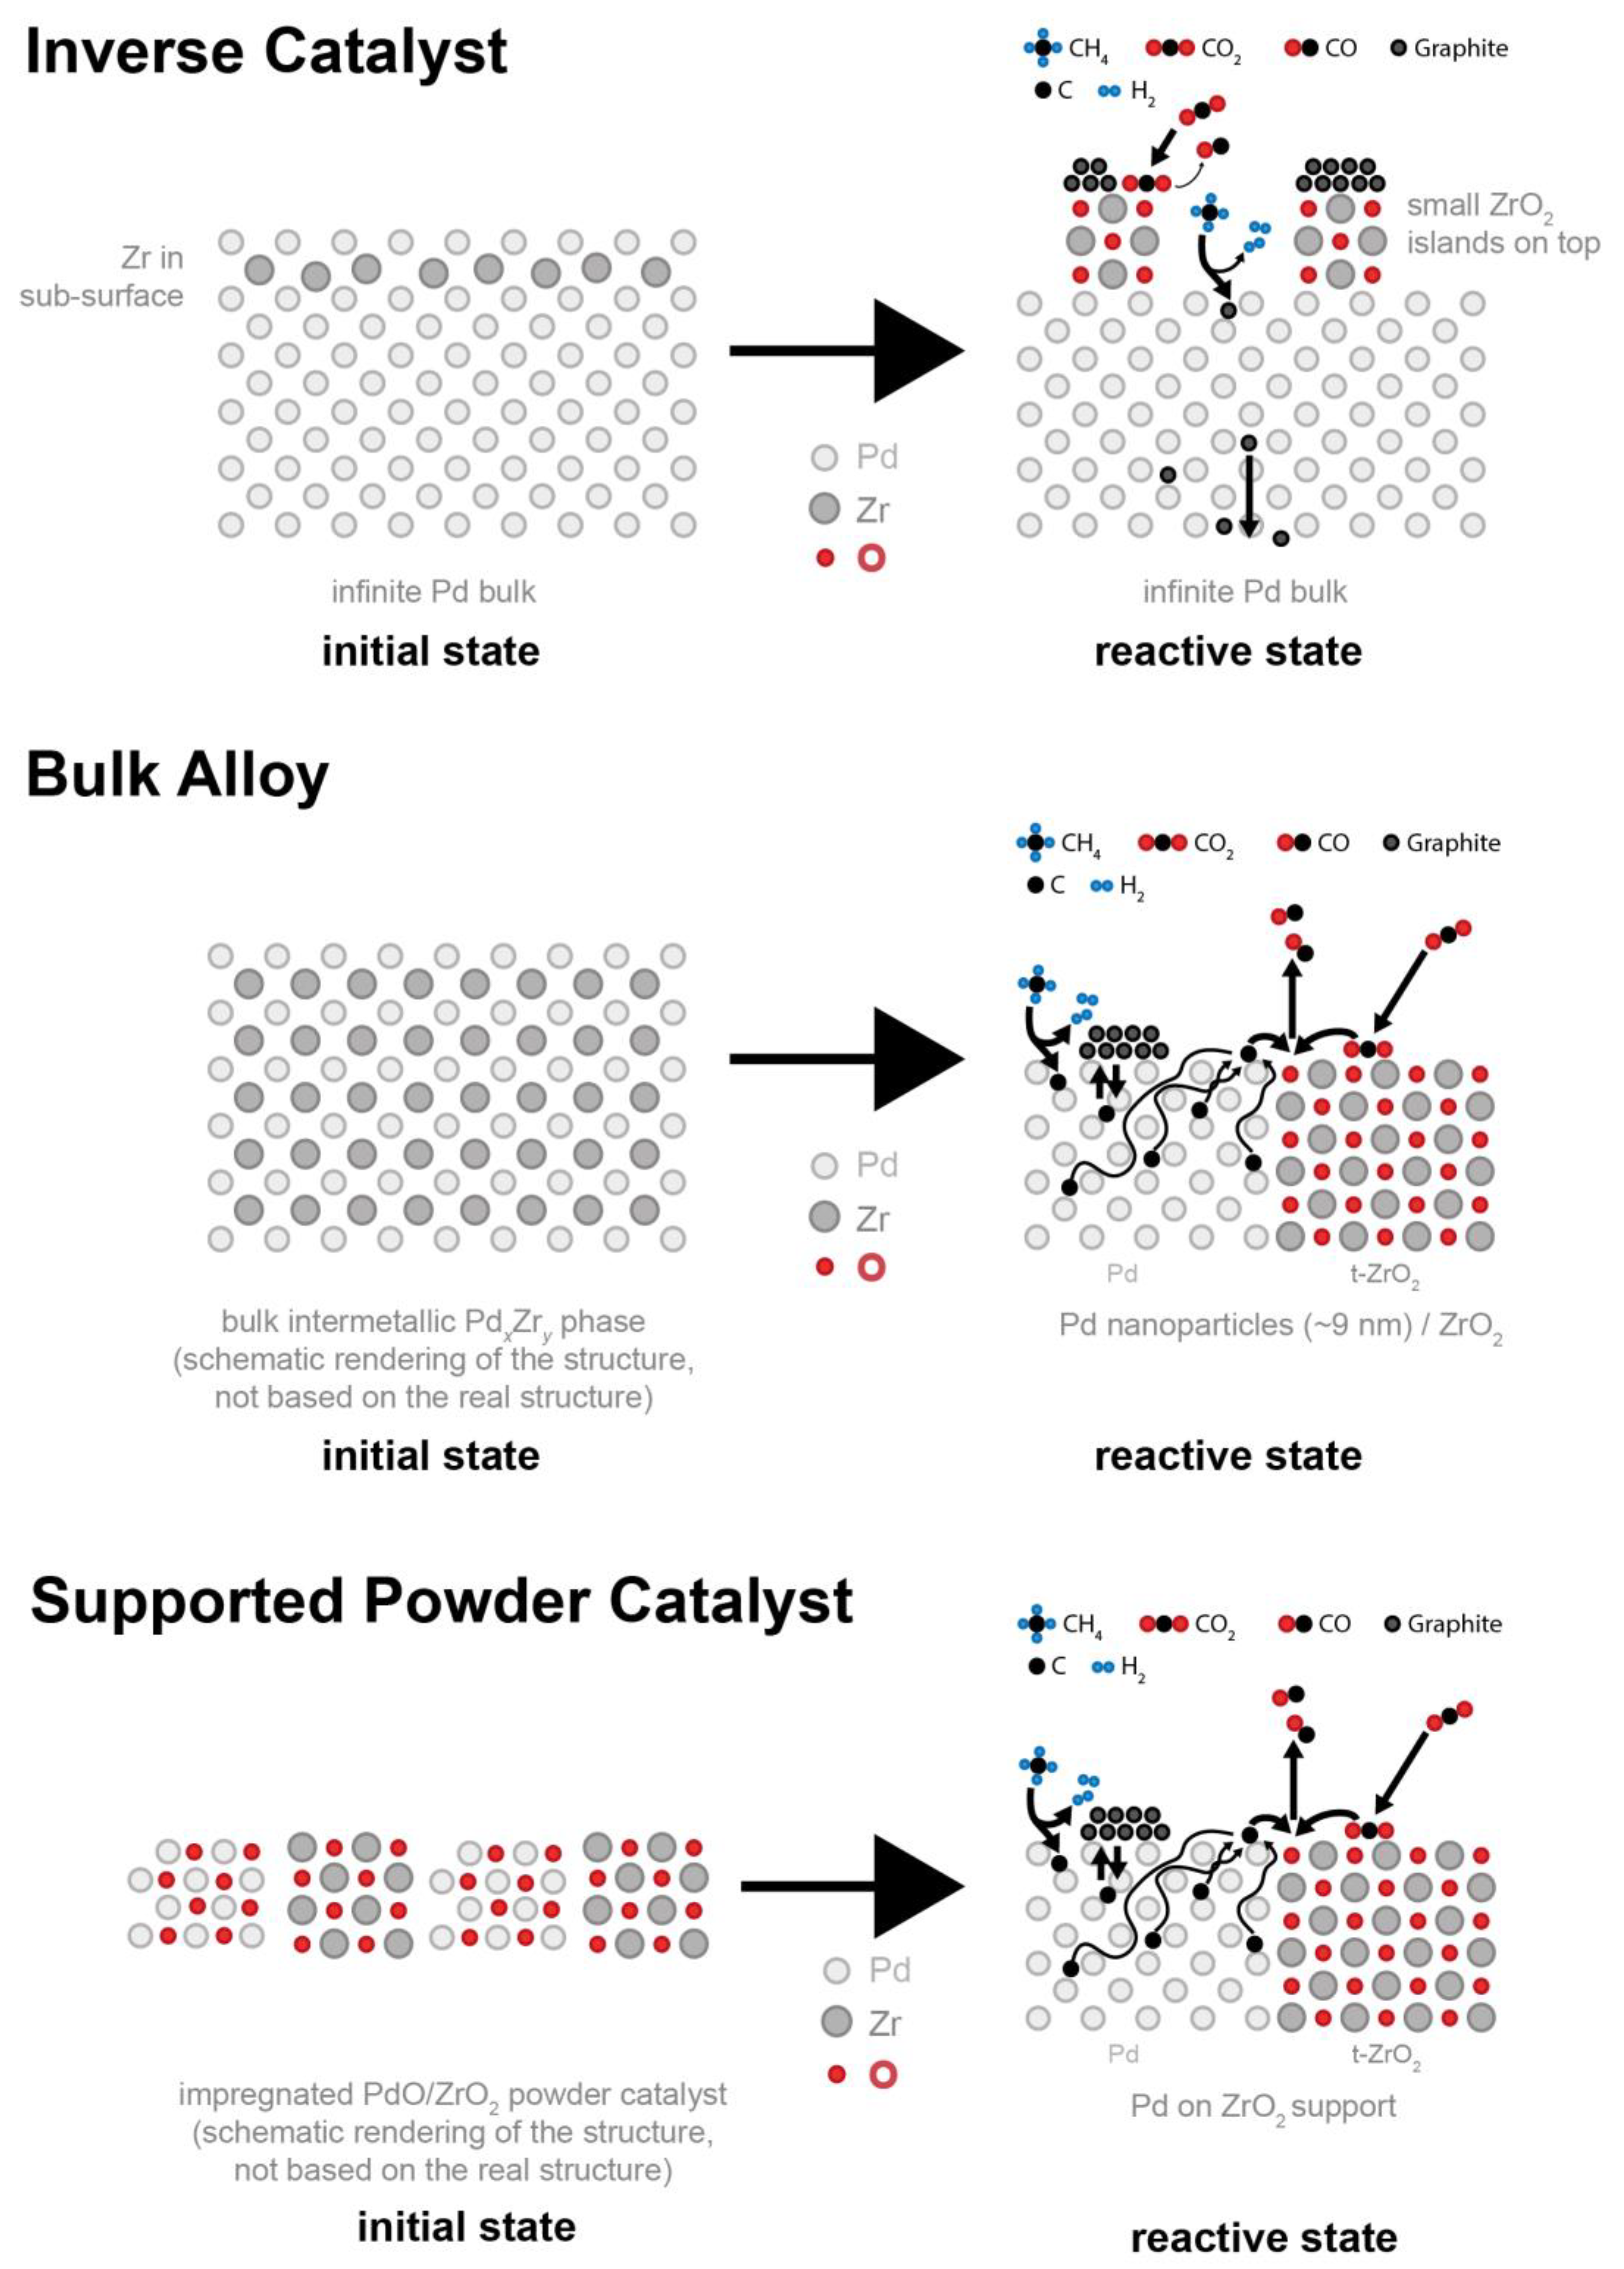
A qualitative kinetic scenario accounting for increasingly fast Cbulk depletion toward CO via the metal-oxide phase boundary at higher temperatures is proposed in the following to explain this trend, as well as to explain the differences between the “inverse” (foil-supported) and “real” (nanoparticle-based) model catalysts with respect to carbon deposition and DRM activity. Figure 13 provides a simplified schematic representation of the three types of employed model catalysts and their distinct chemical and structural development under DRM conditions.
On the CVD-prepared inverse model catalyst (top panel), finely dispersed ZrO2 islands are formed on top of a quasi-infinite Pd bulk-metal substrate. Although many metal-oxide interface sites are generated, the C supersaturation of Pd next to the latter remains low, since the C atoms can simply diffuse away. As shown in Figure 5, Section 2.2, the DRM activity is effectively not boosted by the Pd0–ZrO2 interface sites forming in situ under DRM conditions. In contrast, on the initially bulk-intermetallic PdxZry precatalyst (middle panel) Cbulk-loaded and partially graphite-covered crystalline Pd0 in close contact to t-ZrO2 is formed. Both newly formed phases—Pd and t-ZrO2—form a nanocrystalline conglomerate on top of the polycrystalline PdxZry substrate. As both a high number of active interface sites and a sufficient amount of dissolved carbon are available in close vicinity, a highly active catalyst evolves. The schematic representation of the reductive activation of the supported PdO/t-ZrO2 powder catalyst under DRM conditions toward Pd0/t-ZrO2 is depicted in the lowest panel. Based on the fact that the supported catalyst exhibits qualitatively the same catalytic profile as the initially bulk-intermetallic PdxZry catalyst (Figure 5, Section 2.2), its DRM-active state is suggested to feature the same carbon–CO2 conversion mechanism but at a strongly reduced number of active interfacial sites close to relatively large Pd particles.
As a general conclusion, carbon conversion during DRM is synergistically enhanced by the combination of an extended metal–oxide phase boundary with Cbulk-loaded nanoparticulate Pd0. The XRD results of Figure 7 in Section 2.3.1 show that the boundary forms in situ by oxidative t-ZrO2 segregation from PdxZry in the DRM gas phase and that this process leads to nanodispersed Pd0. The related NAP-C1s core level spectra on the initial bulk PdxZry precatalyst (shown in Figure 9) provide clear evidence for considerable Cbulk concentrations within the Pd0 nanoparticles but only in the presence of methane. This means that carbon needs to be permanently supplied to the Pd0 surface via dissociative CH4 activation, in order to populate the carbidic Cbulk species via C antisegregation. As soon as the methane supply is switched off, the Cbulk signal disappears immediately, whereas the Cgraphite component decreases at a much lower rate. Obviously, the atomically distributed Cbulk species is much more reactive than Cgraphite with respect to the carbon clean-off reaction in pure CO2. The CVD-prepared initial subsurface Zr0–Pd alloy does not allow for the near-surface accumulation of carbidic/interstitial Cbulk under DRM conditions (as shown in Figure 8), or this process would at least take a much longer time than that of our DRM experiments. Clearly, the dimensions of the respective Pd0 bulk play a fundamental role for the local accumulation of the reactive Cbulk intermediate. The reduced Pd0 bulk dimensions of the nanoparticles from local PdxZry corrosion obviously facilitate the near-surface and bulk accumulation of interstitially dissolved carbon. As a logical consequence, also resegregation of Cbulk atoms to the surface from sufficiently supersaturated near-surface regions will be enhanced after a much shorter period of time. The effects of this re-segregation are twofold: The (unwanted) nucleation and growth of Cgraphite domains will be facilitated [53], but—at the same time—an enhanced rate of Cbulk and/or Cads diffusion toward active interfacial sites at the Pd0–ZrO2 phase boundary will result. Thus, the much higher reaction rates on the bulk intermetallic PdxZry precursor effectively result from the combination of an extended phase boundary with the reduced Pd0 metal dimensions. As can be deduced from Figure 13, the carbon clean-off rate at the phase boundary is enhanced above 700 °C, resulting in a lower overall steady-state C1s signal but in particular lower Cbulk intensity. This is likely due to a changed balance of graphitic C formation, redissolution and clean-off rates, as sketched for the Pd0–ZrO2 nanocomposite model systems in Figure 11. A possible mechanistic explanation for the “coking window” [26,52,54,55] of DRM at lower/intermediate temperatures is typically based on the expected shift of the Boudouard equilibrium toward carbon. Assuming a steeper increase with temperature (i.e., a higher activation barrier) of the C clean-off rate at the phase boundary in comparison to the net rate of partially reversible graphene/graphite accumulation, the Boudouard process C + CO2 ⇆ 2·CO at the phase boundary can be assumed to overtake the net Cgraphite deposition rate at sufficiently high temperatures.

3. Materials and Methods

3.1. Model Catalyst Preparation

The preparation of the bulk-intermetallic PdxZry sample was realized by resistive heating of a stack of alternating small sheets of pure, clean Pd and Zr metal under high vacuum conditions (1 × 10⁻⁷ mbar) at a nominal ratio = 2:1 in a Ta crucible [35]. When the sample was heated slightly above the melting point of Pd (1555 °C), a spontaneous exothermic reaction between Pd and Zr took place, leading to an intermetallic Pd–Zr melt. The heating was turned off immediately and the melt recrystallized to form the Pd–Zr bulk phase mixture characterized in Reference [35].
As reference catalyst and substrate for PdZr subsurface alloy formation, ultra-clean Pd foil (Goodfellow, purity 99,95%, 0.1 mm thick, size 2 cm × 1.8 cm, was used. Surface preparation/ cleaning involved alternating cycles of Ar sputtering on both sides followed by thermal annealing (6.0 × 10⁻⁵ mbar Ar, 2 keV, 1 µA sample current; Tanneal = 700 °C), until XPS and AES spectra without evidence for impurity traces were obtained. The resulting cleaned Pd surface area thus amounted to 2 × 2 cm × 1.8 cm = 7.2 cm2. Based on the Pd surface atom density of 1.66 × 1015 cm−2, this corresponds to a total number of 1.2 × 10¹⁶ surface Pd atoms, on which all TOF estimations for the inverse catalysts are based. The catalytically measured molar turnover rates within an UHV-compatible recirculating batch reactor (cf. Section 3.2.2) were normalized to this number. For the Pd/Zr0 subsurface alloy preparation, Zirconium (IV) tert-butoxide (Zr(O-t-C4H9)4 (ZTB, Sigma Aldrich, purity: 99.999 %) was used as the CVD precursor molecule, which was dosed via a leak valve onto the Pd foil substrate in the ultrahigh vacuum chamber of Setup 1 (described below). After an exposure at 400 °C and a ZTB pressure of 5.0 × 10⁻⁶ mbar for 200 s, corresponding to 1.0 × 10⁻³ mbar*s, an adsorbate coverage of ≈0.5 ML was calculated using the post-deposition XPS data. The resulting ZrOx state on top of Pd0 was then thermally annealed at ≈430 °C under excellent UHV conditions. Only if the base pressure of the system was kept below 5 × 10⁻¹⁰ mbar during thermal annealing, 100% conversion to the Zr0 subsurface alloy state was achieved, which represents a strong improvement of the preparation routine relative to the partially oxidized Pd foil precatalyst state described in Reference [35], which was obtained by thermal annealing at a higher base pressure (≈5 × 10⁻⁹ mbar). As has been mentioned in Section 2.1.1, the 100% subsurface alloy state was proven via the combination of low-energy ion scattering, which showed no Zr signal after annealing and XPS, which proved the exclusively bimetallic state of Zr0 at a binding energy of 179.6 eV.
The preparation of the supported Pd0/ZrO2 reference catalyst involved aqueous impregnation of a ZrO2 suspension (Alfa Aesar, 20% in H2O) with Pd(NO3)2 · 2H2O (Sigma Aldrich) to obtain a final 10% (mass) loading of the catalyst after reduction to Pd0. Thereafter, calcination for 5 h at 800 °C in air (fast heating and cooling) was performed. After this step, the BET surface area amounted to 15 m2/g. After subsequent prereduction in H2 and quantitative thermal desorption of the latter, a Pd metal surface area of ~0.2 m2 per g catalyst was calculated on the basis of a 0.5 ML CO saturation coverage, using a combination of volumetric CO adsorption and quantitative thermal desorption spectrometry [56]. This corresponds to a rather low Pd dispersion of ~0.6%. Finally, catalytic testing was started from the H2-prereduced state in a recirculating batch reactor setup using the reaction parameters described in Section 3.2.3. The surface atom density of Pd(111) of 1.66 × 10¹⁵ atoms per cm2 provides the basis of all turnover frequency (TOF) estimations. The CO-TPD-based calculations mentioned above allow to extract the number of Pd surface atoms of the supported catalyst—73 mg powder catalyst contain ~140 cm2 Pd surface area, corresponding to ~2.3 × 10¹⁷ Pd surface atoms. The catalytically measured molar turnover rates within the reactor were normalized to this number.

3.2. Experimental Setups for in- and ex-Situ Characterization and Catalytic Testing of Model Catalysts

For catalytic testing, ex-situ structural and electronic characterization and complementary in-situ structural vs. electronic characterization under close-to-real DRM conditions, six different experimental setups, two of them being synchrotron end stations, were used:

3.2.1. STM/XPS/LEIS/LEED Setup for Subsurface Alloy Characterization (TU Vienna)

This UHV system consists of a preparation chamber with a base pressure below 10−10 mbar and an analysis chamber for scanning tunneling microscopy (STM), X-ray photoelectron spectroscopy (XPS), low-energy electron diffraction (LEED) and low-energy ion scattering (LEIS) measurements, with a base pressure of ~7 × 10⁻¹¹ mbar. For all measurements with this setup, a Pd(111) single crystal (MaTecK) was used and prepared by cycles of 10 min sputtering (2 keV Ar+ ions and a sputter-current density of approx. 2 μA/cm2) and 10 min annealing (T ≈ 873 K). To generate the XP spectra, a non-monochromatized Mg Kα source (hν = 1253.6 eV, 225 W) and a SPECS PHOIBOS 100 analyzer with a pass energy of 16 eV were utilized. The photoelectrons were collected at an angle of 15° with respect to the surface normal. Temperatures were measured with a K-type thermocouple spot-welded near the sample support plate. STM measurements were conducted using an Omicron μ-STM with electrochemically etched W tips in constant current mode. Sample heating was performed in the preparation chamber.

3.2.2. Combined XPS/High Pressure Batch Reactor Setup (University of Innsbruck)

The UHV system with an attached all-quartz recirculating batch reactor, described in detail in Reference [57], was used for the CVD preparation of the subsurface Zr0/Pd-foil samples explained in Section 3.1. Beyond its use as CVD coating chamber, it is designed for quantitative catalytic/kinetic studies up to 1 bar on poly- or single-crystalline bulk samples, detecting products by online mass-spectroscopy (MS) analysis (HP GC-MS System G1800A) via a capillary leak and/or by conventional GC-MS analysis via column injection. MS signals of CH4, CO, and CO2 (m/z = 15 + 16, 28, and 44) were externally calibrated and corrected for fragmentation. Hydrogen can be quantified using an additional detection line to a differentially pumped Balzers QMA 125 quadrupole mass spectrometer. Ex-situ surface analysis was performed using a XPS/AES/LEIS spectrometer (Thermo Electron Alpha 110) and a twin Mg/Al-anode X-ray gun (XR 50, SPECS). All DRM reactions were conducted with initial partial pressures of CH4:CO2 = 50:50 mbar. The batch reaction cell was backfilled with pure He to a total pressure of 970 mbar in order to achieve efficient gas intermixing via recirculation and fast heat transfer to the sample via sufficient thermal conductivity. For DRM catalysis, the reactor was heated at a constant linear rate of 25 K/min to the final temperature of 800 °C and then kept isothermally at this temperature for ≈30 min. From the product partial-pressure vs. time plots, the reaction rates were obtained by differentiation. The partial-pressure changes per minute [mbar/min] were then converted to molar rates and finally to turnover frequency values (TOF) on the basis of the total Pd surface atom number of the respective (model) catalyst. A mean value of the Pd metal surface atom density of 1.66 × 10¹⁹ atoms/m2 was assumed.

3.2.3. Recirculation Batch Reactor for Supported Powder Catalysts (University of Innsbruck)

Catalytic testing of the powder catalysts was performed in a recirculating batch reactor connected to a quadrupole mass spectrometer (QMS) arranged in cross-beam geometry, equipped with a secondary electron multiplier (Balzers QMG 311). This setup is specialized for the measurement of small sample amounts (approximately 100 mg) and conversions (reactor volume = 13.8 mL). The reactor and the sample holder are made of quartz glass and can be heated up to 1100 °C using a Linn FRV-25/150/1100 high-temperature furnace. The temperature is monitored directly at the sample position by means of a quartz-capillary-shielded K-type thermocouple (NiCr-Ni). For the DRM measurements, a CH4:CO2 = 1:1 mbar mixture was used. One DRM cycle consists of three steps—(1) pre-oxidation at 400 °C in 1 bar pure O2 for 1 h, (2) pre-reduction at 600 °C in 1 bar pure H2 for 1 h and (3) DRM reaction. The latter is quantified on the basis of the addition of Ar to the initial DRM mixture, whereby the Ar signal is used for correction of the intrinsic (reaction-independent) mass spec signal changes due to the thermal expansion and the gas withdrawal through a capillary leak to the QMS. In analogy to Section 3.2.2, the total pressure in the reactor is increased to 1 bar with He for improvement of the recirculation efficiency and the thermal conductivity. Starting from 100 °C, a heating ramp with 10 °C min−1 is applied and the gas-phase composition is continuously monitored by QMS. The signals of H2, CH4, CO, and CO2 (m/z= 2, 15, 28, and 44) were externally calibrated and corrected for fragmentation.

3.2.4. In-Situ XRD at the Advanced Light Source (ALS) at LNBL

The bulk structural changes of the melt-prepared intermetallic PdZr sample were investigated in situ during heating under DRM conditions by synchrotron-based XRD [58,59] at the Beamline 12.2.2 (Advanced Light Source ALS, Lawrence Berkeley National Laboratories-LBNL, California). X-ray diffraction was performed with a monochromatic beam (30 µm spot size, 0.5172 Å, MAR345 detector, 300 s total acquisition time) in transmission mode with a beam energy of 24 keV, just below the Pd K edge at 24.3503 keV, in order to achieve sufficient pattern intensity. The Fit2d software [60] was used for calibration and integration. Detector-sample distance and wavelength were determined using the NIST standard reference material 660b, LaB6. The sample was powder-ground before being transferred to a 700 µm quartz capillary. The desired gas atmosphere was achieved by injection of a 1:1 CH4:CO2 mixture (flow rate: 1 mL/min each, ambient pressure) and a heating rate of 20 K/min to 800 °C was applied for DRM testing. All references plotted in the XRD Figures are derived from the ICDD database and are labeled with their corresponding #ICDD numbers.

3.2.5. In-Situ NAP-XPS at ISISS End-Station at HZB/BESSYII

The vacuum chamber operated at beamline ISISS-PGM at the BESSY II synchrotron/ Helmholtz Center for Materials and Energy Berlin (HZB) allowed us to perform NAP-XPS characterization of the bulk- and surface-intermetallic PdZr model catalysts up to 1 mbar total DRM reactant pressures [61]. The subsurface Zr0/Pd-foil and bulk PdxZry precatalyst samples were positioned inside the high-pressure analysis chamber ≈1 mm away from a 1 mm aperture, which is the entrance to the differentially-pumped electrostatic lens system separating gas molecules from photoelectrons focused toward the SPECS hemispherical analyzer. Binding energies were referenced to the Fermi edge recorded after each scan. The temperature was measured by a K-type Ni/NiCr thermocouple directly spot-welded to the sample and temperature-programmed heating was done by an IR laser from the rear. The subsurface alloy sample was prepared in setup 3.2.2. as described above and then transferred to BESSY II under dry inert Ar gas conditions provided inside a transportable Schlenk sample flask. For final transfer to the NAP-XPS chamber, it was briefly exposed to ambient pressure conditions at ≈293 K. Nevertheless, only minor signs of oxidative Zr segregation were visible thereafter, even at low photoelectron kinetic energies (i.e., at high surface sensitivity). The bulk intermetallic samples were also transferred to BESSY II in inert gas after the above-described melt preparation but due to the coexistence of Zr0 and Pd0 metal in the surface, already the initial (pre-DRM) sample showed a considerable degree of oxidative segregation toward ZrO2 and Pd0 after the contact to the ambient (cf. Figure 6, Section 2.3.1).
Photon energies were chosen to result in kinetic energies of 400 eV (unless otherwise stated in the Figure or text) of the ejected photoelectrons for the main peaks of all spectral regions recorded, in order to extract information from a constant information depth and to yield the same attenuation of the photoelectrons through the gas phase. Photoelectrons were collected in the direction normal to the surface at a constant pass energy of 10 eV. Photoemission peak intensities are corrected for the respective photon flux at a given photon energy. Since the BESSY II synchrotron operates in top-up mode (constant ring current), no additional correction for the ring current was required. Since all photoemission peaks were collected at the same kinetic energy of the photoelectrons, the overall attenuation effects were the same for all-core levels and, thus, cancel out in quantification routines.

3.2.6. High-Resolution Transmission Electron Microscopy

Electron microscopic characterization and the in-situ reduction of the supported PdO/ZrO2 powder catalyst from the calcined to the metallic state were performed using a double aberration corrected JEOL Grand ARM transmission electron microscope. The instrument was operated at 300 kV. In-situ reduction was performed using the Climate System of DensSolutions.

3.3. Details of XPS Analysis

All XPS data (ex- and in-situ) were analyzed using the CasaXPS software program, version 2.3.16 Pre-rel 1.4 (Casa Software Ltd., Teignmouth, United Kingdom) [62]. For quantification and peak fitting, a Shirley background was applied to all spectra and the associated Scofield relative sensitivity factors [63] were used for quantification. All binding energies were referenced to the Fermi edge. For each spectral region recorded at the ISISS station, the Fermi edge was recorded after the monochromator moved to its new position, that is, whenever the incident photon energy was changed. Peak fitting of the Pd 3d5/2, O 1s and C 1s peaks was conducted using a weighted sum of Gaussian and Lorentzian peak shapes with a GL(30) contribution (corresponding to 30% Gaussian/Lorentzian character). Asymmetric parameters were used for Pd 3d5/2 fitting of Pd0 (GL(30) with exponential tailing T(1.3)) and PdxC (GL(30), exponential tailing T(1.5)) as well as for C 1s fitting of graphite (GL(30)T(1.1)) and PdxC (GL(30)T(1.3)). Regarding the BE component assignment, all Pd 3d5/2 spectra show a component at a BE of 333.5 eV (labelled as O 1s 2nd harm.), which is caused by the O 1s signal excited by the second diffraction order of the synchrotron radiation at the plane grating monochromator. Deconvolution of all Pd 3d5/2 spectra involved the metallic Pd component at a BE of 335.0 eV and the carbidic PdxC component at a BE of 335.6 eV [49,50].
Different C1s components are considered in all C 1s spectra, namely carbonates and carbon-oxygenates above 287 eV and CxHy species at BEs of ≈285.4 eV [45,46,47,64]. The component at a BE of 283.0 eV is assigned to interstitial/carbidic C in PdxC [65]. The O 1s components of the CVD-prepared ZrxOy layers were fitted with GL(30) parameters and assigned to binding energies taken from References [38,39,40] to distinguish between ultrathin zirconia (≈530 eV) vs. bulk t-ZrO2 (≈531 eV) and are in good agreement with the fitted values of the corresponding Zr 3d region (cf. Figure 1). The fit of the superimposed Pd 3p component was performed using the clean Pd surface as a reference and GL(70)T(1.8) parameters and the plasmonic component according to reference [66]. All components in the Zr 3d region were fitted with GL(30) peak shapes, only the metallic Zr0 component was fitted with LF(1, 1.8, 30, 90) parameters (asymmetric peak shape). Electron attenuation lengths were taken from the NIST database SR 82 [67]. The orbital asymmetric parameters were taken from the ELETTRA online database [68].

4. Conclusions

The near-surface regions of a bulk PdxZry precatalyst are oxidatively decomposed under realistic DRM conditions and the resulting Pd0 nanoparticles provide an appropriate carbon loading at the resulting Pd0/t-ZrO2 interface at ≈700 °C. In due course, this creates locally optimized conditions for bifunctional catalyst operation—Pd0 regions favor CH4 activation and fast supply of reactive C-atoms toward the phase boundary, whereas redox-active ZrOx sites [15,28] assist in CO2 activation and the transfer of CO2-derived oxygen to the latter, thus providing optimum conditions for high CO activity. The CVD-prepared sub-surface Zr0–Pd alloy precatalyst does not become a catalyst with these outstanding catalytic properties, mainly due to the absence of reactive carbidic/dissolved carbon at the in-situ formed ZrO2–Pd0 phase-boundary, as sufficient carbon supersaturation of an infinite Pd bulk material is much harder to achieve under otherwise identical reaction conditions. Consequently, reduced Pd nanoparticle dimensions facilitate and accelerate the accumulation of reactive carbidic/dissolved carbon in the near-surface regions and, most importantly, at the active ZrO2–Pd0 phase boundary, due to kinetically enhanced carbon resegregation.
As a more general remark, empirical approaches to suppress coking of the less costly Ni catalysts by specifically active supports such as CeZrOx [7,69,70] and La2O2CO3/La2O3 [32] seem to make use of the “reactive phase boundary” principle. As both Ni and Pd are capable of (re)dissolving carbonaceous species, we suggest an analogous mechanism for the most favorable NiPd/ZrO2-based catalysts [19]—faster C-depletion of the metallic component via an accelerated phase-boundary reaction can directly lower the C concentration of the metal particles and thus initially disfavor nucleation and growth of graphite-type C-species but also enhance the relative amount of redissolution of the latter in the metal as Cbulk under stationary reaction conditions. This mechanistic scenario suggests a knowledge-based approach toward directional promotion of microkinetic steps leading to the required combination of enhanced activity and improved coking control.
More specifically, our results provide strong additional support and/or rationalization of the cooperative action of these already individually known general principles on our specific bulk-intermetallic model system, which adds—at least in our view—an important aspect for knowledge-based DRM catalyst design. We highlight that a fruitful combination of these principles can be obtained with intermetallic precursors. Thus, for improving the DRM performance one needs to simultaneously optimize (1) the phase boundary dimensions, (2) the CO2 activation properties of the support, (3) the (bi)metal particle size, (4) suppress nucleation and growth kinetics of graphitic C species, (5) optimize the surface- and bulk-diffusion-controlled abundance and reactivity of interfacial Cads species and (6) optimize the CH4 adsorption kinetics (reactive sticking probabilities) at the (bi)metallic surface. As shown in this work, the use of intermetallic precursors such as PdxZry represents an efficient approach to match these criteria. While functions (1) and (3) can be controlled via the chosen synthesis route, critical parameters for function (2) encompass surface reducibility, basicity, reactivity of oxygen vacancies toward CO2 and the overall CO2 bond strength [71]. Functions (4) to (6) are linked to the (bi)metallic component of the active catalyst and require a delicate balance between optimized CH4 activation, Cads reactivity via electronic modulation of for example, C bond strength [27] and low barriers for Cbulk/Cads diffusion and in particular for redissolution of Cgraphite.
The detailed reaction mechanism of CO2 splitting toward reactive oxygen-, carbonate- and/or formate-type species [48,71] at the phase boundary remains to be clarified. The XPS-fitted C1s-oxygenated species (see Figure 9 and Figure 10), which appear to reside at the phase boundary and/or the “inner” oxidic surface, exhibit a partially reversible dynamic response to gas-phase and temperature changes. For example, support acidity vs. basicity has been proposed to influence their specific nature and distribution at the phase boundary [72]. CO2 splitting may proceed both via reactive vacancies at the phase boundary or via intermediate vacancy-bonded oxygenates [73,74].
As a general note, we emphasize that intermetallic catalyst precursors such as PdZr feature a double advantage—they can both serve as highly useful UHV- and electron spectroscopy-compatible model catalysts and, at the same time, they exhibit superior catalytic performance.

Author Contributions

Conceptualization, B.K., S.P.; methodology, E.C., A.K.-G., A.G., M.H., A.D.; validation, K.P., N.K.; formal analysis, N.K., K.P., L.S., D.K., M.W., P.L., M.S.; investigation, N.K., K.P., A.D., T.G., C.T., P.L., M.W.; resources, K.P., N.K., P.L.; data curation, E.C., M.H., M.S.; writing—original draft preparation, B.K., N.K., S.P.; writing—review and editing, A.G.; visualization, N.K., K.P., L.S., M.W., M.S.; supervision, M.H., A.K.-G., E.C.; project administration, B.K.; funding acquisition, B.K. All authors have read and agreed to the published version of the manuscript.

Funding

This work was financially supported by the Austrian Science Fund FWF through SFB F45 “FOXSI” grants F4501-N16, F4503-N16 and F4505-N16. N. Köpfle acknowledges a PhD position via doctoral program “Reactivity and Catalysis” of the University of Innsbruck. Financial support by the project CALIPSOplus under the Grant Agreement 730872 from the EU Framework Programme for Research and Innovation HORIZON 2020 is acknowledged. This research used resources of the Advanced Light Source, which is a DOE Office of Science User Facility under Contract No. DE-AC02-05CH11231. L. Schlicker acknowledges the funding of his work by an ALS doctoral fellowship. T. Götsch additionally acknowledges funding by the FWF (Austrian Science Fund) via project number J4278.

Acknowledgments

The authors thank the HZB/BESSY II staff for their support of the in-situ XPS measurements at beamline ISISS-PGM.

Conflicts of Interest

The authors declare no conflict of interest.

References

  1. Alyea, E.C.; He, D.; Wang, J. Alcohol synthesis from syngas. Appl. Catal. A Gen. 1993, 104, 77–85. [Google Scholar] [CrossRef]
  2. Wang, S.; Lu, G.; Millar, G.J. Carbon dioxide reforming of methane to produce synthesis gas over metal-supported catalysts: State of the art. Energy Fuels 1996, 10, 896–904. [Google Scholar] [CrossRef]
  3. Ghoneim, S.A.; El-Salamony, R.A.; El-Temtamy, S.A. Review on innovative catalytic reforming of natural gas to syngas. World J. Eng. Technol. 2016, 4, 116–139. [Google Scholar] [CrossRef] [Green Version]
  4. Minardi, E.; Chakraborty, S.; Curcio, S. Membrane reactors for dry reforming of methane. In Membrane Reactors for Energy Applications and Basic Chemical Production; Elsevier B.V., Radarweg 29, 1043 NX; Elsevier: Amsterdam, The Netherlands, 2015; pp. 99–144. [Google Scholar] [CrossRef]
  5. Bosko, M.; Múnera, J.; Lombardo, E.; Cornaglia, L. Dry reforming of methane in membrane reactors using Pd and Pd–Ag composite membranes on a NaA zeolite modified porous stainless steel support. J. Membr. Sci. 2010, 364, 17–26. [Google Scholar] [CrossRef]
  6. Oyama, S.T.; Hacarlioglu, P.; Gu, Y.; Lee, D. Dry reforming of methane has no future for hydrogen production: Comparison with steam reforming at high pressure in standard and membrane reactors. Int. J. Hydrogen Energy 2012, 37, 10444–10450. [Google Scholar] [CrossRef]
  7. Wolfbeisser, A.; Sophiphun, O.; Bernardi, J.; Wittayakun, J.; Föttinger, K.; Rupprechter, G. Methane dry reforming over ceria-zirconia supported Ni catalysts. Catal. Today 2016, 277, 234–245. [Google Scholar] [CrossRef] [Green Version]
  8. Ashcroft, A.T.; Cheetham, A.K.; Green, M.L.H.; Vernon, P.D.F. Partial oxidation of methane to synthesis gas using carbon dioxide. Nature 1991, 352, 225–226. [Google Scholar] [CrossRef]
  9. Rostrupnielsen, J.; Hansen, J. CO2-Reforming of Methane over Transition Metals. J. Catal. 1993, 144, 38–49. [Google Scholar] [CrossRef]
  10. Bradford, M.C.; Vannice, M.A. Catalytic reforming of methane with carbon dioxide over nickel catalysts I. Catalyst characterization and activity. Appl. Catal. A Gen. 1996, 142, 73–96. [Google Scholar] [CrossRef]
  11. Sakai, Y.; Saito, H.; Sodesawa, T.; Nozaki, F. Catalytic reactions of hydrocarbon with carbon dioxide over metallic catalysts. React. Kinet. Catal. Lett. 1984, 24, 253–257. [Google Scholar] [CrossRef]
  12. Ferreira-Aparicio, P.; Márquez-Álvarez, C.; Rodríguez-Ramos, I.; Schuurman, Y.; Ruiz, A.G.; Mirodatos, C. A transient kinetic study of the carbon dioxide reforming of methane over supported Ru catalysts. J. Catal. 1999, 184, 202–212. [Google Scholar] [CrossRef]
  13. Kehres, J.; Jakobsen, J.G.; Andreasen, J.W.; Wagner, J.B.; Liu, H.; Molenbroek, A.; Sehested, J.; Chorkendorff, I.; Vegge, T. Dynamical properties of a Ru/MgAl2O4 catalyst during reduction and dry methane reforming. J. Phys. Chem. C 2012, 116, 21407–21415. [Google Scholar] [CrossRef]
  14. Solymosi, F.; Kutsán, G.; Erdőhelyi, A. Catalytic reaction of CH4 with CO2 over alumina-supported Pt metals. Catal. Lett. 1991, 11, 149–156. [Google Scholar] [CrossRef]
  15. Bitter, J.; Seshan, K.; Lercher, J. Mono and Bifunctional Pathways of CO2/CH4 Reforming over Pt and Rh Based Catalysts. J. Catal. 1998, 176, 93–101. [Google Scholar] [CrossRef] [Green Version]
  16. Zhao, Y.; Pan, Y.-X.; Xie, Y.; Liu, C.-J. Carbon dioxide reforming of methane over glow discharge plasma-reduced Ir/Al2O3 catalyst. Catal. Commun. 2008, 9, 1558–1562. [Google Scholar] [CrossRef]
  17. Rameshan, C.; Li, H.; Anic, K.; Roiaz, M.; Pramhaas, V.; Blume, R.; Hävecker, M.; Knudsen, J.; Knop-Gericke, A.; Rupprechter, G.; et al. In situ NAP-XPS spectroscopy during methane dry reforming on ZrO2/Pt(111) inverse model catalyst. J. Phys. Condens. Matter 2018, 30, 264007. [Google Scholar] [CrossRef]
  18. Köpfle, N.; Götsch, T.; Grünbacher, M.; Carbonio, E.; Hävecker, M.; Knop-Gericke, A.; Schlicker, L.; Doran, A.; Kober, D.; Gurlo, A.; et al. Zirconium-assisted activation of palladium to boost syngas production by methane dry reforming. Angew. Chem. Int. Ed. 2018, 57, 14613–14618. [Google Scholar] [CrossRef]
  19. Steinhauer, B.; Reddy, K.M.; Radnik, J.; Martin, A. Development of Ni-Pd bimetallic catalysts for the utilization of carbon dioxide and methane by dry reforming. Appl. Catal. A Gen. 2009, 366, 333–341. [Google Scholar] [CrossRef]
  20. Pakhare, D.; Spivey, J.J. A review of dry (CO2) reforming of methane over noble metal catalysts. Chem. Soc. Rev. 2014, 43, 7813–7837. [Google Scholar] [CrossRef]
  21. Strasser, P.; Koh, S.; Anniyev, T.; Greeley, J.; More, K.L.; Yu, C.; Liu, Z.; Kaya, S.; Nordlund, D.; Ogasawara, H.; et al. Lattice-strain control of the activity in dealloyed core–shell fuel cell catalysts. Nat. Chem. 2010, 2, 454–460. [Google Scholar] [CrossRef]
  22. Liu, P.; Nørskov, J.K. Ligand and ensemble effects in adsorption on alloy surfaces. Phys. Chem. Chem. Phys. 2001, 3, 3814–3818. [Google Scholar] [CrossRef]
  23. Gao, F.; Goodman, D.W. Pd–Au bimetallic catalysts: Understanding alloy effects from planar models and (supported) nanoparticles. Chem. Soc. Rev. 2012, 41, 8009–8020. [Google Scholar] [CrossRef]
  24. Zhang, J.; Wang, H.; Dalai, A. Development of stable bimetallic catalysts for carbon dioxide reforming of methane. J. Catal. 2007, 249, 300–310. [Google Scholar] [CrossRef]
  25. Wei, J.; Iglesia, E. Isotopic and kinetic assessment of the mechanism of reactions of CH4 with CO2 or H2O to form synthesis gas and carbon on nickel catalysts. J. Catal. 2004, 224, 370–383. [Google Scholar] [CrossRef]
  26. Bradford, M.C.J.; Vannice, M.A. CO2 Reforming of CH4. Catal. Rev. 1999, 41, 1–42. [Google Scholar] [CrossRef]
  27. Foppa, L.; Silaghi, M.-C.; Larmier, K.; Comas-Vives, A. Intrinsic reactivity of Ni, Pd and Pt surfaces in dry reforming and competitive reactions: Insights from first principles calculations and microkinetic modeling simulations. J. Catal. 2016, 343, 196–207. [Google Scholar] [CrossRef]
  28. Bitter, J.; Seshan, K.; Lercher, J. The State of Zirconia Supported Platinum Catalysts for CO2/CH4 Reforming. J. Catal. 1997, 171, 279–286. [Google Scholar] [CrossRef] [Green Version]
  29. Foppa, L.; Margossian, T.; Kim, S.M.; Müller, C.R.; Coperet, C.; Larmier, K.; Comas-Vives, A. Contrasting the Role of Ni/Al2O3 Interfaces in Water–Gas Shift and Dry Reforming of Methane. J. Am. Chem. Soc. 2017, 139, 17128–17139. [Google Scholar] [CrossRef]
  30. Kühl, S.; Düdder, H.; Girgsdies, F.; Kähler, K.; Muhler, M.; Behrens, M. Perovskites as Precursors for Ni/La2O3Catalysts in the dry reforming of methane: Synthesis by constant pH co-precipitation, reduction mechanism and effect of Ru-doping. Z. Anorg. Allg. Chem. 2017, 643, 1088–1095. [Google Scholar] [CrossRef]
  31. Gallego, G.S.; Mondragón, F.; Tatibouët, J.-M.; Barrault, J.; Batiot-Dupeyrat, C. Carbon dioxide reforming of methane over La2NiO4 as catalyst precursor—Characterization of carbon deposition. Catal. Today 2008, 133, 200–209. [Google Scholar] [CrossRef]
  32. Bonmassar, N.; Bekheet, M.F.; Schlicker, L.; Gili, A.; Gurlo, A.; Doran, A.; Gao, Y.; Heggen, M.; Bernardi, J.; Klötzer, B.; et al. In situ-determined catalytically active state of LaNiO3 in methane dry reforming. ACS Catal. 2019, 10, 1102–1112. [Google Scholar] [CrossRef]
  33. Armbruster, M. Intermetallic compounds in catalysis. Encycl. Catal. 2011. [Google Scholar] [CrossRef]
  34. Köpfle, N.; Mayr, L.; Schmidmair, D.; Bernardi, J.; Knop-Gericke, A.; Hävecker, M.; Klötzer, B.; Penner, S. A comparative discussion of the catalytic activity and CO2-Selectivity of Cu-Zr and Pd-Zr (Intermetallic) compounds in methanol steam reforming. Catalysts 2017, 7, 53. [Google Scholar] [CrossRef] [Green Version]
  35. Köpfle, N.; Mayr, L.; Lackner, P.; Schmid, M.; Schmidmair, D.; Götsch, T.; Penner, S.; Klötzer, B. Zirconium-palladium interactions during dry reforming of methane. ECS Trans. 2017, 78, 2419–2430. [Google Scholar] [CrossRef]
  36. Wittich, K.; Krämer, M.; Bottke, N.; Schunk, S.A. Catalytic dry reforming of methane: Insights from model systems. ChemCatChem 2020, 12, 2130–2147. [Google Scholar] [CrossRef]
  37. Li, H.; Choi, J.-I.J.; Mayr-Schmölzer, W.; Weilach, C.; Rameshan, C.; Mittendorfer, F.; Redinger, J.; Schmid, M.; Rupprechter, G. Growth of an ultrathin zirconia film on Pt3Zr examined by high-resolution X-ray photoelectron spectroscopy, temperature-programmed desorption, scanning tunneling microscopy, and density functional theory. J. Phys. Chem. C 2015, 119, 2462–2470. [Google Scholar] [CrossRef]
  38. Lackner, P.; Hulva, J.; Köck, E.-M.; Mayr-Schmölzer, W.; Choi, J.I.J.; Penner, S.; Diebold, U.; Mittendorfer, F.; Redinger, J.; Klötzer, B.; et al. Water adsorption at zirconia: From the ZrO2(111)/Pt3Zr(0001) model system to powder samples. J. Mater. Chem. A 2018, 6, 17587–17601. [Google Scholar] [CrossRef] [Green Version]
  39. Lackner, P.; Zou, Z.; Mayr, S.; Diebold, U.; Schmid, M. Using photoelectron spectroscopy to observe oxygen spillover to zirconia. Phys. Chem. Chem. Phys. 2019, 21, 17613–17620. [Google Scholar] [CrossRef] [Green Version]
  40. Choi, J.I.J.; Mayr-Schmölzer, W.; Mittendorfer, F.; Redinger, J.; Diebold, U.; Schmid, M. The growth of ultra-thin zirconia films on Pd3Zr(0001). J. Phys. Condens. Matter 2014, 26, 225003. [Google Scholar] [CrossRef]
  41. Antlanger, M.; Mayr-Schmölzer, W.; Pavelec, J.; Mittendorfer, F.; Redinger, J.; Varga, P.; Diebold, U.; Schmid, M. Pt3Zr(0001): A substrate for growing well-ordered ultrathin zirconia films by oxidation. Phys. Rev. B 2012, 86, 035451. [Google Scholar] [CrossRef] [Green Version]
  42. Lackner, P.; Choi, J.I.J.; Diebold, U.; Schmid, M. Substoichiometric ultrathin zirconia films cause strong metal–support interaction. J. Mater. Chem. A 2019, 7, 24837–24846. [Google Scholar] [CrossRef] [Green Version]
  43. Konvicka, C.; Jeanvoine, Y.; Lundgren, E.; Kresse, G.; Schmid, M.; Hafner, J.; Varga, P. Surface and subsurface alloy formation of vanadium on Pd(111). Surf. Sci. 2000, 463, 199–210. [Google Scholar] [CrossRef]
  44. Niessen, A.K.; Miedema, A.R. The enthalpy effect on forming diluted solid solutions of two 4d and 5d transition metals. Ber. Bunsenges. Phys. Chem. 1983, 87, 717–725. [Google Scholar] [CrossRef]
  45. Wolfbeisser, A.; Klötzer, B.; Mayr, L.; Rameshan, R.; Zemlyanov, D.; Bernardi, J.; Föttinger, K.; Rupprechter, G. Surface modification processes during methane decomposition on Cu-promoted Ni–ZrO2 catalysts. Catal. Sci. Technol. 2014, 5, 967–978. [Google Scholar] [CrossRef] [Green Version]
  46. Belton, D.N. Electron spectroscopic identification of carbon species formed during diamond growth. J. Vac. Sci. Technol. A 1990, 8, 2353–2362. [Google Scholar] [CrossRef]
  47. Bastl, Z. X-Ray photoelectron spectroscopic studies of palladium dispersed on carbon surfaces modified by ion beams and plasmatic oxidation. Collect. Czechoslov. Chem. Commun. 1995, 60, 383–392. [Google Scholar] [CrossRef]
  48. Kogler, M.; Köck, E.-M.; Klötzer, B.; Perfler, L.; Penner, S. Surface reactivity of YSZ, Y2O3, and ZrO2 toward CO, CO2, and CH4: A comparative discussion. J. Phys. Chem. C 2016, 120, 3882–3898. [Google Scholar] [CrossRef] [Green Version]
  49. Balmes, O.; Resta, A.; Wermeille, D.; Felici, R.; Messing, M.E.; Deppert, K.; Liu, Z.; Grass, M.E.; Bluhm, H.; Van Rijn, R.; et al. Reversible formation of a PdCx phase in Pd nanoparticles upon CO and O2 exposure. Phys. Chem. Chem. Phys. 2012, 14, 4796–4801. [Google Scholar] [CrossRef]
  50. Teschner, D.; Borsodi, J.; Wootsch, A.; Révay, Z.; Hävecker, M.; Knop-Gericke, A.; Jackson, S.D.; Schlögl, R. The roles of subsurface carbon and hydrogen in palladium-catalyzed alkyne hydrogenation. Science 2008, 320, 86–89. [Google Scholar] [CrossRef]
  51. Maciejewski, M.; Baiker, A. Incorporation of carbon into palladium during low-temperature disproportionation of carbon monoxide over palladium/zirconia prepared from glassy palladium-zirconium. J. Phys. Chem. 1994, 98, 285–290. [Google Scholar] [CrossRef]
  52. Muraza, O.; Galadima, A. A review on coke management during dry reforming of methane. Int. J. Energy Res. 2015, 39, 1196–1216. [Google Scholar] [CrossRef]
  53. Rameshan, R.; Vonk, V.; Franz, D.; Drnec, J.; Penner, S.; Garhofer, A.; Mittendorfer, F.; Stierle, A.; Klötzer, B. Role of precursor carbides for graphene growth on Ni(111). Sci. Rep. 2018, 8, 2662. [Google Scholar] [CrossRef] [PubMed] [Green Version]
  54. Budiman, A.W.; Song, S.-H.; Chang, T.S.; Shin, C.-H.; Choi, M. Dry reforming of methane over cobalt catalysts: A literature review of catalyst development. Catal. Surv. Asia 2012, 16, 183–197. [Google Scholar] [CrossRef]
  55. Gadalla, A.M.; Bower, B. The role of catalyst support on the activity of nickel for reforming methane with CO2. Chem. Eng. Sci. 1988, 43, 3049–3062. [Google Scholar] [CrossRef]
  56. Dropsch, H.; Baerns, M. CO adsorption on supported Pd catalysts studied by adsorption microcalorimetry and temperature programmed desorption. Appl. Catal. A Gen. 1997, 158, 163–183. [Google Scholar] [CrossRef]
  57. Mayr, L.; Rameshan, R.; Klötzer, B.; Penner, S.; Rameshan, C. Combined UHV/high-pressure catalysis setup for depth-resolved near-surface spectroscopic characterization and catalytic testing of model catalysts. Rev. Sci. Instrum. 2014, 85, 055104. [Google Scholar] [CrossRef]
  58. Doran, A.; Schlicker, L.; Beavers, C.M.; Bhat, S.; Bekheet, M.F.; Gurlo, A. Compact low power infrared tube furnace for in situ X-ray powder diffraction. Rev. Sci. Instrum. 2017, 88, 013903. [Google Scholar] [CrossRef] [Green Version]
  59. Schlicker, L.; Doran, A.; Schneppmüller, P.; Gili, A.; Czasny, M.; Penner, S.; Gurlo, A. Transmission in situ and operando high temperature X-ray powder diffraction in variable gaseous environments. Rev. Sci. Instrum. 2018, 89, 033904. [Google Scholar] [CrossRef] [Green Version]
  60. Hammersley, A.P.; Svensson, S.O.; Hanfland, M.; Fitch, A.N.; Häusermann, D. Two-dimensional detector software: From real detector to idealised image or two-theta scan. High Press. Res. 1996, 14, 235–248. [Google Scholar] [CrossRef]
  61. Bluhm, H.; Hävecker, M.; Knop-Gericke, A.; Kiskinova, M.; Schlogl, R.; Salmeron, M. In situ X-ray photoelectron spectroscopy studies of gas-solid interfaces at near-ambient conditions. MRS Bull. 2007, 32, 1022–1030. [Google Scholar] [CrossRef] [Green Version]
  62. CasaXPS Version 2.3.16 Pre-rel 1.4, Casa Software Ltd.: Teignmouth, UK, 2011.
  63. Scofield, J. Theoretical Photoionization Cross Sections from 1 to 1500 keV; Office of Scientific and Technical Information (OSTI), U.S. Department of Energy: Oak Ridge, TN, USA, 1973.
  64. Rodriguez, N.; Anderson, P.; Wootsch, A.; Wild, U.; Schlögl, R.; Paál, Z. XPS, EM, and catalytic studies of the accumulation of carbon on Pt black. J. Catal. 2001, 197, 365–377. [Google Scholar] [CrossRef]
  65. Ahn, B.S.; Jeon, S.G.; Lee, H.; Park, K.Y.; Shul, Y.-G. Hydrogenolysis of CFC-12 (CF2Cl2) over Pd/γ-Al2O3 pretreated with HCFC-22 (CHF2Cl). Appl. Catal. A Gen. 2000, 193, 87–93. [Google Scholar] [CrossRef]
  66. Gabasch, H.; Unterberger, W.; Hayek, K.; Klötzer, B.; Kleimenov, E.; Teschner, D.; Zafeiratos, S.; Hävecker, M.; Knop-Gericke, A.; Schlögl, R.; et al. In situ XPS study of Pd(111) oxidation at elevated pressure, Part 2: Palladium oxidation in the 10−1 mbar range. Surf. Sci. 2006, 600, 2980–2989. [Google Scholar] [CrossRef] [Green Version]
  67. Powell, C.J.; Jablonski, A. NIST Electron Effective-Attenuation-Length Database SRD 82; Institute of Standards and Technology: Gaithersburg, MD, USA, 2011.
  68. Yeh, J.J. Atomic Calculation of Photoionization Cross-Sections and Asymmetry Parameters; Gordon and Breach Science Publishers: Langhorne, PE, USA, 1993. [Google Scholar]
  69. Damyanova, S.; Pawelec, B.; Arishtirova, K.; Martinez-Huerta, M.; Fierro, J. The effect of CeO2 on the surface and catalytic properties of Pt/CeO2–ZrO2 catalysts for methane dry reforming. Appl. Catal. B Environ. 2009, 89, 149–159. [Google Scholar] [CrossRef]
  70. Makri, M.; Vasiliades, M.A.; Petallidou, K.; Efstathiou, A.M. Effect of support composition on the origin and reactivity of carbon formed during dry reforming of methane over 5wt% Ni/Ce1−xMxO2−δ (M=Zr4+, Pr3+) catalysts. Catal. Today 2016, 259, 150–164. [Google Scholar] [CrossRef]
  71. Fan, M.-S.; Abdullah, A.Z.; Bhatia, S. Catalytic technology for carbon dioxide reforming of methane to synthesis gas. ChemCatChem 2009, 1, 192–208. [Google Scholar] [CrossRef]
  72. Simonov, M.N.; Rogov, V.A.; Smirnova, M.; Sadykov, V.A. Pulse microcalorimetry study of methane dry reforming reaction on Ni/Ceria-Zirconia catalyst. Catalysts 2017, 7, 268. [Google Scholar] [CrossRef] [Green Version]
  73. Grünbacher, M.; Götsch, T.; Opitz, A.K.; Klötzer, B.; Penner, S. CO2 reduction on the pre-reduced mixed ionic-electronic conducting Perovskites La0.6Sr0.4FeO3-δ and SrTi0.7Fe0.3O3-δ. ChemPhysChem 2017, 19, 93–107. [Google Scholar] [CrossRef]
  74. Opitz, A.K.; Nenning, A.; Rameshan, C.; Kubicek, M.; Götsch, T.; Blume, R.; Hävecker, M.; Knop-Gericke, A.; Rupprechter, G.; Klötzer, B.; et al. Surface chemistry of Perovskite-type electrodes during high temperature CO2 electrolysis investigated by operando photoelectron spectroscopy. ACS Appl. Mater. Interfaces 2017, 9, 35847–35860. [Google Scholar] [CrossRef]
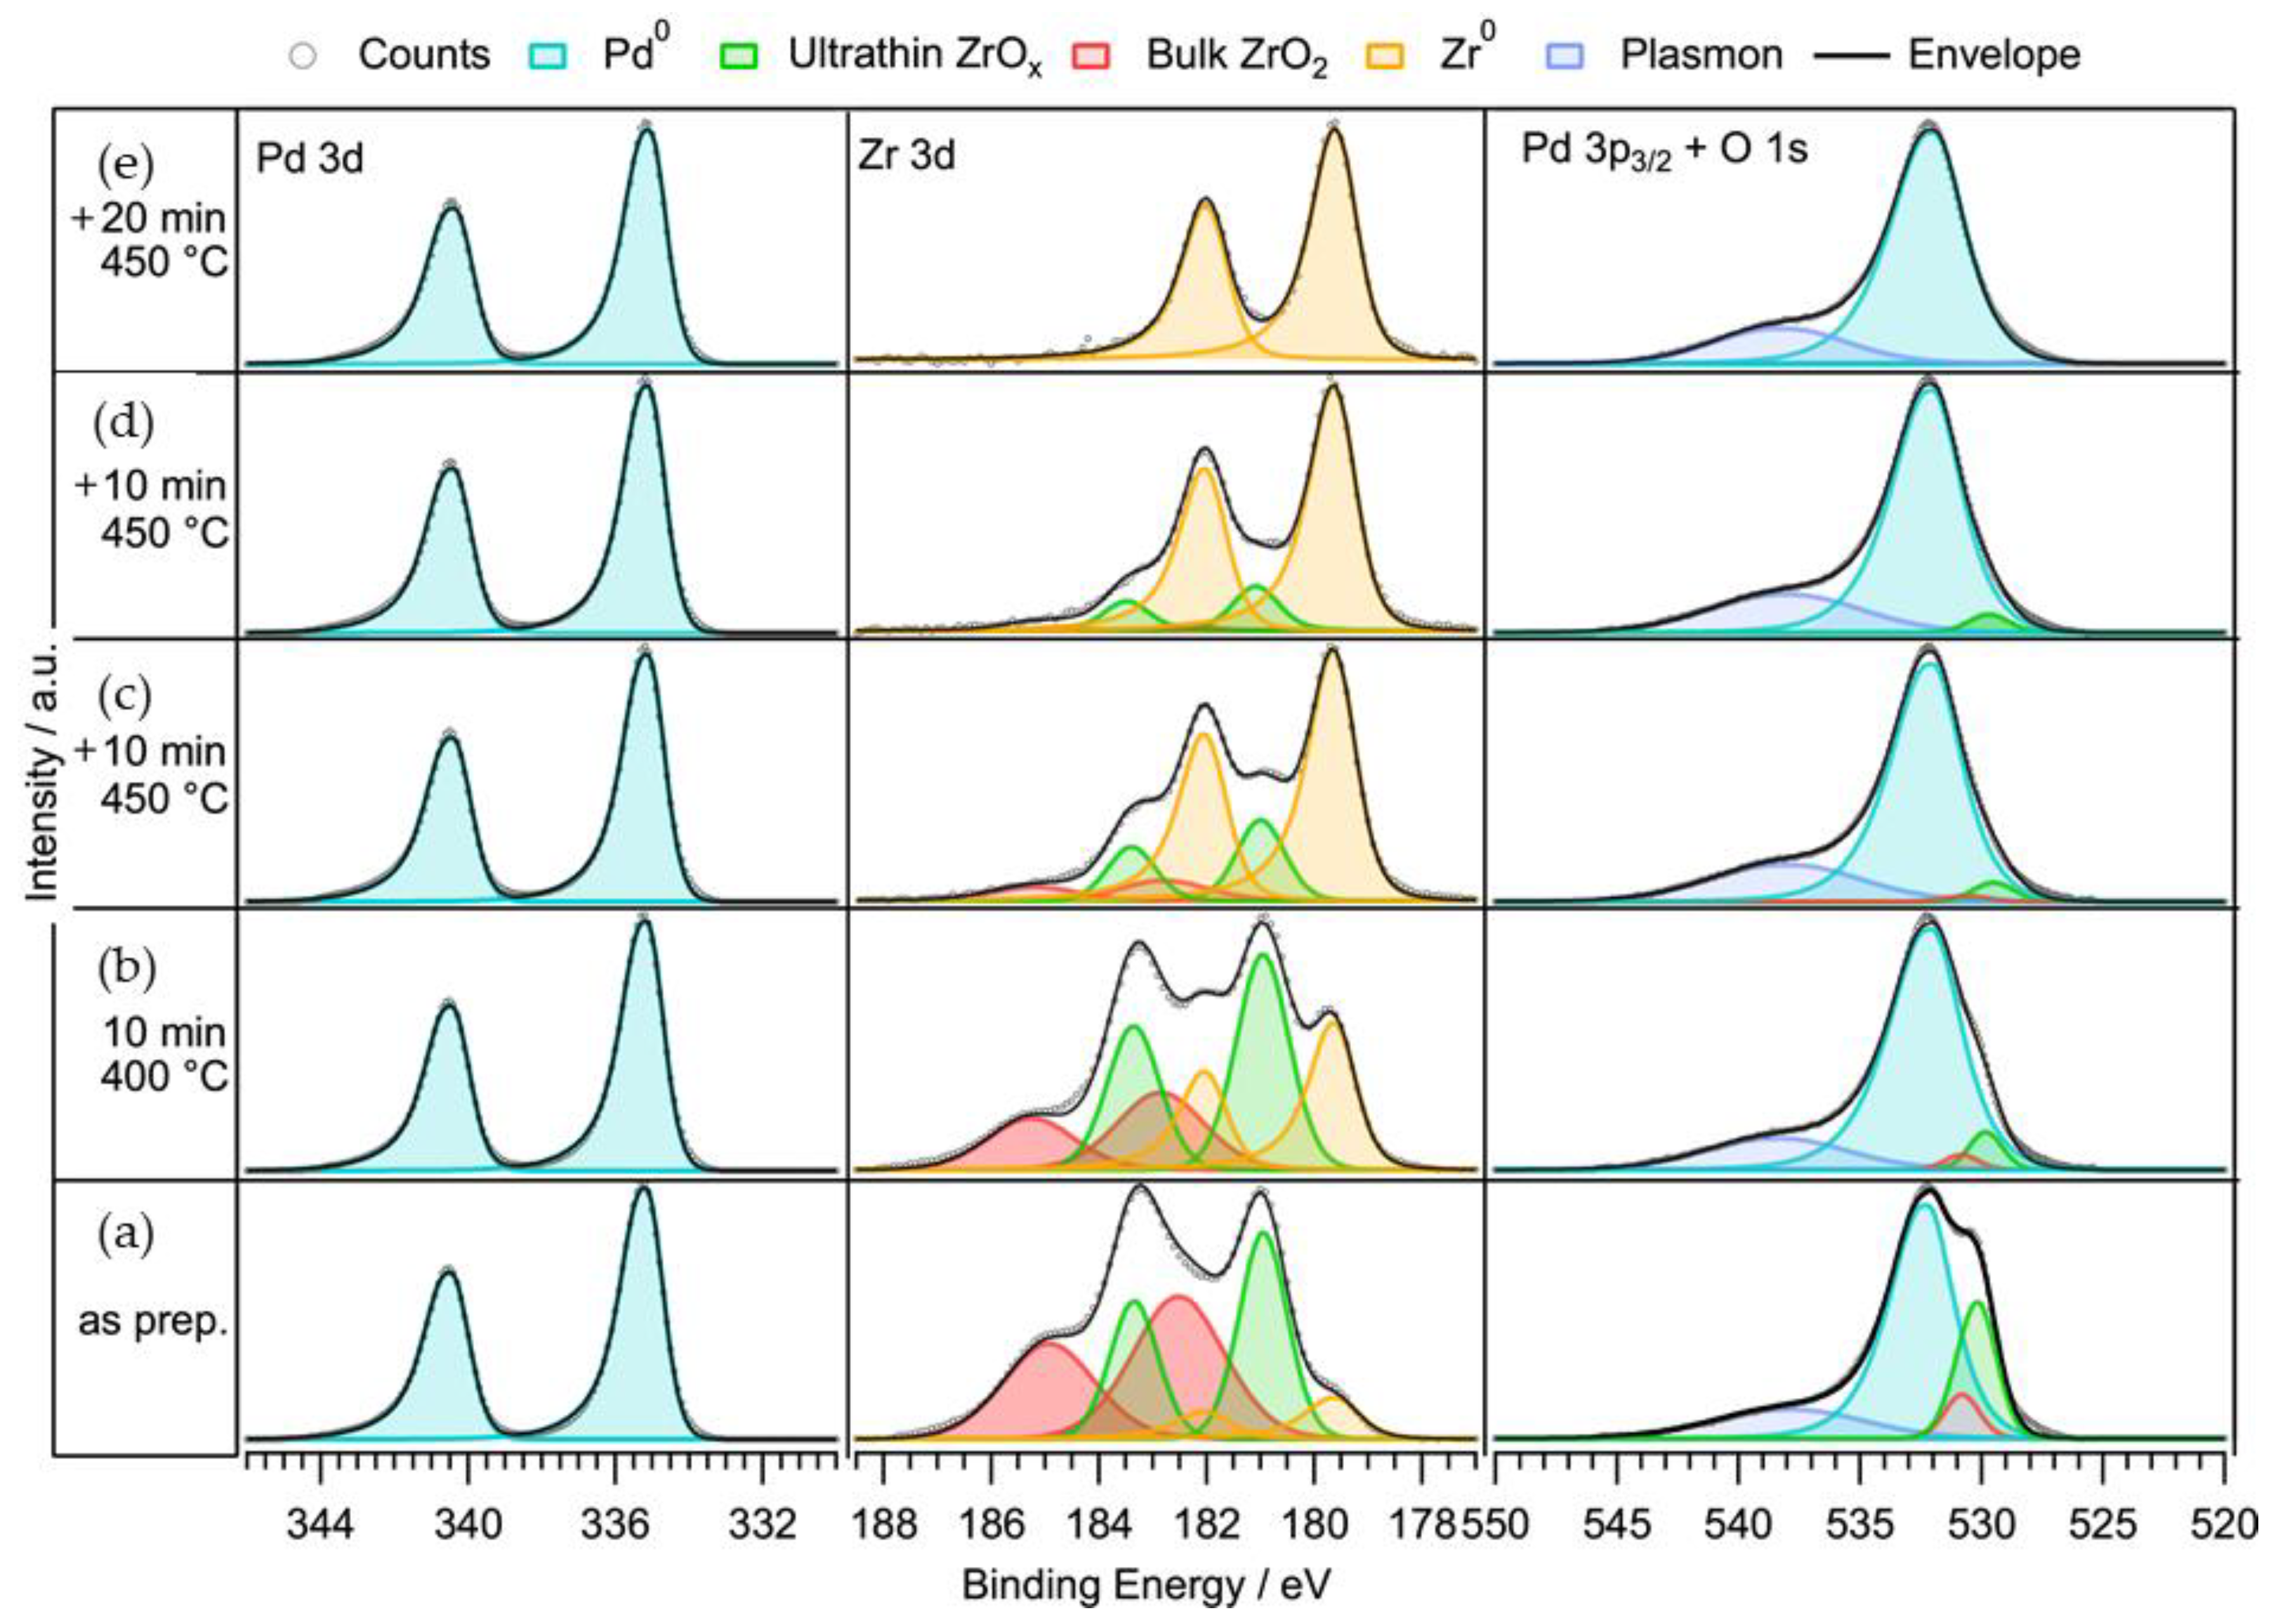
Figure 1. Pd 3d, Zr 3d and (Pd 3p3/2 + O 1s) X-ray photoelectron spectroscopy (XPS) regions during annealing of a CVD-prepared Zr/ZrOx layer on a Pd(111) single crystal at 400–450 °C under UHV conditions for the given periods of time: see panels (ae). The as-prepared state was obtained by preceding exposition to 10−3 mbar s ZTB within 200 s at 400 °C.
Catalysts 10 01000 g001
Figure 2. Room-temperature XPS and X-ray diffraction (XRD) characterization of the PdxZry bulk-intermetallic precatalyst prior to heating in the respective CH4:CO2 reaction mixture. Panel (a) displays the Pd 3d5/2, Zr 3d, C 1s and O 1s core level regions. The photoelectron kinetic energy was adjusted to 400 eV for all regions by choosing the respective photon energy. Panel (b) displays the XRD pattern of the PdxZry bulk-intermetallic precatalyst, along with the peak positions for clean Pd and the intermetallic compounds Pd2Zr and Pd3Zr.
Catalysts 10 01000 g002
Figure 3. X-ray diffraction patterns (Mo Kα1 radiation, 0.7093 Å) of the impregnated Pd–ZrO2 powder catalyst. The black (lower) pattern shows the fully oxidized PdO–ZrO2 state after 5 h of calcination in air at 800 °C. The gray (upper) curve displays the catalyst after H2 prereduction and five cycles of methane dry reforming.
Catalysts 10 01000 g003
Figure 4. In panel (a), an annular dark field image of the calcined powder catalyst, an EDX map and corresponding secondary electron image, as well as a high-resolution image with lattice fringes of PdO are shown. Panel (b) shows an overview image recorded before and after in-situ reduction in a DensSolutions gas-flow reactor (conditions: 400 mbar H2, 600 °C, 1 h). Panel (c) shows a high-resolution example of a selected smaller Pd particle on ZrO2.
Catalysts 10 01000 g004
Figure 5. Temperature-programmed DRM reaction rate profiles obtained on (a) the CVD-prepared subsurface Zr0–Pd foil precatalyst versus a single-phase ZrO2 film; (b) on the PdxZry bulk-intermetallic precatalyst; (c) on 73 mg of the supported Pd–ZrO2 powder reference catalyst, corresponding to ~140 cm2 Pd surface area or ~2.3 × 10¹⁷ surface Pd atoms. Reaction conditions for (a) and (b): 50 mbar CH4, 50 mbar CO2, 977 mbar He; linear temperature ramp (25 °C/min) up to 800 °C, followed by isothermal reaction for 30 min. Reaction conditions for (c): 15 mbar CH4, 15 mbar CO2, 950 mbar He; linear temperature ramp (10 °C/min) up to 800 °C, followed by isothermal reaction for 30 min. Prior to DRM, the supported catalyst was cleaned by a cycle of oxidation with O2 at 400 °C and reduced to the Pd0 state in 1 bar H2 at 600 °C for one hour. From the molar product formation vs. time data, the molar rates were obtained by differentiation and normalized to the geometrically estimated total amount of surface Pd atoms of the respective catalyst to obtain the turnover frequency (TOF) values. Numerical details of the TOF calculations are provided in the experimental Section 3.1. For the phase-pure ZrO2 sample (oxidized ZrO2 metal foil of same geometrical size, 7.2 cm2) this normalization is purely artificial.
Catalysts 10 01000 g005
Figure 6. Zr 3d NAP-XP spectra recorded in situ under close-to-real dry reforming reaction of methane (DRM) conditions (p(CH4): p(CO2) = 0.15 mbar: 0.15 mbar) between room temperature and 500 °C. The excitation energy was chosen as hν = 580 eV to obtain a photoelectron kinetic energy of 400 eV common to all experiments. Left panel: CVD-prepared initial subsurface Zr0–Pd foil catalyst; right panel: initial PdxZry bulk-intermetallic precatalyst.
Catalysts 10 01000 g006
Figure 7. Synchrotron-based in-situ X-ray diffraction analysis of the bulk-intermetallic PdxZry catalyst during DRM between ≈20 °C and 800 °C. A gas flow of 2 mL/min of CH4/CO2 (ratio 1/1) at ambient pressure with a heating rate of 20 K/min was applied. The colored bars mark the positions of the respective reference reflections of the most prominent involved (inter)metallic and oxidic phases and are derived from International Centre for Diffraction Data (ICDD) database and labeled with their corresponding #ICDD numbers. The diffraction angles of the reference phases are based on room-temperature data, for example, for metallic Pd 2ϴ = 12.6°. The diffractogram at 800 °C shows this reflection at ~12.5°, which is in line with the expected thermal lattice expansion. The same holds for the t-ZrO2 reflections. Thus, these reflections can be clearly assigned to the room-temperature reflections of the referenced phases.
Catalysts 10 01000 g007
Figure 8. C 1s, Zr 3d and Pd 3d5/2 AP-XPS data recorded in situ at 700 °C on the CVD-prepared initially subsurface Zr0–Pd foil catalyst (excitation energies were chosen for 400 eV photoelectron kinetic energy). Left spectra: 0.3 mbar pure CH4; middle spectra: 0.3 mbar pure CO2; right spectra: 0.15 mbar CH4 + 0.15 mbar CO2. Right side: bar graphs of integrated peak intensities.
Catalysts 10 01000 g008
Figure 9. C 1s, Zr 3d and Pd 3d5/2 AP-XP spectra recorded in situ at 700 °C on the initially bulk-intermetallic PdxZry precatalyst (excitation energies were chosen for 400 eV photoelectron kinetic energy). Left spectra: 0.3 mbar pure CH4; middle spectra: 0.3 mbar pure CO2; right spectra: 0.15 mbar CH4 + 0.15 mbar CO2. Right side: bar graphs of integrated intensities of the peak components.
Catalysts 10 01000 g009
Figure 10. Left side: in-situ depth profiling of the C 1s signal under isothermal DRM conditions at constant reactant pressures on the initially bulk-intermetallic PdxZry precatalyst by variation of the photon energy. T = 700 °C, p(CH4): p(CO2) = 0.15 mbar: 0.15 mbar. Right side: bar graphs of the integrated intensities of the peak components.
Catalysts 10 01000 g010
Figure 11. Time-resolved in-situ X-ray diffractograms (hν = 24 keV) of the Pd/PdO reflex region of the initially bulk-intermetallic PdxZry catalyst during reoxidation in 2 mL/min oxygen at 600 °C after DRM at 800 °C, taken in order to check the reversibility of the DRM-induced structural changes and of the carbon uptake.
Catalysts 10 01000 g011
Figure 12. Left side: response of the steady-state Cgraphite and Cbulk (PdxC) intensities to temperature changes between 600 and 740 °C on the initially bulk-intermetallic PdxZry catalyst. Constant DRM pressure conditions: 0.15 mbar CH4 + 0.15 mbar CO2. Excitation energy hν = 685 eV (photoelectron kinetic energy 400 eV). Right side: bar graph of Cgraphite and Cbulk intensity trends.
Catalysts 10 01000 g012
Figure 13. Schematic representations of the Zr0 subsurface alloy vs. PdxZry bulk intermetallic and vs. supported PdO/ZrO2 precatalysts and their structural and chemical transformations under realistic reductive/DRM conditions. The representation of the CVD-prepared “inverse” precatalyst (top panel) is based on a Pd(100) fcc lattice plane containing Zr0 atoms in the subsurface region. The simplified schematic alloy and ZrO2 lattices do not reflect the actual crystal lattice structures and stoichiometries.
Catalysts 10 01000 g013