Article

The Effect of Strontium Doping on LaFeO3 Thin Films Deposited by the PLD Method

Faculty of Metals Engineering and Industrial Computer Science, AGH University of Science and Technology, av. Mickiewicza 30, 30-059 Cracow, Poland
*
Author to whom correspondence should be addressed.
Catalysts 2020, 10(9), 954; https://doi.org/10.3390/catal10090954
Submission received: 29 July 2020 / Revised: 18 August 2020 / Accepted: 19 August 2020 / Published: 20 August 2020

Abstract

:
The aim of the presented investigations was to deposit the thin films La1−xSrxFeO3 (x = 0, 0.1, 0.2) on (100) Si substrate by using the Pulsed Laser Deposition (PLD) method. Structure was exanimated by using XRD, SEM, AFM, TEM and XPS methods. The catalytic properties were analyzed in 4 ppm acetone atmosphere. The doping of Sr thin films La1−xSrxFeO3 (x = 0, 0.1, 0.2) resulted in a decrease in the size of the crystallites, the volume of the elemental cell and change in the grain morphology. In the LaFeO3 and La0.9Sr0.1FeO3, clusters around which small grains grow are visible in the structure, while in the layer La0.8Sr0.2FeO3, the visible grains are elongated. The TEM analysis has shown that the obtained thin films had a thickness in the range 150–170 nm with triangular or flat column ends. The experiment performed in the presence of gases allowed us to conclude that the surfaces (101/020) in the triangle-shaped columns and the plane (121/200) faces in flat columns were exposed to gases. The best properties in the presence of CH3COCH3 gas were noted for LaFeO3 thin film with triangle columns ending with orientation (101/020).

1. Introduction

Perovskite oxides denoted as ABO3 are widely studied due to their double-type ionic and electronic conductivity. Perovskites are useful according to their functional properties, showing great potential in several applications such as gas sensors [1,2,3], automotive exhaust catalyst and methane reformers that produce syngas [4,5,6] or cathodes in solid oxide fuel cells (SOFCs) [7,8].
Properties of perovskite oxides result from a large number of cations which can be included in the structure such as A=La, Ca, Sr and B=Ti, Fe, Nb, Ta, Co and Mg, from possible cationic and/or anionic substitutions in this structure (vacancy) and finally from the creation of structural defects caused by cations or oxygen deficiency [9]. LaFeO3 is a compound which may be classified to the group of perovskites. LaFeO3 is a p-type semiconductor with orthorhombic structure type Pmna (No. 62) at room temperature. This perovskite is as famous antiferromagnetic materials with high Néel temperature TN = 740 °C. The electrical properties of LaFeO3 are derived from the ordering antiferroelectric and ferroelectric dipole moments [10]. LaFeO3 is widely used in the fields of electrical, magnetic sensors and gas sensors due to its chemical stability at elevated temperatures and mixed ion conductivity [10,11,12].
This perovskite can be considered as a potential material for the gas sensors application. Generally, materials used for gas sensors have to present high sensitivity, selectivity, stability, low humidity effect, low detection limit and fast response/recovery times. While using this material in thin film form as a gas sensor the surface of thin film plays crucial role. The morphology of the surface has an influence on the response time and sensitivity. The presence of small grains in the structure and preferred crystallographic orientation provide the higher reaction surface and the higher sensitivity of the gas sensor.
According to the investigations it may be affirmed that the perovskite LaFeO3 proves very good catalytic properties in the presence of gases such as acetone (CH3COCH3), ethanol (C2H5OH), hydrogen sulphide (H2S), hydrogen (H2), NO2 and liquefied petroleum gas (LPG) [11,13]. LaFeO3 thin films with unique morphology (nanocube) were studied by Thirumalairajan [9]. High sensitivity, good selectivity, fast response–recovery time and excellent repeatability for 1 ppm level of NO2 gas at room temperature were proved. The nanocube was (121) oriented with average sizes of ~70 nm. The excellent gas sensor properties are the effect of porous structure, surface morphology, numerous surface-active sites and oxygen vacancies.
The higher sensitivity to 80 ppm acetone gas of LaFeO3 films was studied by Liu at a temperature of 400 °C and presented in the relevant paper [2]. The thin films had 37 nm grain size and complete crystalline structure patterns were identified in the films heat treated at 650 °C.
The powder for gas sensors’ application was produced by Sharma et al. [14]. A hydrothermal method to produce the mentioned powders was performed where precursors citric acid and KOH interchangeably were applied. A relatively higher surface area (50.54 m2/g) was observed for LaFeO3 obtained by using KOH than for LaFeO3 obtained by using citric acid. Sharman et al. suggested that the discussed materials are suitable for the detection of oxidizing gases.
Murade et al. [10] have studied nanoparticles LaFeO3 and La0.7Sr0.3FeO3 and in the paper it was demonstrated that nanoparticles with the average crystallite size of 22 and 10 nm respectively, have good sensing performances towards acetone gas with rapid response and high sensitivity at T = 275 °C.
The gas sensor properties can be optimized by substitution of the perovskite elements by elements in the second state of oxidation. For instance, LaFeO3 perovskites can be doped by elements such as Ca, Co, Sr, Ag, Pb and Pd. G. Pecchini et al. (ref. [15]) have studied the La1−xCaxFeO3 (x = 0, 0.1, 0.2, 0.3, 0.4) doped by calcium ion. The highest catalytic activity for the methane combustion was found for La0.6Ca0.4FeO3. This effect is the consequence driven by a fraction of the iron ions in unusual oxidation states (4+) which are formed by the partial substitution of La by Ca.
LaFeO3 doped by Pd was investigated by Wang at al. [16]. In nanocrystalline powders PdO around the grain LaFeO3 were identified. The change of the sensitivity and selectivity for Pd-LaFeO3 was explained and mainly associated with the “spill-over” effect of oxygen species and reduction process of PdO to Pd.
LaFeO3, pure or doped, can be produced in such a form as nanoparticles or thin films. The parameters among grain size and topography of the surface, the chemical composition and the phases composition depend mostly on the preparation method. Thin films LaFeO3 can be deposited by different methods such as: Pulsed Electron Deposition (PED) [17], Pulsed Laser Deposition (PLD) [2] and magnetron sputtering (MS) [13]. The aim of this study was to deposit the nanocrystalline thin films using the PLD method and analyze the influence of the thin films morphology on catalytic properties in the acetone atmosphere.

2. Results and Discussion

2.1. Structure of the Targets

One of the characteristic parameters of the PLD method is stoichiometry transfer from target to the substrate and the compositions of targets are crucial. Before each ablation process, the targets were polished with 1200 graininess paper, and before the ablation process, pre-ablation (1000 shots) were used. Polishing and pre-ablation allowed for obtaining clean targets with the same roughness for all processes. All targets used in the PLD process show an expected phase composition before and after the PLD process. There were no additional phases identified after ablation process (Figure 1). All peaks in targets follow the patterns LaFeO3 (01-088-0641), La0.9Sr0.1FeO3 (04-007-6515), La0.8Sr0.2FeO3 (04-007-6516). The peaks in doped targets are shifted to the right in relation to the peaks in the LaFeO3 target. This is due to the substitution of La by Sr and the changing of cell parameters. The same effect was observed by M. Kumar et al. [18] in perovskite LaFeO3 and La0.9Sr0.1FeO3. The peaks (101), (121), (220), (202), (141), (042, (242) and (204) in targets are in the same position 2Θ as presented by M. Kumar et al. [18].

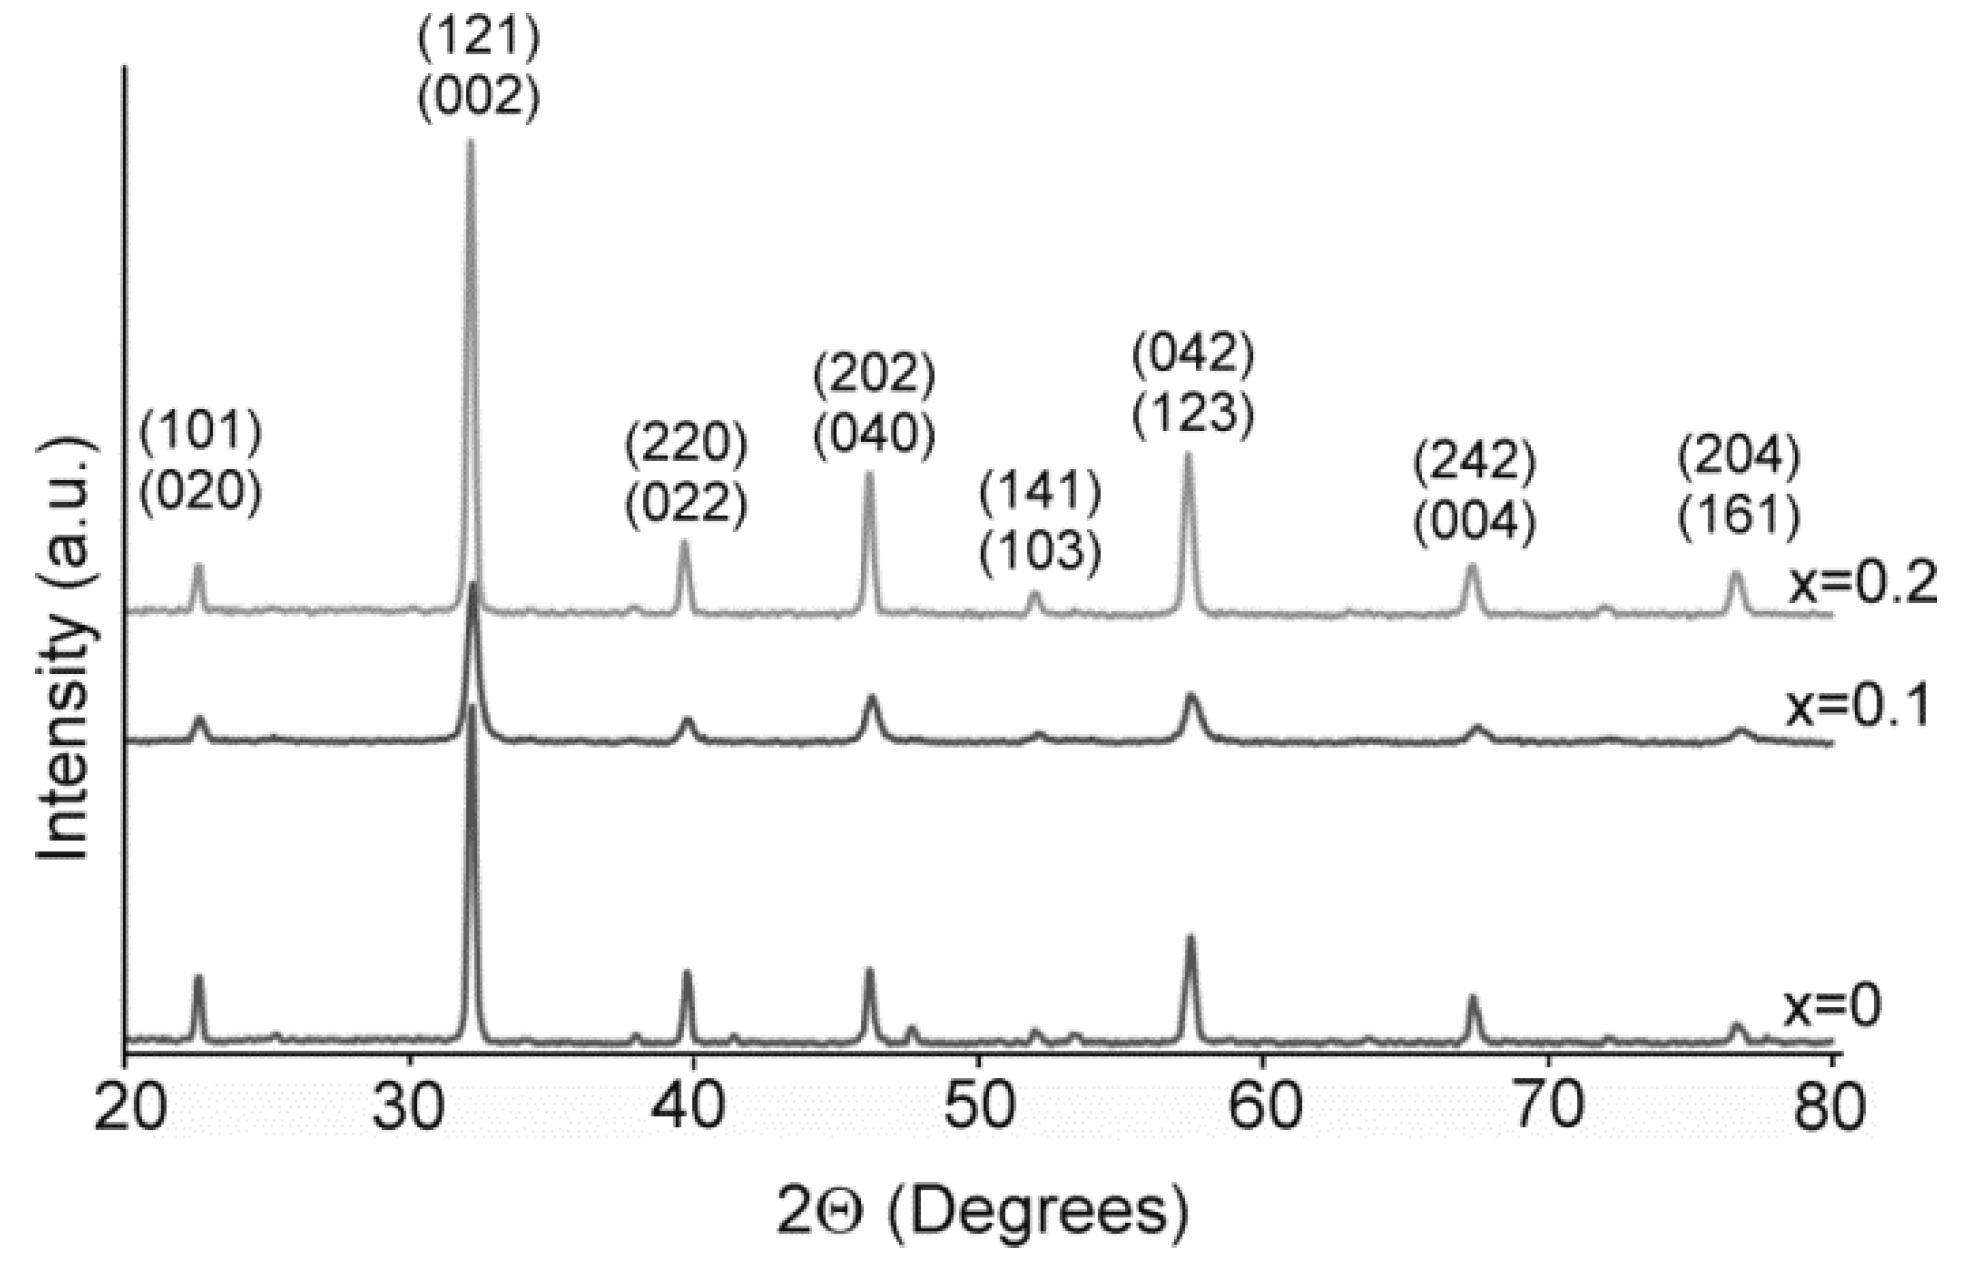
2.2. Structure and Morphology Characterization of Thin Films

The XRD analysis was carried out in Grazing geometry at a constant angle of incidence α = 1° (Figure 2). The depth of penetration was z = 54 nm. The identification of phases was based on the JCPDS base card numbers 01-088-0641 for LaFeO3, 04-007-6515 for La0.9Sr0.1FeO3 and 04-007-6516 for La0.8Sr0.2FeO3. The analysis of the diffraction patterns did not reveal the presence of other phases such as La2O3, Fe3O4 and SrCoO3 (Figure 2). Peak positions are consistent with the literature data [18].
As for XRD analysis in targets the peaks in doped thin films are shifted to the right in relation to the peaks in LaFeO3 target. This is due to the substitution of La by Sr and the changing of cell parameters.
To characterize the effect of doping on the crystallographic structure of the La1−xSrxFeO3 thin films, the crystallographic parameters were determined using the CelRef software (Table 1).
It was observed that with the increase in the content of strontium, the volumes of the elementary cell have decreased. The observed changes in the crystallographic parameters and elementary cell size together with the increase in doping are not caused by La3+ doping with Sr2+ strontium due to the similar size of La3+ (0.13 nm) and Sr2+ ionic (0.14 nm) rays. Strontium doping leads to the formation of iron in the oxidation state from Fe3+ to Fe4+ in the doped thin films which in turn is a consequence of necessity to preserve the electroneutrality. As a result of the formation Fe4+ the oxygen vacancies are generated. The differences in the ionic radius of iron in different oxidation states explain the decrease in the cell volume, Fe4+ (0.585 Å) and Fe3+ (0.645 Å). Similar effects were noted in the system LaFeO3 doped by Ca and Ti ions, and the unit cell volumes were decreased compared to LaFeO3 [15,19].
Doping has caused a decrease in the size of crystallites from 36 nm for LaFeO3 to 18 nm for the La0.8Sr0.2FeO3 thin films (Table 1). In nanocrystalline materials such as thin films, interaction between defects (dopants) and grain boundary (GB) plays a key role in determining the structure stability. The interaction between the dopants and surface/grain boundaries may decrease surface energy/grain boundary energy. This leads to the stabilization of the surfaces/grain boundaries [20]. In this case, under the same preparation conditions are more surfaces/grain boundaries are observed. It can, therefore, be concluded that the grain size can decrease with the dopants.
The Rt parameter was determined as the ratio of the intensity of the peak I121/200 to I101/020 (Table 1) after the subtracting the background. The calculations have shown that Rt increases with increasing of Sr content, which indicates the decrease of the I101/020 peak intensity and the increase of the I121/200 peak intensity. The change in intensity of these two peaks suggested preferred orientation.
SEM studies have shown few droplets on the surface of all thin layers (Figure 3). The cracks visible on Figure 3c may be caused by too high a cooling rate after the PLD process. Cracks are also one of the characteristics of the PLD method. In the deposited thin films tensile stress may appear to GPa [21]. They relaxation during the cooling process can produce the cracks in thin films.
The structure of the thin films changes as a result of doping. In the undoped thin films clusters in the range 200–250 nm, around which very fine grains grow (Figure 3a), were observed. A similar structure was observed in the La0.9Sr0.1FeO3 thin film, when the clusters are much smaller in size (Figure 3c). No cluster presences were observed in the thin film La0.8Sr0.2FeO3 and the structure consists of the elongated grains (Figure 3e). The structure of flat grains in the vicinity of elongated grains was observed in LaFeO3 samples produced by magnetron sputtering with different deposition temperature [9]. Similar differences in the structure were observed in strontium doped LaCoO3 layers [22]. Changes in the structure may be influenced by the temperature of the substrate, the gas pressure in the chamber or doping. The variations in growth kinetics due to the doping process may induce the changes in the structure.
The topography studies of all thin films (Figure 3b,d,f) performed with AFM (tapping mode in air) are in a good agreement with the results obtained at larger scale from SEM analysis (Figure 3).
As can be seen the surface of the thin films were built from very fine irregularities (bulges) that constitute the proper thin film. The Ra parameter determined from the tests increases with increasing content of the dopants in the thin films (Table 1).
The results of AFM confirm the crystalline refinement observed in XRD studies.
XPS analyses coupled with the Ar+ ion sputterings were used to investigate the oxidation state of elements on the surface and inside the La1−xSrxFeO3 thin films at different depths, as well as at the thin film/substrate. Visible in the Figure 4, Figure 5, Figure 6 and Figure 7, the cycles correspond to: cycle 1—surface of the thin films; cycle 2–19—thin films; cycle 22–25—surface of the substrate.
On the surface of all thin films the presence of an adventitious carbon was detected. For all thin films after the first sputtering process the spectral line of carbon has disappeared completely (Figure 4). The analysis revealed the C 1s line on the surface (cycle 1) and its absence at the deeper layers across the thin film till the substrate (cycles 2–19) (Figure 4). The presence of the carbon on the surface thin films is a consequence of the contaminant’s adsorption from the environment. Chemical states of the thin film and substrate elements were investigated by registering the following spectral lines: O1s, Fe 2p, La 3d, Sr 3d and Si 2s.
Figure 4 shows the O 1s line registered on the surface (cycle 1) which was fitted by two lines at 529.22 and 531.93 eV. The peak at BE = 531.93 eV presence is a consequence of the impurities from the surface and is responsible for bonds in C=O organic compounds. The second at BE = 529.22 eV is interpreted as a component of non-metallic oxides. The main pic at BE = 529.8 eV (cycle 4–19) is typical for the binding energy of oxygen with rare earth metals like La [23].
The Si 2s spectrum is shown in Figure 4. The peak at BE = 148.9 eV is visible in cycle 22–25. The energy at which the peak occurs is typical for SiO2 and comes from the phase formed of the Si substrate with oxygen.
Fe 2p lines have a main peak and a satellite (Figure 5). These satellites are separated from the main peak by 4 eV. The main peak Fe 2p3/2 is at BE = 706.3 eV and Fe 2p1/2 at BE = 720.12 eV. The determined values are much below those observed in Fe-O oxides. If the iron is present in the third oxidation stage, the peak for Fe 2p3/2 is in the range of BE = 706–711.2 eV. The peak at such a low energy was observed in perovskites in the LaFeO3 produced by the sol-gel method. The presence of the satellite at Fe 2p1/2 is due to the presence of iron on the fourth oxidation state [24]. The intensity of the satellites Fe2p3/2 and Fe2p1/2 have increased with the increasing of the dopant, which indicates a higher Fe4+ content.
The shapes and positions of the La 3d and Sr 3d (Figure 6 and Figure 7) spectra did not change across the thin film and remained the same at the thin film/substrate interface. This meant that the chemical state of the lanthanum and strontium did not change even at the interface.
The La3d5/2 spectrum consists of the main line at BE = 833.2 eV and the satellite line at 838.5 eV on the binding energy scale. The line position for Sr 3d5/2 is at 133.4 eV. These values are typical for rare earth e bonding energies in oxygen such as LaFeO3 and for oxides like Sr-O.
The deposited thin films have a columnar structure with a thickness in the range 150–170 nm (Figure 8, Figure 9 and Figure 10).
The widths of the columns are in the range: 20–40 nm for LaFeO3; 15–25 nm for La0.9Sr0.1FeO3; and 20–45 nm for La0.8Sr0.2FeO3. Observations on the cross-section of the thin films have shown that the most developed surface occurs in the LaFeO3 thin film. The columns in this film have a triangle-like ending (Figure 11).
In the other thin films, the columns are flat (Figure 9 and Figure 10). The different shape of the columns indicates a different crystallographic orientation of the columns exposed to gases. In the research presented by M. Jędrusik et al. [25], it has been demonstrated that the surfaces exposed to gases in LaFeO3 columnar with triangle shape are (101/020) (Figure 7), and for flat-ended columns it is the plane (121/200). Taking this into account, the results of XRD presented in this paper, as well as the results of M. Jędrusik at al. [21], it can be concluded that the columns in thin films have growth in the direction (121/200).
Electron diffraction solutions for all thin films have shown that these are phases LaFeO3, La0.9Sr0.1FeO3 and La0.8Sr0.2FeO3, respectively (Figure 8, Figure 9 and Figure 10).

2.3. Gas-Sensing Properties

LaFeO3 thin films are typical p-type semiconductors. The gas sensing mechanism is for those materials based on changes of the resistance while contact with gases. During the exposed La1−xSrxFeO3 sensors to the air, the oxygen is chemically adsorbed on the surface. It can be presented by the following reaction equations [26,27,28]:
O 2 ( gas ) O 2 ( ads )
O 2 ( ads ) + e O 2 ( ads )
O 2 ( ads ) + 2 e 2 O ( ads )
It leads to the formation of a thin space-charge layer which decreases the potential barrier. The resistance of the thin films is low. When the thin films are exposed to the acetone the reactions take place on the surface as follows:
CH 3 COCH 3 + 8 O ( ad ) 2 3 CO 2 + 3 H 2 O + 8 e
This process results in the thickening of the space-charge layer, thus increasing the potential barrier and decreasing the current.
The electrons trapped by the adsorbed oxygen are released and the numbers of electrons are annihilated by the holes (h*):
h* + e’ = null
When La3+ ions are replaced by Sr2+ ions, holes are produced due to the ionization of [SrxLa]:
Sr La x Sr La + h *
this increases the conductivity of La1−xSrxFeO3 thin films.
All processes that occur in Sr2+ doped La1−xSrxFeO3 can be described as follows:
(a)
electroneutrality formed Fe4+,
(La1−x3+Srx2+)(Fe1−x3+Fex4+)O3
(b)
oxygen vacancies compensation, ▯—oxygen vacancies,
(La1−x3+Srx2+)Fe(O3−x/2x/2)
(c)
compound compensation (both electroneutrality and oxygen vacancies compensation) which occur in substituted perovskites oxides,
(La1−x3+Srx2+)(Fe1−y3+Fey4+) (O3− (x−y)/2(x−y)/2) [29].
Considering the above we expected the increasing of the sensitivity with the dopants.
For the thin films, La1−xSrxFeO3 resistance tests were carried out in an acetone atmosphere (4 ppm concentration) at different operating temperatures T = 303, 370, 437 °C. The measurements were carried out by using a specially constructed apparatus for measuring the gas sensor response [30]. All the process was controlled by the dedicated application LabView.
Before measurements, all samples were heated at the initial temperature of T = 230 °C for several hours. During this time, the samples were stabilized. Under stabilized gas chamber conditions (humidity 50%, gas flow, constant working temperature) and when the sensor resistance displayed no drifts, the resistances were measured in air and acetone gas (Figure 12).
For each of the temperatures, the air and the test gas were alternately exchanged in such a way as to maintain a constant gas flow.
Figure 12 shows the changes in the resistance of the thin films LaFeO3 and La0.9Sr0.1FeO3 for several operating temperatures in alternating air atmospheres and 4 ppm acetone, with constant gas flow.
Reduction of thin film resistance while increasing the temperature was observed. This phenomenon is characteristic for semiconductor materials. The response value (S) of the sensor was defined as S = Rg/Ra, where Ra and Rg represent the sensor’s resistance in the air–Ra and the presence of the gases Rg.
The response time (tres) was the time taken from Ra to Ra + 90% ΔR (ΔR = Rg − Ra) under the gas environment and the recovery time (trec) was the time taken from Rg to Rg—90% * ΔR in the air condition [28].
The response value (S) of the sensor depends on the operating temperature and is higher in lower temperature. For these thin films the sensitivity was determined in the temperature T = 303 °C for S LaFeO 3 = 3.75 and for S La 0.9 Sr 0.1 FeO 3 = 1.77.
Due to the faster reaction rate at higher temperature, the response times and regeneration time are shortened with increasing temperature. The measured response time to gas at T = 303 °C for LaFeO3 was tres = 54 s, regeneration time trec = 66 s and for La0.9Sr0.1FeO3 tres = 180 s and trec = 258 s. Enhanced response time and decreased sensitivity while doping were proved in the research.
A similar effect was observed in the LaFeO3 powders doped with Ag. The contents of 10% and 20% Ag have shown a decrease in sensitivity and the increase only in samples doped by 30% Ag [27].
The presented results are closely related to the structure of thin films. Different crystallographic orientations have different atom arrangements, different electronic properties, such as surface state density, adsorption/desorption energy of interaction with gases and concentration of Oads on the surface.
The research presented by X. Wang et al. [31] allows us to conclude that in LaFeO3 layers, type surfaces (010) are preferred (more adsorbed oxygen) in adsorption and oxygen desorption processes which determine catalytic properties. In the presented investigations LaFeO3 thin films dominated a columnar with a triangle shape. The triangular ends of the columns have crystallographic orientation (020) and (101) (Figure 8).
This morphology ensured greater adsorption and desorption of the oxygen. The reaction times and sensitivity of these thin films are higher than in the case of La0.9Sr0.1FeO3 which has a flat end of a columnar with orientation (121) and (200). In this case the adsorbed oxygen species reacting with gas molecules is slower than on (020) crystallographic orientation.
With this in mind, crystallographic orientation plays a significant role in reactions with gas. Therefore, despite the use of doping, which caused an increase in the number of vacancies, the sensitivity of thin layers was not increased.

3. Materials and Methods

3.1. Deposition of the Thin Films

The thin films La1−xSrxFeO3 (x = 0, 0.1, 0.2) were deposited on the substrate (100) oriented Si. The targets with different amounts of strontium were obtained from the Kurt Lesker Company (Hastings, East Sussex, UK). Each target had a dimension d = 1 cal. For deposition of the thin films a laser ablation system Nd-YAG laser Continuum Powerlite DLS (λ = 266 nm), with chamber Neocera was used (Neocera 10000 Virginia Manor Road Ste 300, Beltsville, Maryland, MD, USA). The characteristics of the deposition system were as indicated: a target–substrate distance of 70 mm, the air pressure in the deposition camera was p = 5 Pa. The laser beam hits the target at an incidence angle ξ = 45°. Substrates and targets were parallel. The deposition conditions were a frequency of f = 10 Hz, energy density on the target ε = 3 J/cm2, substrate heated at 570 °C and deposition time t = 1.5 h.

3.2. Characterization of the Thin Films and Targets

The phase analysis of the target and thin films were performed by the X-ray diffraction phase analysis method (XRD) using PANanalytical EMPYREAN DY 1061 (Malvern Panalytical Ltd., Malvern, UK) with Cu Kα (λCu = 0.154 nm) radiation in Braga-Brentano and Grazing geometry. The identification of the determined phases was based on the database PDF-4+ product of the ICDD used. For the calculation of the cell parameters software CellRef were applied while crystalline size was calculated using Williamson-Hall (W-H) analysis. The surface morphology and the chemical composition of the target and thin films were observed using a Scanning Electron Microscope (FEI Nova NanoSEM 450, Hillsboro, Oregon, OR, USA) equipped with an Energy Dispersive Spectroscopy Detector (EDAX). The topography of the surface was investigated by using AFM microscopy Veeco Dimension® Icon™ SPM with NanoScope V (Veeco, Munich, Germany). Transmission electron microscopy (TEM) analyses were carried out by using JEOL JEM-2010 ARP (Jeol company Pleasanton, CA 94588, USA). The TEM investigations were performed on a cross-section of the lamellas obtained from the desired area of the analyses samples by the Focused Ion Beam (FIB) technique using Quanta 3D 200i (FEI company, Hillsboro, Oregon, OR, USA) equipped with an OmniProbe lift-out system. Phase identification was performed by means of selected area electron diffraction (SAED) and it was supplemented by the energy dispersive X-ray spectroscopy (EDS). The chemical composition of the films was studied by XPS. The XPS spectra were recorded using a VSW (Vacuum Systems Workshop Ltd., ULVAC-PHI, Chigasaki, Japan) instrument, equipped with a concentric hemispherical 1500 mm electron analyzer and a two-plate 18-channel detector (Galileo). Elemental composition and the chemical states of the elements across the thin coatings were investigated by the X-ray Photoelectron Spectroscopy (XPS) coupled with depth profiling by argon ion sputtering. XPS analyses were performed by using the PHI Versa Probe II instrument equipped with scanning electron Al anode X-ray source (Al Kα1,2 with an energy equal to 1486.6 eV) with crystal monochromator. Pass energy of the electrons was equal to 47 eV and the take-off angle was 45°. Binding energy scale was calibrated assuming that the binding energy of electrons of the C 1s level in C–H bonding of the adventitious hydrocarbons (surface contamination) is equal to 284.8 eV. Charge neutralization of the samples was achieved using the argon ion gun and an electron flood gun simultaneously. The first XPS analysis of each sample was made on the as-received coating surface. Then, the samples were sputtered (ion etching) several times using the Ar+ ion beam for 2 min per 1 cycle and after each sputtering cycle they were immediately analyzed using XPS. The cycles of sputtering and subsequent XPS analyses were repeated until the substrate of the coating was reached. Each cycle of ion sputtering was carried out under the same parameters: the Ar+ energy—2.5 keV, ion current—3.2 nA and the sputtered area −1 × 1 mm2. During the XPS analysis the X-ray microbeam scanned only 500 × 500 μm2 of the central area of the ion sputtered crater in order to avoid the edge effects. As the sputtering yield was not known the depth scale was expressed in minutes of spraying. The catalytic properties in 4 ppm acetone atmosphere were carried out in a 30 cm3 gas chamber. The changes of the temperature in the range T = 313–437 °C were measured using a Pt 100 sensor and a digital multimeter Agilent 34970A (Agilent, Santa Clara, California, CA, USA). To measure the change in the resistivity of the samples, a Keithley 6517 electrometer (Keithely, Cleveland, Ohio, OH, USA) was used, operating in the internal voltage source mode. The control device was equipped with LabVIEW software. The measurement system also included a gas flow metering and control system, and a gas atmosphere with a defined composition and humidity (pump, gas cylinder, humidifier, flow controllers with the controller, etc.).

4. Conclusions

On the grounds of the studies, it was concluded that the doping of Sr layers La1−xSrxFeO3 (x = 0. 0.1, 0.2) result in a decrease in the size of the crystallites and the volume of the elemental cells. The reduction in the size of the elementary cell has been explained by the behavior of electroneutrality and the formation of Fe4+. It was observed that the layers of La1−xSrxFeO3 grow in the preferred orientation (121/200), and, as well, the change in the grained morphology was also denoted. Those phenomena are closely connected with the doping of the layers. In the case of LaFeO3 and La0.9Sr0.1FeO3, clusters around which small grains grow are visible in the structure, while in the layer of x = 0.2 of the content of strontium, the visible grains are elongated. The change in morphology can be explained by the change in the kinetics of the layer growth as a result of doping. Similar effects were observed in the LaFeO3 layers as a function of the temperature [22]. The roughness parameters increase with the increased Sr content, which was also confirmed by the results of XRD as reducing the size of crystallites. The TEM analyses have shown that the obtained thin films had a thickness in the range 150–170 nm with triangular or flat column ends. For exposed to gases are the surfaces (101/020) in the triangle-shaped columns and the plane (121/200) faces in flat columns. The best properties in the presence of CH3COCH3 gas were noted for the LaFeO3 thin film. They were characterized by a fast response time to the presence of 4 ppm acetone and surface regeneration. The LaFeO3 thin film has a grain morphology that ensures higher adsorption and desorption of oxygen; hence, the response times and sensitivity of this film are higher than in the case of the La0.9Sr0.1FeO3 film. These results are a consequence of different column ends (triangular in LaFeO3 and flat in La0.9Sr0.1FeO3). Therefore, the crystallographic orientation of columns involved in gas reactions has a decisive role.

Author Contributions

Conceptualization A.K. and A.C., methodology and investigation J.K.; research using XRD A.K., research using AFM and SEM Ł.C., research using XPS K.K., research using TEM T.M., electrical measurements W.M. All authors have read and agreed to the published version of the manuscript.

Funding

This research was funded by National Science Center through project number UMO-2013/09/B/ST8/01681.

Conflicts of Interest

The authors declare no conflict of interest.

References

  1. Fergus, J.W. Perovskite oxides for semiconductor-based gas sensors. Sens. Actuators B 2007, 123, 1169–1179. [Google Scholar] [CrossRef]
  2. Liu, X.; Ji, H.; Gu, Y.; Xu, M. Preparation and acetone sensitive characteristics of nano-LaFeO3 semiconductor thin films by polymerization complex method. Mater. Sci. Eng. B 2006, 133, 98–101. [Google Scholar] [CrossRef]
  3. Sukumar, M.; Kennedy, L.J.; Vijaya, J.J.; Al-Najar, B.; Bououdina, M. Facile synthesis of Fe3+ doped La2CuO4/LaFeO3 perovskite nanocomposites: Structural, optical, magnetic and catalytic properties. Mater. Sci. Semicond. Process. 2019, 100, 225–235. [Google Scholar] [CrossRef]
  4. Furfori, S.; Russo, N.; Fino, D.; Saracco, G.; Specchia, V. NO SCR reduction by hydrogen generated in line on perovskite-type catalysts for automotive diesel exhaust gas treatment. Chem. Eng. Sci. 2010, 65, 120–127. [Google Scholar] [CrossRef]
  5. Patel, F.; Patel, S. La1−xSrxCoO3 (x = 0, 0.2) perovskites type catalyst for carbon monoxide emission control from auto-exhaust. Proc. Eng. 2013, 51, 324–329. [Google Scholar] [CrossRef] [Green Version]
  6. Qin, J.; Cui, Z.; Yang, X.; Zhu, S.; Li, Z.; Liang, Y. Synthesis of three-dimensionally ordered macroporous LaFeO3 with enhanced methanol gas sensing properties. Sens. Actuators B Chem. 2015, 209, 706–713. [Google Scholar] [CrossRef]
  7. Gwon, O.; Yoo, S.; Shin, J.; Kim, G. Optimization of La1−xSrxCoO3−δ perovskite cathodes for intermediate temperature solid oxide fuel cells through the analysis of crystal structure and electrical properties. Int. J. Hydrogen Energy 2017, 39, 20806–20811. [Google Scholar] [CrossRef]
  8. Cao, X.; Zhi, L.; Jia, Y.; Li, Y.; Zhao, K.; Cui, X.; Ci, L.; Ding, K.; Wei, J. Enhanced efficiency of perovskite solar cells by introducing controlled chloride incorporation into MAPbI3 perovskite films. Electrochim. Acta 2018, 275, 1–7. [Google Scholar] [CrossRef]
  9. Dhilip, M.; Aparna Devi, N.; Stella Punitha, J.; Anbarasu, V.; Saravana Kumar, K. Conventional synthesis and characterization of cubically ordered La2FeMnO6 double perovskite compound. Vacuum 2019, 167, 16–20. [Google Scholar] [CrossRef]
  10. Jaouali, I.; Hamrouni, H.; Moussa, N.; Nsib, M.F.; Centeno, M.A.; Bonavita, A.; Neri, G.; Leonardi, S.G. LaFeO3 ceramics as selective oxygen sensors at mild temperature. Ceram. Int. 2018, 44, 4183–4189. [Google Scholar] [CrossRef]
  11. Thirumalairajan, S.; Valmor, K.G.; Mastelaro, R.; Ponpandian, N. Surface morphology-dependent room-temperature LaFeo3 nanostructure thin films as selective NO2 gas sensor prepared by radio frequency magnetron sputtering. Appl. Mater. Interfaces 2014, 6, 13917–13927. [Google Scholar] [CrossRef] [PubMed]
  12. Lin, Q.; Yang, X.; Lin, J.; Guo, Z.; He, Y. The structure and magnetic properties of magnesium-substituted LaFeO3 perovskite negative electrode material by citrate sol-gel. Int. J. Hydrogen Energy 2018, 43, 12720–12729. [Google Scholar] [CrossRef]
  13. Murade, P.A.; Sangawar, V.S.; Chaudhari, G.N.; Kapse, V.D.; Bajpeyee, A.U. Acetone gas-sensing performance of Sr-doped nanostructured LaFeO3 semiconductor prepared by citrate sol–gel route. Curr. Appl. Phys. 2011, 11, 451–456. [Google Scholar] [CrossRef]
  14. Sharma, N.; Sharma, S.K.; Sachdev, K. Effect of precursors on the morphology and surface area of LaFeO3. Ceram. Int. 2019, 452, 7217–7225. [Google Scholar] [CrossRef]
  15. Pecchi, G.; Jiliberto, M.G.; Buljan, A.; Delgado, E.J. Relation between defects and catalytic activity of calcium doped LaFeO3 perovskite. Solid State Ion. 2011, 187, 27–32. [Google Scholar] [CrossRef]
  16. Wang, X.; Qin, H.; Pei, J.; Chen, Y.; Li, L.; Xie, J.; Hu, J. Sensing performances to low concentration acetone for palladium doped LaFeO3 sensors. J. Rare Earths 2016, 37, 704–710. [Google Scholar] [CrossRef]
  17. Cyza, A.; Kopia, A.; Cieniek, L.; Kusiński, J. Structural characterization of Sr doped LaFeO3 thin films prepared by pulsed electron deposition method. Mater. Today Proc. 2016, 3, 2707–2712. [Google Scholar] [CrossRef]
  18. Kumar, M.; Srikanth, S.; Ravikumar, B.; Alex, T.C.; Das, S.K. Synthesis of pure and Sr-doped LaGaO3. LaFeO3 and LaCoO3 and Sr. Mg-doped LaGaO3 for ITSOFC application using different wet chemical routes. Mater. Chem. Phys. 2009, 113, 803–815. [Google Scholar] [CrossRef]
  19. Phokha, S.; Hunpratup, S.; Pinitsoontorn, S.; Putasaeng, B.; Rujirawat, S.; Maensiri, S. Structure, magnetic, and dielectric properties of Ti-doped LaFeO3 ceramics synthesized by polymer pyrolysis method. Mater. Res. Bull. 2015, 67, 118–125. [Google Scholar] [CrossRef]
  20. Nafsin, N.; Castro, R.H.R. Direct measurements of quasi-zero grain boundary energies in ceramics. J. Mater. Res. 2017, 32, 166–173. [Google Scholar] [CrossRef] [Green Version]
  21. Premper, J.; Sander, D.; Kirschner, J. In situ stress measurements during pulsed laser deposition of BaTiO3 and SrTiO3 atomic layers on Pt(001). Appl. Surf. Sci. 2015, 335, 44–49. [Google Scholar] [CrossRef]
  22. Stämmler, S.; Merkle, R.T.; Stuhlhofer, B.; Logvenov, G.; Hahn, K.; van Aken, P.A.; Maier, J. Phase constitution. Sr distribution and morphology of self-assembled La-Sr-Co-O composite films prepared by PLD. Solid State Ion. 2017, 303, 172–180. [Google Scholar] [CrossRef]
  23. Kopia, A.; Kowalski, K.; Leroux, C.; Gavarri, J.R. Influence of the substrate on the structure stability LaLuO3 thin films deposited by PLD method. Vacuum 2016, 134, 120–129. [Google Scholar] [CrossRef]
  24. Duan, Z.; Zhang, Y.; Tong, Y.; Zou, H.; Peng, J.; Zheng, X. Mixed-potential-type gas sensors based on Pt/YSZ film/LaFeO3 for detecting NO2. J. Electron. Mater. 2017, 46, 6895–6900. [Google Scholar] [CrossRef]
  25. Jędrusik, M. Microstructure and Sensing Properties of LaMO3 (M = Co. Fe) Thin Films. Ph.D. Thesis, AGH Univerisity of Science and Technology, Cracow, Poland, 9 December 2019. [Google Scholar]
  26. Chen, Y.; Qin, H.i.; Wang, X.; Li, L.; Hu, J. Acetone sensing properties and mechanism of nano-LaFeO3 thick-films. Sens. Actuators B 2016, 235, 56–66. [Google Scholar] [CrossRef]
  27. Wang, C.; Rong, Q.; Zhang, Y.; Hua, J.; Zia, B.; Zhu, Z.; Zhang, J.; Liu, Q. Molecular imprinting Ag-LaFeO3 spheres for highly sensitive acetone gas detection. Mater. Res. Bull. 2019, 109, 265–272. [Google Scholar] [CrossRef]
  28. Wei, W.; Guo, S.; Chen, C.; Sun, L.; Chen, Y.; Guo, W.; Ruan, S. High sensitive and fast formaldehyde gas sensor based on Ag-doped LaFeO3 nanofibers. J. Alloy. Compd. 2017, 695, 1122–1127. [Google Scholar] [CrossRef]
  29. Wang, X.; Ma, W.; Sun, K.; Hu, J.; Qin, H. Nanocrystalline Gd1–xCaxFeO3 sensors for detection of methanol gas. J. Rare Earths 2017, 35, 690–696. [Google Scholar]
  30. Maziarz, W. TiO2/SnO2 and TiO2/CuO thin film nano-heterostructures as gas sensors. Appl. Surface Sci. 2019, 480, 361–370. [Google Scholar] [CrossRef]
  31. Wang, X.; Qin, H.; Sun, L.; Hu, J. CO2 sensing properties and mechanism of nanocrystalline LaFeO3 sensor. Sens. Actuators B 2013, 188, 965–971. [Google Scholar] [CrossRef]
Figure 1. XRD patterns of targets after ablation process La1−xSrxFeO3 (x = 0, 0.1, 0.2).
Catalysts 10 00954 g001
Figure 2. XRD patterns of thin films La1−xSrxFeO3 (x = 0, 0.1, 0.2).
Catalysts 10 00954 g002
Figure 3. SEM and AFM images of thin films (a,b) LaFeO3 (c,d) La0.9Sr0.1FeO3 (e,f) La0.8Sr0.2FeO3.
Catalysts 10 00954 g003
Figure 4. XPS spectrum of LaFeO3 thin films for the C 1s, O 1s and Si 2s line.
Catalysts 10 00954 g004
Figure 5. XPS spectrum of Fe 2p line for (a) LaFeO3 (b) La0.9Sr0.1FeO3 (c) La0.8Sr0.2FeO3 thin films.
Catalysts 10 00954 g005
Figure 6. XPS spectrum of La 3d line for (a) LaFeO3 (b) La0.9Sr0.1FeO3 (c) La0.8Sr0.2FeO3 thin films.
Catalysts 10 00954 g006
Figure 7. XPS spectrum of Sr 3d line for (a) La0.9Sr0.1FeO3 (b) La0.8Sr0.2FeO3 thin films.
Catalysts 10 00954 g007
Figure 8. TEM image and electron diffraction for LaFeO3 thin film.
Catalysts 10 00954 g008
Figure 9. TEM image and electron diffraction for La0.9Sr0.1FeO3 thin film.
Catalysts 10 00954 g009
Figure 10. TEM image and electron diffraction for La0.8Sr0.2FeO3 thin film.
Catalysts 10 00954 g010
Figure 11. TEM image of LaFeO3 thin films with FFT [25].
Catalysts 10 00954 g011
Figure 12. Response and recover characteristics of (a) LaFeO3 (b) La0.9Sr0.1FeO3 thin film.
Catalysts 10 00954 g012
Table 1. Crystallographic and roughness parameters.
Content SrLaFeO3
[T = 30 °C]
x = 0x = 0.1x = 0.2
Orthorhombic Pmna 62 a = c γ = 90°
Cell parameters
a [nm]0.55540.55660.55200.5521
b [nm]0.78530.78560.78590.7837
c [nm]0.55560.55560.55440.5545
V [nm3]0.24200.2430.2410.239
Crystallites size D [nm]-36 ± 320 ± 318 ± 3
Ra [nm]-2.275.577.97
Rmax [nm]-15.932.554
Rt6.3141530

