Abstract
The reduction of CO2 is relevant for the production of compounds as part of the carbon capture and utilization research approaches. Thus, photocatalytic reduction of CO2 over a tailored BiOCl-based photocatalyst (BTEG) was tested under UV light (365 nm). BTEG was synthesized in the presence of triethylene glycol, which gave 4-nm crystallites, much smaller than the 30 nm crystallites of commercial BiOCl. Commercial BiOCl reduced CO2 mainly to methane with a minor fraction of ethanol, and was inactivated after 20 h. BTEG was a more active catalyst for CO2 photoreduction, producing approximately equal amounts of methane, methanol, and ethanol while consuming 0.38 µmol g−1 h−1 of CO2 before the experiment was stopped after 43 h, with the catalyst still active. The different products formed by the BTEG photocatalyst samples were tentatively ascribed to its greater content of {110} facets. Thus, in addition to band-gap tuning, the relative fractions of BiOCl facets had a key role in the effective photocatalytic reduction of CO2, and the BiOCl-based BTEG catalyst promoted the formation of important compounds as methanol and ethanol.
1. Introduction
The risks and effects of the increasing atmospheric concentration of CO2 can be mitigated in many ways, and carbon capture and storage (CCS) technologies are often judged important to assure that the average increase of the global temperatures is below 1.5 °C [1]. As a parallel development to CCS, carbon capture and utilization (CCU), in which captured CO2 is converted into fuels or other chemicals, could contribute to limiting CO2 emissions and offer economical uses of CO2. The conversion of CO2 is thermodynamically challenging [2]; however, its photochemical reduction [3,4,5,6] could, in principle, be integrated into self-sustained off-grid configurations.
CO2 can be photocatalytically reduced in heterogeneous systems with supported metal complexes [7] or solid semiconductors with suitable band gaps. In the latter case, both CO2 and H2O, which acts as a reducing agent, are first adsorbed at the solid interface of the semiconductor [4,8,9,10]. Electron–hole (e−/h+) pairs are photogenerated when the semiconductor is excited with energy quanta (hv) ≥ bandgap (Eg). The e−/h+ pairs typically segregate and the e− diffuses comparably fast across the conduction band while the h+ is more static and contained in the valence band. The h+ contributes to the oxidation of H2O, and the e− to the reduction of CO2 and H+ into various C1–C3 compounds, where CO, CH4, and CH3OH are the most commonly reported [7,8,9].
The reaction pathways for the conversion of CO2 depend on both intensive and extensive properties, such as the light absorption of photocatalysts, the creation and use of charge carriers in the process, and the type of reducing agent used [10]. For example, the photocatalytic reduction over TiO2 has generated CH4 and HCOOH using isopropanol as the reductant [9]; or CH4 and CO with H2O as the reductant [11]; and CH4, C2H6 and CO using H2 as the reductant [11].
TiO2 has been used for photocatalytic reduction of CO2 due to its oxidation properties, and superior charge-transport properties [8,10,11,12]. Nevertheless, recently other semiconductors materials, including ZnO [13], BiVO4 [14,15], BiOI [16,17,18], and BiOCl [19,20] have been used as photocatalysts for CO2 reduction.
The BiOCl is a photochemically active semiconductor [21] in the oxyhalide family (BiOX; X = Cl, Br and I) that has a tetragonal matlockite (PbFCl-type) structure (a = b = 3.89 Å, c = 7.37 Å) and a fluorite-type motif [22]. The bismuth oxyhalides have strong interlayer covalent bonding between oxygen and bismuth [Bi–O] and weaker interactions with the chloride ions (Figure 1). The negatively charged layer of chloride ions and the positively charged layer of [Bi–O] moieties generate electrostatic fields that promote the separation of photoinduced e− and h+ and in turn improve photocatalytic activity [22,23,24,25,26,27].
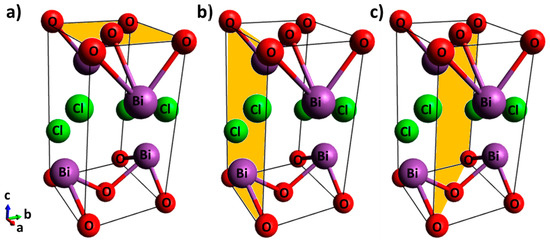
Figure 1.
Unit cell of BiOCl with shading on the (a) {001} facet, (b) {010} facet, and (c) {110} facet.
The layered structure of BiOCl promotes the formation of slabs and thin sheets with {001} and {010} facets [28]. The {001} facet contains a high percentage of terminal oxygen atoms that can be lost to generate oxygen vacancies, which can cause a defect state lying close to the bottom of the conduction band of the BiOCl, thus improving the separation of e−/h+ and in turn the photocatalytic activity [29]. In the CO2 photoreduction, oxygen vacancies on the {001} facet bind to CO2 and are filled by O2 from CO2 after the O=C=O dissociation process [16,17,18,20].
On the other hand, the {010} facets are the surface side of BiOCl and their exposure in high percentage is very difficult due to their high surface energy. Although significant fractions of {010} facets can occur upon synthesis under certain pH conditions, and BiOCl with a large fraction of {010} facet was efficient in the high yield of degradation of methyl orange by photosensitization [28], other facets are also generated [26,30,31]. BiOCl nanostructures with highly exposed {110} facets efficiently separate photoinduced e−/h+, due to the negatively charged [O] layer and positively charged [Bi–Cl] layer that are alternatively arranged in the crystal structure [31].
Additionally to its structure, the morphology of a BiOCl photocatalyst crucially impacts its adsorption and, consequently, photocatalytic reduction of CO2. For example, the reduction of CO2 using UV irradiation (250–380 nm) over BiOCl nanoplates, nanosheets, and ultrathin nanosheets yielded ~16.6, 27.4 and 41.5 µmol g−1, respectively, of CH4 after 8 h [19].
The cost-effective synthesis of BiOCl with elaborate nanostructures and 3D topologies has recently been investigated [32,33,34]. For instance, the solvothermal preparation of BiOCl in glycols, at atmospheric pressure and without surfactants, has produced BiOCl particles with high surface area (up to 40.7 m2 g−1) [34] and adequate activity for photochemical dye degradation [34,35]. Therefore, we synthesized a BiOCl powder in triethylene glycol (TEG), and compared its activity and mechanism for photochemical CO2 reduction with those of commercial BiOCl.
2. Results and Discussion
2.1. Synthesis of BiOCl
The X-ray diffraction (XRD) patterns (Figure 2) of both a tailored BiOCl-based photocatalyst (BTEG) and a commercial pearlescent powdered BiOCl, from now on labeled as P2600 corresponded to tetragonal BiOCl (a = 3.89 Å, c = 7.37 Å; JCPDS 06-0249). No shifts or extra peaks were observed in the patterns. The diffraction peaks for BTEG were wider, implying smaller crystalline domains, than those for P2600 with narrow and intense peaks, typical of large, highly crystalline particles. Approximate crystal sizes, derived by applying the Scherrer equation [36] to the (001) peak of BiOCl, were 3.8 nm for BTEG and 32 nm for P2600 [37].
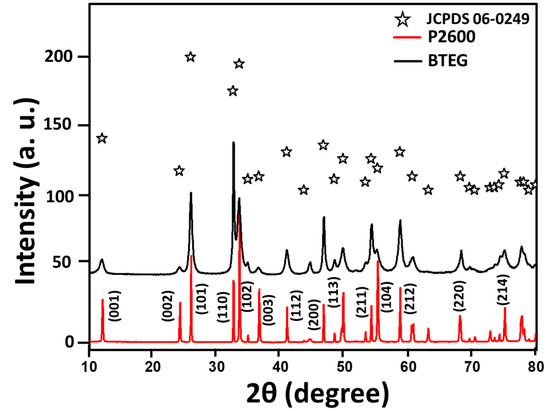
Figure 2.
X-ray diffraction patterns of BiOCl samples (bottom, red) P2600 [37], (top, black) BTEG.
The XRD peaks corresponding to the (001), (002), and (003) planes of BiOCl were relatively more intense in the pattern for P2600 than for BTEG, which indicates that the {001} facets are more developed in the former sample, although we note that differing degrees of preferential orientation of particles could also affect these relative intensities. The more intense (110) diffraction peak of BTEG than P2600 suggests that BTEG contains a higher fraction of {110} facets than P2600; these can favor the efficient separation of photoinduced e−/h+ in the BiOCl nanostructures [31]. The differences in the exposed phases could be related to the synthesis method, as the use of polyols such as PEG400 can promote the {110} facet orientation along [38].
P2600 was composed of irregularly shaped stacked sheets, 10–60 µm in size and 90 nm thick, arranged in a flower-like morphology (Figure 3a); whereas the synthesized BTEG consisted of spherical aggregates about 1 µm in diameter. These consisted of thin nanosheets connected at the center (Figure 3b), and was thus similar in size and shape to the BiOCl observed by Stadler and co-workers [34].
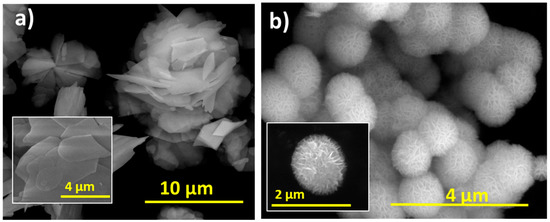
Figure 3.
Scanning electron microscopy images of BiOCl. (a) P2600, (b) BTEG.
The IR spectra of P2600 and BTEG (Figure 4a) both featured the symmetrical stretching vibration of the [Bi–O] bond at 520 cm−1. The spectrum of P2600 (Figure 4b) showed no signals associated with residues from the synthesis. The IR spectrum of BTEG (Figure 4a) contained bands corresponding to BiOCl (Figure 4b), water (bands at 1608 and 3463 cm−1), and the solvent TEG (Figure 4a). Thermogravimetric analysis showed that the BTEG contained 2 wt% TEG (Figure 5; mass loss between 200–400 °C, c.f. the boiling point of TEG, 270–290 °C). Further heating resulted in mass loss at ~570 °C, which is ascribed to changes in the BiOCl.
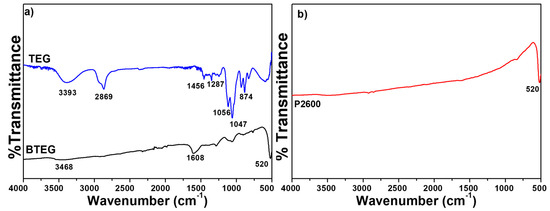
Figure 4.
Infrared spectra of BiOCl and TEG. (a) TEG and BTEG, (b) P2600 [37]. TEG = triethylene glycol.
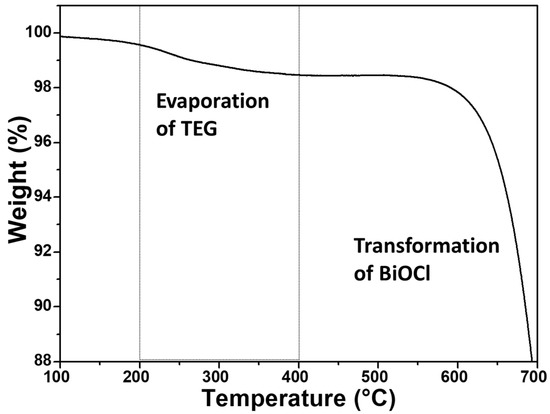
Figure 5.
BTEG thermogram from TGA analysis.
The BET surface area of the BTEG was 11 times larger than that of the commercial P2600 (Table 1), as expected from the eight times larger crystallites of the P2600 samples. The polyol TEG was used in order to promote nucleation during the synthesis of BiOCl, as it is more viscous than water, which affects the assembly of the plates as well as the crystal growth. Other authors have reported that the size of the solvent molecules and the concentration of the reactants affect the final BiOCl morphology [34,35]. Xiong et al. used ethylene, diethylene, and triethylene glycol solvents, and obtained ellipsoid-like, sphere-like and flower-like morphologies, respectively, all with high surface areas [35]. Our BTEG had a higher surface area than the TEG-derived BiOCl samples reported to date [34,35,39].

Table 1.
Textural parameters of the BiOCl samples.
The N2 adsorption–desorption isotherms of the BiOCl samples (Figure 6a,c) showed the H3 hysteresis loops characteristic of certain mesoporous materials. The hysteresis was clearly defined in the isotherm of BTEG, which could be classified as type IV (mesoporous solid). The isotherm of P2600 was type II (non- or macroporous solids). The pore distribution in BTEG sample showed a broad distribution of sizes of 5–30 nm (Figure 6b) while P2600 had primarily pores smaller than 20 nm (Figure 6d).
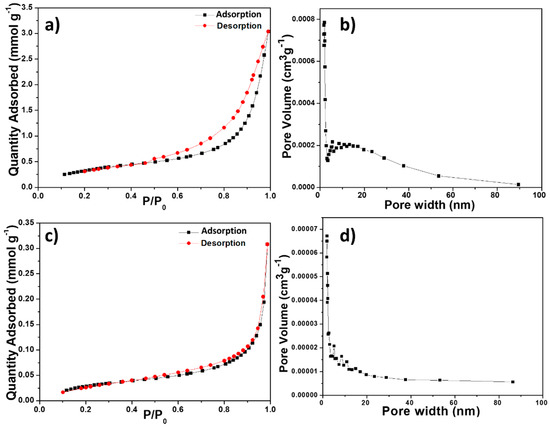
Figure 6.
N2 adsorption–desorption isotherms (a,c) and pore size distribution curves (b,d) of the BiOCl samples: (a,b) BTEG, (c,d) P2600.
Both the P2600 and BTEG samples of BiOCl absorbed UV light (Figure 7). The band gap for BTEG, determined from a plot of (αhν)1/2 versus photon energy (hν) [22], was 3.20 eV, which was slightly smaller than the 3.25 eV measured for P2600 (Inset Figure 7), although both values were in the reported bandgap range for BiOCl sample [40]. The smaller band gap of BTEG could mean a lower photoactivation energy and a potential improvement of the photocatalytic activity.
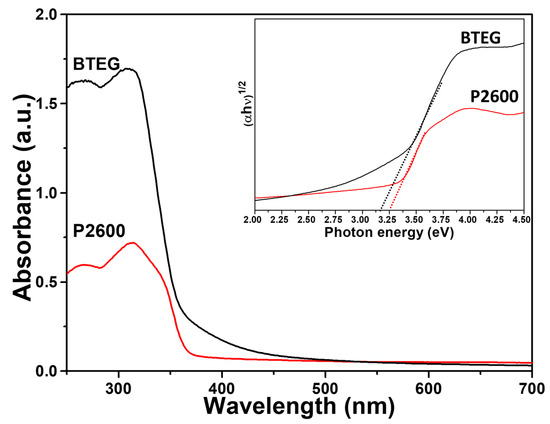
Figure 7.
Diffuse reflectance UV-Vis spectra of BiOCl samples. Inset: plots of (αhv)1/2 vs. hv.
The photoluminescence spectra are useful for evaluating the separation efficiency of the photogenerated charge, as e−/h+ and its recombination [8,32,41]. When the P2600 and BTEG were excited by irradiation at 280 nm, they emitted light centered at 382 nm, with similar intensities (Figure 8). This UV emission was attributed to the recombination of free electrons from the bottom of the conduction band to the ground state [42], and occurred at an energy nearly equal to the band gap (3.2 eV) obtained from the UV-Vis spectra.
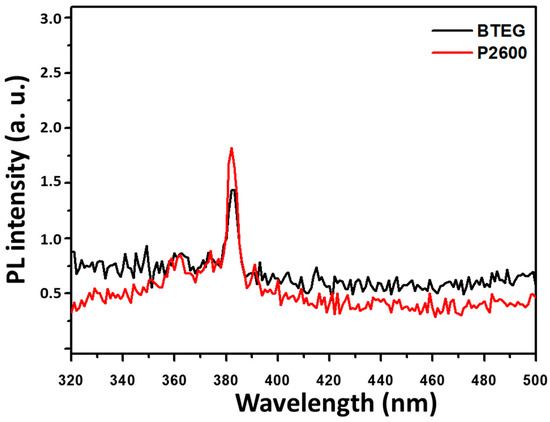
Figure 8.
Photoluminescence spectra of BiOCl samples at λexc = 280 nm.
2.2. Photoreduction of CO2
The photocatalytic activities of the BiOCl samples were evaluated through the concentration of the product formed on reduction of CO2 under UV irradiation (365 nm). The quantities of the formed CH4, CH3OH and C2H5OH are presented as a function of time in Figure 9.
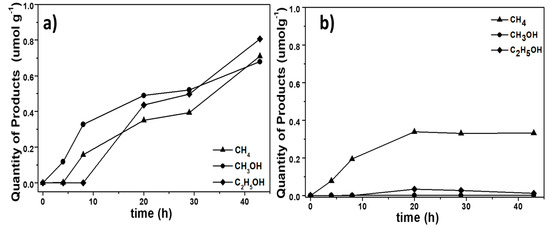
Figure 9.
Product profiles during the photocatalytic reduction of CO2 by BiOCl samples. (a) BTEG, (b) P2600.
The photocatalytic reduction of CO2 over both BiOCl samples and with irradiation at 365 nm yielded primarily CH4 and CH3OH. However, with the BTEG sample, significant amounts of C2H5OH were also formed (Figure 9a). The overall photocatalytic yield was higher with the BTEG catalyst, which also remained active for much longer than P2600. The photocatalytic reduction of CO2 with BTEG produced CH3OH first, and the generation of CH4 and C2H5OH started after a few hours. After 43 h, the BTEG catalyst gave 0.710 µmol CH4 g−1, 0.677 µmol CH3OH g−1 and 0.807 µmol C2H5OH g−1 (Figure 9a), and remained active. The reaction over P2600 gave primarily CH4, yielding 0.33 µmol CH4 g−1 over 43 h. The transient C2H5OH yield over P2600 was 0.010 µmol g−1, and the CH3OH yield was negligible (Figure 9b). CO was not detected, despite that the GC column used (HP-PLOT Q) could separate CO from CO2 and small hydrocarbons. Therefore, if any CO was formed, its concentration was too low to be detected by the thermal conductivity detector despite that it is a major product of CO2 photoreduction over BiOI [16,17,18] and BiOBr [43].
It is complicated to compare the photocatalytic activity of BTEG to those of reported systems due to variations in experimental conditions like the amount of photocatalyst, volume, impregnated catalyst area, CO2 generation, phase type, etc. as is observed in Table 2. Despite that all experiments listed in Table 2 involved CO2 generated from NaHCO3 and H2SO4, the amount of BiOX and the volume reactor were different; besides, in our case the identified products were different (CO was not detected). In the report that used BiOCl as the photocatalyst, the experiments reported were carried out in the liquid phase by injecting pure CO2 gas into the H2O in the reactor, making this system quite different from ours. Therefore, a direct comparison of these systems is not viable. Nevertheless, Table 2 gives an idea about what kind of related photocatalysts have been used and what products are obtained, accordingly.

Table 2.
BiOX systems for CO2 photoreduction 1.
The concentrations of CO2 and O2 in the hermetically closed reactor were determined before and after the experiments. Initially, a calculated 818 µmol of CO2 were added to the reactor; whereas GC measurements indicated that 785.6 µmol CO2 was present initially. This amount was taken as 100% of the CO2 available. The CO2 photoconversion, using BTEG-TEG, was just 1% after 43 h of irradiation (Figure 10a). When the BTEG and P2600 catalysts were irradiated under N2 (BTEG-N2 and P2600-N2 in Figure 10), no carbon-containing products were detected, but when they were irradiated in the presence of CO2, they consumed 31 and 7% of the CO2 respectively, in the same reaction time (43 h).
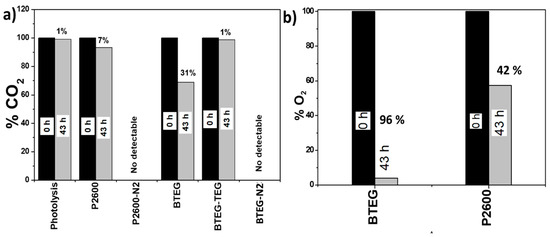
Figure 10.
Percentage of (a) CO2 and (b) O2 present in the photochemical reactor after irradiation at 365 nm in the presence of various compounds for 43 h.
In preliminary experiments, we detected O2 in the reaction chamber, and therefore quantified it, as it was expected to contribute to the formation of oxygen reactive species and change the products profile. The initial concentration of O2 measured, in a mixture with CO2, was 10 µmol, and this was taken as 100%. After 43 h of irradiation in the presence of BTEG, 96% of this initial O2 was consumed, and only 42% was consumed over P2600. BTEG produces alcohols and CH4 at high concentrations. So far, the CO2 kinetics have not been reported in the literature considering the initial CO2 concentration, so it is not possible to compare the herein obtained results.
The surface area, bandgap, and the exposed area of a semiconductor are important to their photocatalytic behavior; however, Pellegrino et al. report and remark that the photoproduced materials cannot be associated with just one photocatalyst feature [44]. BTEG exhibits a large fraction of {110} facets, while P2600 exhibits preferentially the {001} facet. The {001} facet of BiOCl is rich in oxygen atoms, meaning that fewer CO2 molecules can be adsorbed (see Figure 11a), as oxygen vacancies are necessary to permit the interaction between BiOCl and oxygen atom from CO2. On the other hand, the {110} facets (shown in Figure 11b) prominent in BTEG can improve the interaction between CO2 with oxygen and chloride atoms of BTEG. For example, Ye et al. worked with BiOI with two facets, where they observed the best generation of CO and CH4 in BiOI sample with {001} facet in comparison with {100} facet. These results were attributed to the better separation of e−/h+ photogenerated in the BiOI [16]. In this case, P2600 with a high percentage of {001} should generate a high concentration of products, however, it has the disadvantage of a low surface area. An 11 times smaller BET area in P2600 than BTEG could slow the photocatalytic activity as observed in Figure 9b. Also, the bandgap energy was different for the two samples, with BTEG having a smaller band gap than P2600. A small bandgap can efficiently separate photoinduced electrons and holes and adsorb CO2 on the surface of the BiOCl and, consequently, affect the product formation.
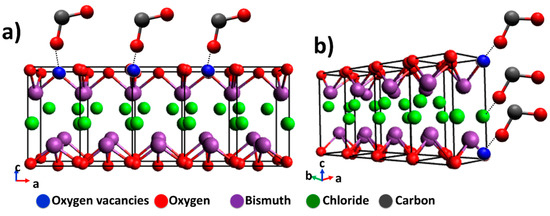
Figure 11.
Schematic illustration of BiOCl and the interaction with CO2 of the predominant facets for: (a) P2600 {001} facet, and (b) BTEG {110} facet.
Besides the term that is commonly used to quantify the efficiency of photocatalytic CO2 reduction processes, Apparent Quantum Yield (AQY) and selectivity are used to evaluate the performance of various photocatalytic CO2-conversion systems. AQY is a measure of the moles of photons that result in CO2-reduction products, which is calculated by using the product amount and the incident photon number (Equation (1), where ne is the number of electrons needed to convert 1 mole of reactant to 1 mole of product [17,45,46] considering the different numbers of electrons required to form CH4, CH3OH, and C2H5OH (Equations (2)–(4)). The rate of incident photons can be calculated using Equation (5), where Lint is the incident light intensity (3.8 mW cm2), Aproj is the area of light irradiation projected on the reactor (38 cm2), h is the Planck constant, c is the speed of light, and λ is the wavelength of light (365 nm). The total moles of photons were calculated for the 43 h period of photon flux.
The selectivity of BiOCl for each product was evaluated using Equation (6), where Ci is the concentration of product i (CH4, CH3OH or C2H5OH).
The AQY obtained with BTEG (11.2%) was nine times higher than that with P2600 (1.23%). Thus, BTEG was a more active photocatalyst for the reduction of CO2 than P2600. However, P2600 has a very high selectivity toward CH4 formation (Figure 12). The BTEG was still very active when the experiment was stopped; AQY would have been higher if the experiment had been allowed to continue.
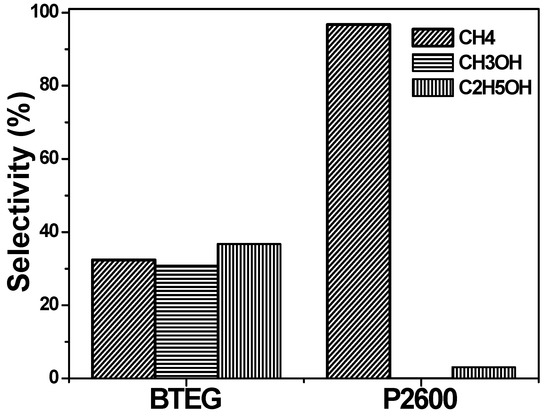
Figure 12.
Selectivity of products generated from CO2 photocatalytic reduction.
BTEG was the more active photocatalyst, producing 2.2x as much methane per unit time as P2600 did (see Table 2). We considered that the greater activity of BTEG could be due to its smaller particle size and higher surface area (Table 1), as chemical reactions occur on the surface of the photocatalyst [47], so smaller particles with greater surface area provide a higher number of active sites and faster charge transfer so long as particle aggregation does not lower surface area [48]. The effect of surface area and particle size on photocatalytic performance can be associated with recombination rate, adsorbed quantity of the species to be photo-transformed, and other parameters that are linked to the surface area [49]. The specific activity (production per surface area of photocatalyst) for methane production was actually lower for BTEG (5.4 × 10⁻⁵ µmol h−1 m−2) than for P2600 (2.81 × 10⁻⁴ µmol h−1 m−2). Although the intrinsic rate of methane production for a given exposed surface of catalyst was therefore greater for P2600, the same could not be said for the intrinsic rate of CO2 conversion, as photoreduction over BTEG produced methane, methanol, and ethanol in similar quantities. The intrinsic rates of C incorporation into reduced products (i.e., CH4 + CH3OH + 2C2H5OH) were 2.3 × 10⁻³ and 2.6 × 10⁻⁴ mol h−1 m−2 for BTEG and P2600, respectively. Thus, the greater activity of BTEG could not be attributed entirely to its higher surface area; rather, the intrinsic rate of product generation was greater over BTEG. Overall photocatalytic performance depends on several factors, most of them associated with crystal size and predominant facets [50].
The generation of the products could be explained using sequential reactions (Figure 13). For example, the generation of CH3OH could be explained by four routes (blue arrows) involving H2O(g) directly. The second route could involve H2 because, thermodynamically, the reaction of CO2 with H2 is more much more favorable than with H2O [51]. A little H2 peak was observed in our study, however, it was too small to evaluate the concentration, so H2 was probably consumed very quickly upon formation. The third and fourth possible routes from CO2 to CH3OH involve the formation of a formate (HCOO•) or carboxyl radical (COOH•). Finally, the CH4 can be generated via the pathways presented in Figure 13 (red arrows), taking CH3OH as an intermediate product, or by reaction with H2O or H+ or H2 directly. The reactions for the formation of C2 compounds such as the observed C2H5OH (green arrow) involve more electrons than those for CH4 and CH3OH formation. However, the photocatalytic process can involve chain reactions, reversible reactions and competitive reactions, meaning that electron consumption can only be calculated as a total for the generation of the observed CH4, CH3OH, and C2H5OH.
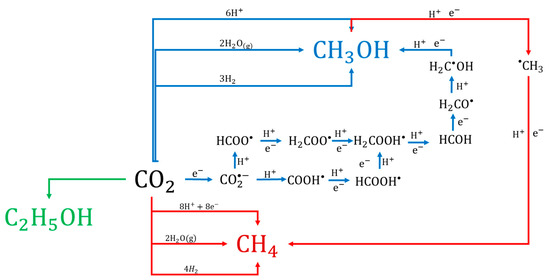
Figure 13.
The proposed general mechanism of photocatalytic reduction of CO2 over BiOCl.
Finally, as it was mentioned in the Introduction section, TiO2 and its derivatives have been widely used and studied for CO2 photoreduction. For example, Wang et al. reported a methane production of 0.09 µmol g−1 h−1 using TiO2 doped with cobalt [52]. When the TiO2 was doped with an amine, the yield was 0.15 µmol g−1 h−1 [53]. Metal deposition has also been used to improve photocatalytic performance of TiO2 photocatalytic performance, thus Pt has been reported to enhance (1300 µmol g−1 h−1) the methane production compared to pure TiO2 (0.8 µmol g−1 h−1) [54]. Nanoparticles of gold have also been used to enhance the photoreduction of CO2, obtaining 2.52 µmol g−1 h−1 of methane, which is notably higher than pure TiO2, 0.69 µmol g−1 h−1 [55]. However, there have also been reports of noticeably lower values, 0.01 µmol g−1 h−1, for methane production from CO2 photoreduction using pure TiO2 [10]. Most of the values for methane production using modified TiO2 are higher than those obtained using pure BiOCl (0.016 µmol g−1 h−1), but with pure TiO2 the values regarding BiOCl are comparable. Also, the fast photocorrosion suffered by TiO2 is an important issue to solve, which is not exhibited by the BiOCl.
3. Experimental Section
Materials: Bi(NO3)3·5H2O (≈98% purity), NaCl (≈98% purity), and TEG (≈99% purity) were obtained from Sigma–Aldrich. The NaHCO3 was supplied by Fermot, and H2SO4 (≈90% purity) by Macron. Commercial BiOCl (P2600) was supplied by Farmaquimia S.A. de C.V. (Mexico).
3.1. Synthesis of BiOCl
The BiOCl sample already named BTEG was synthesized according to the method of Stadler and co-workers [34]. TEG (50 mL) and Bi(NO3)3·5H2O (0.912 g) were mixed for 12 h until total dissolution, after which 0.5 mL of aqueous NaCl (4 M) was added under continuous stirring for 30 min (Figure 14). The solution was heated up to 150 °C for 60 min under vigorous stirring, then allowed to cool to room temperature. The solid product was collected, washed repeatedly with deionized water, and recovered by centrifugation. Finally, it was washed with methanol and dried at 80 °C for 24 h.
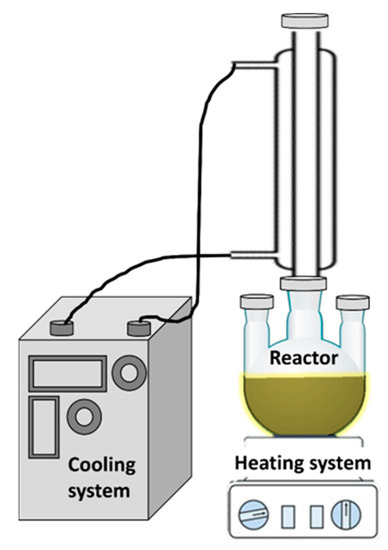
Figure 14.
BiOCl synthesis system.
3.2. Characterization
The P2600 sample previously characterized [37] was studied by environmental scanning electron microscopy (ESEM) using a QUANTA 200 microscope from FEI (Hillsboro, OR, USA), operating at an accelerating voltage of 3 kV at 10–130 Pa. The samples were mounted on aluminum pins and coated with gold for 20 s.
Crystal structures were characterized by X-ray diffraction using a DX8 Bruker advance diffractometer (Billerica, MA, USA) using the following parameters: Cu Kα radiation (λ = 0.15418 nm), 45 kV, 40 mA, over the 2θ range from 10 to 80° in steps of 0.02° s−1.
Infrared spectra (IR, Varian 670-IR) were recorded in the range from 400 to 4000 cm−1 using 124 scans and 4 cm−1 resolution. The samples were mixed with potassium bromide (KBr) and pressed into pellets.
Thermogravimetric analysis was performed using a TGA Q500 (TA Instruments) (New Castle, DE, USA) from 30 to 700 °C, with a heating rate of 10 °C min−1 and N2 flow of 50 mL min−1.
The bandwidth was determined from the UV-Vis spectra of solids using a Shimadzu Spectrometer (Kyoto, Japan) model UV-2401 PC. The baseline was obtained using Spectralon®. The band gap energy (Eg) of the BiOCl samples was obtained by plotting BiOCl (αhv)1/2 versus photon energy.
Photoluminescence spectra (PL) were recorded on a Cary Eclipse fluorescence spectrophotometer (Santa Clara, CA, USA) with a 280 nm excitation wavelength.
The N2 adsorption–desorption isotherms were recorded with a Micromeritics ASAP 2020 analyzer (Atlanta, GA, USA) at –196 °C. Before analyses, samples were degassed under dynamic vacuum at 100 °C for 120 min. The corresponding Brunauer–Emmett–Teller surface areas were calculated from the N2 adsorption data over the relative pressure (p/p0) range of 0.05–0.25. Total pore volumes were determined from the N2 adsorption at p/p0 = 0.98. Pore size distributions were obtained by applying the Barrett–Joyner–Halenda (BJH) model to the N2 desorption isotherms.
3.3. Photocatalytic Transformation Tests
The photocatalytic transformation of CO2 was tested using 0.1 g of the BiOCl catalyst, impregnated on the glass inner walls of a 20 mL reactor with a total area of 18.87 cm2. The reaction setup was evacuated before the experiment. The light source was a UV lamp (3UVTM lamp, UVP) emitting at 365 nm placed 5 cm away from the reactor. The CO2 (101 kPa) was generated in another reactor (120 mL), where 425 mg of NaHCO3 and 2 mL of H2SO4 (4 M) were mixed and then 20 mL of the generated CO2 were transferred to the hermetically closed photocatalytic reactor (Figure 15). Before starting the photocatalytic process, all samples were maintained in the dark for 1 h to achieve sorption equilibrium.
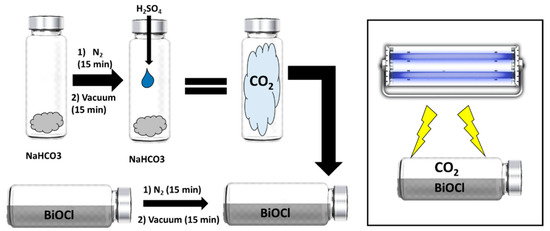
Figure 15.
Scheme of the generation of CO2 and the photocatalytic process.
The photocatalytic transformation of CO2 was carried out at 25 °C and the products followed by gas chromatography (GC, Agilent 6890). For this, 100 µL gas samples were continuously taken and analyzed using a flame ionization detector (Wilmington, DE, USA) (FID, HP-INNOWax polyethylene glycol column) for methanol and methane, and 150 µL gas samples were analyzed using a thermal conductivity detector (Wilmington, DE, USA) (TCD, HP-PLOT Q) for methane, O2 and CO2.
4. Conclusions
The photocatalytic reduction of CO2 using two BiOCl catalysts was studied, with the synthesized BTEG yielding the highest photocatalytic activity. The use of TEG during the synthesis of the photocatalyst led to 3D structures with 11 times higher surface area and eight times smaller crystallites than the commercial BiOCl (P2600). The identified photoreduction products from CO2 were CH4, CH3OH and C2H5OH, while CO was not detected. In the case of BTEG, the products were C2H5OH, CH4, and CH3OH, in similar concentrations. Meanwhile, the P2600 produced CH4 almost exclusively. Such selectivity is related to the facet type; P2600 had a much higher fraction of {001} facets while the BTEG had a higher fraction of {110}. The location of oxygen vacancies in BiOCl has an important role since they promote the interaction between the photocatalyst and CO2, producing higher contact and thus higher photoconversion. In our experiments, we also detected O2 in the beginning of the reaction, which could have been related to the splitting of H2O on the catalysts or introduced.
Author Contributions
D.S.-R. Experimental work, characterization, writing, analysis and discussion. A.B.J.-S. Writing, analysis and discussion. T.L.C. Ideation, writing, analysis and discussion. N.H. Ideation, writing, analysis and discussion. A.A. Characterization, analysis and discussion. V.A.E.-B. Ideation, writing, analysis and discussion. All authors have read and agreed to the published version of the manuscript.
Funding
This research was partly funded by the Swedish Research Council grant number 2016-03568.
Acknowledgments
The publication of this article was funded by Stockholm University centrally. This work is part of a doctoral thesis with the CONACYT scholarship number of 29671. DRS thanks to CONACYT for the scholarship “Beca Mixta” for the research stay at Stockholm University. ABJS thanks the “Cátedras” CONACYT program Project 790. We thank Beatriz Rivera and Ana Iris Peña at the LINAN (IPICYT), and Coral Edith Mirón Enriquez (at the UMAR University) for support in the photocatalytic tests.
Conflicts of Interest
The authors declare no conflict of interest.
References
- IPCC. Summary for Policymakers. In Global Warming of 1.5 °C; An IPCC Special Report on the Impacts of Global Warming of 1.5 °C Above Pre-Industrial Levels and Related Global Greenhouse Gas Emission Pathways, in the Context of Strengthening the Global; 2018; Available online: https://www.ipcc.ch/sr15/ (accessed on 13 March 2019).
- Von der Assen, N.; Voll, P.; Peters, M.; Bardow, A. Life Cycle Assessment of CO2 Capture and Utilization: A Tutorial Review. Chem. Soc. Rev. 2014, 43, 7982–7994. [Google Scholar] [CrossRef] [PubMed]
- Li, X.; Wen, J.; Low, J.; Fang, Y.; Yu, J. Design and Fabrication of Semiconductor Photocatalyst for Photocatalytic Reduction of CO2 to Solar Fuel. Sci. China Mater. 2014, 57, 70–100. [Google Scholar] [CrossRef]
- Nguyen, V.H.; Wu, J.C.S. Recent Developments in the Design of Photoreactors for Solar Energy Conversion from Water Splitting and CO2 Reduction. Appl. Catal. A Gen. 2018, 550, 122–141. [Google Scholar] [CrossRef]
- Yuan, L.; Xu, Y.J. Photocatalytic Conversion of CO2 into Value-Added and Renewable Fuels. Appl. Surf. Sci. 2015, 342, 154–167. [Google Scholar] [CrossRef]
- Wang, W.N.; Soulis, J.; Jeffrey Yang, Y.; Biswas, P. Comparison of CO2 Photoreduction Systems: A Review. Aerosol Air Qual. Res. 2014, 14, 533–549. [Google Scholar] [CrossRef]
- Kumar, B.; Brian, J.P.; Atla, V.; Kumari, S.; Bertram, K.A.; White, R.T.; Spurgeon, J.M. New Trends in the Development of Heterogeneous Catalysts for Electrochemical CO2 Reduction. Catal. Today 2016, 270, 19–30. [Google Scholar] [CrossRef]
- Habisreutinger, S.N.; Schmidt-Mende, L.; Stolarczyk, J.K. Photocatalytic Reduction of CO2 on TiO2 and Other Semiconductors. Angew. Chem. Int. Ed. 2013, 52, 7372–7408. [Google Scholar] [CrossRef]
- Kaneco, S.; Shimizu, Y.; Ohta, K.; Mizuno, T. Photocatalytic Reduction of High Pressure Carbon Dioxide Using TiO2 Powders with a Positive Hole Scavenger. J. Photochem. Photobiol. A Chem. 1998, 115, 223–226. [Google Scholar] [CrossRef]
- Liu, G.; Hoivik, N.; Wang, K.; Jakobsen, H. Engineering TiO2 Nanomaterials for CO2 Conversion/Solar Fuels. Sol. Energy Mater. Sol. Cells 2012, 105, 53–68. [Google Scholar] [CrossRef]
- Lo, C.C.; Hung, C.H.; Yuan, C.S.; Wu, J.F. Photoreduction of Carbon Dioxide with H2 and H2O over TiO2 and ZrO2 in a Circulated Photocatalytic Reactor. Sol. Energy Mater. Sol. Cells 2007, 91, 1765–1774. [Google Scholar] [CrossRef]
- Varghese, O.K.; Paulose, M.; LaTempa, T.J.; Grimes, C.A. High-Rate Solar Photocatalytic Conversion of CO2 and Water Vapor to Hydrocarbon Fuels. Nano Lett. 2009, 9, 731–737. [Google Scholar] [CrossRef] [PubMed]
- Mahmodi, G.; Sharifnia, S.; Rahimpour, F.; Hosseini, S.N. Photocatalytic Conversion of CO2 and CH4 Using ZnO Coated Mesh: Effect of Operational Parameters and Optimization. Sol. Energy Mater. Sol. Cells 2013, 111, 31–40. [Google Scholar] [CrossRef]
- Mao, J.; Peng, T.; Zhang, X.; Li, K.; Zan, L. Selective Methanol Production from Photocatalytic Reduction of CO2 on BiVO4 under Visible Light Irradiation. Catal. Commun. 2012, 28, 38–41. [Google Scholar] [CrossRef]
- Liu, Y.; Huang, B.; Dai, Y.; Zhang, X.; Qin, X.; Jiang, M.; Whangbo, M.H. Selective Ethanol Formation from Photocatalytic Reduction of Carbon Dioxide in Water with BiVO4 Photocatalyst. Catal. Commun. 2009, 11, 210–213. [Google Scholar] [CrossRef]
- Ye, L.; Jin, X.; Ji, X.; Liu, C.; Su, Y.; Xie, H.; Liu, C. Facet-Dependent Photocatalytic Reduction of CO2 on BiOI Nanosheets. Chem. Eng. J. 2016, 291, 39–46. [Google Scholar] [CrossRef]
- Ye, L.; Wang, H.; Jin, X.; Su, Y.; Wang, D.; Xie, H.; Liu, X.; Liu, X. Synthesis of Olive-Green Few-Layered BiOI for Efficient Photoreduction of CO2 into Solar Fuels under Visible/near-Infrared Light. Sol. Energy Mater. Sol. Cells 2016, 144, 732–739. [Google Scholar] [CrossRef]
- Zhang, G.; Su, A.; Qu, J.; Xu, Y. Synthesis of BiOI Flowerlike Hierarchical Structures toward Photocatalytic Reduction of CO2 to CH4. Mater. Res. Bull. 2014, 55, 43–47. [Google Scholar] [CrossRef]
- Jin, J.; Wang, Y.; He, T. Preparation of Thickness-Tunable BiOCl Nanosheets with High Photocatalytic Activity for Photoreduction of CO2. RSC Adv. 2015, 5, 100244–100250. [Google Scholar] [CrossRef]
- Zhang, L.; Wang, W.; Jiang, D.; Gao, E.; Sun, S. Photoreduction of CO2 on BiOCl Nanoplates with the Assistance of Photoinduced Oxygen Vacancies. Nano Res. 2015, 8, 821–831. [Google Scholar] [CrossRef]
- Zhang, K.L.; Liu, C.M.; Huang, F.Q.; Zheng, C.; Wang, W.D. Study of the Electronic Structure and Photocatalytic Activity of the BiOCl Photocatalyst. Appl. Catal. B Environ. 2006, 68, 125–129. [Google Scholar] [CrossRef]
- Myung, Y.; Wu, F.; Banerjee, S.; Park, J.; Banerjee, P. Electrical Conductivity of P-Type BiOCl Nanosheets. Chem. Commun. 2015, 51, 2629–2632. [Google Scholar] [CrossRef] [PubMed]
- Ye, L.; Su, Y.; Jin, X.; Xie, H.; Zhang, C. Recent Advances in BiOX (X = Cl, Br and I) Photocatalysts: Synthesis, Modification, Facet Effects and Mechanisms. Environ. Sci. Nano 2014, 1, 90–112. [Google Scholar] [CrossRef]
- Cheng, H.; Huang, B.; Dai, Y. Engineering BiOX (X = Cl, Br, I) Nanostructures for Highly Efficient Photocatalytic Applications. Nanoscale 2014, 6, 2009–2026. [Google Scholar] [CrossRef] [PubMed]
- Wang, Q.; Hui, J.; Huang, Y.; Ding, Y.; Cai, Y.; Yin, S.; Li, Z.; Su, B. The Preparation of BiOCl Photocatalyst and Its Performance of Photodegradation on Dyes. Mater. Sci. Semicond. Process. 2014, 17, 87–93. [Google Scholar] [CrossRef]
- Cui, Z.; Mi, L.; Zeng, D. Oriented Attachment Growth of BiOCl Nanosheets with Exposed {110} Facets and Photocatalytic Activity of the Hierarchical Nanostructures. J. Alloys Compd. 2013, 549, 70–76. [Google Scholar] [CrossRef]
- Zhao, K.; Zhang, L.; Wang, J.; Li, Q.; He, W.; Yin, J.J. Surface Structure-Dependent Molecular Oxygen Activation of BiOCl Single-Crystalline Nanosheets. J. Am. Chem. Soc. 2013, 135, 15750–15753. [Google Scholar] [CrossRef]
- Jiang, J.; Zhao, K.; Xiao, X.; Zhang, L. Synthesis and Facet-Dependent Photoreactivity of BiOCl Single-Crystalline Nanosheets. J. Am. Chem. Soc. 2012, 134, 4473–4476. [Google Scholar] [CrossRef]
- Yang, Y.; Zhang, C.; Lai, C.; Zeng, G.; Huang, D.; Cheng, M.; Wang, J.; Chen, F.; Zhou, C.; Xiong, W. BiOX (X = Cl, Br, I) Photocatalytic Nanomaterials: Applications for Fuels and Environmental Management. Adv. Colloid Interface Sci. 2018, 254, 76–93. [Google Scholar] [CrossRef]
- Zhang, L.; Wang, W.; Sun, S.; Jiang, D.; Gao, E. Selective Transport of Electron and Hole among {001} and {110} Facets of BiOCl for Pure Water Splitting. Appl. Catal. B Environ. 2015, 162, 470–474. [Google Scholar] [CrossRef]
- Wang, X.; Liu, X.; Liu, G.; Zhang, C.; Liu, G.; Xu, S.; Cui, P.; Li, D. Rapid Synthesis of BiOCl Graded Microspheres with Highly Exposed (110) Facets and Oxygen Vacancies at Room Temperature to Enhance Visible Light Photocatalytic Activity. Catal. Commun. 2019, 130, 105769. [Google Scholar] [CrossRef]
- Zhu, L.-P.; Liao, G.-H.; Bing, N.-C.; Wang, L.-L.; Yang, Y.; Xie, H.-Y. Self-Assembled 3D BiOCl Hierarchitectures: Tunable Synthesis and Characterization. Crystengcomm 2010, 12, 3791–3796. [Google Scholar] [CrossRef]
- Li, J.; Zhu, Y.; Yan, Y.; Xi, B.; Tang, K.; Qian, Y. Solvothermal Synthesis of 3D BiOCl Microstructures and Their Electrochemical Hydrogen Storage Behavior. J. Nanosci. Nanotechnol. 2012, 12. [Google Scholar] [CrossRef] [PubMed]
- Cheng, G.; Xiong, J.; Stadler, F.J. Facile Template-Free and Fast Refluxing Synthesis of 3D Desert rose-like BiOCl Nanoarchitectures with Superior Photocatalytic Activity. New J. Chem. 2013, 37, 3207–3213. [Google Scholar] [CrossRef]
- Xiong, J.; Cheng, G.; Qin, F.; Wang, R.; Sun, H.; Chen, R. Tunable BiOCl Hierarchical Nanostructures for High-Efficient Photocatalysis under Visible Light Irradiation. Chem. Eng. J. 2013, 220, 228–236. [Google Scholar] [CrossRef]
- Xie, T.; Xu, L.; Liu, C.; Yang, J.; Wang, M. Magnetic Composite BiOCl–SrFe12O19: A Novel p–n Type Heterojunction with Enhanced Photocatalytic Activity. Dalt. Trans. 2014, 43, 2211–2220. [Google Scholar] [CrossRef]
- Sánchez-Rodríguez, D.; Méndez Medrano, M.G.; Remita, H.; Escobar-Barrios, V. Photocatalytic Properties of BiOCl-TiO2 Composites for Phenol Photodegradation. J. Environ. Chem. Eng. 2018, 6, 1601–1612. [Google Scholar] [CrossRef]
- Xie, J.; Cao, Y.; Jia, D.; Qin, H.; Liang, Z. Room temperature Solid-State Synthesis of BiOCl Hierarchical Microspheres with Nanoplates. Catal. Commun. 2015, 69, 34–38. [Google Scholar] [CrossRef]
- Lei, Y.; Wang, G.; Song, S.; Fan, W.; Zhang, H. Synthesis, Characterization and Assembly of BiOCl Nanostructure and Their Photocatalytic Properties. CrystEngComm 2009, 11, 1857–1862. [Google Scholar] [CrossRef]
- Hao, H.Y.; Xu, Y.Y.; Liu, P.; Zhang, G.Y. BiOCl Nanostructures with Different Morphologies: Tunable Synthesis and Visible-Light-Driven Photocatalytic Properties. Chin. Chem. Lett. 2015, 26, 133–136. [Google Scholar] [CrossRef]
- Liqiang, J.; Yichun, Q.; Baiqi, W.; Shudan, L.; Baojiang, J.; Libin, Y.; Wei, F.; Honggang, F.; Jiazhong, S. Review of Photoluminescence Performance of Nano-Sized Semiconductor Materials and Its Relationships with Photocatalytic Activity. Sol. Energy Mater. Sol. Cells 2006, 90, 1773–1787. [Google Scholar] [CrossRef]
- Ye, L.; Zan, L.; Tian, L.; Peng, T.; Zhang, J. The {001} Facets-Dependent High Photoactivity of BiOCl Nanosheets. Chem. Commun. 2011, 47, 6951–6953. [Google Scholar] [CrossRef] [PubMed]
- Ye, L.; Jin, X.; Liu, C.; Ding, C.; Xie, H.; Chu, K.H.; Wong, P.K. Thickness-Ultrathin and Bismuth-Rich Strategies for BiOBr to Enhance Photoreduction of CO2 into Solar Fuels. Appl. Catal. B Environ. 2016, 187, 281–290. [Google Scholar] [CrossRef]
- Pellegrino, F.; Sordello, F.; Mino, L.; Hodoroaba, V.; Martra, G.; Maurino, V. Formic Acid Photoreforming for Hydrogen Production on Shape-Controlled Anatase TiO2 Nanoparticles: Assessment of the Role of Fluorides, {101}/{001} Surfaces Ratio, and Platinization. ACS Catal. 2019, 9, 6692–6697. [Google Scholar] [CrossRef]
- Tseng, I.H.C.W.W.J. Photoreduction of CO2 Using Sol-Gel Derived Titania and Titania-Supported Copper Catalysts. Appl. Catal. B Environ. 2002, 37, 37–48. [Google Scholar] [CrossRef]
- Lee, W.; Liao, C.; Tsai, M.; Huang, C.; Wu, J.C.S. A Novel Twin Reactor for CO2 Photoreduction to Mimic Artificial Photosynthesis. Appl. Catal. B Environ. 2013, 132, 445–451. [Google Scholar] [CrossRef]
- Hwang, Y.J.; Yang, S.; Lee, H. Surface analysis of N-doped TiO2 nanorods and their enhanced photocatalytic oxidation activity. Appl. Catal. B Environ. 2017, 204, 209–215. [Google Scholar] [CrossRef]
- Li, D.; Song, H.; Meng, X.; Shen, T.; Sun, J.; Han, W.; Wang, X. Effects of Particle Size on the Structure and Photocatalytic Performance by Alkali-Treated TiO2. Nanomaterials 2020, 10, 546. [Google Scholar] [CrossRef]
- Koci, K.; Obalova, L.; Matejova, L.; Placha, D.; Lacny, Z.; Jirkovsky, J.; Solcova, O. Effect of TiO2 particle size on the photocatalytic reduction of CO2. Appl. Catal. B Environ. 2009, 89, 494–502. [Google Scholar] [CrossRef]
- Yu, J.; Low, J.; Xiao, W.; Zhou, P.; Jaroniec, M. Enhanced Photocatalytic CO2-Reduction activity of Anatase TiO2 by Coexposed {001} ad {101} Facets. J. Am. Chem. Soc. 2014, 136, 8839–8842. [Google Scholar] [CrossRef]
- Karamian, E.; Sharifnia, S. On the General Mechanism of Photocatalytic Reduction of CO2. J. CO2 Util. 2016, 16, 194–203. [Google Scholar] [CrossRef]
- Wang, T.; Meng, X.; Liu, G.; Chang, K.; Li, P.; Kang, Q.; Liu, L.; Li, M.; Ouyang, S.; Ye, J. In situ synthesis of ordered mesoporous Co-doped TiO2 and its enhanced photocatalytic activity and selectivity for the reduction of CO2. J. Mat. Chem. A 2015, 3, 9491–9501. [Google Scholar] [CrossRef]
- Zhang, Z.; Huang, Z.; Cheng, X.; Wang, Q.; Chen, Y.; Dong, P.; Zhang, X. Product selectivity of visible-light photocatalytic reduction of carbon dioxide using titanium dioxide doped by different nitrogen-sources. Appl. Surf. Sci. 2015, 355, 45–51. [Google Scholar] [CrossRef]
- Wang, W.; An, W.; Ramalingam, B.; Mukherjee, S.; Niedzwiedzki, D.M.; Gangopadhyay, S.; Biswas, P. Size and structure matter: Enhanced CO2 efficiency by size-resolved ultrafine Pt nanoparticles on TiO2 single crystals. J. Am. Chem. Soc. 2012, 134, 11276–11281. [Google Scholar] [CrossRef] [PubMed]
- Tu, W.; Zhou, Y.; Li, H.; Li, P.; Zou, Z. Au@TiO2 yolk-shell hollow spheres for plasmon-induced photocatalytic reduction of CO2 to solar fuel via a local electromagnetic field. Nanoscale 2015, 7, 14232–14236. [Google Scholar] [CrossRef] [PubMed]
© 2020 by the authors. Licensee MDPI, Basel, Switzerland. This article is an open access article distributed under the terms and conditions of the Creative Commons Attribution (CC BY) license (http://creativecommons.org/licenses/by/4.0/).