Article

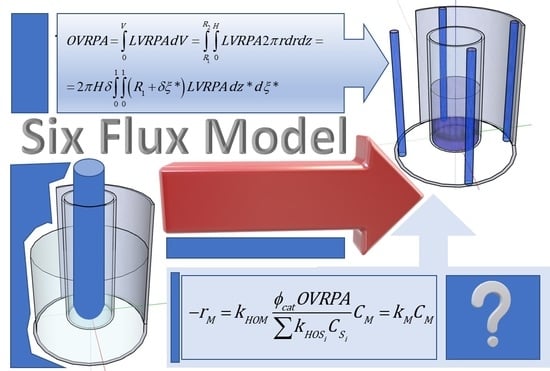
Six Flux Model for the Central Lamp Reactor Applied to an External Four-Lamp Reactor

by
Fernando J. Beltrán
*,
Javier Rivas
and
Juan-Fernando Garcia-Araya
Departamento de Ingeniería Química y Química Física, Instituto Universitario de Investigación del Agua, Cambio Climático y Sostenibilidad (IACYS), Universidad de Extremadura, 06006 Badajoz, Spain
*
Author to whom correspondence should be addressed.
Catalysts 2021, 11(10), 1190; https://doi.org/10.3390/catal11101190 (registering DOI)
Submission received: 15 September 2021 / Revised: 28 September 2021 / Accepted: 28 September 2021 / Published: 29 September 2021
(This article belongs to the Special Issue Photocatalytic Oxidation/Ozonation Processes)

Abstract

:
One of the difficulties of establishing the intrinsic kinetics of photocatalytic oxidation processes is due to the complex mathematical formula used to determine the rate of photon absorption. To solve this problem, some models have been proposed and checked, such as the Six Flux Model (SFM) confirmed in central lamp photoreactors. External lamp photoreactors are also one of the most used configurations to study the photocatalytic oxidation of contaminants in water, and complex mathematical solutions have been reported to solve the rate of photon absorption. In this work, SFM Equations already reported for the central lamp photoreactor have been adapted to determine the rate of photon absorption in an external four-lamp photoreactor. The results obtained show slight differences from those of the Monte Carlo method. Additionally, once the rate of photon absorption was validated, the intrinsic rate constant and scavenging factor of the photocatalytic oxidation of some contaminant compounds from results already published have been determined.

Graphical Abstract

1. Introduction

It is well known that Advanced Oxidation Processes (AOPs), are the only technologies capable of destroying water contaminants at ambient conditions due to the high oxidizing power of hydroxyl radicals generated in these processes [1,2]. Photocatalytic oxidation (PCO) of water contaminants with ozonation and Fenton oxidation are some of the advanced oxidation processes that have attracted a lot of research interest in the last two decades [3,4,5,6,7]. In this century, literature shows more than 6700 papers on this subject; a figure similar to that of ozonation or Fenton processes, with about 7100 and 5500 papers, respectively, according to the Scope database. PCO consists of the irradiation of semiconductor material to produce positive (holes) and negative (electrons) charges when the energy of radiation at least equals the band gap energy of the semiconductor [8]. Strong oxidant holes and reducing electrons then migrate from the valence and conduction bands, respectively, to the surface of the catalyst to directly, in the case of holes, or indirectly, through species formed from them (hydroxyl, superoxide radicals, etc.), react with the organics present in water [9]. It is evident that absorption of energy is the key step of PCO. The knowledge of the rate of photon absorption is fundamental to establishing the contaminant oxidation rate. The main variables affecting the photon absorption rate concern the geometry of the reacting system (photoreactor), the intensity of radiation and the optical properties of the catalyst, among others [10,11]. When solving the photocatalytic oxidation rate of any contaminant, the radiation transfer equation and the mass balance of the target compound and, in some cases, fluidodynamic aspects are needed, with the former as the most difficult step to be solved [12]. Literature has already reported complicated mathematical models to solve the radiation transfer equation or algorithms based on Monte Carlo methods that cannot be easily applied to any geometry of a given photoreactor [13,14,15]. This is because these methods and models have to consider the possibilities that one photon can be absorbed, transmitted or dispersed when it reaches a catalyst particle in the reacting medium. More recently, methods based on the probability that one photon can be dispersed after its collision with the catalyst particle by following different directions have also been proposed [16,17]. Among these models, the so-called Six Flux Model (SFM), which is based on the six cartesian directions that the photon can follow after any collision, has been checked and confirmed in a cylindrical photoreactor with a central located UV lamp (central lamp photoreactor). This configuration is likely the preferred option to study the PCO of water contaminants [18,19]. In this photochemical reactor, radiation coming from the central axis, where the lamp is placed, radially travels to reach the reaction media limited between two cylinders. SFM perfectly calculates the local volumetric photon absorption rate (LVRPA) as a function of the axial and radial coordinates. Next, considering the knowledge of the optical catalyst properties, reactor dimensions and the probability function that any photon has to follow the six cartesian directions after colliding with a catalyst particle, the overall absorption rate of photon absorption (OVRPA) of the catalyst can also be calculated. In addition to central lamp photoreactors, external n-lamp photoreactors have also been used in PCO, and their OVRPA was solved by means of Monte Carlo methods [20,21,22].
Given the similar geometry and radial transport of radiation of the external lamp and central lamp photoreactors, an attempt to apply the SFM equations established for the latter to the former constitutes the first objective of this work. Additionally, a second objective was to determine the rate constant of the reaction of some organics in PCO once the OVRPA has been determined, that is, the intrinsic kinetics of PCO.

2. Results and Discussion

Figure 1 and Figure 2 show the typical schemes of the central lamp and four external lamps photoreactors with their corresponding axial and radial dimension variables, among others.
For the central lamp photoreactor, the SFM yields Equation (1) to determine the local volumetric rate of photon absorption [1]:
LVRPA = Kf ( z * ) f ( ξ * )
with K, f(z*) and f(ξ*) defined as follows:
K = r L I W τ ( 1 ω ) 2 δ ω cor f ( ω , τ )
where rL is the lamp radius, IW the incident radiation at the internal wall of the photoreactor or at the radius (R1) of the well where the lamp is immersed, δ the length path of radiation reaction space or R2 − R1, τ, the optical density of the catalyst, ωcor, the corrected albedo and f(ω,τ) a function of the scattering albedo (ω) and optical density of the catalyst (see definitions in the Supplementary section),
f ( z * ) = arctan ( β 2 ( 2 α z * α + 1 ) ) arctan ( β 2 ( 2 α z * α 1 ) )
where α and β are dimensionless geometrical parameters:
α = H L
β = L R 1
L and H being the length of the lamp and height of the water in the reactor, respectively, and the dimensionless radial, ξ*, and axial, z*, coordinates are defined as follows:
ξ * = r R 1 δ
z * = z H
where r − R1 and z are the dimension radial and axial coordinates, respectively (see Figure 1),
f ( ξ * ) = exp ( τ ap ξ * ) R 1 + δ ξ *
where τap is the apparent optical density of the catalyst. Note that ξ*, the dimensionless radial variable, only just covers the length of the reaction space between R1 and R2, that is, δ.
In order to validate SFM Equation (1) for the external four-lamp photoreactor, two assumptions have been considered:
1. Dimension variables of the central lamp photoreactor are substituted by the corresponding variables of the same symbol or name of the external lamp photoreactor so that Figure 2 becomes Figure 1. For instance, the radius of the internal wall of the assumed photoreactor was R1, that is, the distance between the lamp and the wall of the actual external lamp photoreactor.
2. The radius of the lamp considered in Equation (1) was the diameter of the radius of any lamp of the external lamp photoreactor since it is assumed that only one lamp situated in the central axis of the photoreactor substitutes, as a radiation source, the four lamps of the actual photoreactor.

2.1. LVRPA and OVRPA

To confirm the validity of the SFM model, the external four-lamp photoreactor of reference [21] with corresponding dimensions (see Table S1 and Figure 1) was considered. In reference [21], the photocatalytic oxidation of dichloroacetic acid (DCA) with a catalyst suspension of P25 TiO2 was studied. In the work, the authors determined the LVRPA and OVRPA by applying the Monte Carlo method, which apparently led to what can be assumed was the exact solution. In the present work, parameter values of SFM related to the optical properties of the catalyst (P25 TiO2) have also been taken from the literature and are shown in Table S1.
As an example, LVRPA at the central lamp position (z* = 0.5) as a function of the dimensionless radial variable within the reaction space ξ* and for different catalyst concentrations has been calculated using Equations (1) to (8). Figure 3 shows, as an example, how LVRPA changes with ξ* for concentrations between 10−3 and 5 × 10⁻² gL−1 (see Figure S1 in the Supplementary information for results at other catalyst concentrations). These results show a high similarity to those previously reported [21]. As can be seen from Figure 3, for a given value of ξ* close to the reactor wall (0 < ξ* < 0.1), the higher the catalyst concentration, the higher the LVRPA. However, at higher ξ* values, the opposite situation is observed, though in these cases, LVRPA presents extremely low values or even negligible. This is the result of the increasing scattering radiation as the concentration of catalyst increases. At high catalyst concentrations, the absorption of photons is high as far as they collide with external catalyst particles situated close to the photoreactor’s wall, where radiation arrives. Nevertheless, at higher ξ* values, a low amount of photons reached this reaction media location. As a consequence, absorption rates’ negligibility significantly diminished, especially for high catalyst concentration (see Figure S1).
The next step was the determination of OVRPA from the integration of LVRPA into the reaction volume as follows:
OVRPA = 0 V LVRPA   dV = R 1 R 2 0 H LVRPA   2 π rdrdz = 2 π H δ 0 1 0 1 ( R 1 + δ ξ * ) LVRPA     dz * d ξ *
Figure 4 shows the values of OVRPA deduced for different catalyst concentrations.
As can be seen from Figure 4, the increase in the catalyst concentration up to about 0.05 gL−1 leads to another corresponding increase in the OVRPA. Catalyst concentrations above this value resulted in a constant value of the OVRPA. This is an expected trend due to the increasing radiation dispersion that the catalyst provokes when its concentration is high. In Figure 5, a comparison of the results obtained with SFM in this work and the Monte Carlo method of Rivas et al. [21] in terms of percentage of absorbed radiation at different catalyst concentrations is shown. As observed from Figure 5, the application of SFM corresponding to the internal lamp photoreactor predicts with deviations lower than 10% the results from the Monte Carlo method for concentrations higher than 0.05 gL−1 of catalyst, while it overestimates the results from the Monte Carlo method at low concentrations. In any case, research commonly works on photocatalytic oxidation are carried out above the limit of catalyst concentration, that is, at concentrations leading to the highest photon absorption rate. In this sense, the application of SFM to the external lamp reactor as if it would behave as a central lamp photoreactor can be a good option to know the overall volumetric rate of photon absorption.

2.2. Kinetics of Photocatalytic Oxidation of Some Organic Contaminants

The photocatalytic oxidation rate of contaminants in water usually follows Langmuir kinetics [23,24], which, in many cases, reduces to first-order kinetics when the product of the equilibrium adsorption constant and the concentration of the contaminant is significantly lower than 1. This is the normal scenario in real cases of water treatment where the concentration of the contaminant is low [25]:
r M = k M C M 1 + K M C M k M C M   if   K M C M < < 1
This first-order kinetics, however, can also be confirmed by considering that hydroxyl radical oxidation is the main way to remove contaminants when photocatalytic oxidation is applied. This way of reaction can be produced if hydroxyl radicals are formed from the positive holes in the valence band of the semiconductor:
h + + H 2 O ads ( or   OH ads ) HO
and even from successive steps starting with the formation of superoxide ion radicals in the conduction band of the semiconductor:
e + O 2 O 2 H 2 O 2 HO
Both ways of reaction have been extensively reported in photocatalytic oxidation works [26]. With this assumption and provided that a contaminant M does not directly photodecompose, its photocatalytic oxidation rate would be:
r M = k HOM C HO C M
where kHOM is the rate constant of the reaction between hydroxyl radicals and M; and the concentration of these free radicals, CHO, is the ratio between their initiation rate, rin, and the sum of the products between the concentration of any hydroxyl radical scavenger substance, CSi, and the corresponding rate constant of its reaction with hydroxyl radicals, kHOSi. This term is usually called the scavenging factor, SF [27]:
C HO = r in k HOS i C S i
In Equation (14), the initiation rate of radicals is the product between the catalyst quantum yield, ϕcat, and OVRPA, so that Equation (13) becomes Equation (15), that is, first-order kinetics as in Equation (10):
r M = k HOM ϕ cat OVRPA k HOS i C S i C M = k M C M
It should be noted that the SF can change with reaction time because of the changing nature of byproducts formed over time that are usually of increasing hydroxyl radical scavenging character [28].

Determination of the Intrinsic Rate Constant of Photocatalytic Oxidation

According to Equation (15), the ratio between the rate constant kHOM and SF, that is, the intrinsic rate constant of photocatalytic oxidation, can be obtained from kM once the quantum yield of the catalyst and the OVRPA are known:
k HOM k HOS i C S i = k M ϕ cat OVRPA
Notice that this intrinsic rate constant depends on the nature of the aqueous medium since scavenger concentrations affect the oxidation rate of a given contaminant M. In this work, the intrinsic rate constant of a series of contaminants has been determined in ultrapure water. Data on the photocatalytic oxidation of these compounds have been taken from previous works by this research group [20,21,22]. Table 1 shows the lists of compounds, their kHOM values and the works where the results are published.
In these quoted works, an increase of 4 °C in one hour was observed in the reaction medium due to the radiation applied. At first, this can affect the process kinetics. However, in photocatalytic oxidation, the rate constant kM in Equation (10) depends on the catalyst quantum yield, radiation intensity applied and rate constants of reactions involving free radical and charged species, such as electrons and holes (see Equations (11) and (12)). These parameters, in fact, hardly have a significant influence on photocatalytic kinetics. For instance, Chen et al. [33] carried out photocatalytic runs for the removal of methylene blue, MB, in the 20 to 70 °C temperature interval with minimal differences in MB conversion with time. Accordingly, the temperature effect was neglected in the kinetic study of this work.
Additionally, literature reports negligible adsorption on TiO2 of Dichloroacetic acid (DCA), Metoprolol (MTP), Ketorolac (KTR) and Diclofenac (DCF) [12,22]. Then, for these compounds, the simplification of Langmuir kinetics to a pseudo-first-order one can be conducted. With respect to 2-methyl-4-chlorophenoxyacetic acid (MCPA), Zertal et al. [34] reported less than 20% adsorption on TiO2, and taking into account the number of vacant sites of the catalyst [35], a value of the adsorption equilibrium constant KM = 6303.3 M−1 is found, as shown in the Supplementary section. Then, the product KMCM at the start of oxidation (see Equation (10)) is 1.57, which is higher than 1. Therefore, Langmuir kinetics cannot be reduced to simple pseudo-first-order kinetics. However, the relationship between kM and parameters of Equation (15) still hold, that is:
k M = k HOM ϕ cat OVRPA k HOS i C S i
In Equation (17), the quantum yield of the catalyst, P25 TiO2, (ϕCat) for the concentrations used in the quoted works [20,21,22], between 0.15 and 0.5 gL−1, and the radiation source emitting between 350 and 410 nm were taken as 3.7 × 10⁻³ molEinstein−1 from Tolosana-Moranchel et al. [36]. Incident radiation at the reactor wall (r = R1) was 1.19 × 10⁻⁵, 1.15 × 10⁻⁶ and 8.33 × 10⁻⁷ EinsteinL−1s−1 for the works from [20,21,22], respectively.
From the above conclusions, the kinetics of the photocatalytic oxidation of compounds in Table 1 follows the Langmuir model for MCPA and pseudo-first-order for the rest of the compounds. In any case, the external four-lamp photoreactors of quoted references worked as semicontinuous (oxygen was continuously provided) perfectly mixed tanks, so that the mass balance of any compound in these reactors during photocatalytic oxidation is given by Equation (18):
dC M dt = r M
  • Case of first-order kinetics
Solving differential Equation (18) with rM = −kMCM yields the concentration profile of M with time:
C M = C M 0 exp ( k M t )
Equation (19) for the photoxidation of the compounds shown in Table 1, which follow first-order kinetics, was confirmed in all cases though it depended on the reaction time (see Figure 6 for the case of DCA at different concentrations as an example).
This means that the higher the initial concentration of contaminant, the higher the reaction time where first-order kinetics applies. For instance, for the case of pharmaceuticals MTP, DCF and KTR, the results from [22] for 20 and 0.05 mgL−1 initial concentrations show that the first-order kinetics hold during the first 60 and 15 min, respectively. (In the Supplementary section, the confirmation of Equation (18) for MTP, DCF and KTR is also shown in Figure S2.) However, as pointed out before, at higher reaction times, it is likely that first order kinetics still hold but with lower rate constant values due to the increase in SF [28]. In this work, only concentration-time data corresponding to this first period of reaction was considered to determine the intrinsic rate constant.
  • Case of Langmuir kinetics
For the case of MCPA, following Langmuir kinetics, the mass balance of Equation (20) applies:
dC M dt = r M = k M C M 1 + K M C M
The separation of variables and integration leads to:
ln ( C M C M 0 ) + K M ( C M C M 0 ) = Y = k M t
Figure 7 confirms Equation (21) for photocatalytic oxidation of MCPA, where the slope of the straight line after least squares fitting, as in Figure 6, also corresponds to −kM. It should be highlighted that values of kM for MCPA photocatalytic oxidation following both the Langmuir model and first-order kinetics are nearly coincident (0.1116 and 0.104 min−1, respectively). In the Supplementary section, the confirmation of Equation (19) of first-order kinetics for the case of MCPA is also presented. Accordingly, for MCPA, in spite of the non-negligible contribution of adsorption, first-order kinetics could be assumed as well.
The values of kM and the duration of this first initial period (for DCA, MTP, DCF and KTR) where they hold together to the one of MCPA photocatalytic oxidation are given in Table 2. From Table 2, it can be seen that for a given compound, the higher its concentration in water, the lower the intrinsic rate constant and the higher the SF. This is observed in the results of DCA and pharmaceuticals, and it is due to the lesser byproducts formed when the initial concentration was lower.
The complexity of the molecular structure of the compound also has a positive effect on SF as a result of the higher number of intermediates that can be formed from a compound of a more complex structure. This can be seen by comparing the results of DCA and pharmaceuticals at a 20 ppm initial concentration, though the difference in SF is low, 1.04 × 10⁵ against 1.15 × 10⁵ (mean value) s−1, respectively. However, another variable that affects SF is the absorbed radiation, which was 3.24 × 10⁻⁶ and 2.27 × 10⁻⁷ EinsteinL−1s−1 for DCA and pharmaceutical photooxidation, respectively. These values are the reason for the low SF differences in spite of the more complex structure of pharmaceuticals compared to DCA. Additionally, it can be observed that SF values obtained from the simultaneous photooxidation of the three pharmaceutical compounds were similar regardless of their initial concentration. This is an expected result since, in these cases, the formed scavengers belong to the same experiment because the pharmaceuticals were simultaneously treated.

3. Materials and Methods

The materials, methods and experimental set-up are reported in previous works in detail [20,21,22]. Briefly, the experimental set-up was an external four-lamp reactor that consisted of a 1 L borosilicate glass tank provided with magnetic agitation and inlets for oxygen feed and sampling and outlet for gas exiting. The tank was immersed in a pipe box that also contained four black light lamps that emitted radiation between 350 and 410 nm. The lamps were evenly distributed and attached to the pipe.

4. Conclusions

The main conclusions of this work are:
* The Six Flux Model applied to a central lamp reactor predicts the results of the OVRPA for an external four-lamp photoreactor with deviations lower than 10% with catalyst concentration leading to the highest photon absorption rate. This confirms the results from Monte Carlo methods already published. For low catalyst concentrations, SFM overestimates OVRPA values comparing to those from the Monte Carlo method.
* As expected, the predicted LVRPA values show a radial variation for a given value of the axial dimensionless variable being high at the reactor external wall and practically negligible in the central zone of the photoreactor.
* The OVRPA results confirm the positive effect of catalyst concentration. Thus, for low values of catalyst concentration (<0.1 gL1), the increase in this variable leads to an increase in OVRPA, while at a higher catalyst concentration, OVRPA goes to a plateau value as a consequence of the higher dispersion or scattering due to the increasing presence of catalyst particles.
* Simplified kinetics allow the determination of the intrinsic reaction rate constant and scavenging factor of hydroxyl radicals. These rate constants increase with the decreasing initial concentration of compounds.
* With the kinetic study, the scavenging factor, SF, of the aqueous solution can also be determined. SF increases with the increase in the initial concentration of the contaminant, and the complex structure of the treated compound formed as a result of the high concentration of byproducts. As expected, for compounds treated with photocatalytic oxidation as a mixture doped to the water, SF yields the same value regardless of the compound results.

Supplementary Materials

The following are available online at www.mdpi.com/article/10.3390/catal11101190/s1, Figure S1: LVRPA vs. ξ* from SFM adapted to the external four lamp photoreactor. Variation with dimensional radial position within the reaction space and catalyst concentration. Catalyst concentration, gL−1: ■ 0.5, ▲ 1, ⬤ 1.5, Figure S2. Confirmation of first order kinetics for KTR, DCF and MTP photocatalytic oxidation. Initial concentration of compounds: 20 mgL−1. Symbols: ■ DCF, ▲ MTP, ⬤ KTR. Experimental results from [4]. Figure S3. Assumed first order kinetics for photocatalytic oxidation of MCPA (experimental results from [5]). Table S1: Values of parameters applied for SFM and dimensions of external lamp photoreactor. Table S2. OVRPA SFM calculated values at different catalyst concentration.

Author Contributions

Conceptualization, F.J.B.; methodology, F.J.B. and J.R.; software, J.R.; validation, F.J.B.; J.R. and J.-F.G.-A.; investigation, F.J.B., J.R. and J.-F.G.-A.; writing—original draft preparation, F.J.B.; writing—review and editing, F.J.B. and J.R.; project administration, F.J.B.; funding acquisition, F.J.B. All authors have read and agreed to the published version of the manuscript.

Funding

This research was funded by Agencia Estatal de Investigación of Spain (PID2019-104429RB-I00/AEI/10.13039/501100011033).

Conflicts of Interest

The authors declare no conflict of interest.

References

  1. Sillanpää, M.; Ncibi, M.C.; Matilainen, A. Advanced oxidation processes for the removal of natural organic matter from drinking water sources: A comprehensive review. J. Environ. Manag. 2018, 208, 56–76. [Google Scholar] [CrossRef] [PubMed]
  2. Deng, Y.; Zhao, R. Advanced Oxidation Processes (AOPs) in Wastewater Treatment. Curr. Pollut. Rep. 2015, 1, 167–176. [Google Scholar] [CrossRef] [Green Version]
  3. Chatterjee, D.; Dasgupta, S. Visible light induced photocatalytic degradation of organic pollutants. J. Photochem. Photobiol. C Photochem. Rev. 2005, 6, 186–205. [Google Scholar] [CrossRef]
  4. Beltrán, F.J. Ozone Reaction Kinetics for Water and Wastewater Systems; CRC Press: Boca Raton, FL, USA, 2004. [Google Scholar]
  5. Mehrjouei, M.; Muller, S.; Moller, D. A review on photocatalytic ozonation used for the treatment of water and wastewater. Chem. Eng. J. 2015, 263, 209–219. [Google Scholar] [CrossRef]
  6. Bidga, R.J. Considering Fenton’s chemistry for wastewater treatment. Chem. Eng. Prog. 1995, 91, 62–67. [Google Scholar]
  7. Ribeiro, J.P.; Nunes, M.I. Recent trends and developments in Fenton processes for industrial wastewater treatment—A critical review. Environ. Res. 2021, 197, 110957. [Google Scholar] [CrossRef]
  8. Mills, A.; Davies, R.H.; Worsley, D. Water purification by semiconductor photocatalysis. Chem. Soc. Rev. 1993, 22, 417–425. [Google Scholar] [CrossRef]
  9. Schneider, J.; Bahnemann, D.; Ye, J.; Puma, L.G.; Dionysiou, D.D. (Eds.) Photocatalysis, Vol. 1: Fundamentals and Perspectives; RSC: London, UK, 2016. [Google Scholar]
  10. Li Puma, G.; Khor, J.N.; Brucato, A. Modelling of an annular photocatalytic reactor for water purification: Oxidation of pesticides. Environ. Sci. Technol. 2004, 38, 3737–3745. [Google Scholar] [CrossRef]
  11. Cassano, A.E.; Martin, C.A.; Brandi, R.J.; Alfano, O.M. Photoreactor analysis and design: Fundamentals and applications. Ind. Eng. Chem. Res. 1995, 34, 2155–2201. [Google Scholar] [CrossRef]
  12. Zalazar, C.S.; Romero, R.L.; Martin, C.A.; Cassano, A.E. Photocatalytic intrinsic reaction kinetics I: Mineralization of dichloroacetic acid. Chem. Eng. Sci. 2005, 60, 5240–5254. [Google Scholar] [CrossRef]
  13. Zazueta, A.L.L.; Destaillats, H.; Li Puma, G. Radiation field modeling and optimization of a compact and modular multi-plate photocatalytic reactor (MPPR) for air/water purification by Monte Carlo method. Chem. Eng. J. 2013, 217, 475–485. [Google Scholar] [CrossRef]
  14. Alvarado-Rolon, O.; Natividad, R.; Ramirez-Garcia, J.; Orozco-Velazco, J.; Hernandez-Servin, J.A.; Ramirez-Serrano, A. Kinetic modelling of paracetamol degradation by photocatalysis: Incorporating the competition for photons by the organic molecule and the photocatalyst. J. Photochem. Photobiol. A Chem. 2021, 4121, 113252. [Google Scholar] [CrossRef]
  15. Moreira, J.; Serrano, B.; Ortiz, A.; de Lasa, H. Evaluation of Photon Absorption in an Aqueous TiO2 Slurry Reactor Using Monte Carlo Simulations and Macroscopic Balance. Ind. Eng. Chem. Res. 2010, 49, 10524–10534. [Google Scholar] [CrossRef]
  16. Brucato, A.; Cassano, A.E.; Grisafi, F.; Montante, G.; Rizzuti, L.; Vella, G. Estimating radiant fields in flat heterogeneous photoreactors by the six-flux model. AIChE J. 2006, 52, 3882–3890. [Google Scholar] [CrossRef]
  17. Li Puma, G.; Brucato, A. Dimensionless analysis of slurry photocatalytic reactors using two-flux and six-flux radiation absorption–scattering models. Cat. Today 2007, 122, 78–90. [Google Scholar] [CrossRef]
  18. Beltrán, F.J.; Aguinaco, A.; García-Araya, J.F.; Oropesa, A. Ozone and photocatalytic processes to remove the antibiotic sulfamethoxazole from water. Water Res. 2008, 42, 3799–3808. [Google Scholar] [CrossRef]
  19. Mena, E.; Rey, A.; Beltrán, F.J. TiO2 photocatalytic oxidation of a mixture of emerging contaminants: A kinetic study independent of radiation absorption based on the direct-indirect model. Chem. Eng. J. 2018, 339, 369–380. [Google Scholar] [CrossRef]
  20. Rivas, J.; Solis, R.R.; Gimeno, O.; Sagasti, J. Photocatalytic elimination of aqueous 2-methyl-4-chlorophenoxyacetic acid in the presence of commercial and nitrogen-doped TiO2. Int. J. Environ. Sci. Technol. 2015, 12, 513–526. [Google Scholar] [CrossRef] [Green Version]
  21. Rivas, F.J.; Hidalgo, A.; Solís, R.R.; Tierno, M. Photocatalysis in an external four-lamp reactor: Modelling and validation—dichloroacetic acid photo-oxidation in the presence of TiO2. Int. J. Environ. Sci. Technol. 2019, 16, 6705–6716. [Google Scholar] [CrossRef]
  22. Encinas, A.; Rivas, F.J.; Beltrán, F.J.; Oropesa, A. Combination of black-light photocatalysis and ozonation for emerging contaminants degradation in secondary effluents. Chem. Eng. Technol. 2013, 36, 492–499. [Google Scholar] [CrossRef]
  23. Chong, M.N.; Jin, B.; Chow, C.W.K.; Saint, C. Recent developments in photocatalytic water treatment technology: A review. Water Res. 2010, 44, 2997–3027. [Google Scholar] [CrossRef]
  24. Liu, B.; Zhao, X.; Terashima, C.; Fujishima, A.; Nakata, K. Thermodynamic and kinetic analysis of heterogeneous photocatalysis for semiconductor systems. Phys. Chem. Chem. Phys. 2014, 16, 8751. [Google Scholar] [CrossRef]
  25. Malato, S.; Fernandez-Ibañez, P.; Maldonado, M.I.; Blanco, J.; Gernjak, W. Decontamination and disinfection of water by solar photocatalysis: Recent overview and trends. Catal. Today 2009, 147, 1–59. [Google Scholar] [CrossRef]
  26. Legrini, O.; Oliveros, E.; Braun, A.M. Photochemical processes for water treatment. Chem. Rev. 1993, 93, 671–698. [Google Scholar] [CrossRef]
  27. Beltrán, F.J.; Rey, A. Free Radical and Direct Ozone Reaction Competition to Remove Priority and Pharmaceutical Water Contaminants with Single and Hydrogen Peroxide Ozonation Systems. Ozone Sci. Eng. 2018, 40, 251–265. [Google Scholar] [CrossRef]
  28. Beltrán, F.J.; Checa, M.; Rivas, F.J.; García-Araya, J.F. Modeling the Mineralization Kinetics of Visible Led Graphene Oxide/Titania Photocatalytic Ozonation of an Urban Wastewater Containing Pharmaceutical Compounds. Catalysts 2020, 10, 1256. [Google Scholar] [CrossRef]
  29. Zhai, X.; Chen, Z.; Zhao, S.; Wang, H.; Yang, L. Enhanced ozonation of dichloroacetic acid in aqueous solution using nanometer ZnO powders. J. Environ. Sci. 2010, 22, 1527–1533. [Google Scholar] [CrossRef]
  30. Benitez, F.J.; Acero, J.L.; Real, F.J.; Roman, S. Oxidation of MCPA and 2,4-D by UV Radiation, Ozone, and the Combinations UV/H2O2 and O3/H2O2. Environ. Sci. Health Part B 2004, 39, 393–409. [Google Scholar] [CrossRef]
  31. Benner, J.; Salhi, E.; Ternes, T.; von Gunten, U. Ozonation of drinking water: Part I. Oxidation kinetics and product formation. Water Res. 2008, 42, 3003–3012. [Google Scholar] [CrossRef]
  32. Huber, M.M.; Canonica, S.; Park, G.Y.; von Gunten, U. Oxidation of Pharmaceuticals during Ozonation and Advanced Oxidation Processes. Environ. Sci. Technol. 2003, 37, 1016–1024. [Google Scholar] [CrossRef]
  33. Chen, Y.W.; Hsu, Y.H. Effects of Reaction Temperature on the Photocatalytic Activity of TiO2 with Pd and Cu Cocatalysts. Catalysts 2021, 11, 966. [Google Scholar] [CrossRef]
  34. Zertal, A.; Molnár-Gábor, D.; Malouki, M.A.; Sehili, T.; Boule, P. Photocatalytic transformation of 4-chloro-2-methylphenoxyacetic acid (MCPA) on several kinds of TiO2. Appl. Catal. B Environ. 2004, 49, 83–89. [Google Scholar] [CrossRef]
  35. Rodriguez, R.; Blesa, M.A.; Regazzoni, A.E. Surface Complexation at the TiO2 (anatase)/Aqueous Solution Interface: Chemisorption of Catechol. J. Colloid Interface Sci. 1996, 177, 122. [Google Scholar] [CrossRef]
  36. Tolosana-Moranchel, A.; Casas, J.A.; Carbajo, J.; Faraldos, M.; Bahamonde, A. Influence of TiO2 optical parameters in a slurry photocatalytic reactor: Kinetic modelling. Appl. Catal. B Environ. 2017, 200, 164–173. [Google Scholar] [CrossRef]
Figure 1. Scheme of the central lamp photoreactor and principal dimensions.
Catalysts 11 01190 g001
Figure 2. Scheme of the external four lamps photoreactor and principal dimensions.
Catalysts 11 01190 g002
Figure 3. Local Volumetric Rate of Photon Absorption (VRPA) vs. ξ* from Six Flux Model (SFM) adapted to the external four-lamp photoreactor. Variation with dimensionless radial position within the reaction space and catalyst concentration. Catalyst concentration, gL−1: ◯ 10−3, ◆ 5 × 10⁻³, ▲ 10−2, ⬤ 5 × 10⁻².
Catalysts 11 01190 g003
Figure 4. Variation of Overall Volumetric Rate of Photon Absorption (OVRPA) with catalyst concentration.
Catalysts 11 01190 g004
Figure 5. Percentage of absorbed radiation with catalyst concentration from the SFM model (⬤) and the Monte Carlo method (percentages values from these method deduced from [21] (◯).
Catalysts 11 01190 g005
Figure 6. First-order kinetics for the photocatalytic oxidation of Dichloroacetic acid (DCA) (experimental data deduced from [21]). Initial DCA concentration, mgL−1: ⬤ 5; ■ 20; ▲ 50; ◆ 70.
Catalysts 11 01190 g006
Figure 7. Langmuir kinetics for the photocatalytic oxidation of 2-methyl-4-chlorophenoxyacetic acid (MCPA) (experimental data deduced from [20]).
Catalysts 11 01190 g007
Table 1. Contaminants considered and their corresponding hydroxyl radical rate constant values.
CompoundReference for ResultskHOM × 10−9, M−1s−1Reference for kHOM
Dichloroacetic acid, DCA[21]3.9[29]
2-methyl-4-chlorophenoxyacetic acid MCPA[20]6.6[30]
Metoprolol (MTP)[22]7.3[31]
Diclofenac (DCF)[22]7.5[32]
Ketorolac (KTR)[22]7.3[31]
Table 2. Compounds considered, initial concentration, reaction time of first-order kinetics, first-order rate constant, intrinsic rate constant and scavenging factor.
CompoundCM0, mgL−1Reaction Time, minkd, min−1kHOM/SF d, M−1SFd, s−1
DCA a5256.47 × 10−29.00 × 1044.33 × 104
20502.70 × 10−23.76 × 1041.04 × 105
50501.98 × 10−22.76 × 1041.42 × 105
70501.69 × 10−22.35 × 1041.66 × 105
MCPA b5201.116 × 10−11.29 × 1065.13 × 103
KTR c0.05155.47 × 10−21.10 × 1066.67 × 103
20603.3 × 10−36.61 × 1041.10 × 105
DCF c0.05156.11 × 10−21.22 × 1066.13 × 103
20603.4 × 10−36.81 × 1041.10 × 105
MTP c0.05154.62 × 10−20.95 × 1067.89 × 103
20602.9 × 10−35.81 × 1041.26 × 105
a From [21], b From [20] assuming Langmuir kinetics, c Results from photocatalytic oxidation of a contaminant mixture [22] where KTR, DCF and MTP were simultaneously treated, d From this work. SF is the Scavenging Factor.
Publisher’s Note: MDPI stays neutral with regard to jurisdictional claims in published maps and institutional affiliations.

