Article

Catalysis on Nanostructured Indium Tin Oxide Surface for Fast and Inexpensive Probing of Antibodies during Pandemics

Department of Chemistry, University of Guelph, Guelph, ON N1G 2W1, Canada
*
Author to whom correspondence should be addressed.
Catalysts 2021, 11(2), 191; https://doi.org/10.3390/catal11020191
Submission received: 9 December 2020 / Revised: 27 January 2021 / Accepted: 28 January 2021 / Published: 1 February 2021
(This article belongs to the Special Issue Characterization Analysis of Heterogeneous Catalysts)

Abstract

:
Severe acute respiratory syndrome coronavirus 2 (SARS-CoV-2) has become a global threat to human health and the economy. Society needs inexpensive, fast, and accurate quantitative diagnostic tools. Here, we report a new approach using a solid-state biosensor to measure antibodies, which does not require functionalization, unlike conventional biosensors. A nanostructured semiconductor surface with catalytic properties was used as a transducer for rapid immobilization and measurement of the antibody. The transducer response was based on solid-state electronics properties. The changes on the surface of the semiconductor induced changes in the direct current (DC) surface resistivity. This was a result of a catalytic chemical reaction on that surface. This new low-cost approach reduced the response time of the measurement significantly, and it required only a very small amount of sample on the microliter scale.

Graphical Abstract

1. Introduction

Antibodies play an important role in neutralizing viruses and providing immunity. Tests for antibodies are indirect approaches for rapid diagnosis of infectious diseases. In most individuals infected with severe acute respiratory syndrome coronavirus 2 (SARS-CoV-2), antibodies can be detected within 10–15 days post-onset of symptom (POS) [1,2,3,4]. The expression level of antibodies in saliva and blood depends on the onset of the infection and the severity of the disease [5,6,7]. Analyzing the response of the immune system after infection results in correlating the infection and fatality rates in communities and investigating the immunity rate in recovered patients [7,8,9,10]. In addition, investigating the kinetics of the antibody production during different stages of immunization helps determine the efficacy of different treatments and increase the pace and credibility of vaccines’ development [11,12]. As such, it is important to measure antibodies for the diagnosis of the infection as well as to provide decision-makers with the data to fight the disease.
Immunofluorescence assays are among the most popular qualitative techniques to detect the presence of antibodies in the serum or plasma component of blood [13,14,15,16]. Due to the qualitative nature of the response, these tests cannot determine the stage and the severity of the disease. Electrochemical sensors, on the other hand, promise features such as high-sensitivity for SARS-CoV-2 antibodies, and can even be miniaturized for point-of-care diagnostics [17,18,19,20]. However, these biosensors commonly require surface functionalization of sensory surfaces to immobilize a bioreceptor. This results in increasing the fabrication time and, consequently, the cost of the device.
The new approach described in this article aimed at fast, simple, and inexpensive biosensor devices that opened the door to new applications. For instance, one example is based on the idea of “immunity passports” that provide information related to herd immunity in societies [21,22]. Although no indication has yet been found to show the recovered COVID-19 patients who have the antibodies would not have a second infection, the proponents of immunity passports and herd immunity have recommended the detection of SARS-CoV-2 antibodies as a criterion [23].
In our previous studies, we reported fabrication of a highly sensitive nanostructure-based semiconductor sensor for detection of bacteria and fungi [24,25]. We showed that semiconductor nanocomposites (ITO/ZnO) can be used as solid-state biosensors for real-time measurements of bacteria and fungi [24,25]. Here, we extended this to a SARS-CoV-2 antibody by exploiting the changes in the surface conductivity of a solid-state transducer (driven by the catalytic reactions of biomolecules on the surface of the transducer) to measure the antibodies. This is the first step and only a proof of concept towards measuring antibodies in samples. Therefore, a set of controlled samples were used with a SARS-CoV-2 antibody at different concentrations to limit the interference with the concentration dependence of multiple antibodies; that study is the subject of a future publication.
Due to the catalytic properties of the metal oxide semiconductor used in this study, we eliminated the need for using the corresponding antigens of the SARS-CoV-2 antibodies as bioreceptors. Removing the antigens from the required components of the biosensor reduces the complexity and cost of the device. Moreover, in our approach, we replaced complicated electrochemical measurements with a simple solid-state conductivity measurement. Measuring the changes in the conductivity of the surface provides a measure of antibody’s concentration and therefore an approach towards quantitative analysis of the antibodies. Although in this study we applied a new approach to one of the antibodies of SARS-CoV-2 in the presence of other proteins and some ions, this technology can also be applicable to other antibodies associated with other diseases after extending our studies to samples from patients.

2. Results and Discussion

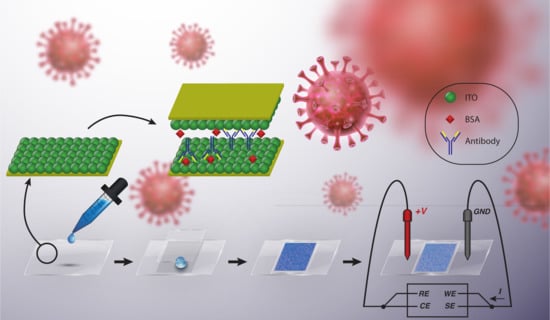
2.1. Biosensor Fabrication

The device used in this study (Figure 1) has two (main and secondary) ITO-coated glass slides. In the main ITO-coated glass slide, the glass acts as a substrate and the ITO layer on top of it acts as a catalyst and a transducer. The secondary ITO-coated glass slide has a similar structure to the main slide and is used to sandwich the sample. The device is connected to electronic components (described in Section 2.3) for measuring the electrical properties. Our procedure is described below.
(1) A glass substrate was coated by an ITO thin film (Figure 1) to serve as a transducer. (2) The subunit 1 of SARS-CoV-2 coronavirus spike protein antibodies as the target analytes were immobilized on the main slide and sandwiched by the secondary slide to spread the liquid layer evenly. (3) The changes to the surface resistance of the ITO nano-layer (Figure 1) was measured. Due to the catalytic reaction of the ITO with the biospecimens (described in Section 2.5), the surface resistance of the transducer changed (Figure 1). This allowed us to develop a protocol to measure the SARS-CoV-2 antibodies based on the changes in the surface resistance.
The main ITO-coated glass slide is made of a 20 × 10 mm glass slide that is coated with 122 ± 5 nm thick ITO (Figure 2) (the measurement of the thickness is discussed in Section 2.2). The secondary ITO-coated glass slide has the same feature but with a slightly smaller dimension of 10 × 10 mm for electrical connections to the main surface. Only the main ITO-coated glass slide is connected to the circuit (Figure 3) for the electrical measurements. Prior to measurements, both slides were cleaned with ethanol, rinsed with deionized water immediately after, and dried. Moreover, 5 μL of the sample was pipetted onto the slide, then sandwiched with an ITO-coated glass slide on top.

2.2. ITO Nanostructure

The structure of the ITO nanolayer was determined using scanning electron microscopy (SEM) and atomic force microscopy (AFM). The SEM images were taken using JEOL JSM-5600 (JEOL Ltd., Tokyo, Japan). Figure 2a shows the micrographs of the ITO surface uniformly coating the glass slide. This is consistent with the SEM maps of the oxygen and indium atoms (Figure 2b,c). A DI D3500 Nanoman (Nanoman VS, Veeco, Plainview, NY, USA) was used for AFM measurements. Figure 2d shows the AFM image over the scan area of 2 × 2 μm2. This and other AFM images along with the energy dispersive spectra (EDS), show that the ~nm scale ITO particles are coated on the glass slide with a mean spacing of about 180 nm. This defines the morphology of the ITO. Based on the AFM images, the ITO thin film surface shows a continuous island-like structure. The mean roughness (Ra) is 4.056 nm and the interface width roughness calculated as the route mean square (RMS) is 5.411 nm. RMS is the standard deviation of the surface height within the given area. The above-mentioned thickness for the ITO layer (122 nm) was measured using the spectral reflectance technique via a Filmetrics F40-UV thin film analyzer. In this technique, the thickness is measured based on the amount of light reflected from the film in a wide range of wavelengths from UV to infrared. The results are oscillations in the reflectance spectrum [26]. Therefore, more oscillations in the spectrum result in higher thickness (Figure S1). Although the fit of the model to the experimental data results in 1 nm uncertainty, we use the RMS value from AFM measurements for the variation of the thickness (as a more conservative measure of the uncertainty), so it is reported as 122 ± 5 nm. The EDS shows the presence of oxygen, indium, and tin on the surface. According to EDS, the tin concentration is almost half the concentration of indium.

2.3. Electronic Circuit

The simplified electronic circuit diagram is shown in Figure 3. The initial surface resistance of the sensor, R0, is measured as the surface resistance of the slides right before placing the sample. The surface resistance of the sensor after placing the sample, R, was measured in real-time and in 1 ms intervals by using a voltage divider circuit connected to an analog-to-digital converter (ADC). The ADC was comprised of a microcontroller and a USB interface so that the digital signal can be read in real-time on a computer via a COM port. The digital signal (S) is the Vout of the voltage divider circuit relative to the working potential Vin (in this case 5 V) as represented in Equation (1):
S = V out V in
As such, the accuracy of the working potential Vin is not relevant since the ratio of the two potentials is measured. In the voltage divider circuit, the unknown resistance value R can be calculated using Equation (2):
R = V in V out 1 × R Ref
The resistance value of the reference (Rref) was chosen on the same order as the R value (500 Ω in this case) to increase the measurement precision. The current passing through the sensor can also be easily calculated by Equation (3):
I i n = V in V out R
To increase the accuracy of the measurements, multiple measurements for each sample were performed and to decrease the noise we filtered the background noise as much as possible. We chose a proper reference resistance to decrease the analogue to digital conversion error, and used shielding to decrease the environmental interference.

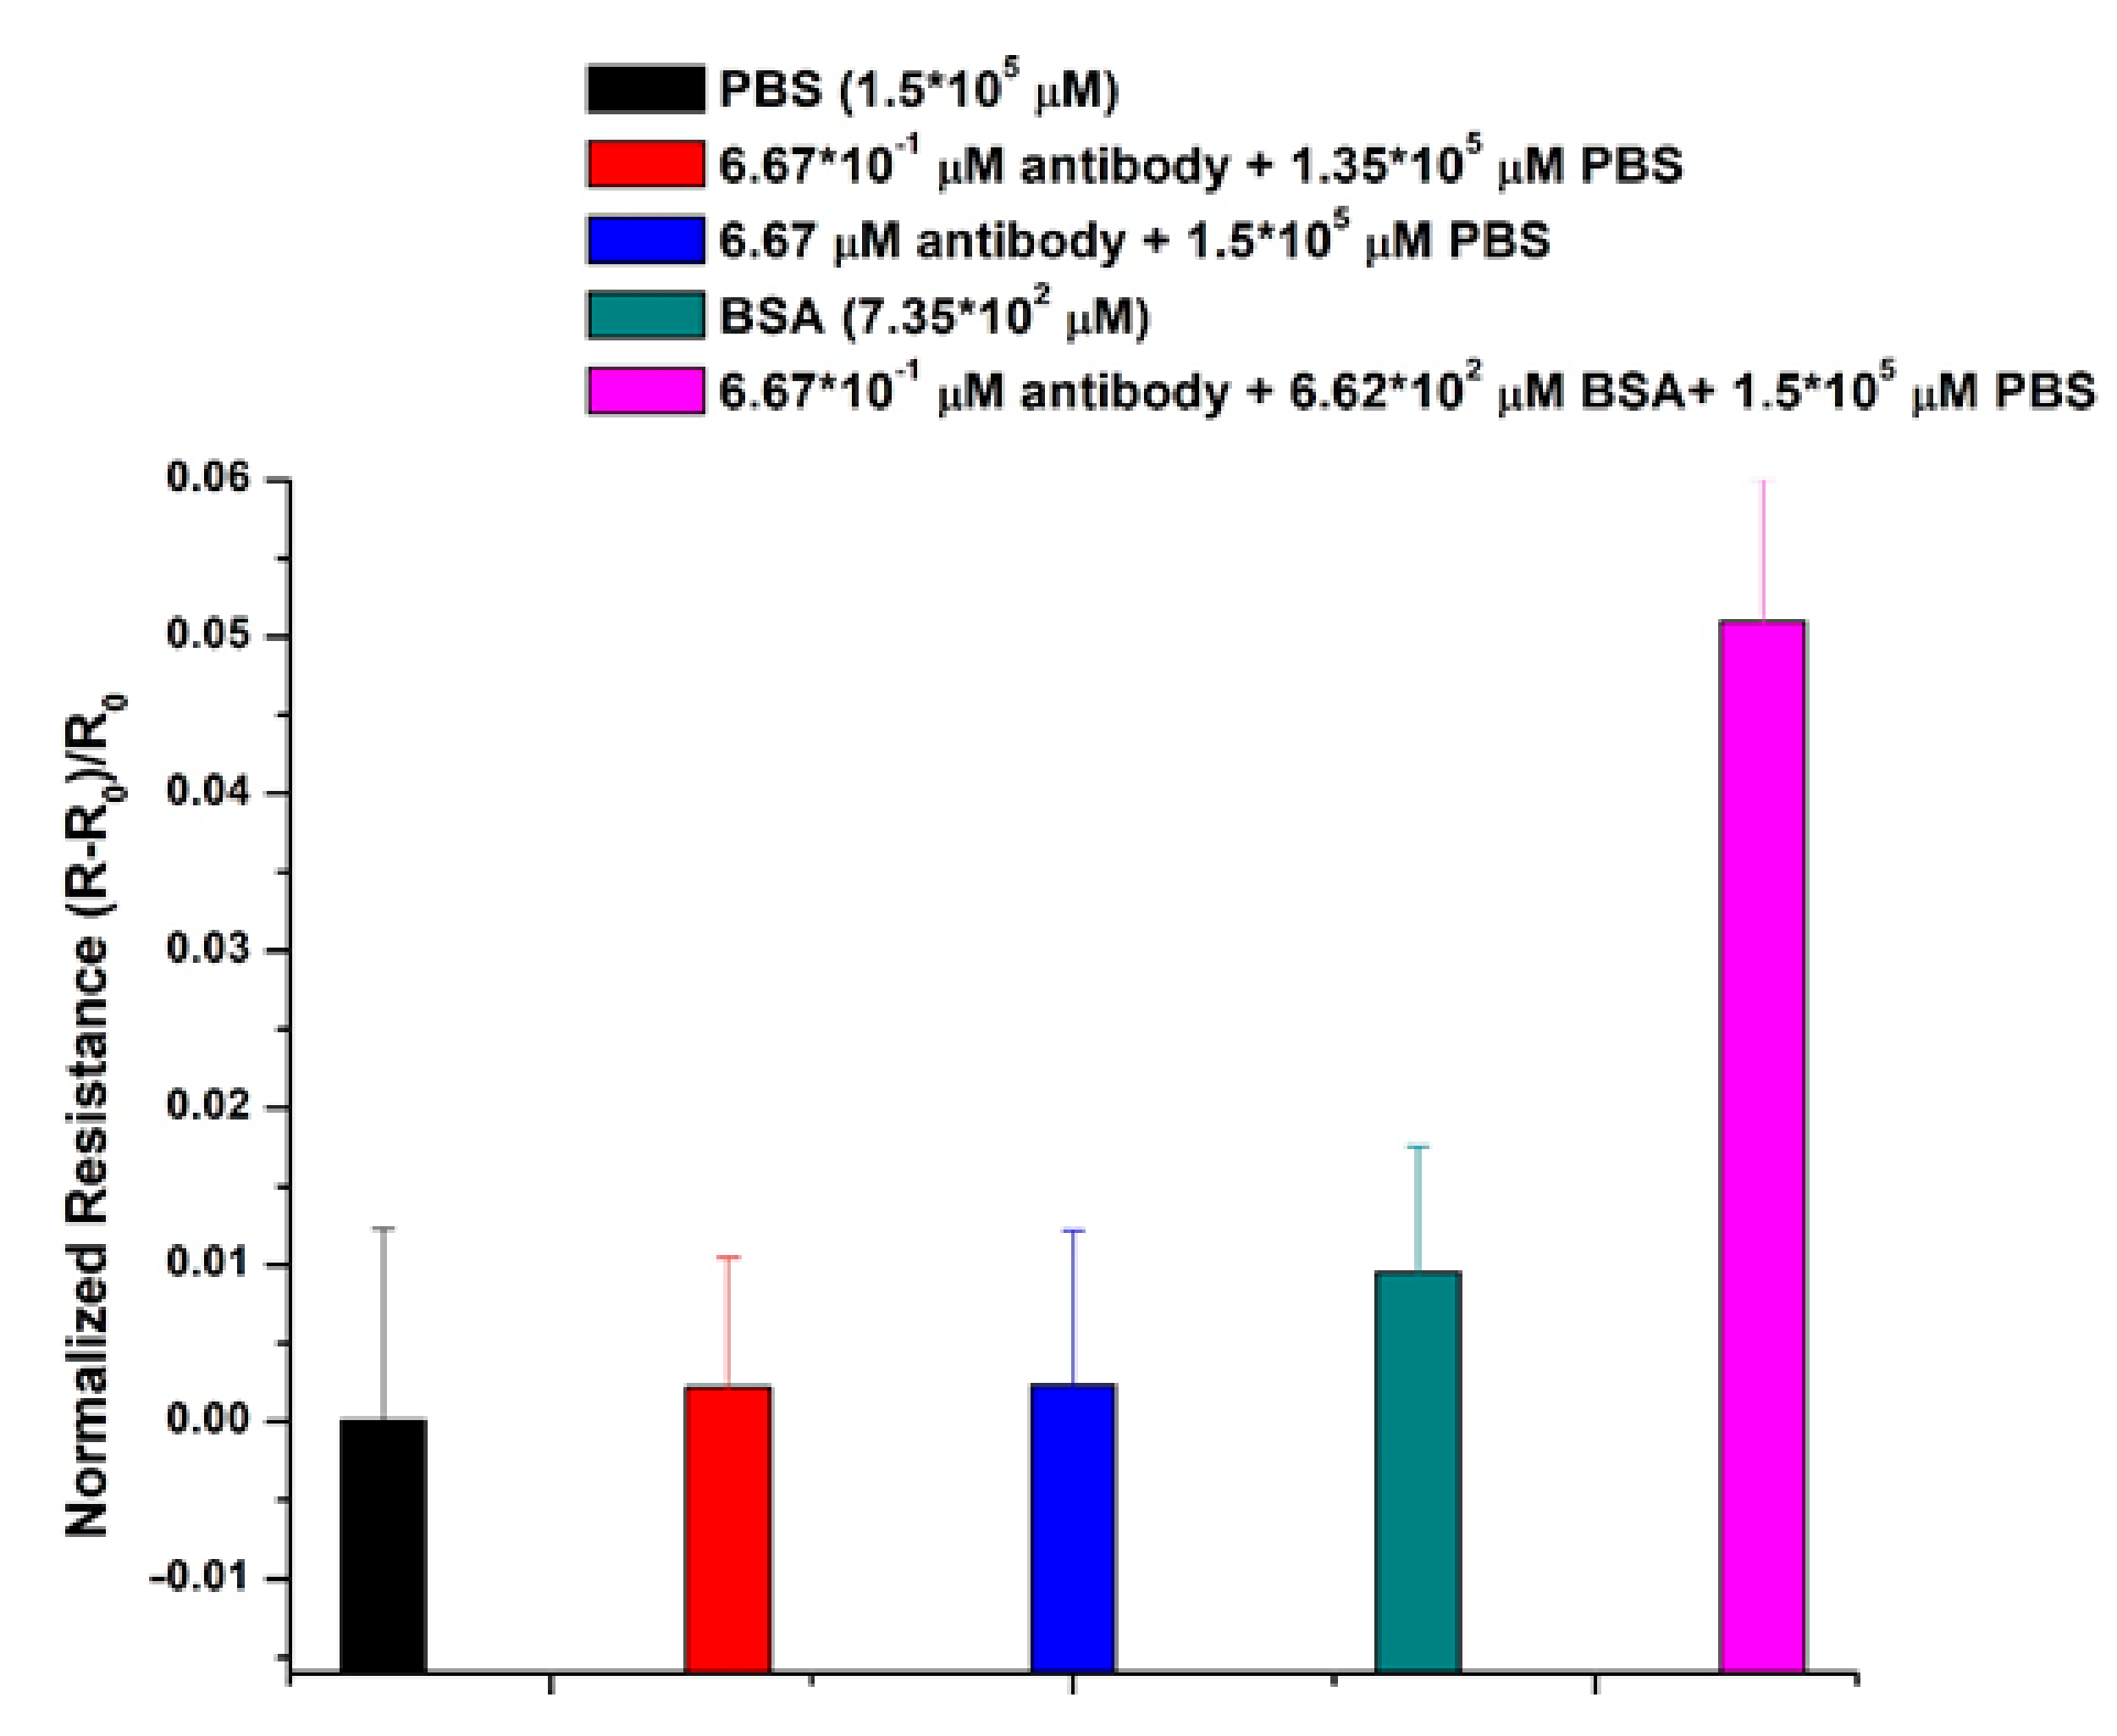
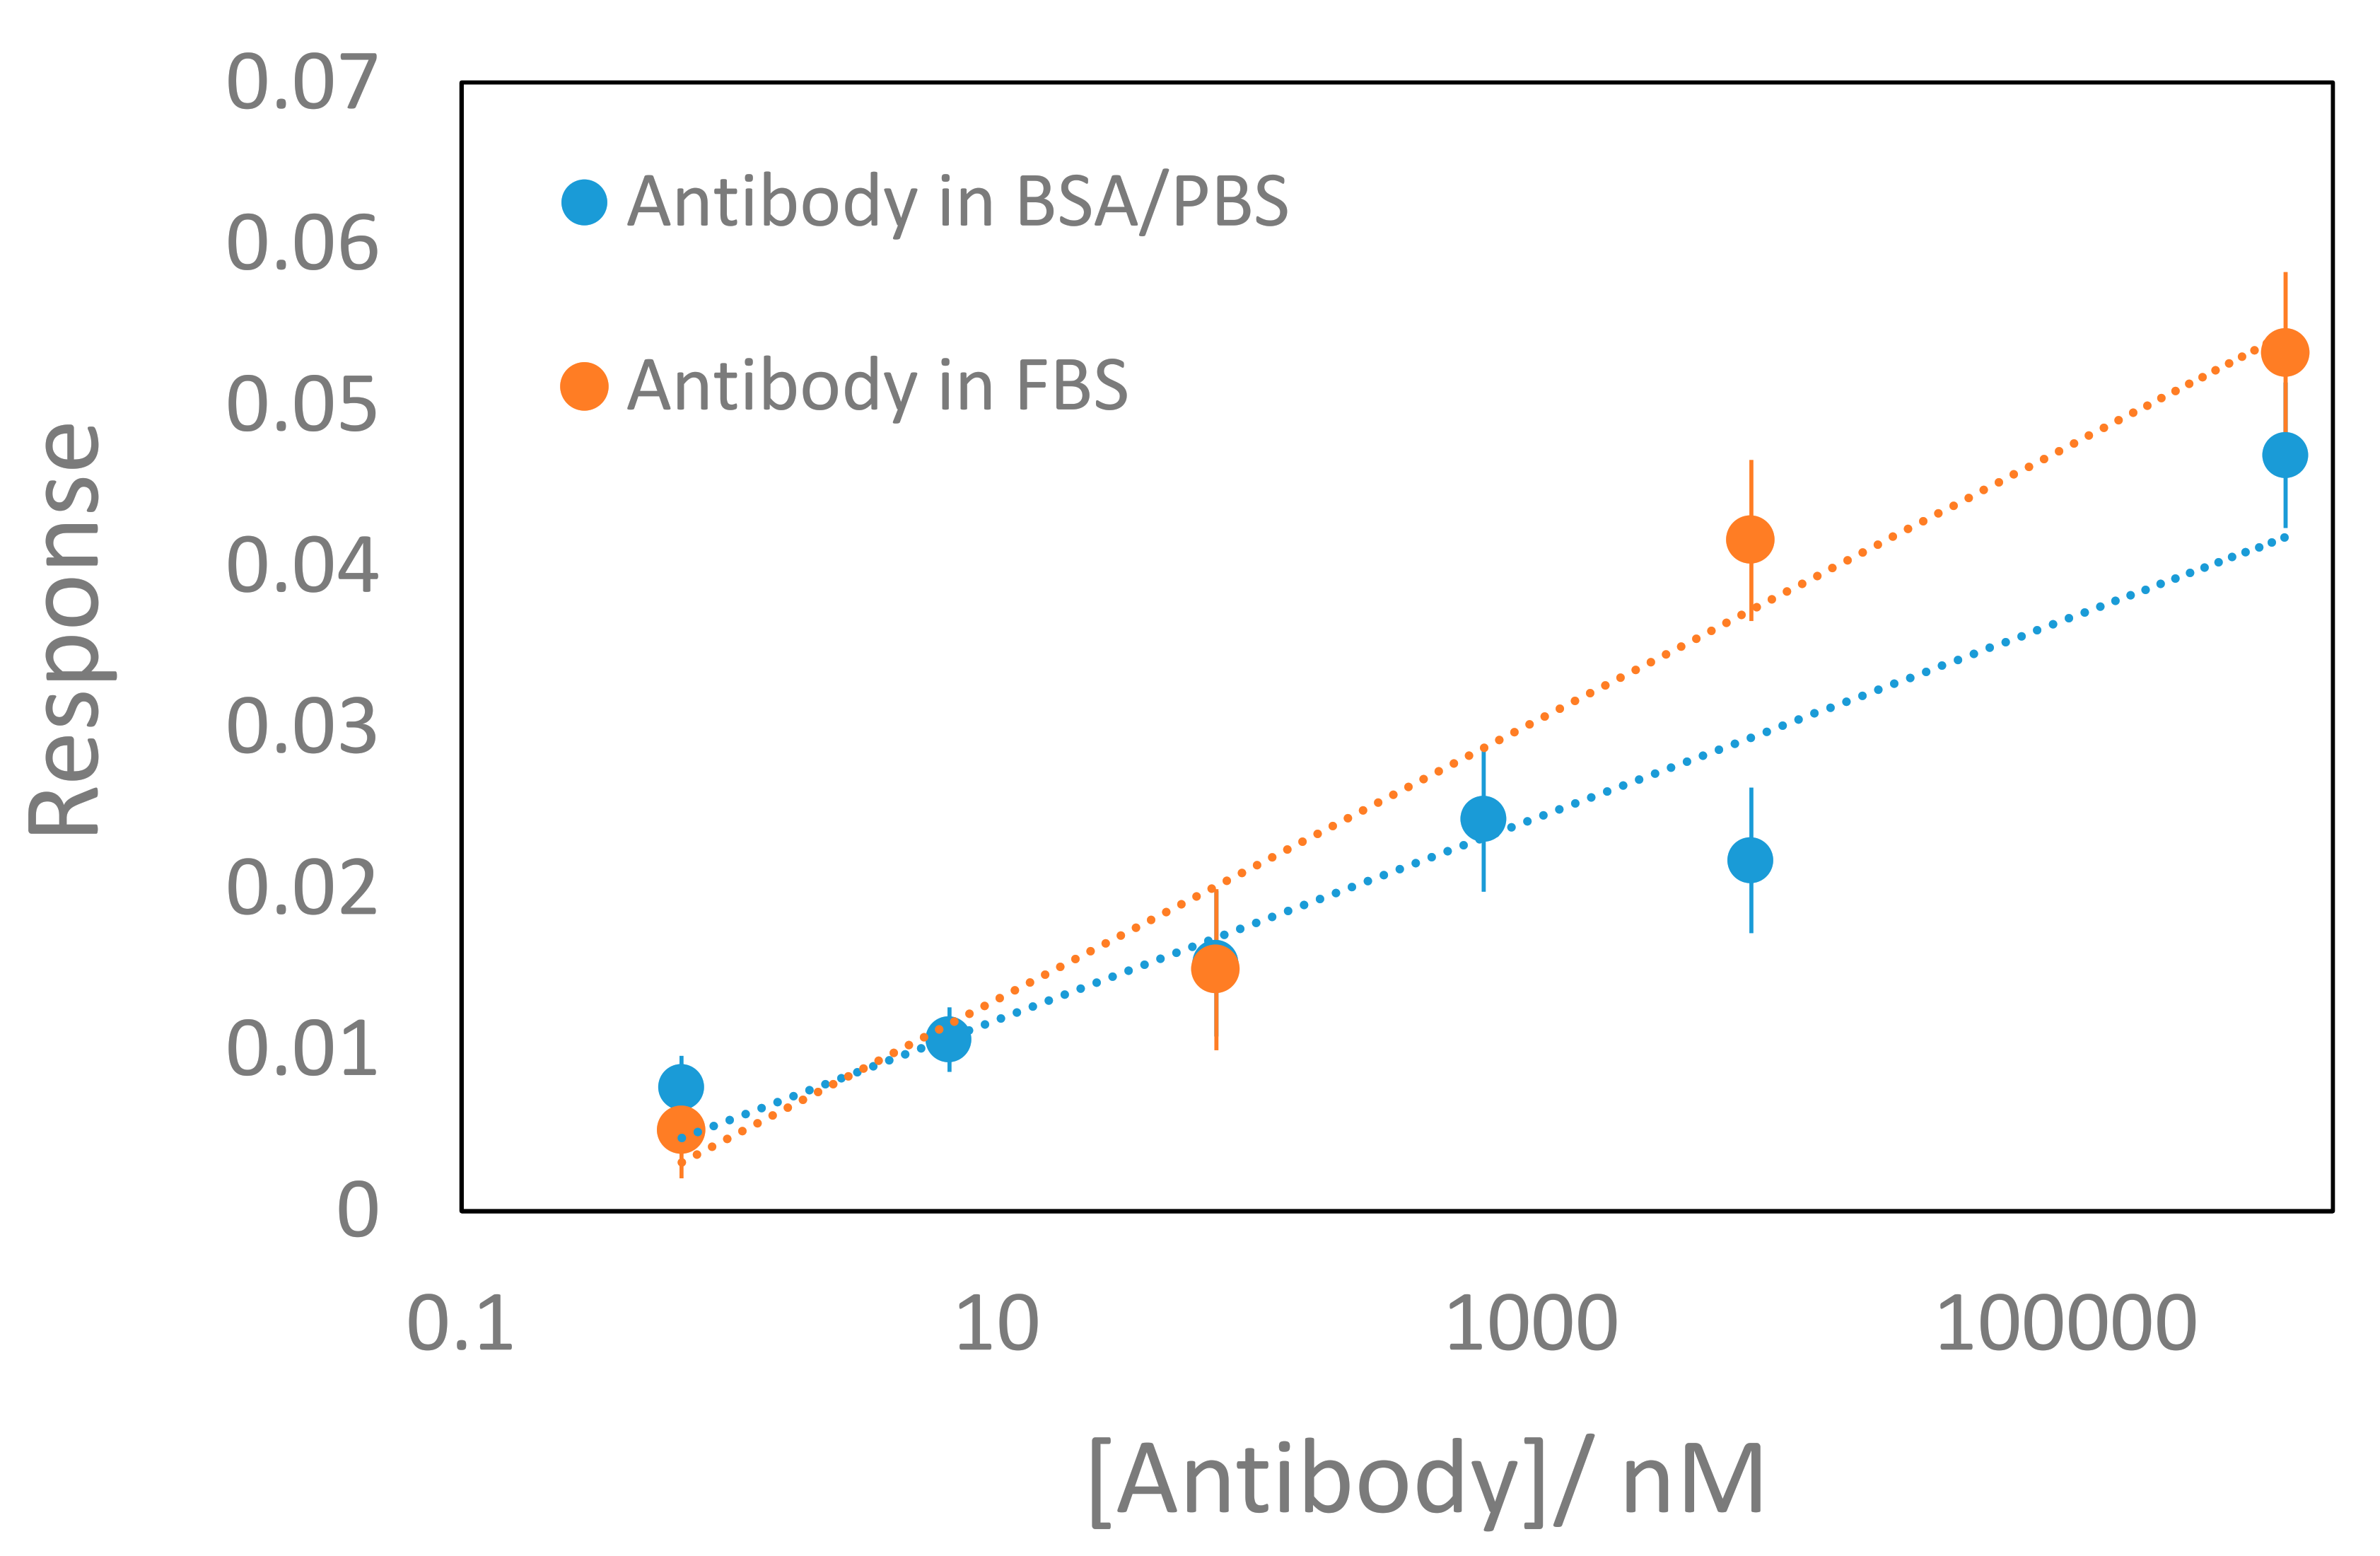
2.4. Antibody Measurements

The resistance of the sensor in the dry state was measured prior to pipetting some sample onto the surface to determine the initial surface resistance. After pipetting the samples, the surface resistance of the sensors in the wet state (R) were recorded for 10 min while the samples were in contact with the sensor. The difference between the initial and the final surface resistance of the sensors in the presence of the sample is a measure of the concentration of the antibodies. Figure 4 demonstrates the results of the resistance measurements of the target antibody and two different media solutions. Various volumes of antibody solutions were measured. Using 5 μL, 10 μL, and 20 μL of a sample containing nanomolar quantities of antibody in aqueous solutions of bovine serum albumin (BSA) and phosphate buffer saline (PBS), the changes in surface resistance were 2.3%, 2.7%, and 2.9%, respectively.
Although the increase in volume resulted in a larger transducer response, we wanted to investigate the smallest volume that would produce a reasonable response to learn what minimum volumes of blood would be required for such measurements in future applications. As such, 5 μL was found to be the optimum and was henceforth used for all measurements. Among the five targets presented in Figure 4, the PBS solution had the smallest electrical response despite its high concentration (1.5 × 10⁵ μM).
This response was used to define the background baseline for the target antibody response measurements. In fact, all other combinations of PBS, BSA, and the antibody without BSA produced only small responses. The only large response was produced when a solution of BSA and PBS were spiked with the S1 antibody, which induced a pronounced effect on the surface resistance. This finding suggests that immobilizing the antibody on the ITO surface takes place in the presence of BSA in a PBS solution and it provides a proof-of-concept for rapid sensitive measurement of antibodies using a label-free electrical biosensor platform.
Figure 5 shows two calibration curves for two sets of solutions of antibodies: (i) the first one is in the aqueous solutions of BSA and PBS; and (ii) the second one is in fetal bovine serum (FBS), which includes BSA and other proteins that are not used in blood clotting, electrolytes, antibodies, antigens, hormones, and exogenous substances (e.g., drugs or microorganisms) at different concentrations of antibodies. Based on the calibration curves, the electrical response of the sensor (surface conductivity) increases with the concentrations of the antibodies. The data shows that we have at least 6 orders of magnitude of dynamic range, which is impressive, and also that we can measure the SARS-Cov-2 antibodies in different matrices. Each matrix will require its own calibration curve; therefore, our results suggest that the best way to measure the concentration of antibodies is via the standard addition method. The detection limit of the antibody is close to 500 picomolar.

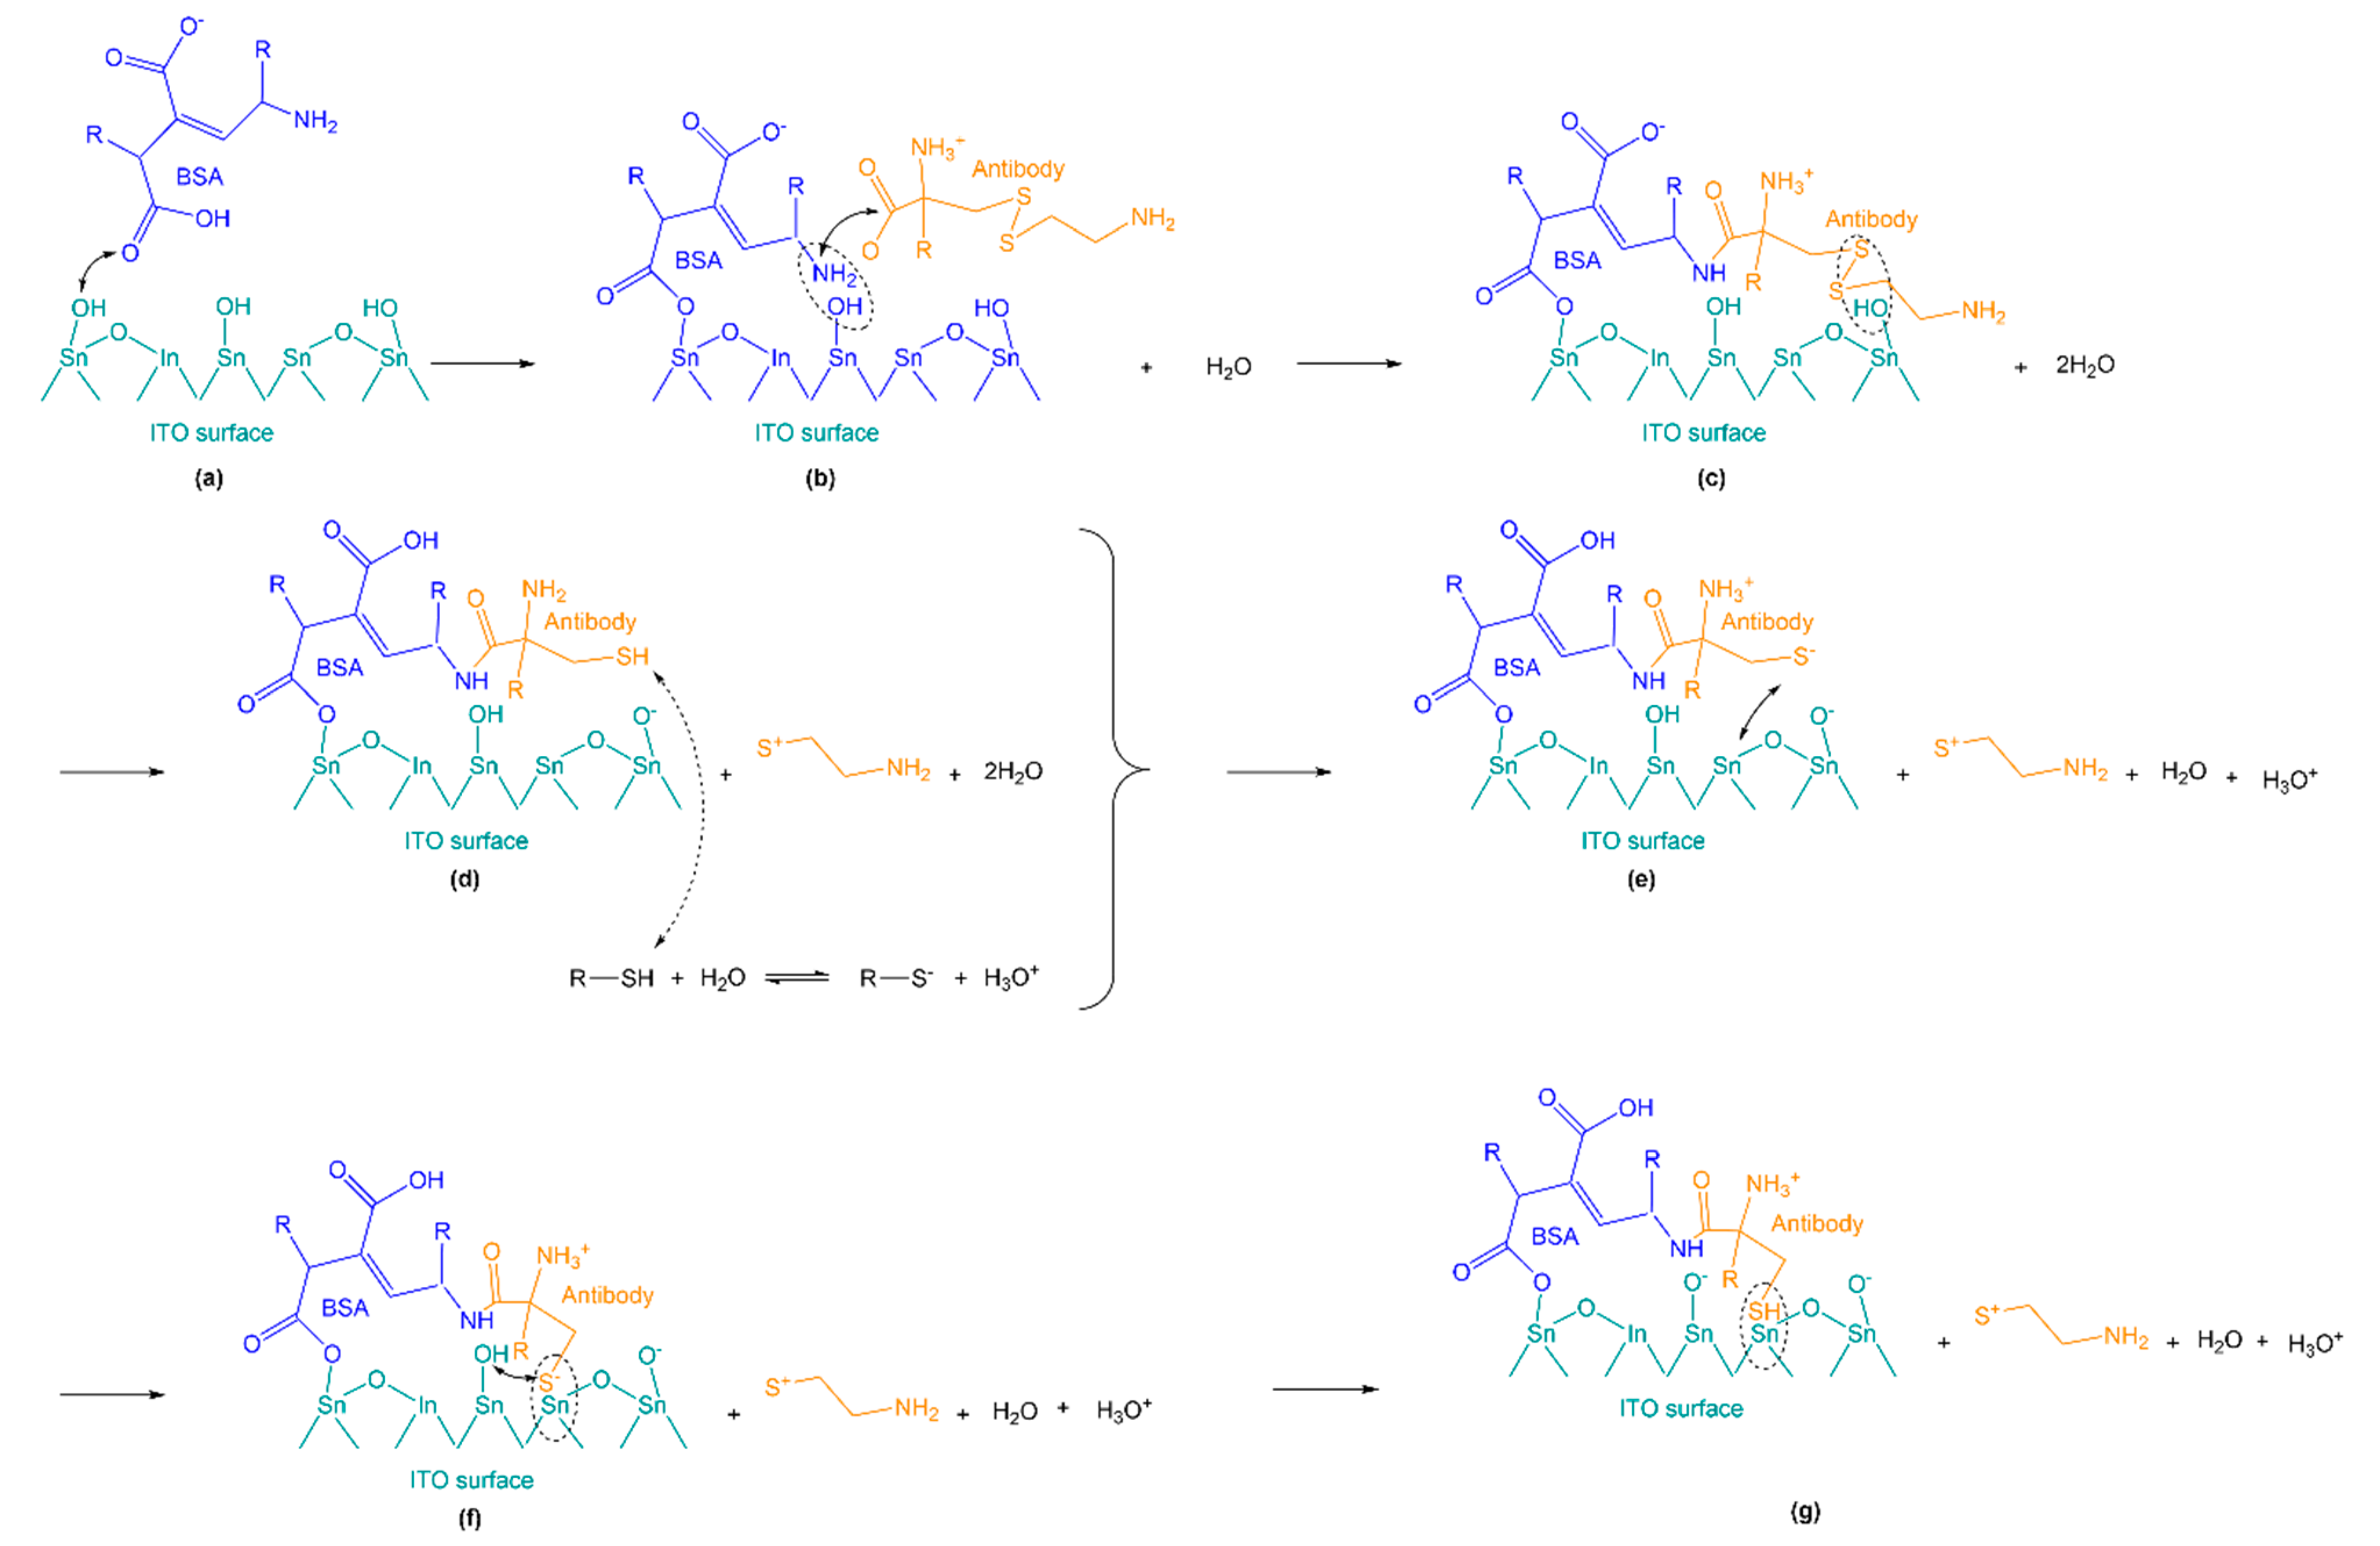
2.5. Catalytic Effects of the Indium Tin Oxide Substrate

Several studies have been done on the adsorption of proteins on the functionalized indium tin oxide substrate [27,28]. In most of these studies, the presence of hydroxyl groups on the surface of ITO results in the binding of the ITO to biospecimens with the carboxylic and thiol groups [29]. However, there have not been many studies done on binding the proteins to the non-functionalized ITO substrates. There are some reports in the literature stating that the ITO surface has several moieties of interest, including single and terminal hydroxides as results of defects in the ITO lattice and electron lone pairs on the surface oxygens [30,31]. These hydroxides could be targets for binding to certain proteins by means of ITO catalytic effects.
Considering that the ITO has been reported as a catalyst for many chemical reactions [32,33,34,35], the catalytic reactions of biomolecules on the surface of the ITO nanostructures could be contributing to the biosensing mechanism in our device. Herein, we proposed the catalytic effects of ITO on three main reactions: First, we bound the BSA molecule to the surface of the ITO through reactions between carboxylic groups of the BSA and hydroxyl groups of the ITO surface. Second, we conjugated the antibody by the reaction of the antibody with the BSA on the surface of the ITO. This results in charge transport from the BSA to the antibody and also moving the disulfide bonds of the antibody towards the surface of the ITO. Third, we changed the disulfide bonds of the antibody to thiol bonds by catalytic reactions of the protons on the surface of the ITO, which results in charge transport from the antibody to the surface of the ITO. The above mentioned interactions are explained in the following sections. However, prior to explaining the details, it should be noted that due to using the negatively charged BSA as a stabilizing agent, the charge transport and biosensing mechanisms might be limited to a net positive charge protein, i.e., an antibody. Moreover, due to proteins’ structural effects in antibodies on the charge transport and catalytic reactions that allows the biosensing, it is expected to have different calibration curves for different antibodies. Moreover, antibodies have different calibration curves in different matrices (i.e., blood). More comprehensive analytical studies are outside the scope of this proof of concept study and this mechanistic study and are the subjects of our future publications based on the extensive research ongoing in our lab currently.

2.5.1. XPS Characterization

To investigate catalytic binding after immobilizing the sample on the surface, we used X-ray photoelectron spectroscopy (XPS). VG Scientific ESCALab 250 (ThermoFisher Scientific Ltd., East Grinstead, UK) was used with an Al Kα source (hv = 1486.6 eV) under an ultra-high vacuum with a 30 eV electron energy. The atomic concentration and the percent peak area for each component were calculated using the CasaXPS software (Casa Software Ltd., Teignmouth, UK).
Figure 6 demonstrates the XPS analysis of the pure ITO surface on the glass slide, the ITO surface coated with BSA, and the ITO surface coated with antibody-spiked BSA. The XPS spectrum of oxygen 1s (Figure 6a) shows that all three samples consist of the stoichiometric tin oxide at 530.6 eV. The peak at 532.9 eV is due to SiO2. For the pure ITO glass slide, the SiO2 peak area is 8.77% and is consistent with the presence of silicon in the EDS results. For the ITO surface coated with BSA, the peak area decreases to 1.68% and the SiO2 peak is not present in the spectra of the ITO surface coated with antibody-spiked BSA.
To investigate the effects of BSA and antibodies on the surface, other spectra were taken. Studying the Si 2p spectra indicates that the pure ITO glass slide has a peak at 102.8 eV with an area of 5.41%, which corresponds to silicon. This peak is almost negligible for the ITO surface coated with BSA spectra and is not present in the XPS spectrum of the other sample. On the other hand, the Sn 3d5/2 spectrum (Figure 6b) indicates the presence of a peak at an energy of 495.6 eV due to SnO2 for each sample. Calculating the peak area, the values are 3.69%, 1.97%, and 0.23% for pure ITO glass slide, ITO surface coated with the BSA, and the ITO surface coated with the antibody-spiked BSA. These results indicate that the BSA and the antibody reduce the free silicon and tin percentages on the surface by covering and binding to the surface.
The peak at 487.1 eV for pure ITO on glass and BSA coated on the surface of ITO/glass is due to the binding states of Sn2+ [36] (electrically inactive dopant that can be generated as SnO) because of the defects on the lattice. These are hydroxyl groups on the surface that, as we show in Section 2.5.2, they are important catalytic sites for biosensing.
Comparing the spectra of the carbon 1s for BSA-coated on the ITO surface and the sample consisting of antibody-spiked BSA coated on the ITO surface (Figure 6c), the peak at 285.8 eV is assigned to the carboxylic groups, which we associate with the BSA immobilized on the ITO surface [37].
Due to the presence of the hydroxyl groups on the ITO surface (SnOH), BSA on the surface of ITO reacts with these hydroxyl groups. The reaction is between the OH and the C = O bond in the carboxylic functional group to form SnOC = O. Such surface reactions are most probably catalytic since the activation barrier for such reactions should be large. For example, the energy barrier of similar reactions on two other metal oxide surfaces are 1.9 eV and 0.8 eV, respectively [38,39]. The proton in the carboxylic group will then transfer to where the electron density is higher which we propose to be at sites containing more oxygen atoms due to their lone pairs.
IgG antibodies contain cysteine units, with their sulfur atoms in disulfide bonds (-S-S-) [40,41]. Based on our XPS results, the ITO has catalytic roles in (1) reducing the activation energy required for the chemical reaction between antibodies and the BSA on the surface which was discussed earlier; and (2) reducing the native disulfide bonds in the antibody molecules to sulfhydryls and thiols (-SH). This reduction should also be catalytic since the activation barrier for breaking disulfide bonds is around 2.6 eV which is too large for a room temperature reaction [42]. Our results suggest that the antibodies are most likely denatured on the surface due to the reduction of the disulfide bonds by treatment with hydroxyl groups on the surface. The protons on the surface of the ITO, react with the antibody’s S-S bonds close to the surface, changing the oxidation state of S. This is consistent with our XPS data (Figure 6d). S peaks are only present in the XPS spectrum of the antibody-spiked BSA coated on the ITO surface. This is due to the presence of disulfide or sulfhydryl groups on the surface.
In the 2p detailed scan for sulfur, the peak at 162.4 eV corresponds to the thiol bond to metals [43]. The peaks observed at 163.3 and 163.5 eV are assigned to thiol bonds that are not bound to metals. This suggests that some antibodies are directly bound to the Sn on the surface after thiol formation via the reaction we proposed on the surface. This is also consistent with the results of the antibody measurements in Figure 4. The change in resistance of the sensor proves that our device can distinguish between antibodies and the BSA.
Comparing Figure 4 and Figure 6c, the catalytic effects of the ITO are different in the case of using pure BSA and using the antibody spiked in BSA on the surface of the ITO as the target. For pure BSA, hydroxyl groups on the surface of the ITO react with carboxylic groups of the BSA. In the case of using antibody spiked in the BSA on the surface ITO, the reaction of hydroxyl groups with disulfide bonds, which are attributed to the antibodies, is clear. Based on our XPS results, the ITO surface coated with BSA does not contain the disulfide or sulfhydryls group. This indicates the disulfide bond of the BSA is far from the ITO surface.

2.5.2. Charge Transport Mechanism

Figure 7 provides a schematic representation of our proposed catalytic effects of the ITO on BSA and the antibody to reduce the resistance of the surface. Figure 7a shows the reaction between carboxylic groups of the BSA and the hydroxyl groups on the surface of the ITO. Adding the antibody/BSA to the surface of the ITO results in the conjugation of the antibody protein (Figure 7b). Figure 7c provides the schematic for our proposed reaction between protons on the surface and disulfide bonds of the antibody close to the surface. The antibody folding takes place in this step and the disulfide bonds react with protons. As shown in Figure 7d, the disulfide bonds break and get reduced to R-SH bond and R’-S+. For proteins such as antibodies that contain disulfide bonds in their structure, the folding rate is limited by the thiol/disulfide exchange reaction [44]. In the first stage of this exchange reaction, the thiol changes to R-S (thiolate anion) in the presence of water molecules (on the surface). This mechanism contributes to generating charges on the ITO surface.
On the other hand, we suggest that antibodies conjugation with the BSA results in charge migration between the antibody and the BSA. BSA molecules are negatively charged under physiological conditions used here. There are 179 charged residues in a BSA molecule. Among those, 98 residues are negatively charged and 81 are positively charged [45]. Unlike the BSA, the net charge of the antibody is positive at pH 6 and 7 [46]. Conjugating antibodies with BSA leads to transfer of the proton from α-amino group ( NH 3 + ) at the N-terminal end of a polypeptide of the antibody to a negatively charged residue in the BSA. Charge migration can take place over distances of a maximum of 20 angstroms in polypeptide chains [47,48,49,50]. The protons hop along the polypeptide chain of the antibody until reaching the disulfide bonds. This mechanism can also generate charges on the ITO surface.
The charge transport in the antibody is represented schematically in Figure 8. Figure 8a shows an IgG antibody with 16 (12 interchain and 4 intrachain) disulfide bonds. Conjugating the antibody with BSA molecules on the surface of the ITO results in migrating protons from the α-amino group ( NH 3 + ) of polypeptides in the antibody to negatively charged residues in BSA.
The protons on the surface of ITO react with the antibody’s S-S bonds close to the surface. Disulfide bonds break and get reduced to R-SH bond and R’-S+ due to denaturation of the antibody by catalytic reactions with the hydroxyl groups (described earlier) on the surface (Figure 8b).
Transferring protons from the α-amino group ( NH 3 + ) results in changes in the net charge distributions of antibodies [46]. In this case, the antibody is polarized due to proton transport in the polypeptide chain. The proton hops from the C-terminal end of the polypeptide chain through the amino acid sequences until it reaches to the N-terminal end of the antibody (Figure 8c). Polypeptide chains are connected to each other through disulfide bonds. When the negative charge is introduced at the free sites of the polypeptide chains in antibodies (C-terminal end of the polypeptide), the proton from the R-SH bond migrates to the adjacent polypeptide. This results in changing the R-SH bond to R-S (thiolate anion), as shown in Figure 8d. When the R-S on the antibody approaches the Sn on the ITO surface, the proton from hydroxyl groups on the surface moves to thiolate anion in the antibody. The proton transfer generates an electron on the surface, as depicted in Figure 8, and these electrons on the surface increase the surface conductivity. This results in the Fermi level becoming closer to the conduction band and increasing the surface conductivity [51]. The surface conductivity can be calculated using Equation 4:
G = e μ n ϑ c + μ p π v
where μ n is the electron mobility, μ p is the hole mobility of the surface, ϑ c is the surface electron density of the conduction band, and π v is the surface hole density of the valence band. Based on these results, there are two main parameters for increasing the conductivity of the ITO surface: (1) the presence of a negatively charged stabilizing agent such as the BSA molecule, which is necessary to initiate the charge transport mechanism; (2) using a protein with a net positive charge, which has disulfide bonds in its structure to connect the polypeptide chains. Since antibodies are the only proteins with a net positive charge at pH 6–7, charge transport can take place between BSA and the antibody. Due to having disulfide bonds close to the surface of the ITO, the charge can easily be transported to the surface.
The results in Figure 4 indicate that there is little charge transfer from BSA to the ITO surface, which is consistent with the smaller change to surface conductivity in the case of BSA compared to BSA/antibody. The increase in conductivity of ITO is due to binding antibodies to the ITO surface in the presence of BSA. Another effect regarding the change in the conductivity of the ITO surface is the small thickness of the nanostructured layer. As explained in Section 2.2, the thickness of the nanostructured ITO is 122 ± 5 nm. In this case when a charge is applied on the surface, it can easily move along the surface. This also helps in inducing the change in the response of the sensor.
The thicknesses of the antibody film on the surface were also measured using profilometer alpha-step (KLA Tencor). Using the profilometer let us observe the edge of the IgG-covered area of the slide, which is about 500 nm thick. Due to the sample volume we used for the experiments, a thickness of 500 nm indicates that the antibody has spread over the surface (folded or bound in more than one site with the ITO) which, along with the XPS results, is evidence of good binding between the ITO layer and the antibodies in the presence of BSA.

3. Materials and Methods

3.1. Sample Preparation

To spike the antibody in BSA, 1 μL of SARS-CoV-2 coronavirus spike protein (Subunit 1) polyclonal antibodies with a purity of 95% was used with a concentration of 1 μg/μL diluted in 9 μL of 50 μg/μL BSA (Thermo Fisher, Mississauga, ON, Canada) based on an antigen affinity chromatography technique (Thermo Fisher, Mississauga, ON, Canada). BSA and 150 mM PBS (Thermo Fisher, Mississauga, ON, Canada) were used as a negative control for this experiment. All samples were formed at room temperature at a constant pH.

3.2. Sensor Fabrication

After cleaning the ITO glass slide (Sigma Aldrich, Oakville, ON, Canada) with 70% ethanol, rinsing with water and drying, samples were coated on the slides, sandwiched by another glass to form a thin layer of sample, and finally attached to our electronic device (described in the paper) to measure the surface resistance.

3.3. Sensor Functionalization and Sample Immobilization

In the first step, ITO glass slides were attached to the ADC, and the initial resistance was measured for 15 s. In addition, 5 μL of sample was pipetted onto the slide and a droplet was sandwiched with another ITO glass to spread a thin layer of the sample over the whole surface. The change in the surface resistance of the sensor was measured while the sample was incubated for 10 min.

3.4. Thickness Measurement Using UV-SR Filmetrics-40

The samples were directly measured without any further preparation. The ultraviolet special reflectance (UV-SR) Filmetrics-F40 (Filmetrics, San Diego, CA, USA) is a reflectometer used to measure the thickness and optical constants of thin, transparent/semi-transparent films. It is fitted to a microscope to have a measurement spot size down to approximately 10 μm.
The F40-UV Thin-Film Analyzer (Filmetrics, San Diego, CA, USA) has a wavelength range of approximately 200 to 1100 nm, general precision of 0.1 nm, a stability of 0.07 nm, and can analyze thicknesses from about 4 nm to 2 µm. It measures the amount of light reflected from a thin film with the incident light perpendicular to the sample surface. A film’s properties are determined by calculating reflectance spectra based on trial values of thickness and then adjusting these values until the calculated reflectance matches the measured reflectance.

3.5. XPS Analysis

XPS studies were conducted with a VG Scientific ESCALab 250 photoelectron spectrometer (Thermo Fisher Scientific Ltd., East Grinstead, UK) equipped with an Al Kα source (hv = 1486.6 eV) under ultra-high vacuum. For the data presented here, the analyzed spot size was 300–700 microns. ITO surfaces are conductive. Therefore, the potential applied does not affect the position or line shape of the peaks significantly. However, for nonconductive samples (antibodies spiked in BSA coated on the surface), changes in peak position and line shape can be observed. We, therefore, optimized the potential applied while analyzing the nonconductive sample and then used the same potential for the ITO coated on glass slides. All samples were analyzed with a potential of 1.8 V.

3.6. Data Processing

R0 is the average value of the dry surface resistance subtracted from blank surface resistance, and R is the average surface resistance of the sensor during the incubation time. OriginPro8 and Adobe Illustrator were used to create the plots and graphs.

4. Conclusions

Our results demonstrate a solid-state electro-sensing technique that begins with catalytic reactions on the surface. Different biospecimen types, such as antibodies, c-myc, whole blood, or plasma, have different ionic properties and protein content. Therefore, adapting the device would require re-optimizing the electrical parameters, incubation time and blocking protocols to promote specific catalytic reactions.
To measure SARS-CoV-2 antibodies in real life scenarios and in biological samples such as blood, a similar approach to our antibody measurements in FBS should be used via standard addition analytical method. In the immediate future, we are focused on the miniaturization of the device which leads to (1) reduce uncertainty due to automatization of the electrical measurements and (2) improve reproducibility by using microfluidic channels.
Our new approach to developing biosensors promises low-cost manufacturing of the final product. The device, after all future studies on more complex solutions and eventually after validation based on studies of antibodies in samples such as blood can be applied to samples which contain different isotypes of antibodies such as IgM, IgA, and IgG related to SARS-CoV-2 (Figure 9). The differences in binding and catalytic reactions between biospecimen and the surface should be studied to show the device differentiate different isotypes of antibodies by providing different responses due to differences in the charge transport properties. This may then result in determining the stage of diseases. IgM antibodies emerge within 4 days after the presence of the virus and last normally up to 10 days in the body. IgG antibodies can exist in blood up to two or three months after the patient is infected [8]. The biosensor may possibly also be used to quantitively estimate the cycle threshold (Ct) values in patients. Estimating the Ct values can give us a measure of the severity or infectivity of the disease in patients [52].
After further research, this device can help in data gathering and analytics based on measuring pathogens and antibodies to support early detection of the pandemic diseases. To further develop the pathogen diagnostic tools for elimination and screening purposes, we plan to study the concentration of proteins in asymptomatic versus symptomatic individuals, and in low versus high density parasitemia to assess the effects of patient conditions such as dehydration or hormonal fluctuations on the sensor readings, since minor physiological fluctuations can affect the blood sample matrix.

Supplementary Materials

The following are available online at https://www.mdpi.com/2073-4344/11/2/191/s1, Figure S1: Spectral reflectance section thickness measurement. Reflectance spectrum and the best fit curve for the data. Table S1: Composition of FBS used.

Author Contributions

K.G. initiated the idea and supervised all stages of experimentation and paper writing. A.F prepared all the samples other than samples in FBS that were prepared by P.A. A.F. did all the measurements and analysis other than the analysis for calibration curves that were done by both K.G. and A.F. A.F wrote the first draft of the paper, which was then revised by K.G. P.A wrote the code for electronic device and helped with some electronic measurements and to write the paper. All authors have read and agreed to the published version of the manuscript.

Funding

This research was funded by Natural Sciences and Engineering Research Council of Canada to Khashayar Ghandi.

Institutional Review Board Statement

Not applicable.

Informed Consent Statement

Not applicable.

Data Availability Statement

Relevant data are available from the authors on request.

Acknowledgments

This research was financially supported by the Natural Sciences and Engineering Research Council of Canada and by the University of Guelph COVID-19 Research Development and Catalyst Fund. The authors thank Professor Muhammad Shadman for valuable discussions.

Conflicts of Interest

The authors declare no conflict of interest.

References

  1. Stadlbauer, D.; Amanat, F.; Chromikova, V.; Jiang, K.; Strohmeier, S.; Asthagiri Arunkumar, G.; Krammer, F. SARS-CoV-2 seroconversion in humans: A detailed protocol for a serological assay to detect antigen production and test setup. Curr. Protoc. Microbiol. 2020, 57, 100–115. [Google Scholar] [CrossRef] [PubMed] [Green Version]
  2. Long, Q.-X.; Liu, B.-Z.; Deng, H.-J.; Wu, G.-C.; Deng, K.; Chen, Y.-K.; Liao, P.; Qiu, J.-F.; Lin, Y.; Cai, X.-F.; et al. Antibody responses to SARS-CoV-2 in patients with COVID-19. Nat. Med. 2020, 26, 845–848. [Google Scholar] [CrossRef] [PubMed]
  3. Okba, N.M.A.; Müller, M.A.; Li, W.; Wang, C.; GeurtsvanKessel, C.H.; Corman, V.M.; Lamers, M.M.; Sikkema, R.S.; de Bruin, E.; Chandler, F.D. Severe acute respiratory syndrome coronavirus 2− specific antibody responses in coronavirus disease patients. Emerg. Infect. Dis. 2020, 26, 1478–1488. [Google Scholar] [CrossRef] [PubMed]
  4. Zhao, J.; Yuan, Q.; Wang, H.; Liu, W.; Liao, X.; Su, Y.; Wang, X.; Yuan, J.; Li, T.; Li, J.; et al. Antibody responses to SARS-CoV-2 in patients of novel coronavirus disease 2019. Clin. Infect. Dis. 2020, 19, 2027–2034. [Google Scholar] [CrossRef] [PubMed]
  5. Luchsinger, L.L.; Ransegnola, B.P.; Jin, D.K.; Muecksch, F.; Weisblum, Y.; Bao, W.; George, P.J.; Rodriguez, M.; Tricoche, N.; Schmidt, F.; et al. Serological Assays Estimate Highly Variable SARS-CoV-2 Neutralizing Antibody Activity in Recovered COVID-19 Patients. J. Clin. Microbiol. 2020, 58, 2005–2020. [Google Scholar] [CrossRef] [PubMed]
  6. Seow, J.; Graham, C.; Merrick, B.; Acors, S.; Pickering, S.; Steel, K.J.A.; Hemmings, O.; O’Byrne, A.; Kouphou, N.; Galao, R.P.; et al. Longitudinal observation and decline of neutralizing antibody responses in the three months following SARS-CoV-2 infection in humans. Nat. Microbiol. 2020, 5, 1598–1607. [Google Scholar] [CrossRef]
  7. Long, Q.-X.; Tang, X.-J.; Shi, Q.-L.; Li, Q.; Deng, H.-J.; Yuan, J.; Hu, J.-L.; Xu, W.; Zhang, Y.; Lv, F.-J.; et al. Clinical and immunological assessment of asymptomatic SARS-CoV-2 infections. Nat. Med. 2020, 26, 1200–1204. [Google Scholar] [CrossRef]
  8. Starr, T.N.; Greaney, A.J.; Addetia, A.; Hannon, W.W.; Choudhary, M.C.; Dingens, A.S.; Li, J.Z.; Bloom, J.D. Prospective mapping of viral mutations that escape antibodies used to treat COVID-19. bioRxiv 2020, 30, 405472–405499. [Google Scholar] [CrossRef]
  9. Meyerowitz-Katz, G.; Merone, L. A systematic review and meta-analysis of published research data on COVID-19 infection fatality rates. Int. J. Infect. Dis. 2020, 101, 138–148. [Google Scholar] [CrossRef]
  10. Erikstrup, C.; Hother, C.E.; Pedersen, O.B.V.; Mølbak, K.; Skov, R.L.; Holm, D.K.; Sækmose, S.; Nilsson, A.C.; Brooks, P.T.; Boldsen, J.K.; et al. Estimation of SARS-CoV-2 infection fatality rate by real-time antibody screening of blood donors. medRxiv 2020, 24, 849–857. [Google Scholar] [CrossRef]
  11. Walls, A.C.; Fiala, B.; Schäfer, A.; Wrenn, S.; Pham, M.N.; Murphy, M.; Tse, L.V.; Shehata, L.; O’Connor, M.A.; Chen, C.; et al. Elicitation of Potent Neutralizing Antibody Responses by Designed Protein Nanoparticle Vaccines for SARS-CoV-2. Cell 2020, 183, 1367–1382. [Google Scholar] [CrossRef] [PubMed]
  12. Odinsen, O.; Owusu-Ofori, S.; Dompreh, A.; Sarkodie, F.; Opare-Sem, O.; Parker, D.; Allain, J.-P. Antibody detection and kinetics of antibody production during early stages of immunization with hepatitis B virus vaccine. Clin. Vaccine Immunol. 2007, 14, 1623–1628. [Google Scholar] [CrossRef] [PubMed] [Green Version]
  13. Chan, P.K.S.; Ng, K.-C.; Chan, R.C.W.; Lam, R.K.Y.; Chow, V.C.Y.; Hui, M.; Wu, A.; Lee, N.; Yap, F.H.Y.; Cheng, F.W.T.; et al. Immunofluorescence assay for serologic diagnosis of SARS. Emerg. Infect. Dis. 2004, 10, 530–532. [Google Scholar] [CrossRef] [PubMed] [Green Version]
  14. Wang, C.; Li, W.; Drabek, D.; Okba, N.M.A.; van Haperen, R.; Osterhaus, A.D.M.E.; van Kuppeveld, F.J.M.; Haagmans, B.L.; Grosveld, F.; Bosch, B.-J. A human monoclonal antibody blocking SARS-CoV-2 infection. Nat. Commun. 2020, 11, 2251–2257. [Google Scholar] [CrossRef]
  15. Liu, I.-J.; Chen, P.-J.; Yeh, S.-H.; Chiang, Y.-P.; Huang, L.-M.; Chang, M.-F.; Chen, S.-Y.; Yang, P.-C.; Chang, S.-C.; Wang, W.-K.; et al. Immunofluorescence Assay for Detection of the Nucleocapsid Antigen of the Severe Acute Respiratory Syndrome (SARS)-Associated Coronavirus in Cells Derived from Throat Wash Samples of Patients with SARS. J. Clin. Microbiol. 2005, 43, 2444–2448. [Google Scholar] [CrossRef] [Green Version]
  16. Ejazi, S.A.; Ghosh, S.; Ali, N. Antibody detection assays for COVID-19 diagnosis: An early overview. Immunol. Cell Biol. 2020, 98, 530–538. [Google Scholar] [CrossRef]
  17. Kaushik, A.K.; Dhau, J.S.; Gohel, H.; Mishra, Y.K.; Kateb, B.; Kim, N.-Y.; Goswami, D.Y. Electrochemical SARS-CoV-2 Sensing at Point-of-Care and Artificial Intelligence for Intelligent COVID-19 Management. ACS Appl. Bio Mater. 2020, 3, 7306–7325. [Google Scholar] [CrossRef]
  18. Alafeef, M.; Dighe, K.; Moitra, P.; Pan, D. Rapid, Ultrasensitive, and Quantitative Detection of SARS-CoV-2 Using Antisense Oligonucleotides Directed Electrochemical Biosensor Chip. ACS Nano 2020. [Google Scholar] [CrossRef]
  19. Rashed, M.Z.; Kopechek, J.A.; Priddy, M.C.; Hamorsky, K.T.; Palmer, K.E.; Mittal, N.; Valdez, J.; Flynn, J.; Williams, S.J. Rapid detection of SARS-CoV-2 antibodies using electrochemical impedance-based detector. Biosens. Bioelectron. 2021, 171, 112709–112715. [Google Scholar] [CrossRef]
  20. de Eguilaz, M.R.; Cumba, L.R.; Forster, R.J. Electrochemical detection of viruses and antibodies: A mini review. Electrochem. Commun. 2020, 116, 106762–106769. [Google Scholar] [CrossRef]
  21. Brown, R.C.H.; Kelly, D.; Wilkinson, D.; Savulescu, J. The scientific and ethical feasibility of immunity passports. Lancet Infect. Dis. 2020. [Google Scholar] [CrossRef]
  22. Phelan, A.L. COVID-19 immunity passports and vaccination certificates: Scientific, equitable, and legal challenges. Lancet 2020, 395, 1595–1598. [Google Scholar] [CrossRef]
  23. “Immunity Passports” in the Context of COVID-19. Available online: https://www.who.int/publications/i/item/WHO/2019nCoV/Sci_Brief/Immunity_passport/2020.1 (accessed on 24 April 2020).
  24. Landry, C.J.; Burns, F.P.; Baerlocher, F.; Ghandi, K. Novel Solid-State Microbial Sensors Based on ZnO Nanorod Arrays. Adv. Funct. Mater. 2018, 28, 1706309–1706318. [Google Scholar] [CrossRef]
  25. Ghandi, K. Polymorph purity, monitoring and associated compositions. U.S. Patent 2015/0126409 A1, 7 May 2015. [Google Scholar]
  26. Hlubina, P.; Lunackova, M.; Lunacek, J. Simple method for determination of the thickness of a nonabsorbing thin film using spectral reflectance measurement. Appl. Opt. 2009, 48, 985–989. [Google Scholar] [CrossRef]
  27. Pluk, H.; Stokes, D.J.; Lich, B.; Wieringa, B.; Fransen, J. Advantages of indium–tin oxide-coated glass slides in correlative scanning electron microscopy applications of uncoated cultured cells. J. Microsc. 2009, 233, 353–363. [Google Scholar] [CrossRef]
  28. Shah, S.S.; Howland, M.C.; Chen, L.-J.; Silangcruz, J.; Verkhoturov, S.V.; Schweikert, E.A.; Parikh, A.N.; Revzin, A. Micropatterning of proteins and mammalian cells on indium tin oxide. ACS Appl. Mater. Interfaces 2009, 1, 2592–2601. [Google Scholar] [CrossRef] [Green Version]
  29. Ismail, M.B.; Pastor, N.C.; Soler, E.P.; Soltani, A.; Othmane, A. A Comparative Study on Surface Treatments in the Immobilization Improvement of Hexahistidine-tagged Protein on the Indium Tin Oxide Surface. J. Nanomed. Nanotechnol. 2016, 7, 56984–56996. [Google Scholar] [CrossRef] [Green Version]
  30. Leng, X.; Bollinger, A.T.; Božović, I. Purely electronic mechanism of electrolyte gating of indium tin oxide thin films. Sci. Rep. 2016, 6, 31239–31248. [Google Scholar] [CrossRef] [Green Version]
  31. Blinov, L.M.; Lazarev, V.V.; Palto, S.P.; Yudin, S.G. Electric fields and surface charge in a thin-film ferroelectric-dielectric switchable structure that were determined with a spectral probe. J. Exp. Theor. Phys. 2014, 118, 990–994. [Google Scholar] [CrossRef]
  32. Pirkanniemi, K.; Sillanpää, M. Heterogeneous water phase catalysis as an environmental application: A review. Chemosphere 2002, 48, 1047–1060. [Google Scholar] [CrossRef]
  33. Li, Z.; Zhang, P.; Shao, T.; Wang, J.; Jin, L.; Li, X. Different nanostructured In2O3 for photocatalytic decomposition of perfluorooctanoic acid (PFOA). J. Hazard. Mater. 2013, 260, 40–46. [Google Scholar] [CrossRef] [PubMed] [Green Version]
  34. Hao, J.; He, K.; Duan, L.; Li, J.; Wang, L. Air pollution and its control in China. Front. Environ. Sci. Eng. China 2007, 1, 129–142. [Google Scholar] [CrossRef]
  35. Li, J.; Fu, H.; Fu, L.; Hao, J. Complete Combustion of Methane over Indium Tin Oxides Catalysts. Environ. Sci. Technol. 2006, 40, 6455–6459. [Google Scholar] [CrossRef] [PubMed]
  36. Wu, W.-F.; Chiou, B.-S. Effect of oxygen concentration in the sputtering ambient on the microstructure, electrical and optical properties of radio-frequency magnetron-sputtered indium tin oxide films. Semicond. Sci. Technol. 1996, 11, 196–202. [Google Scholar] [CrossRef]
  37. Desimoni, E.; Brunetti, B. X-ray photoelectron spectroscopic characterization of chemically modified electrodes used as chemical sensors and biosensors: A review. Chemosensors 2015, 3, 70–117. [Google Scholar] [CrossRef] [Green Version]
  38. Arndt, B.; Sellschopp, K.; Creutzburg, M.; Grånäs, E.; Krausert, K.; Vonk, V.; Müller, S.; Noei, H.; Feldbauer, G.B.V.; Stierle, A. Carboxylic acid induced near-surface restructuring of a magnetite surface. Commun. Chem. 2019, 2, 92–98. [Google Scholar] [CrossRef] [Green Version]
  39. Hirunsit, P.; Toyao, T.; Siddiki, S.M.A.H.; Shimizu, K.; Ehara, M. Origin of Nb2O5 Lewis Acid Catalysis for Activation of Carboxylic Acids in the Presence of a Hard Base. ChemPhysChem 2018, 19, 2848–2857. [Google Scholar] [CrossRef] [Green Version]
  40. Liu, H.; May, K. Disulfide bond structures of IgG molecules: Structural variations, chemical modifications and possible impacts to stability and biological function. MAbs 2012, 4, 17–23. [Google Scholar] [CrossRef] [Green Version]
  41. Fass, D.; Thorpe, C. Chemistry and Enzymology of Disulfide Cross-Linking in Proteins. Chem. Rev. 2018, 118, 1169–1198. [Google Scholar] [CrossRef]
  42. Sela, M.; Lifson, S. On the reformation of disulfide bridges in proteins. Biochim. Biophys. Acta 1959, 36, 471–478. [Google Scholar] [CrossRef]
  43. Battistoni, C.; Gastaldi, L.; Lapiccirella, A.; Mattogno, G.; Viticoli, S. Octahedral vs tetrahedral coordination of the co(II) ion in layer compounds: CoxZn1−xIn2S4(O⩽x⩽0.46) solid solution. J. Phys. Chem. Solids 1986, 47, 899–903. [Google Scholar] [CrossRef]
  44. DeCollo, T.V.; Lees, W.J. Effects of Aromatic Thiols on Thiol−Disulfide Interchange Reactions That Occur during Protein Folding. J. Org. Chem. 2001, 66, 4244–4249. [Google Scholar] [CrossRef] [PubMed]
  45. Servagent-Noinville, S.; Revault, M.; Quiquampoix, H.; Baron, M.-H. Conformational Changes of Bovine Serum Albumin Induced by Adsorption on Different Clay Surfaces: FTIR Analysis. J. Colloid Interface Sci. 2000, 221, 273–283. [Google Scholar] [CrossRef] [Green Version]
  46. Wang, M.; Zhu, D.; Zhu, J.; Nussinov, R.; Ma, B. Local and global anatomy of antibody-protein antigen recognition. J. Mol. Recognit. 2018, 31, 2693. [Google Scholar] [CrossRef] [PubMed]
  47. Weinkauf, R.; Schanen, P.; Yang, D.; Soukara, S.; Schlag, E.W. Elementary Processes in Peptides: Electron Mobility and Dissociation in Peptide Cations in the Gas Phase. J. Phys. Chem. 1995, 99, 11255–11265. [Google Scholar] [CrossRef]
  48. Sheu, S.-Y.; Yang, D.-Y.; Selzle, H.L.; Schlag, E.W. Charge transport in a polypeptide chain. Eur. Phys. J. D At. Mol. Opt. Plasma Phys. 2002, 20, 557–563. [Google Scholar] [CrossRef]
  49. Schlag, E.W.; Sheu, S.-Y.; Yang, D.-Y.; Selzle, H.L.; Lin, S.H. Theory of Charge Transport in Polypeptides. J. Phys. Chem. B 2000, 104, 7790–7794. [Google Scholar] [CrossRef]
  50. Cordes, M.; Jacques, O.; Köttgen, A.; Jasper, C.; Boudebous, H.; Giese, B. Development of a Model System for the Study of Long Distance Electron Transfer in Peptides. Adv. Synth. Catal. 2008, 350, 1053–1062. [Google Scholar] [CrossRef]
  51. Heiland, G. Surface conductivity of semiconductors and its variation by adsorption, transverse electric fields and irradiation. Discuss. Faraday Soc. 1959, 28, 168–182. [Google Scholar] [CrossRef]
  52. Rao, S.N.; Manissero, D.; Steele, V.R.; Pareja, J. A Systematic Review of the Clinical Utility of Cycle Threshold Values in the Context of COVID-19. Infect. Dis. Ther. 2020, 9, 573–586. [Google Scholar] [CrossRef]
Figure 1. Sensor preparation. (a) Preparing a fabricated ITO-coated glass slide (20 mm long and 10 mm wide) with a coating thickness of 122 ± 5 nm as the sensor. (b) Pipetting 5 μL of the sample over the slide. (c) Sandwiching the sample with the help of another slide. (d) Measuring the change in resistance of the sensor based on binding between the sample and the transducer.
Catalysts 11 00191 g001
Figure 2. (a) The scanning electron microscopy (SEM) micrograph of the ITO surface coated on the glass slide. (b) The SEM maps for indium. (c) The SEM maps for oxygens showing the uniform distribution of the atoms on the substrate. (d) The atomic force microscopy (AFM) image of the ITO thin film showing the surface roughness with the root mean square (RMS) height of ~5 nm and the mean spacing of ~180 nm.
Catalysts 11 00191 g002
Figure 3. The schematic circuit used for resistance and current measurements of the sensor including a voltage divider circuit with a known resistor and an analog-to-digital converter (ADC) or microcontroller with a USB interface.
Catalysts 11 00191 g003
Figure 4. The variation of semiconductor sensor’s surface resistance (response function) using different samples.
Catalysts 11 00191 g004
Figure 5. Calibration curves for the response function of the severe acute respiratory syndrome coronavirus 2 (SARS-CoV-2) antibodies in PBS diluted in aqueous BSA solution (blue points and curve) and in FBS (orange points and orange curve).
Catalysts 11 00191 g005
Figure 6. (a) The O 1s spectra shows that coating the antibody-spiked BSA on the ITO surface causes a large decrease in the SiOs. (b) The presence of the hydroxyl groups for pure ITO on glass and BSA coated on the ITO surface is indicated by the SnO peak. (c) The C 1s spectra represents the carboxylic groups on the ITO surface in the presence of BSA and the antibody-spiked BSA. (d) The S 2p spectra for ITO with the antibody spiked BSA coated on the ITO surface.
Catalysts 11 00191 g006
Figure 7. The proposed catalytic reactions on the ITO surface: (a) The reaction of the BSA on the surface of ITO is due to the reaction of hydroxyl groups with the C=O bond (SnOC = O). (b) Adding the antibody in BSA to the surface of the ITO results in the conjugation of the antibody protein. (c) The protons on the surface of the ITO, react with the antibody’s S-S bonds close to the surface. (d) Breaking S-S bonds in antibody to -SH and R-S+ due to denaturation of antibody by catalytic reactions of the remaining hydroxyl groups on the surface. This results in the creation of thiolate anion (R-S) due to the chemical reaction of thiol with a water molecule on the surface. (e) The antibody approaches the Sn atom on the ITO surface through R-S after formation of thiolate anion. (f) The proton from hydroxyl groups on the surface moves to thiolate anion in the antibody. (g) Generating the negative charges on the surface of the ITO decreases the surface resistance of the ITO.
Catalysts 11 00191 g007
Figure 8. The charge transfer scheme in polypeptide chains in antibodies. (a) IgG antibodies with 16 disulfide bonds, the carboxylic groups at the C-terminal end, and the α-amino groups ( NH 3 + ) at the N-terminal end of the polypeptide. (b) Due to conjugating antibodies with BSA molecules on the surface of the ITO, protons from NH 3 +   groups   of a polypeptide in the antibody migrate to BSA. Disulfide bonds also break and get reduced to R-SH and R’-S+ bonds. (c) The protons from the C-terminal end of the polypeptide chain migrate through the amino acid sequences until they reach to the N-terminal end of the antibody. The antibody is polarized due to proton hopping in a polypeptide chain. (d) The protons transfer from the R-SH bonds to the adjacent polypeptide chains and the thiols change to thiolate anions (R-S). The R-S on the antibody approaches the Sn on the ITO surface. The protons from the hydroxyl groups on the surface move to the thiolate anions in the antibody. This generates electrons on the surface that results in increasing the surface conductivity.
Catalysts 11 00191 g008
Figure 9. The schematic representation of the process for pathogen detection in samples from humans. (a) Sample is derived from the patient’s blood or other body fluids. (b) The schematic representation of the presence and immobilization of different biomarkers in the sample taken from the patient. (c) The specific bindings of different analytes to the sensor take place by using a multichannel transducer; a separate channel for each biomarker. (d) The response from the transducer is then transferred to the detector where the data are amplified and analyzed.
Catalysts 11 00191 g009
Publisher’s Note: MDPI stays neutral with regard to jurisdictional claims in published maps and institutional affiliations.

