Abstract
Hydrodeoxygenation (HDO) is one of the promising catalytic routes for converting biomass derived molecules to high value products. A key step of HDO is the cleavage of an aromatic C–O bond to accomplish the deoxygenation step, however, which is energetically unfavorable. Herein, we report a series of palladium (Pd)-incorporated α-phase of molybdenum carbide (α-MoC) mesoporous composites for enhanced HDO activity of a biomass model molecule, anisole. The catalysts, x%Pd/α-MoC (x% is the molar ratio of Pd/Mo), were investigated by X-ray diffraction (XRD), temperature programmed reduction (TPR), temperature programmed desorption (TPD), Brunauer–Emmett–Teller (BET), Raman, transmission electron microscopy (TEM), and X-ray photoelectron spectroscopy (XPS) techniques. Pd is highly dispersed on α-MoC when x% ≤ 1%, but aggregate to form nanoparticles when x% = 5%. The x%Pd/α-MoC catalysts (x% ≤ 1%) show enhanced HDO activity in terms of turnover frequency (TOF) and apparent activation energy barrier (Ea) compared with α-MoC and β-Mo2C catalysts. The TOF of 1%Pd/α-MoC catalyst at 160 °C is 0.115 h−1 and the Ea is 48.2 kJ/mol. Moreover, the direct cleavage of aromatic C–O bond is preferred on 1%Pd/α-MoC catalyst. The enhanced HDO activity is attributed to superior H2 dissociation ability by the highly dispersed Pd sites on carbide. This work brings new insights for rational design of the catalyst for selective C–O bond activation.
1. Introduction
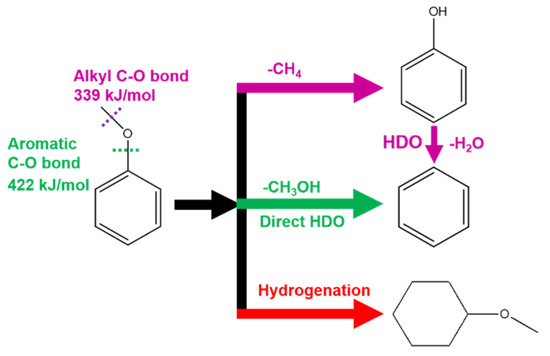
Energy demand and increasingly environmental concerns push the society to explore clean and renewable energy stock as an alternative to fossil fuels [1]. Biomass is an earth abundant and sustainable resource and one of the promising solutions to current energy and environmental challenges. Among common biomass stocks, lignocellulose derivatives can be upgraded to valuable products such as biofuels and chemical intermediates by catalytic removal of the oxygen-containing functional group [2,3,4,5]. A key step of the catalytic process is hydrodeoxygenation (HDO) reaction which has been widely studied in recent years [6,7]. The dissociation and cleavage of aromatic C–O bond is an essential step in HDO, but unfortunately unfavorable in energetics because the bond energy of aromatic C–O bond (422 kJ/mol) is much higher than that of alkyl C–O bond (339 kJ/mol) [8]. As the result, the alkyl C–O bond cleavage usually occurs prior to aromatic C–O bond dissociation upon catalytic condition in a practical HDO process, despite the cleavage of the alkyl C–O bond not being needed for HDO of oxygen containing aromatic compounds (Scheme 1). Therefore, a rational design of catalyst to selectively dissociate aromatic C–O bond for direct HDO pathway is a necessary but challenge quest regarding to fundamental research in catalysis.
Scheme 1.
Hydrodeoxygenation (HDO) pathways of anisole on Pd/α-MoC catalysts.
Commonly used HDO catalysts are inspired from the petroleum refining industry catalysts such as supported metal, metal sulfides, carbides, nitrides and phosphides. [6,7,8,9,10] Among those catalysts, molybdenum carbide has been recognized for its unique catalytic activities in C–H and C–O bonds activation such as green chemistry [11,12,13,14,15], hydrogen production [16,17,18,19,20,21], water splitting [22], and electro-catalysis [23,24] in recent decades. The catalytic performance of carbide catalyst can be regulated by controlling the surface catalytic sites by means of transition metal modification, tuning the geometry of the active site, defect engineering and synergetic effect between different catalytic sites [25,26,27,28,29,30,31]. Lee and Chen et al. reported high selectivity of Mo2C catalyst for C–O cleavage over deep hydrogenation to produce cyclohexane in vapor phase HDO of anisole to benzene at low temperature and ambient pressure [32,33]. Furthermore, they showed that the active sites on carbide for H2 dissociation are indeed different from the sites for C–O bond cleavage [32]. Baddour et al. adopted transition metals such as Pt and Ni to modify Mo2C for enhancing hydrogenation activity of deoxygenation of guaiacol, and, nonetheless, this leads to the formation of cyclohexane as byproduct through deep hydrogenation [34]. It was demonstrated that a balance between the hydrogenation and deoxygenation can be achieved by catalyst design.
In this work, we incorporate palladium (Pd) to molybdenum carbide (MoC) catalysts to enhance the HDO activity of anisole to benzene with Pd/Mo molar ratio x% = 0.05–5%. The x%Pd/α-MoC catalysts were prepared and characterized, suggesting Pd sites are highly dispersed on α-MoC when x% ≤ 1 but aggregate to form nanoparticles when x% = 5%. The x%Pd/α-MoC catalysts (x% ≤ 1%) show enhanced HDO activity in terms of turnover frequency (TOF) to benzene and activation energy barrier (Ea) compared with bare MoC matrix, while 5%Pd/α-MoC catalyst exhibits hydrogenation activity (Scheme 1). Moreover, the direct HDO route is promoted to be the main pathway (94%) on 1% Pd/α-MoC catalyst, indicating the aromatic C–O bond is substantially selectively dissociated other than the alkyl C–O bond. The enhanced direct HDO activity is attributed to the highly dispersed Pd. This work reports a new strategy to design a HDO catalyst focusing on aromatic C–O bond cleavage, and brings insights for rational design of the catalyst for selective C–O bond activation.
2. Results and Discussion
2.1. Synthesis and Characterization of Pd/α-MoC Catalysts
The x%Pd/α-MoC catalysts were prepared by temperature programed carburization (TPC) of Pd/MoO3 oxide precursor (see details in Materials and Methods). The crystal phase transformation from oxide to carbide via TPC treatment is clearly shown by X-ray diffraction (XRD) in Figure 1. All Pd/MoO3 precursors exhibit a typical MoO3 diffraction pattern (powder diffraction file PDF No. 05-0508) without evidence for Pd or PdO diffraction peaks before TPC treatment (Figure 1a), indicating the Pd is highly dispersed in the primitive oxide precursors. After the TPC process, all Pd/α-MoC catalysts with Pd/Mo atomic ratio 0.05–5% follow a typical α-MoC diffraction pattern [17,18]. There are no Pd or PdO diffraction peaks in Pd/α-MoC series catalysts either. Therefore, Pd species are incorporated into α-MoC matrix without major change to the crystal phase of α-MoC. It is also noticed that β-Mo2C was obtained from MoO3 precursor by the same TPC protocol but preparation of α-MoC from MoO3 requires TPC in an ammonia atmosphere as discussed in literature [35,36]. Thus, the presence of Pd species is crucial for the phase transformation from MoO3 oxide to α-MoC.
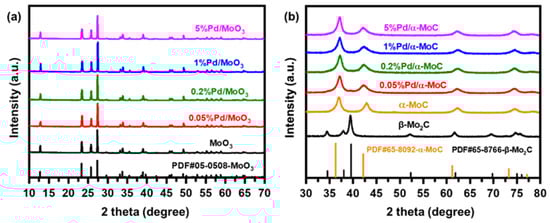
Figure 1.
X-ray diffraction (XRD) patterns of (a) Pd/MoO3 precursors and (b) corresponding x%Pd/α-MoC catalysts after the temperature programed carburization (TPC) process.
The authentically Pd/Mo molar ratio was examined by inductively coupled plasma optical emission spectrometry (ICP-OES) as summarized in Table 1. The Pd/Mo ratio trend is consistent in terms of nominal value. As shown in Figure 2, the bands at 661, 819 and 991 cm−1 are observed on Raman spectra for all catalysts, which are consistent with characteristic bands of carbide [23]. Moreover, there is no spectrum band found at 1350 and 1580 cm−1, which are usually considered as D and G bands of surface graphitic carbon, respectively [37]. This excludes the formation of extra coke on the surface of catalyst after TPC treatment, suggesting the surface of catalyst is free of graphitic coke formation.

Table 1.
Surface properties and quantification element analysis of Pd/α-MoC catalysts.
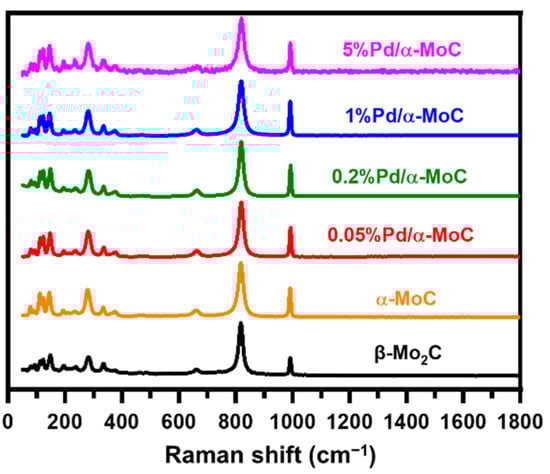
Figure 2.
Raman spectra of α-MoC, β-Mo2C and x%Pd/α-MoC catalysts with excitation laser of 532 nm.
The presence status of Pd in the 1%Pd/α-MoC catalyst was examined by high-resolution transmission electron microscopy (HR-TEM) in Figure 3. The 1%Pd/α-MoC catalyst exhibits mesoporous structure consistent with N2 adsorption result (Table 1). The lattice fringes were measured to be 2.45 Å in Supplementary Materials Figure S1 and assigned to (111) crystal plane of α-MoC. Selected area electron diffraction (SAED) of the catalyst nanoparticle shows diffraction spots in the cubic crystal system (Figure 3b). The diffraction rings are labeled in a dashed line, with the measured radius of 2.14, 1.51 and 1.06 Å, respectively, which are further assigned to (200), (220) and (400) lattice plane of α-MoC (Table S1). The SAED result is consistent with diffraction pattern from powder XRD, confirming the formation of α-MoC phase. The element dispersion in the catalyst nanoparticle was demonstrated by energy-dispersive X-ray spectroscopy (EDS) element mapping in Figure 3c. The high angle angular dark field (HAADF) image of the catalyst was captured firstly, then the EDS spectra on Pd and Mo were record from the catalyst nanoparticle in the microscope. The dispersion of Pd and Mo are visualized as well as HAADF image. It is clearly observed that the Pd species are evenly dispersed in the catalyst with Mo without formation of individual Pd nanoparticles.
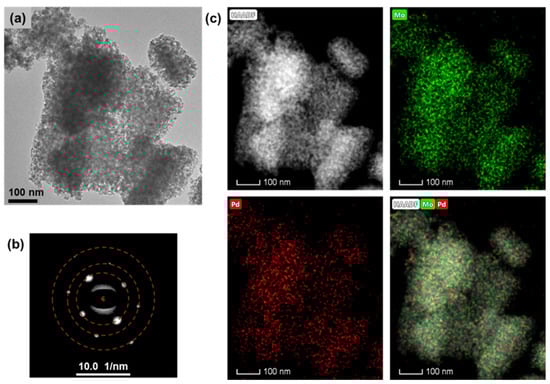
Figure 3.
Transmission electron microscopy (TEM) analysis of 1%Pd/α-MoC catalyst. (a) TEM image under bright field, (b) corresponding selected area diffraction (SAED) analysis of catalyst, and (c) image in dark field combined with element mapping of Pd and Mo of 1%Pd/α-MoC catalyst.
The result of a similar TEM analysis on 5%Pd/α-MoC catalyst unveils the status of Pd in the 5%Pd/α-MoC catalyst in Figure S2 and Table S2. The 5%Pd/α-MoC catalyst also exhibits mesoporous structure. By EDS analysis for the whole nanoparticle in red dash box in area #1 of Figure S2, the Pd/Mo atomic ratio in the nanoparticle is 5.5%, which is considered as the bulk ratio of Pd/Mo in the catalyst. However, intensive bright spots of small nanoparticles under dark field are found in the catalyst (Figure S2, spots marked in red cycle in #2–4). Further quantitative analysis by EDS on the bright nanoparticles shows that local Pd/Mo atomic ratio is 68.0%, 16.3% and 11.5%, respectively, for spots #2–4. These Pd/Mo ratios are much higher than the overall bulk Pd/Mo ratio of 5.5%. This result confirms the aggregation of Pd and the presence of Pd nanoparticles in the 5%Pd/α-MoC catalyst. The lack of a diffraction pattern of Pd nanoparticles in the XRD result of Figure 1 is attributed to the small size and relatively poor crystalline structure of nanoparticle. Recently, Ma et al. studied a similar Pd/α-MoC catalyst by in situ techniques and a theoretical method to reveal the high density and single atom dispersed Pd on α-MoC matrix [38]. They observed the infiltration of Pd nanoparticles into α-MoC by in situ STEM during the TPC program. They also checked the coordination environment of Pd by extended X-ray absorption fine structure (EXAFS) to support the single atom dispersion despite the atomic number of Mo and Pd are too close to be clearly distinguished by Fourier transformed (FT) EXAFS. Their result is consistent with the 1%Pd/α-MoC catalyst but differs in the case of 5%Pd/α-MoC in this work. The difference on status of Pd between literature and 5%Pd/α-MoC catalyst is attributed to different TPC protocols and initial oxide precursors.
The surface features of catalysts were studied by N2 physical adsorption, and temperature programmed techniques. The nitrogen adsorption-desorption isotherms of the catalysts are shown in Figure S3, and the relevant analysis results are summarized in Table 1, including the specific surface areas by the Brunauer–Emmett–Teller (BET) method and porous texture information by the Barrett–Joyner–Halenda (BJH) method. The surface areas of x%Pd/α-MoC catalysts with Pd/Mo ratio x = 0.05%, 0.2% and 1% are 67.2–73.9 m2/g, which are higher than that of β-Mo2C (29.2 m2/g) obtained by the same TPC pretreatment. The average pore size of the catalysts of x = 0.05–1% are 8.7–9.1 nm, suggesting micropores structure in the catalysts. On the other hand, the surface area of 5%Pd/α-MoC is 50.8 m2/g and the pore size is 12.2 nm, implying the mesostructure of 5%Pd/α-MoC is different from 0.05–1%Pd/α-MoC catalysts.
The surface reactivity of the catalysts was investigated by temperature programmed reduction (H2-TPR) and desorption (H2-TPD) (Figure 4). As shown in Figure 4a, the H2-TPR patterns of x%Pd/MoO3 oxide precursors show a major reduction peak at 280 °C, which is much higher than the reduction temperature of PdO but much lower than the reduction temperature of MoO3 at approximately 700 °C (Figure S4) [39,40]. The areas of the major reduction peak of all catalysts are similar, which are independent of Pd concentration of the catalysts. Thus, the peak at 280 °C is assigned to reduction of Mo cations around Pd sites rather than direct reduction of PdO nor MoO3 regarding the presence of Pd sites in the catalyst can readily promote H2 dissociation and boost the reduction reaction. Nevertheless, a minor negative peak could be found at 82 and 74 °C on 1% and 5%Pd/α-MoC catalyst, respectively. It is due to H2 desorption on Pd nanoparticles, suggesting Pd nanoparticles are formed in these two samples upon TPR condition [39,40].
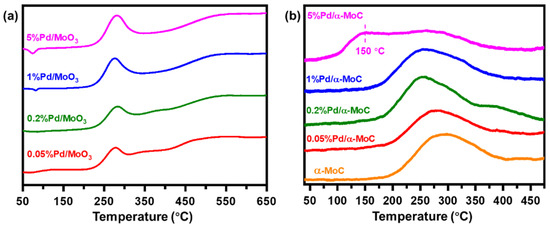
Figure 4.
Temperature programmed studies of Pd/α-MoC catalysts. (a) H2-TPR (temperature programmed reduction) pattern of Pd/MoO3 precursors. (b) H2-TPD (temperature programmed desorption) of Pd/α-MoC catalysts.
On the other hand, the H2-TPD results of the x%Pd/α-MoC catalysts are shown in Figure 4b and Table 1. There is also one major peak observed on x%Pd/α-MoC catalysts with x = 0.05–5% at 250–300 °C due to H2 desorption, which are assigned to H2 adsorbed on carbide. Note that there is a broad desorption peak at 150 °C on 5%Pd/α-MoC catalyst, which is not found on x%Pd/α-MoC catalysts with x ≤ 1%. The desorption pattern of 5%Pd/α-MoC catalyst is further deconvoluted in Figure S5, showing the component at 150 °C contributes 29% of overall H2 desorbed. This peak has been reported in literature for the catalyst containing Pd nanoparticles and further interpreted as the H2 desorbed from metallic Pd nanoclusters or nanoparticles [41,42,43]. It not only suggests that the presence of metallic Pd nanoparticles in 5%Pd/α-MoC catalyst, but also excludes the formation of Pd nanoparticles in 0.05–1%Pd/α-MoC catalysts for its absence in corresponding H2-TPD results. Based on the understanding of TPR and TPD results, it is deduced that Pd species in Pd/MoO3 precursor aggregate to form nanoparticles in 1% and 5%Pd/α-MoC catalysts during the reduction program. However, after the TPC program, Pd in the 1%Pd/α-MoC catalyst redispersed into α-MoC matrix to form highly dispersed sites, whereas nanoparticles are excluded by H2-TPD [38]. H2-TPD also suggests the presence of Pd nanoparticles in 5% Pd/α-MoC, which has been confirmed by TEM analysis.
The chemical state of the 1%Pd/α-MoC catalyst was studied by X-ray photoelectron spectroscopy (XPS) in Figure 5 and Figure S6. The C 1s, Mo 3d and Pd 3d spectra are deconvoluted and the deconvolution parameters are summarized in Table S3 [11]. The C 1s spectrum is deconvoluted to two main components, carbide C 1s at 283.5 eV and environmental C 1s at 284.6 eV despite two minor oxidized C 1s components at 286.2 eV and 288.9 eV. The Mo 3d spectrum is deconvoluted to four pairs components, which are assigned to carbide and oxides. This confirms the surface chemistry of α-MoC and also suggests that the surface of the catalyst is passivated by oxide layer as the preparation protocol. Pd 3d spectrum is deconvoluted to two pairs of components, with Pd 3d5/2 at 336.0 and 337.3 eV, respectively. The Pd 3d5/2 at 336.0 eV is attributed to highly dispersed Pd on α-MoC [38] while the Pd 3d5/2 of 337.3 eV is assigned to surface oxidized Pd. It is proposed that since the catalyst was pretreated in a reductive condition during the carburization program, the binding energy of Pd 3d5/2 is close to but slightly higher than metallic (335.0 eV) Pd due to electron transfer from Pd to α-MoC [38].
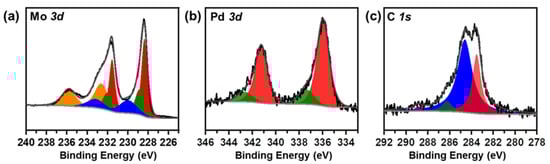
Figure 5.
X-ray photoelectron spectroscopy (XPS) spectra of 1%Pd/α-MoC catalyst at (a) Mo 3d, (b) Pd 3d and (c) C 1s.
2.2. Hydrodeoxygenation (HDO) Performance of Pd/α-MoC Catalysts
As shown in Figure 6a, the vapor phase HDO activity of 1%Pd/α-MoC catalyst is compared with 5%Pd/α-MoC catalyst in terms of stability test under similar conversion levels at 30–40% through controlling the usage of each catalyst [44]. 1%Pd/α-MoC catalyst exhibits good activity toward the selective production of benzene at a reaction temperature as low as 160 °C, which is slightly above the boiling point of anisole (153.6 °C). Benzene is the primary product with a selectivity as high as 96%, while minor amount of cyclohexane is produced with 4% selectivity. No other byproduct such as phenol or methoxycyclohexane is detected, suggesting the HDO route dominates the 1%Pd/α-MoC catalyzed reaction. As a striking contrast, the selectivity to benzene over 5%Pd/α-MoC catalyst is only 30–40%, which is remarkably lower than that over 1%Pd/α-MoC catalyst. The main product is methoxycyclohexane with a selectivity of ca. 50%, while a minor product of cyclohexane with a selectivity of ca. 9%. It suggests that direct hydrogenation to aromatic ring serves as the predominant reaction pathway rather than HDO on 5%Pd/α-MoC catalyzed reaction, which is attributed to the catalytic contribution of aggregated Pd nanoparticles to the hydrogenation over 5%Pd/α-MoC catalyst. It has been reported by Tan et al. on the HDO of anisole over supported metal catalyst that the hydrogenation prefers to occur on metallic nanoparticles sites rather than the catalytic HDO route [45]. It has also been realized that the activities and selectivities for HDO reactions depends on the nature and chemical state of metal sites. For example, the HDO experiment on the SiO2 supported Pt and Ni catalyst shows that there are mainly hydrogenation products of 3-methylcyclohexanone and 3-methylcyclohexanol [45]. The overwhelming hydrogenation product on 5%Pd/α-MoC catalyst also suggests that the highly dispersion of Pd sites is crucial for the HDO selectivity, otherwise the aggregated Pd nanoparticles will lead to hydrogenation reaction route. In other words, the missing hydrogenation products in the 1%Pd/α-MoC catalyst hints that there is no Pd nanoparticles in the catalyst with Pd concentration ≤1%.
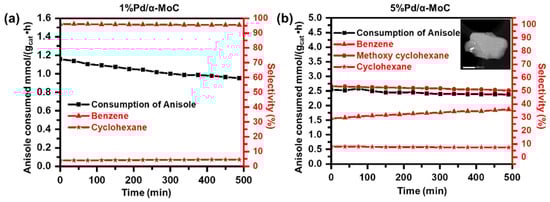
Figure 6.
Catalytic performance Pd/α-MoC catalysts for anisole HDO on the stream of time at 160 °C in terms of anisole consumption rate (black) and product selectivities (red). (a) 1%Pd/α-MoC, (b) 5%Pd/α-MoC catalyst (with insert TEM image for Pd nanoparticle on α-MoC with a scale bar of 500 nm).
With the selectivities to benzene of all catalysts are no less than 94%, the intrinsic catalytic activity of various catalysts in vapor phase HDO reaction of anisole at 160–200 °C was evaluated in kinetics controlled regime (conversion <20%) as shown in Figure 7 and Figure S7. The TOF of α-MoC and β-Mo2C catalysts is 0.00666 and 0.00466 h−1, respectively. The results are consistent with the literature reported value [32,46]. TOFs of the x%Pd/α-MoC catalysts are higher than that of pure-phase α-MoC and β-Mo2C catalysts (Table S4). It is noticed that the TOF of 1%Pd/α-MoC catalyst is 0.115 and 0.355 h−1 at 160 and 200 °C, respectively. It is the best performance among all tested catalyst. On the other hand, apparent activation energy barriers (Ea) of pure phase molybdenum carbide without Pd is 74.0–74.5 kJ/mol (Figure 7) [32,46]. The activation energy barrier is decreasing from 74 to 48 kJ/mol by the incorporation of Pd to carbide (Table S4). Again, 1%Pd/α-MoC catalyst shows the lowest Ea (48.2 kJ/mol) among all catalysts, and furthermore better than the TOF and Ea results of α-MoC and β-Mo2C catalyst at similar temperature in literature (see comparison in Table S5), which is 0.0028–0.026 h−1 and 67.8–75.8 kJ/mol, respectively [32,46]. Moreover, the catalyst working under similar temperature (lower than 200 °C) are very limited in literature. It also suggests the HDO activity of our catalyst is superior since the reaction temperature is much lower than conventional cases. The enhancement of catalytic activity of x%Pd/α-MoC catalysts depends on the Pd doping concentration in the catalysts, suggesting incorporating Pd into carbide does readily promote HDO activity of α-MoC.
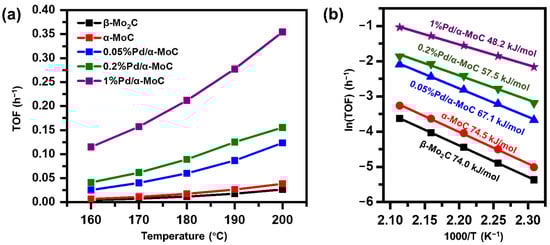
Figure 7.
Kinetics study of Pd/α-MoC catalysts in terms of (a) reaction turnover frequency and (b) apparent activation energy barrier.
The stability of x%Pd/α-MoC catalysts in the HDO of anisole at 160 °C was evaluated at controlled conversion of 20–40% as shown in Figure 8. The catalysts exhibit good stability and high selectivity to benzene on the stream of time. The productivity of 1%Pd/α-MoC catalyst is significantly higher than others. Minor activity loss is observed while the selectivity to benzene maintains higher than 94% for all tested catalysts. The x%Pd/α-MoC catalysts after reaction were also examined by XRD and Raman in Figure S8. There is no crystal phase change after the reaction, nor extra coke deposition found on the surface of catalysts, suggesting good stability of the Pd/α-MoC catalysts for HDO.
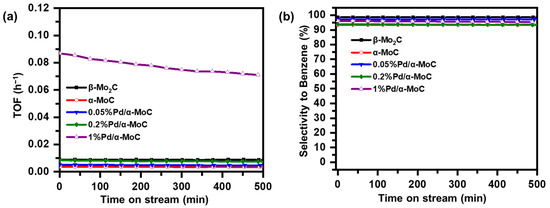
Figure 8.
Stability study of Pd/α-MoC catalysts on time of stream at 160 °C. (a) Productivity to benzene and (b) selectivity to benzene.
The reaction route was further analyzed for the C1 molecule product distribution in terms of CH3OH/(CH3OH+CH4) ratio, considering CH3OH is the demethoxyl product while CH4 is the demethyl product as shown in Scheme 1. The ratio of CH3OH/(CH3OH+CH4) reflects the fraction of direct HDO route in the overall HDO reaction [32]. The higher ratio of CH3OH/(CH3OH+CH4) suggests the better direct HDO selectivity for aromatic C–O bond cleavage. As shown in Figure 9, the direct HDO selectivity of α-MoC and β-Mo2C is 59% and 67%, respectively. The mediocre direct HDO preferences of α-MoC and β-Mo2C are consistent with the values reported in literature [32]. By introducing Pd into the carbide matrix, the proportion of methanol gradually was elevated as the increasing of Pd concentration, suggesting the direct HDO pathway is enhanced gradually. It is also noticed that the selectivity to methanol of 1%Pd/α-MoC is about 94%, which proves that the reaction pathway is optimal through the direct cleavage –OCH3 of anisole to generate benzene. Therefore, the hypothesis that integrating Pd sites into α-MoC could tune the HDO activity is successfully proofed in the 1%Pd/α-MoC catalyst for the high direct HDO contribution.
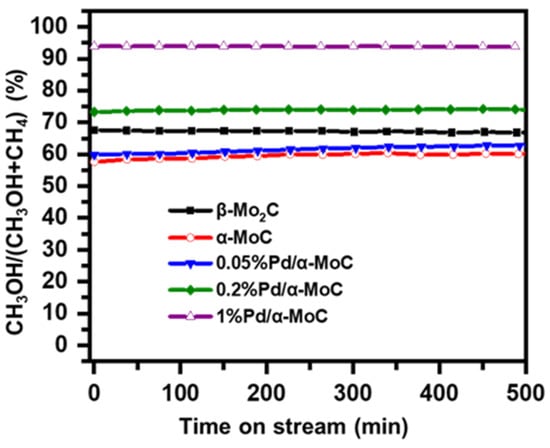
Figure 9.
Reaction pathway analysis on Pd/α-MoC catalysts at 160 °C for demethoxyl product fraction CH3OH/(CH3OH+CH4).
To further study the role of Pd played in the direct HDO preference, H-D exchange rate and reaction order of H2 pressure were investigated. The H2 dissociation ability was firstly studied by H-D exchange rate as shown in Figure 10a. 0.2 g of various catalysts were tested under the same method. The signal of m/z = 3 stands for molecule HD produced by H-D exchange was monitored by an on-line mass spectrometer [47]. The H–D signal is 0.13 × 10⁻⁷ cps on α-MoC, indicating a relative weak H–H bond dissociation ability. The H–D exchange rate is increased significantly by incorporating Pd into α-MoC. 1%Pd/α-MoC exhibits the highest H–D exchange rate (5.0 × 10⁻⁷ cps at 50 min) among all HDO catalysts. It confirms the 1%Pd/α-MoC catalyst has the highest ability to activate molecule hydrogen, providing the opportunity for the optimal HDO performance among all catalysts. Moreover, the order of hydrogen partial pressure to the reaction rate was examined in Figure 10b since activity of Pd sites towards H2 dissociation is proposed to be the key factor to enhance the HDO activity. The reaction order of hydrogen partial pressure to the reaction rate of α-MoC and 1%Pd/α-MoC is 0.45 and 0.50, respectively. Both results could be considered as ½ order for H2 partial pressure in the rate equation [32]. Therefore, no significant difference is found between 1%Pd/α-MoC and α-MoC for the role of H2 played in the HDO pathway. It can be inferred that the HDO on α-MoC and Pd/α-MoC catalysts follows the same reaction pathway from the view of H2; in other words, the introduction of Pd does not change the reaction pathway; the enhanced HDO activity benefits from the boosted hydrogen dissociation step. The results show that the synergy effect between Pd sites (for H–H dissociation) and α-MoC sites (for C–O bond cleavage) leads to the lowest apparent activation energy and the highest TOF among all catalysts.
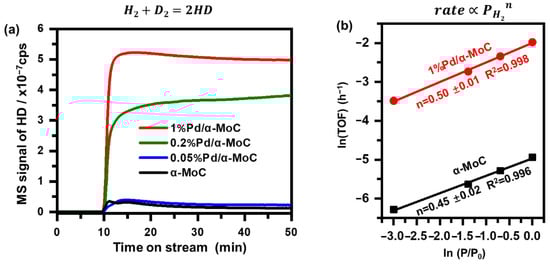
Figure 10.
H2 participation in the HDO reaction. (a) H–D exchange rate comparison of α-MoC and Pd/α-MoC catalysts. H2-D2 mixture feed was switched on at time = 10 min. (b) reaction order of H2 partial pressure to TOF of 1%Pd/α-MoC and α-MoC at 160 °C.
2.3. Dicussion on the HDO Performance of Pd/α-MoC Catalysts
For a reaction following the Langmuir–Hinshelwood mechanism, two reactant molecules are adsorbed on the surface catalytic sites and then activated respectively [44]. We demonstrated that the synergy between two sets of active sites (Ru1 and Ni1 sites on ceria) can promote catalytic activity for CH4 reforming with CO2 [48]. The synergy effect is originated from different roles of Ru1 sites and Ni1 sites played in the reforming reaction, whereas Ru1 sites prefer to activate CO2 to CO while Ni1 sites dissociate the C–H bond of CH4 synergistically. Regarding both H2 dissociation and C–O bond cleavage are requested in HDO reaction, a dedicated HDO catalyst should be able to accomplish both elementary surface reaction efficiently, otherwise multiple-step HDO reaction or side reaction of hydrogenation could occur (as shown in the purple and red route in Scheme 1, respectively). Therefore, it is proposed to design a catalyst for desired aromatic C–O bond cleavage for HDO by integrating two kinds of catalytic sites working for C–O cleavage and H–H bond dissociation, respectively. In this work it is proposed to improve the catalytic HDO activity through boosting the hydrogen dissociation activity by incorporating highly dispersed Pd sites to molybdenum carbide matrix with high HDO selectivity. The collaboration between Pd sites and the MoC matrix is demonstrated by catalytic performance in terms of TOF and Ea, and further convinced by H–D exchange experiment. This work brings the opportunity to balance the hydrogenation and deoxygenation aspects of HDO activity. An optimal solution is expected to accomplish the goal of direct HDO of biomass molecules.
3. Materials and Methods
3.1. Materials and Synthesis
Materials: All chemicals are used as received without any purification. Anisole (99%) was purchased from Aladdin (Shanghai, China). Ammonium molybdate (99%) was purchased from Macklin (Shanghai, China) and palladium nitrate (product number 205761) was purchased from Sigma-Aldrich CN (Shanghai, China). All gases are purchased from Linde Industrial Gases CN (Shanghai, China) with purity higher than 99.99% unless notified.
Synthesis of Pd/MoC catalysts: The catalysts were synthesized following a temperature-programmed carburization (TPC) procedure similar to literature [34]. A typical procedure for 1%Pd/α-MoC catalyst is briefly introduced as follows. The oxide precursor (Pd/MoO3) of the Pd/α-MoC catalyst was firstly obtained by co-precipitation method. 3.0 g of ammonium molybdate was dissolved in 10 mL of water, and 3.92 mL of aqueous solution of palladium nitrate (10 mg/mL) was added under stirring. After stirring for 10 h at room temperature (25 °C), The mixture containing precipitation was dried using a water bath at 80 °C, followed by drying at 110 °C in a vacuum oven for 12 h. The resulting powder was calcined in air at 500 °C for 4 h to obtain 1%Pd/MoO3 precursor. Then, 0.8 g of 1%Pd/MoO3 precursor was placed in a tube furnace and kept in 60 mL/min of 20% CH4/H2 flow. The heating program was kept at 5 °C/min for 120 min from 25 to 700 °C and then cooled naturally to room temperature. Finally, the gas feed was switched to O2 (12 mL/min, 5% in Ar) for 10 h to passivate the 1%Pd/α-MoC catalyst. According to the molar ratio of Pd/Mo, a series of catalysts with different Pd/Mo atomic ratios were prepared, which are named 0.05%Pd/α-MoC, 0.2%Pd/α-MoC, 1%Pd/α-MoC and 5%Pd/α-MoC. The percentage number stands for the atomic ratio of Pd to Mo.
β-Mo2C was obtained by the same protocol without using a Pd precursor, while α-MoC was prepared by ammonia assisted carburization as reported by literature [17,18].
3.2. Catalyst Characterization
The concentration of Pd in the catalysts were confirmed by ICP-OES on an iCAP7000 (Thermal-Fisher Scientific, Waltham, MA, USA). The ICP-OES experiment protocol is summarized as below. A certain amount of catalyst (30–100 mg, depends on the Pd concentration) was weighted and dissolved in 2 mL aqua regia, then diluted to 50 mL by deionized water. The standard solutions of Pd was prepared by using Pd(NO3)2 as precursor in 0.5wt% HNO3 with Pd concentration of 0.54–26.8 ppm. Similarly, the standard solution of Mo was prepared by (NH4)6Mo7O24·4H2O in 0.5wt% HNO3 with Mo concentration of 5.0–100 ppm. The spectrum line of 340.458 nm and 202.030 nm was selected to measure the element concentration of Pd and Mo, respectively. X-ray diffraction (XRD) was collected on a Smart Lab SE diffractometer (Rigaku, Tokyo, Japan) equipped with Cu Kα X-ray source and HyPix-400(H) detector. Transmission electron microscope (TEM) images and the energy-dispersive spectrum (EDS) were collected on FEI Talos F200S (FEI, Hillsboro, OR, USA). N2 adsorption experiments were performed on an ASAP 2020 (Micrometrics, Norcross, GA, USA). Temperature programed reduction and desorption were carried on an AutoChem II 2920 chemisorption apparatus (Micrometrics, USA). Raman spectra of the catalysts were recorded on a DXR2xi microscope spectrometer (Thermal-Fisher Scientific, USA) with an excitation laser of 532 nm. X-ray photoelectron spectrum (XPS) was collected on an ESCALAB 250 X-ray photoelectron spectroscopy equipped with Al Kα X-ray source (Thermal-Fisher Scientific, USA). XPS spectra were calibrated by contamination C 1s at 284.6 eV and deconvoluted [11].
3.3. Catalytic Experiment
The catalytic performance was evaluated in a fixed bed quartz tubular reactor with the inner diameter of 6 mm. Anisole was introduced to the quartz tube reactor by H2 flowing through a bubbling bottle containing liquid anisole kept at room temperature (25 °C) in an isothermal Dewar. The partial pressure of anisole can be obtained by the Antoine equation. We weighed 7–220 mg of catalyst and diluted it with 0.9 g quartz sand (30–40 mesh), then fixed it in the reaction tube with quartz wool. A K-type thermal couple coated with quartz shield was inserted into the catalyst bed to monitor the reaction temperature. The catalyst was pre-treated in a mixture of 42.5 mL/min H2 and 7.5 mL/min CH4 for 2 h at 590 °C before reaction. The outlet of the reactor and downstream tube connecting to the gas chromatogram (GC) was kept at 160 °C. The products were analyzed by an on-line chromatography (GC-2014, Shimazu, Japan) equipped with an auto-sampler, a Rt-Stabilwax-DA column (0.53 mm × 1 μm × 60 m) and a flame ionization detector (FID). The mass diffusion limitation under experiment condition is analyzed in Supporting Information (SI), suggesting that the reaction rate measured is not affected by mass diffusion [32]. The conversion of anisole, and selectivity to benzene are calculated as below equations [33].
The stability of the catalyst was also studied, and a reduced amount of catalyst was used to achieve the conversion less than 80%. Concentration of anisole and products were collected by the auto sampler once the gas composition of the reactor outlet was stable.
Kinetics studies of HDO reaction: in order to compare the intrinsic activities of the anisole HDO reaction on the Pd/α-MoC catalysts, activities in the kinetic-controlled regime in terms of turnover frequency (TOF) and activation energy barrier (Ea) were studied by control the conversion rate below 20% to eliminate the diffusion limitation [48]. The TOF is calculated by the equation below [49]. The mass of produced benzene was measured at the time when the product composition at the outlet was stabilized. Three consequence entries on GC were analysed to calculate the TOF. The derivation between three entries are less than 3%. The apparent activation energy barriers were obtained by corresponding Arrhenius plot [48]. The effect of H2 pressure was studied by measuring TOF under different H2 partial pressure [32].
H-D exchange rate was measured in a fixed bed micro reactor (inner diameter = 5 mm) as our reported method [47]. In the typical test, 0.2 g of catalyst was loaded and pretreated in N2 flow at 120 °C for 1 h, then it was cooled to 50 °C. The gas feed was switched to H2-D2 mixture (12 mL/min), while the signal of m/z = 3 for molecule HD was monitored by an on-line mass spectrometer (Hiden QGA) as the function of time.
4. Conclusions
In summary, a series of Pd incorporated α-MoC mesoporous catalysts for HDO have been proposed and synthesized by co-precipitation and temperature programmed carburization. The catalysts were characterized by ICP-OES, XRD, Raman, N2 adsorption, TPR, TPD, TEM and XPS techniques. Pd sites were highly dispersed in the catalyst with Pd/Mo ratio ≤1%, but aggregate to form nanoparticles in the catalyst with Pd/Mo = 5%. Catalytic activity of HDO of anisole to benzene was studied on Pd/α-MoC catalysts in kinetics controlled regime, suggesting Pd sites on α-MoC could increase the reaction TOF from 0.00666 to 0.115 h−1 and reduce the activation energy barrier from 74.5 to 48.2 kJ/mol, which are better than primitive carbide catalysts in this work and the literature. The benzene selectivities of all catalysts are as high as 94%. All catalysts exhibit good stability for anisole HDO on time of stream. Product analysis in terms of CH3OH/(CH3OH+CH4) suggests the presence of Pd sites readily tunes up the direct HDO pathway. The ratio of CH3OH/(CH3OH+CH4) on the 1%Pd/α-MoC catalyst is as high as 94%, suggesting optimal direct HDO preference over the demethyl route. The H–D exchange rate suggests that H–H dissociation rate is boosted by Pd sites. Reaction order of H2 partial pressure measurement shows that the molecule H2 dissociate and participate the HDO reaction in the same manner for 1%Pd/α-MoC and α-MoC catalysts. The enhanced activity and superior direct HDO priority are attributed to the synergy between Pd sites for H–H dissociation and the MoC catalyst for C–O bond dissociation. This work reports a new strategy to design a HDO catalyst focusing on aromatic C–O bond cleavage, and brings new insights for rational design of a catalyst for selective C–O bond activation. It is not only a successful case report for a catalyst integrated with two kinds of different catalytic sites synergistically, but also brings insight for a rational design of the catalyst for comprehensive catalysis task.
Supplementary Materials
The following are available online at https://www.mdpi.com/2073-4344/11/3/370/s1, including mass transfer analysis, Figure S1: Lattice fringes measured from 1%Pd/α-MoC catalyst, Figure S2: TEM and energy-dispersive X-ray spectroscopy (EDS) spectra of the 5%Pd/α-MoC catalyst, Figure S3: N2 adsorption desorption isotherm at −196 °C for Pd/α-MoC catalysts, Figure S4: H2-TPR pattern of MoO3 precursor, Figure S5: Deconvolution of H2-TPD pattern of 5%Pd/α-MoC catalyst, Figure S6: (a) Mo 3d and (b) C 1s XPS spectra for the Pd/α-MoC catalysts, Figure S7: Catalytic activity in kinetics control regime for Figure 7. (a) Conversion of anisole and (b) selectivity to benzene at 160–200 °C, Figure S8: Characterization of x%Pd/α-MoC catalysts after catalytic reaction. (a) XRD patterns and (b) Raman spectra, Table S1: Diffraction ring data of 1%Pd/α-MoC, Table S2: EDS analysis for 5%Pd/α-MoC catalyst, Table S3: XPS fitting parameters of 1%Pd/α-MoC catalyst, Table S4: Apparent energy barrier and turnover frequency (TOF) of x%Pd/α-MoC catalysts shown in Figure 7, Table S5 Activity comparison of 1%Pd/α-MoC catalyst with literature reported cases under similar condition.
Author Contributions
Conceptualization, Y.T.; Formal analysis, Y.Y., Y.D. and Y.T.; Funding acquisition, Y.T.; Investigation, Y.Y., X.L., Y.X. and X.G.; Writing—original draft, Y.Y., Y.D. and Y.T.; Writing—review and editing, Y.Y., Y.D. and Y.T. All authors have read and agreed to the published version of the manuscript.
Funding
This research was funded by the National Natural Science Foundation of China under grant Nos. 21902027 and U19B2003, Natural Science Foundation of Fujian Province under grant No. 2020J01443. TEM and XPS experiments were supported by Fuzhou University Testing Fund of Precious Apparatus (No. 2021T005).
Data Availability Statement
This study did not report any data.
Acknowledgments
Y.T. thanks Yufei Ma for technique support.
Conflicts of Interest
The authors declare no conflict of interest.
References
- Melero, J.A.; Iglesias, J.; Garcia, A. Biomass as renewable feedstock in standard refinery units. Feasibility, opportunities and challenges. Energy Environ. Sci. 2012, 5, 7393–7420. [Google Scholar] [CrossRef]
- Alonso, D.M.; Wettstein, S.G.; Dumesic, J.A. Bimetallic catalysts for upgrading of biomass to fuels and chemicals. Chem. Soc. Rev. 2012, 41, 8075–8098. [Google Scholar] [CrossRef] [PubMed]
- Li, C.; Zhao, X.; Wang, A.; Huber, G.W.; Zhang, T. Catalytic Transformation of Lignin for the Production of Chemicals and Fuels. Chem. Rev. 2015, 115, 11559–11624. [Google Scholar] [CrossRef] [PubMed]
- Robinson, A.M.; Hensley, J.E.; Medlin, J.W. Bifunctional Catalysts for Upgrading of Biomass-Derived Oxygenates: A Review. ACS Catal. 2016, 6, 5026–5043. [Google Scholar] [CrossRef]
- Meng, Q.; Hou, M.; Liu, H.; Song, J.; Han, B. Synthesis of ketones from biomass-derived feedstock. Nat. Commun. 2017, 8. [Google Scholar] [CrossRef]
- Jing, Y.; Dong, L.; Guo, Y.; Liu, X.; Wang, Y. Chemicals from Lignin: A Review of Catalytic Conversion Involving Hydrogen. Chemsuschem 2020, 13, 4181–4198. [Google Scholar] [CrossRef]
- Xia, Q.; Chen, Z.; Shao, Y.; Gong, X.; Wang, H.; Liu, X.; Parker, S.F.; Han, X.; Yang, S.; Wang, Y. Direct hydrodeoxygenation of raw woody biomass into liquid alkanes. Nat. Commun. 2016, 7. [Google Scholar] [CrossRef] [PubMed]
- Wang, H.; Male, J.; Wang, Y. Recent Advances in Hydrotreating of Pyrolysis Bio-Oil and Its Oxygen-Containing Model Compounds. ACS Catal. 2013, 3, 1047–1070. [Google Scholar] [CrossRef]
- Consuelo Alvarez-Galvan, M.; Campos-Martin, J.M.; Fierro, J.L.G. Transition Metal Phosphides for the Catalytic Hydrodeoxygenation of Waste Oils into Green Diesel. Catalysts 2019, 9, 293. [Google Scholar] [CrossRef]
- Blanco, E.; Dongil, A.B.; Escalona, N. Synergy between Ni and Co Nanoparticles Supported on Carbon in Guaiacol Conversion. Nanomaterials 2020, 10, 2199. [Google Scholar] [CrossRef] [PubMed]
- Schaidle, J.A.; Blackburn, J.; Farberow, C.A.; Nash, C.; Steirer, K.X.; Clark, J.; Robichaud, D.J.; Ruddy, D.A. Experimental and Computational Investigation of Acetic Acid Deoxygenation over Oxophilic Molybdenum Carbide: Surface Chemistry and Active Site Identity. ACS Catal. 2016, 6, 1181–1197. [Google Scholar] [CrossRef]
- Lin, Z.; Chen, R.; Qu, Z.; Chen, J.G. Hydrodeoxygenation of biomass-derived oxygenates over metal carbides: From model surfaces to powder catalysts. Green Chem. 2018, 20, 2679–2696. [Google Scholar] [CrossRef]
- Ren, H.; Chen, Y.; Huang, Y.; Deng, W.; Vlachos, D.G.; Chen, J.G. Tungsten carbides as selective deoxygenation catalysts: Experimental and computational studies of converting C3 oxygenates to propene. Green Chem. 2014, 16, 761–769. [Google Scholar] [CrossRef]
- Murugappan, K.; Anderson, E.M.; Teschner, D.; Jones, T.E.; Skorupska, K.; Roman-Leshkov, Y. Operando NAP-XPS unveils differences in MoO3 and Mo2C during hydrodeoxygenation. Nat. Catal. 2018, 1, 960–967. [Google Scholar] [CrossRef]
- Dongil, A.B.; Zhang, Q.; Pastor-Perez, L.; Ramirez-Reina, T.; Guerrero-Ruiz, A.; Rodriguez-Ramos, I. Effect of Cu and Cs in the beta-Mo2C System for CO2 Hydrogenation to Methanol. Catalysts 2020, 10, 1213. [Google Scholar] [CrossRef]
- Deng, Y.; Ge, Y.; Xu, M.; Yu, Q.; Xiao, D.; Yao, S.; Ma, D. Molybdenum Carbide: Controlling the Geometric and Electronic Structure of Noble Metals for the Activation of O-H and C–H Bonds. Acc. Chem. Res. 2019, 52, 3372–3383. [Google Scholar] [CrossRef]
- Yao, S.; Zhang, X.; Zhou, W.; Gao, R.; Xu, W.; Ye, Y.; Lin, L.; Wen, X.; Liu, P.; Chen, B.; et al. Atomic-layered Au clusters on alpha-MoC as catalysts for the low-temperature water-gas shift reaction. Science 2017, 357, 389. [Google Scholar] [CrossRef]
- Lin, L.; Zhou, W.; Gao, R.; Yao, S.; Ma, D. Low-Temperature hydrogen production from water and methanol using Pt/α-MoC catalysts. Nature 2017, 544, 80–83. [Google Scholar] [CrossRef]
- Vrubel, H.; Hu, X. Molybdenum Boride and Carbide Catalyze Hydrogen Evolution in both Acidic and Basic Solutions. Angew. Chem. Int. Ed. 2012, 51, 12703–12706. [Google Scholar] [CrossRef]
- Ma, Y.; Guan, G.; Hao, X.; Cao, J.; Abudula, A. Molybdenum carbide as alternative catalyst for hydrogen production—A review. Renew. Sustain. Energy Rev. 2017, 75, 1101–1129. [Google Scholar] [CrossRef]
- Lin, L.; Yu, Q.; Peng, M.; Li, A.; Yao, S.; Tian, S.; Liu, X.; Li, A.; Jiang, Z.; Gao, R.; et al. Atomically Dispersed Ni/alpha-MoC Catalyst for Hydrogen Production from Methanol/Water. J. Am. Chem. Soc. 2021, 143, 309–317. [Google Scholar] [CrossRef]
- Zou, X.; Zhang, Y. Noble metal-free hydrogen evolution catalysts for water splitting. Chem. Soc. Rev. 2015, 44, 5148–5180. [Google Scholar] [CrossRef]
- Fan, M.; Chen, H.; Wu, Y.; Feng, L.-L.; Liu, Y.; Li, G.-D.; Zou, X. Growth of molybdenum carbide micro-islands on carbon cloth toward binder-free cathodes for efficient hydrogen evolution reaction. J. Mater. Chem. A 2015, 3, 16320–16326. [Google Scholar] [CrossRef]
- Morales-Guio, C.G.; Stern, L.-A.; Hu, X. Nanostructured hydrotreating catalysts for electrochemical hydrogen evolution. Chem. Soc. Rev. 2014, 43, 6555–6569. [Google Scholar] [CrossRef] [PubMed]
- Wang, F.; Li, T.; Shi, Y.; Jiao, H. Molybdenum carbide supported metal catalysts (M-n/MoxC; M = Co, Ni, Cu, Pd, Pt)—Metal and surface dependent structure and stability. Catal. Sci. Technol. 2020, 10, 3029–3046. [Google Scholar] [CrossRef]
- Ge, Y.; Qin, X.; Li, A.; Deng, Y.; Lin, L.; Zhang, M.; Yu, Q.; Li, S.; Peng, M.; Xu, Y.; et al. Maximizing the Synergistic Effect of CoNi Catalyst on alpha-MoC for Robust Hydrogen Production. J. Am. Chem. Soc. 2020, 143, 628–633. [Google Scholar] [CrossRef]
- Sullivan, M.M.; Bhan, A. Acetone Hydrodeoxygenation over Bifunctional Metallic-Acidic Molybdenum Carbide Catalysts. ACS Catal. 2016, 6, 1145–1152. [Google Scholar] [CrossRef]
- Ma, Y.; Chen, M.; Geng, H.; Dong, H.; Wu, P.; Li, X.; Guan, G.; Wang, T. Synergistically Tuning Electronic Structure of Porous beta-Mo2C Spheres by Co Doping and Mo-Vacancies Defect Engineering for Optimizing Hydrogen Evolution Reaction Activity. Adv. Funct. Mater. 2020, 30. [Google Scholar] [CrossRef]
- Duong, N.N.; Aruho, D.; Wang, B.; Resasco, D.E. Hydrodeoxygenation of anisole over different Rh surfaces. Chin. J. Catal. 2019, 40, 1721–1730. [Google Scholar] [CrossRef]
- Pang, J.; Sun, J.; Zheng, M.; Li, H.; Wang, Y.; Zhang, T. Transition metal carbide catalysts for biomass conversion: A review. Appl. Catal. B-Environ. 2019, 254, 510–522. [Google Scholar] [CrossRef]
- Liu, W.; You, W.; Sun, W.; Yang, W.; Korde, A.; Gong, Y.; Deng, Y. Ambient-pressure and low-temperature upgrading of lignin bio-oil to hydrocarbons using a hydrogen buffer catalytic system. Nat. Energy 2020, 5, 759–767. [Google Scholar] [CrossRef]
- Lee, W.S.; Wang, Z.; Wu, R.J.; Bhan, A. Selective vapor-phase hydrodeoxygenation of anisole to benzene on molybdenum carbide catalysts. J. Catal. 2014, 319, 44–53. [Google Scholar] [CrossRef]
- Chen, C.-J.; Lee, W.-S.; Bhan, A. Mo2C catalyzed vapor phase hydrodeoxygenation of lignin-derived phenolic compound mixtures to aromatics under ambient pressure. Appl. Catal. A-Gen. 2016, 510, 42–48. [Google Scholar] [CrossRef]
- Baddour, F.G.; Witte, V.A.; Nash, C.P.; Griffin, M.B.; Ruddy, D.A.; Schaidle, J.A. Late-Transition-Metal-Modified beta-Mo2C Catalysts for Enhanced Hydrogenation during Guaiacol Deoxygenation. ACS Sustain. Chem. Eng. 2017, 5, 11433–11439. [Google Scholar] [CrossRef]
- Shi, C.; Zhang, A.; Li, X.; Zhang, S.; Zhu, A.; Ma, Y.; Au, C. Ni-modified Mo2C catalysts for methane dry reforming. Appl. Catal. A Gen. 2012, 431, 164–170. [Google Scholar] [CrossRef]
- Xu, W.; Ramirez, P.J.; Stacchiola, D.; Rodriguez, J.A. Synthesis of α-MoC1-x and β-MoCy Catalysts for CO2 Hydrogenation by Thermal Carburization of Mo-oxide in Hydrocarbon and Hydrogen Mixtures. Catal. Lett. 2014, 144, 1418–1424. [Google Scholar] [CrossRef]
- Yan, G.; Feng, X.J.; Khan, S.U.; Xiao, L.G.; Li, Y.G. Polyoxometalate and resin-derived P-doped Mo2C@N-carbon as highly efficient hydrogen evolution reaction catalyst in all pH. Chem. Asian J. 2018, 13, 158–163. [Google Scholar] [CrossRef]
- Liu, Y.; Ma, Y.; Ren, Y.; Zhou, Y.; Zhang, T. High-Density and Thermally Stable Palladium Single-Atom Catalysts for Chemoselective Hydrogenations. Angew. Chem. Int. Ed. 2020, 59, 21613–21619. [Google Scholar]
- Dobrezberger, K.; Bosters, J.; Moser, N.; Yigit, N.; Nagl, A.; Foettinger, K.; Lennon, D.; Rupprechter, G. Hydrogenation on Palladium Nanoparticles Supported by Graphene Nanoplatelets. J. Phys. Chem. C 2020, 124, 23674–23682. [Google Scholar] [CrossRef] [PubMed]
- Lu, Y.; Chen, W. Sub-nanometre sized metal clusters: From synthetic challenges to the unique property discoveries. Chem. Soc. Rev. 2012, 41, 3594–3623. [Google Scholar] [CrossRef]
- Amorim, C.; Keane, M.A. Palladium supported on structured and nonstructured carbon: A consideration of Pd particle size and the nature of reactive hydrogen. J. Colloid Interface Sci. 2008, 322, 196–208. [Google Scholar] [CrossRef]
- Khan, N.A.; Shaikhutdinov, S.; Freund, H.J. Acetylene and ethylene hydrogenation on alumina supported Pd-Ag model catalysts. Catal. Lett. 2006, 108, 159–164. [Google Scholar] [CrossRef]
- Yu, W.-Y.; Mullen, G.M.; Mullins, C.B. Hydrogen Adsorption and Absorption with Pd-Au Bimetallic Surfaces. J. Phys. Chem. C 2013, 117, 19535–19543. [Google Scholar] [CrossRef]
- Ertl, G.; Knözinger, H.; Weitkamp, J. Handbook of Heterogeneous Catalysis; Wiley online library: Hoboken, NJ, USA, 1997. [Google Scholar] [CrossRef]
- Tan, Q.; Wang, G.; Long, A.; Dinse, A.; Buda, C.; Shabaker, J.; Resasco, D.E. Mechanistic analysis of the role of metal oxophilicity in the hydrodeoxygenation of anisole. J. Catal. 2017, 347, 102–115. [Google Scholar] [CrossRef]
- Lu, Q.; Chen, C.-J.; Luc, W.; Chen, J.G.; Bhan, A.; Jiao, F. Ordered mesoporous metal carbides with enhanced anisole hydrodeoxygenation selectivity. ACS Catal. 2016, 6, 3506–3514. [Google Scholar] [CrossRef]
- Gao, X.; Tian, S.; Jin, Y.; Wan, X.; Zhou, C.; Chen, R.; Dai, Y.; Yang, Y. Bimetallic PtFe-Catalyzed Selective Hydrogenation of Furfural to Furfuryl Alcohol: Solvent Effect of Isopropanol and Hydrogen Activation. ACS Sustain. Chem. Eng. 2020, 8, 12722–12730. [Google Scholar] [CrossRef]
- Tang, Y.; Wei, Y.; Wang, Z.; Zhang, S.; Li, Y.; Nguyen, L.; Li, Y.; Zhou, Y.; Shen, W.; Tao, F.F.; et al. Synergy of Single-Atom Ni-1 and Ru-1 Sites on CeO2 for Dry Reforming of CH4. J. Am. Chem. Soc. 2019, 141, 7283–7293. [Google Scholar] [CrossRef] [PubMed]
- Kozuch, S.; Martin, J.M.L. “Turning Over” Definitions in Catalytic Cycles. ACS Catal. 2012, 2, 2787–2794. [Google Scholar] [CrossRef]


Publisher’s Note: MDPI stays neutral with regard to jurisdictional claims in published maps and institutional affiliations. |
© 2021 by the authors. Licensee MDPI, Basel, Switzerland. This article is an open access article distributed under the terms and conditions of the Creative Commons Attribution (CC BY) license (http://creativecommons.org/licenses/by/4.0/).