
TiO2 and TiO2-Carbon Hybrid Photocatalysts for Diuron Removal from Water

 , ,
, ,  and
and
Abstract
:
1. Introduction
2. Results and Discussion
2.1. Determination of the Carbon Content in TiO2-AC Samples
2.2. Textural Properties
2.3. X-ray diffraction (XRD) Analysis
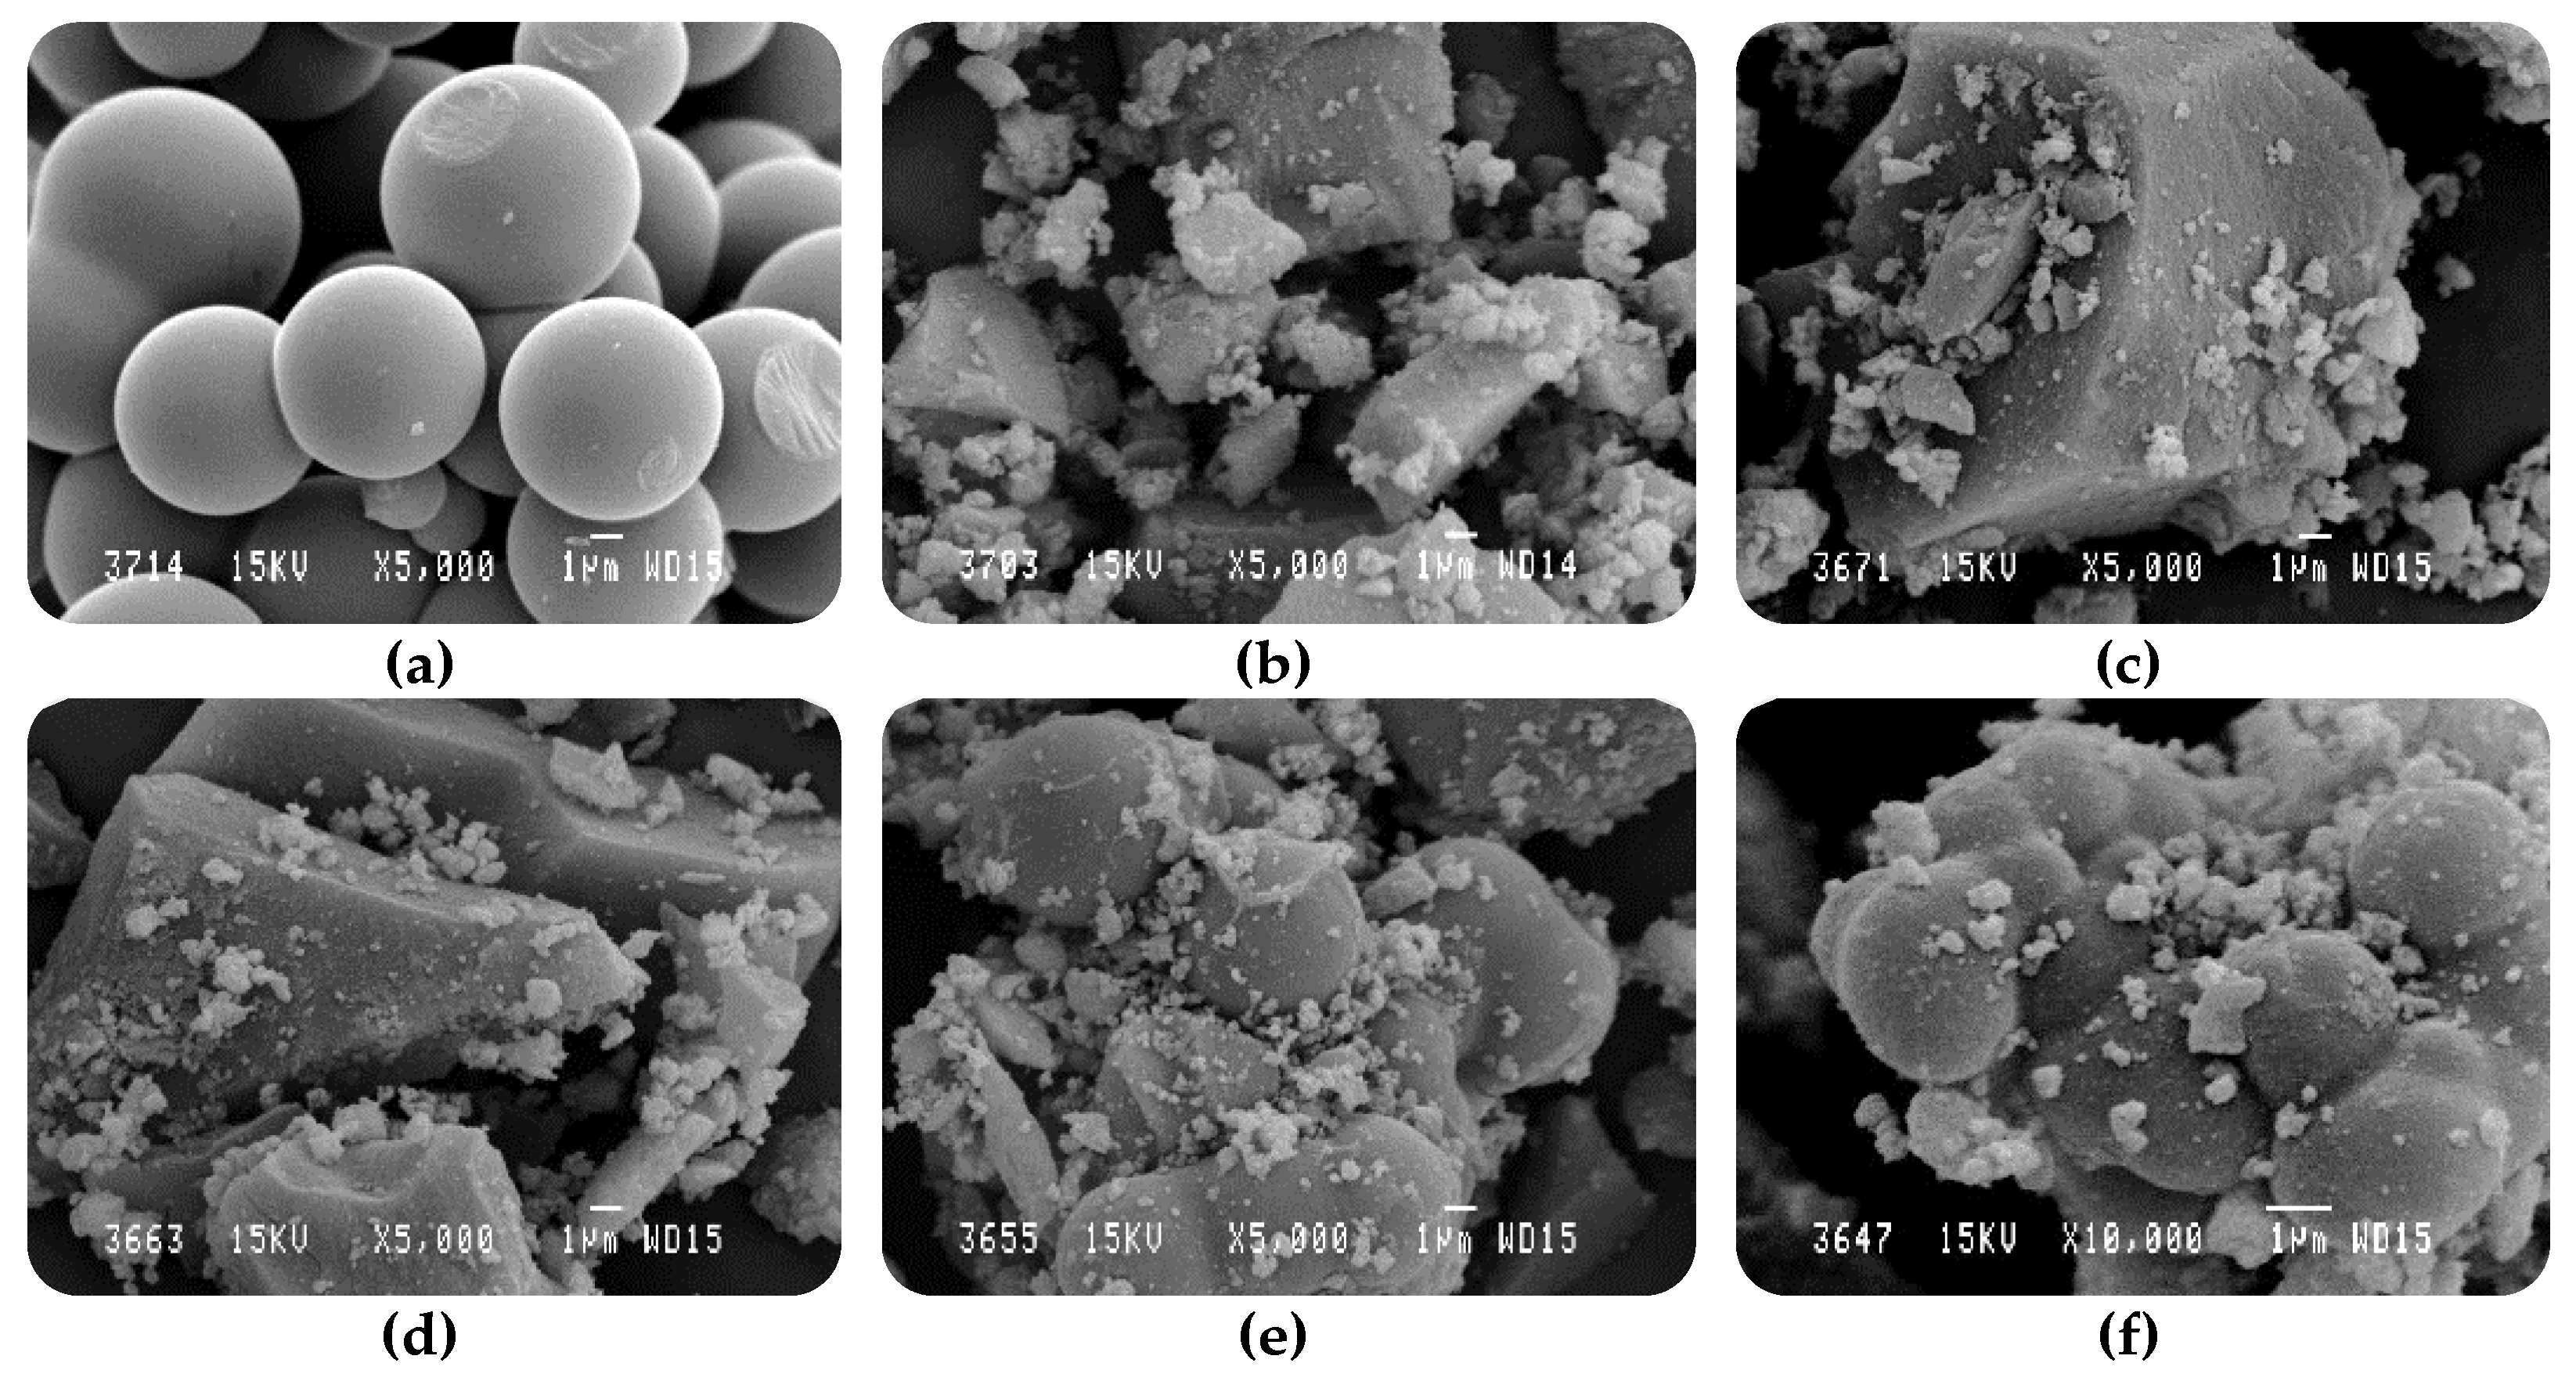
2.4. Scanning Electron Microscopy (SEM)
2.5. Diuron Removal in Water
2.6. Total Organic Carbon (TOC) Measurements
3. Materials and Methods
3.1. Preparation of TiO2 and TiO2-AC Photocatalysts
3.2. Preparation of Activated Carbon
3.3. Photocatalysts’ Characterization
3.4. Photocatalytic Activity Measurements
4. Conclusions
Supplementary Materials
Author Contributions
Funding
Acknowledgments
Conflicts of Interest
References
- Solís, R.R.; Rivas, F.J.; Martínez-Piernas, A.; Agüera, A. Ozonation, photocatalysis and photocatalytic ozonation of diuron: Intermediates identification. Chem. Eng. J. 2016, 292, 72–81. [Google Scholar] [CrossRef]
- Gavrilescu, M. Fate of pesticides in the environment. Eng. Life Sci. 2005, 5, 497–526. [Google Scholar] [CrossRef]
- Wessels, J.S.; Van der Veen, R. The action of some derivatives of phenylurethan and of 3-phenyl-1, 1-dimethylurea on the Hill reaction. Biochim. Biophys. Acta 1956, 19, 548–549. [Google Scholar] [CrossRef]
- Giacomazzi, S.; Cochet, N. Environmental impact of diuron transformation: A review. Chemosphere 2004, 56, 1021–1032. [Google Scholar] [CrossRef]
- Wauchope, R.D. The pesticide content of surface water draining from agricultural field. J. Environ. Qual. 1978, 7, 459–472. [Google Scholar] [CrossRef]
- Thurman, E.M.; Bastian, K.C.; Mollhagen, T. Occurrence of cotton herbicides and insecticides in playa lakes of the high Plains of West Texas. Sci. Total Environ. 2000, 248, 189–200. [Google Scholar] [CrossRef]
- University of Hertfordshire (UK) Pesticide Properties Database. Available online: http://sitem.herts.ac.uk/aeru/ppdb/en/Reports/260.htm (accessed on 24 February 2021).
- Loos, R.; Gawlik, B.M.; Locoro, G.; Rimaviciute, E.; Contini, S.; Bidoglio, G. EU-wide survey of polar organic persistent pollutants in European river waters. Environ. Pollut. 2009, 157, 561–568. [Google Scholar] [CrossRef] [PubMed]
- European Commission. EU Directive 2013/39/EU of the European Parliament and The Council of 12 August 2013, Amending Directives 2000/60/EC and 2008/105/EC as regards priority substances in the field of water policy. Off. J. Eur. Union 2013, 226, 1–17. [Google Scholar]
- Bamba, D.; Atheba, P.; Robert, D.; Trokourey, A.; Dongui, B. Photocatalytic degradation of the diuron pesticide. Environ. Chem. Lett. 2008, 6, 163–167. [Google Scholar] [CrossRef]
- El Madani, M.; Guillard, C.; Pérol, N.; Chovelon, J.M.; El Azzouzi, M.; Zrineh, A.; Herrmann, J.M. Photocatalytic degradation of diuron in aqueous solution in presence of two industrial titania catalysts, either as suspended powders or deposited on flexible industrial photoresistant papers. Appl. Catal. B Environ. 2006, 65, 70–76. [Google Scholar] [CrossRef]
- Prieto-Rodriguez, L.; Miralles-Cuevas, S.; Oller, I.; Agüera, A.; Puma, G.L.; Malato, S. Treatment of emerging contaminants in wastewater treatment plants (WWTP) effluents by solar photocatalysis using low TiO2 concentrations. J. Hazard. Mater. 2012, 211–212, 131–137. [Google Scholar] [CrossRef]
- Ribeiro, A.R.; Nunes, O.C.; Pereira, M.F.R.; Silva, A.M.T. An overview on the advanced oxidation processes applied for the treatment of water pollutants defined in the recently launched Directive 2013/39/EU. Environ. Int. 2015, 75, 33–51. [Google Scholar] [CrossRef] [PubMed] [Green Version]
- Malato, S.; Blanco, J.; Vidal, A.; Alarcón, D.; Maldonado, M.I.; Cáceres, J.; Gernjak, W. Applied studies in solar photocatalytic detoxification: An overview. Sol. Energy 2003, 75, 329–336. [Google Scholar] [CrossRef]
- Foo, C.; Li, Y.; Lebedev, K.; Chen, T.; Day, S.; Tang, C.; Tsang, S.C.E. Characterisation of oxygen defects and nitrogen impurities in TiO2 photocatalysts using variable-temperature X-ray powder diffraction. Nat. Commun. 2021, 12, 1–14. [Google Scholar] [CrossRef]
- Guo, Q.; Zhou, C.; Ma, Z.; Yang, X. Fundamentals of TiO2 Photocatalysis: Concepts, Mechanisms, and Challenges. Adv. Mater. 2019, 31, 1–26. [Google Scholar] [CrossRef]
- Nakata, K.; Fujishima, A. TiO2 photocatalysis: Design and applications. J. Photochem. Photobiol. C Photochem. Rev. 2012, 13, 169–189. [Google Scholar] [CrossRef]
- Malato, S.; Cáceres, J.; Fernández-Alba, A.R.; Piedra, L.; Hernando, M.D.; Agüera, A.; Vial, I. Photocatalytic treatment of diuron by solar photocatalysis: Evaluation of main intermediates and toxicity. Environ. Sci. Technol. 2003, 37, 2516–2524. [Google Scholar] [CrossRef] [PubMed]
- Hincapié, M.; Maldonado, M.I.; Oller, I.; Gernjak, W.; Sánchez-Pérez, J.A.; Ballesteros, M.M.; Malato, S. Solar photocatalytic degradation and detoxification of EU priority substances. Catal. Today 2005, 101, 203–210. [Google Scholar] [CrossRef]
- Yaemsunthorn, K.; Kobielusz, M.; Macyk, W. TiO2 with Tunable Anatase-to-Rutile Nanoparticles Ratios: How Does the Photoactivity Depend on the Phase Composition and the Nature of Photocatalytic Reaction? ACS Appl. Nano Mater. 2021, 4, 633–643. [Google Scholar] [CrossRef]
- Telegang Chekem, C.; Goetz, V.; Richardson, Y.; Plantard, G.; Blin, J. Modelling of adsorption/photodegradation phenomena on AC-TiO2 composite catalysts for water treatment detoxification. Catal. Today 2019, 328, 183–188. [Google Scholar] [CrossRef]
- Ghosh, M.; Lohrasbi, M.; Chuang, S.S.C.; Jana, S.C. Mesoporous Titanium Dioxide Nanofibers with a Significantly Enhanced Photocatalytic Activity. ChemCatChem 2016, 8, 2525–2535. [Google Scholar] [CrossRef]
- Amorós-Pérez, A.; Cano-Casanova, L.; Castillo-Deltell, A.; Román-Martínez, M.C.; Lillo-Ródenas, M.Á. TiO2 Modification with Transition Metallic Species (Cr, Co, Ni and Cu) for Photocatalytic Abatement of Acetic Acid in Liquid Phase and Propene in Gas Phase. Materials 2019, 12, 40. [Google Scholar] [CrossRef] [Green Version]
- Ghosh, M.; Liu, J.; Chuang, S.S.C.; Jana, S.C. Fabrication of Hierarchical V2O5 Nanorods on TiO2 Nanofibers and Their Enhanced Photocatalytic Activity under Visible Light. ChemCatChem 2018, 10, 3305–3318. [Google Scholar] [CrossRef]
- Yang, Z.; Yin, L.; Ou, E.; Wang, Y.; Peng, L.; Wang, J. Transition metal doped mesoporous titania with a crystalline framework as catalysts for oxidation of p-bromotoluene to p -bromobenzaldehyde. Front. Chem. Eng. China 2008, 2, 296–300. [Google Scholar] [CrossRef]
- Suzuki, N.; Okazaki, A.; Kuriyama, H.; Serizawa, I.; Hara, A.; Hirano, Y.; Nakabayashi, Y.; Roy, N.; Terashima, C.; Nakata, K.; et al. Synthesis of mesoporous TiO2/boron-doped diamond photocatalyst and its photocatalytic activity under deep UV light (λ = 222 nm) irradiation. Molecules 2018, 23, 3095. [Google Scholar] [CrossRef] [Green Version]
- Hao, R.; Wang, G.; Jiang, C.; Tang, H.; Xu, Q. In situ hydrothermal synthesis of g-C3N4/TiO2 heterojunction photocatalysts with high specific surface area for Rhodamine B degradation. Appl. Surf. Sci. 2017, 411, 400–410. [Google Scholar] [CrossRef]
- Leary, R.; Westwood, A. Carbonaceous nanomaterials for the enhancement of TiO2 photocatalysis. Carbon 2011, 49, 741–772. [Google Scholar] [CrossRef]
- Zeng, G.; You, H.; Du, M.; Zhang, Y.; Ding, Y.; Xu, C.; Liu, B.; Chen, B.; Pan, X. Enhancement of photocatalytic activity of TiO2 by immobilization on activated carbon for degradation of aquatic naphthalene under sunlight irradiation. Chem. Eng. J. 2021, 412, 128498. [Google Scholar] [CrossRef]
- Areerachakul, N.; Vigneswaran, S.; Ngo, H.H.; Kandasamy, J. Granular activated carbon (GAC) adsorption-photocatalysis hybrid system in the removal of herbicide from water. Sep. Purif. Technol. 2007, 55, 206–211. [Google Scholar] [CrossRef]
- Kim, S.H.; Ngo, H.H.; Shon, H.K.; Vigneswaran, S. Adsorption and photocatalysis kinetics of herbicide onto titanium oxide and powdered activated carbon. Sep. Purif. Technol. 2008, 58, 335–342. [Google Scholar] [CrossRef] [Green Version]
- Bamba, D.; Coulibaly, M.; Fort, C.I.; Coteţ, C.L.; Pap, Z.; Vajda, K.; Zoro, E.G.; Yao, N.A.; Danciu, V.; Robert, D. Synthesis and characterization of TiO2/C nanomaterials: Applications in water treatment. Phys. Status Solidi Basic Res. 2015, 252, 2503–2511. [Google Scholar] [CrossRef] [Green Version]
- Anirudhan, T.S.; Shainy, F.; Manasa Mohan, A. Fabrication of zinc oxide nanorod incorporated carboxylic graphene/polyaniline composite and its photocatalytic activity for the effective degradation of diuron from aqueous solutions. Sol. Energy 2018, 171, 534–546. [Google Scholar] [CrossRef]
- Anirudhan, T.S.; Christa, J.; Shainy, F. Magnetic titanium dioxide embedded molecularly imprinted polymer nanocomposite for the degradation of diuron under visible light. React. Funct. Polym. 2020, 152, 104597. [Google Scholar] [CrossRef]
- Toyoda, M.; Nanbu, Y.; Nakazawa, Y.; Hirano, M.; Inagaki, M. Effect of crystallinity of anatase on photoactivity for methyleneblue decomposition in water. Appl. Catal. B Environ. 2004, 49, 227–232. [Google Scholar] [CrossRef]
- Inagaki, M.; Nonaka, R.; Tryba, B.; Morawski, A.W. Dependence of photocatalytic activity of anatase powders on their crystallinity. Chemosphere 2006, 64, 437–445. [Google Scholar] [CrossRef] [PubMed]
- Mozia, S. Effect of calcination temperature on photocatalytic activity of TiO2. Pahotodecomposition of mono- and polyazo dyes in water. Pol. J. Chem. Technol. 2008, 10, 42–49. [Google Scholar] [CrossRef] [Green Version]
- Cenovar, A.; Paunovic, P.; Grozdanov, A.; Makreski, P.; Fidancevska, E. Preparation of Nano-Crystalline TiO2 by Sol-Gel Method using Titanium Tetraisopropoxide (TTIP) as a Precursor. Adv. Nat. Sci. Theory Appl. 2012, 1, 133–142. [Google Scholar]
- Sayilkan, F.; Asiltürk, M.; Sayilkan, H.; Önal, Y.; Akarsu, M.; Arpaç, E. Characterization of TiO2 Synthesized in Alcohol by a Sol-Gel Process: The Effects of Annealing. Turk. J. Chem. 2005, 29, 697–706. [Google Scholar]
- Belhachemi, M.; Khiari, B.; Jeguirim, M.; Sepúlveda-Escribano, A. Characterization of biomass-derived chars. In Char and Carbon Materials Derived from Biomass; Elsevier Inc.: Amsterdam, The Netherlands, 2019; pp. 69–108. ISBN 9780128148938. [Google Scholar]
- Kusiak-Nejman, E.; Wróbel, R.J.; Kapica-Kozar, J.; Wanag, A.; Szymańska, K.; Mijowska, E.; Morawski, A.W. Hybrid carbon-TiO2 spheres: Investigation of structure, morphology and spectroscopic studies. Appl. Surf. Sci. 2018, 469, 684–690. [Google Scholar] [CrossRef]
- Hung, W.C.; Fu, S.H.; Tseng, J.J.; Chu, H.; Ko, T.H. Study on photocatalytic degradation of gaseous dichloromethane using pure and iron ion-doped TiO2 prepared by the sol-gel method. Chemosphere 2007, 66, 2142–2151. [Google Scholar] [CrossRef]
- Sing, K.S.W.; Everett, D.H.; Haul, R.A.W.; Moscou, L.; Pierotti, R.A.; Rouquerol, J.; Siemieniewska, T. Reporting physisorption data for gas/solid systems with special reference to the determination of surface area and porosity. Pure Appl. Chem. 1985, 57, 603–619. [Google Scholar] [CrossRef]
- Thommes, M.; Kaneko, K.; Neimark, A.V.; Olivier, J.P.; Rodriguez-Reinoso, F.; Rouquerol, J.; Sing, K.S.W. Physisorption of gases, with special reference to the evaluation of surface area and pore size distribution (IUPAC Technical Report). Pure Appl. Chem. 2015, 87, 1051–1069. [Google Scholar] [CrossRef] [Green Version]
- Zhang, K.; Zhou, W.; Zhang, X.; Qu, Y.; Wang, L.; Hu, W.; Pan, K.; Li, M.; Xie, Y.; Jiang, B.; et al. Large-scale synthesis of stable mesoporous black TiO2 nanosheets for efficient solar-driven photocatalytic hydrogen evolution: Via an earth-abundant low-cost biotemplate. RSC Adv. 2016, 6, 50506–50512. [Google Scholar] [CrossRef]
- Fernández-Catalá, J.; Cano-Casanova, L.; Lillo-Ródenas, M.Á.; Berenguer-Murcia, Á.; Cazorla-Amorós, D. Synthesis of TiO2 with hierarchical porosity for the photooxidation of propene. Molecules 2017, 22, 2243. [Google Scholar] [CrossRef] [PubMed] [Green Version]
- Ouzzine, M.; Lillo-Ródenas, M.A.; Linares-Solano, A. Photocatalytic oxidation of propene in gas phase at low concentration by optimized TiO2 nanoparticles. Appl. Catal. B Environ. 2013, 134–135, 333–343. [Google Scholar] [CrossRef]
- Aguilar, T.; Navas, J.; Alcántara, R.; Fernández-Lorenzo, C.; Gallardo, J.J.; Blanco, G.; Martín-Calleja, J. A route for the synthesis of Cu-doped TiO2 nanoparticles with a very low band gap. Chem. Phys. Lett. 2013, 571, 49–53. [Google Scholar] [CrossRef]
- Shul’ga, Y.M.; Matyushenko, D.V.; Kabachkov, E.N.; Kolesnikova, A.M.; Kurkin, E.N.; Domashnev, I.a.; Brichkin, S.B. Correlation between the E g (1) oscillation frequency and half-width of the (101) peak in the X-ray diffraction pattern of TiO2 anatase nanoparticles. Tech. Phys. 2010, 55, 141–143. [Google Scholar] [CrossRef]
- Jensen, H.; Joensen, K.D.; Jørgensen, J.E.; Pedersen, J.S.; Søgaard, E.G. Characterization of nanosized partly crystalline photocatalysts. J. Nanopart. Res. 2004, 6, 519–526. [Google Scholar] [CrossRef]
- Fontecha-Cámara, M.Á.; López-Ramón, M.V.; Álvarez-Merino, M.A.; Moreno-Castilla, C. Temperature dependence of herbicide adsorption from aqueous solutions on activated carbon fiber and cloth. Langmuir 2006, 22, 9586–9590. [Google Scholar] [CrossRef]
- Fernandes Machado, N.R.C.; Santana, V.S. Influence of thermal treatment on the structure and photocatalytic activity of TiO2 P25. Catal. Today 2005, 107–108, 595–601. [Google Scholar] [CrossRef]
- Ohno, T.; Tokieda, K.; Higashida, S.; Matsumura, M. Synergism between rutile and anatase TiO2 particles in photocatalytic oxidation of naphthalene. Appl. Catal. A Gen. 2003, 244, 383–391. [Google Scholar] [CrossRef]
- Katsumata, H.; Sada, M.; Nakaoka, Y.; Kaneco, S.; Suzuki, T.; Ohta, K. Photocatalytic degradation of diuron in aqueous solution by platinized TiO2. J. Hazard. Mater. 2009, 171, 1081–1087. [Google Scholar] [CrossRef] [PubMed]
- Kouamé, A.N.; Masson, R.; Robert, D.; Keller, N.; Keller, V. β-SiC foams as a promising structured photocatalytic support for water and air detoxification. Catal. Today 2013, 209, 13–20. [Google Scholar] [CrossRef]
- Kouamé, N.A.; Robert, D.; Keller, V.; Keller, N.; Pham, C.; Nguyen, P. Preliminary study of the use of β-SiC foam as a photocatalytic support for water treatment. Catal. Today 2011, 161, 3–7. [Google Scholar] [CrossRef]
- Bamba, D.; Coulibaly, M.; Robert, D. Nitrogen-containing organic compounds: Origins, toxicity and conditions of their photocatalytic mineralization over TiO2. Sci. Total Environ. 2017, 580, 1489–1504. [Google Scholar] [CrossRef]
- Mezni, A.; Saber, N.B.; Bukhari, A.; Ibrahim, M.M.; Al-Talhi, H.; Alshehri, N.A.; Wazir, S.A.; El-Sheshtawy, H.S.; Altalhi, T. Plasmonic hybrid platinum-titania nanocomposites as highly active photocatalysts: Self-cleaning of cotton fiber under solar light. J. Mater. Res. Technol. 2020, 9, 1447–1456. [Google Scholar] [CrossRef]
- Foura, G.; Soualah, A.; Robert, D. Effect of W doping level on TiO2 on the photocatalytic degradation of Diuron. Water Sci. Technol. 2017, 75, 20–27. [Google Scholar] [CrossRef]
- Cruz, M.; Gomez, C.; Duran-Valle, C.J.; Pastrana-Martínez, L.M.; Faria, J.L.; Silva, A.M.T.; Faraldos, M.; Bahamonde, A. Bare TiO2 and graphene oxide TiO2 photocatalysts on the degradation of selected pesticides and influence of the water matrix. Appl. Surf. Sci. 2017, 416, 1013–1021. [Google Scholar] [CrossRef]
- Amorós-Pérez, A.; Cano-Casanova, L.; Lillo-Ródenas, M.Á.; Román-Martínez, M.C. Cu/TiO2 photocatalysts for the conversion of acetic acid into biogas and hydrogen. Catal. Today 2017, 287, 78–84. [Google Scholar] [CrossRef] [Green Version]
- Romero-Anaya, A.J.; Ouzzine, M.; Lillo-Ródenas, M.A.; Linares-Solano, A. Spherical carbons: Synthesis, characterization and activation processes. Carbon 2014, 68, 296–307. [Google Scholar] [CrossRef]
- Brunauer, S.; Emmett, P.H.; Teller, E. Adsorption of Gases in Multimolecular Layers. J. Am. Chem. Soc. 1938, 60, 309–319. [Google Scholar] [CrossRef]
- Rodriguez-Reinoso, F.; Linares-Solano, A. Microporous Structure of Activated Carbons as Revealed by Adsorption Methods; Thrower, P.A., Ed.; Marcel Dekker: New York, NY, USA, 1989; Volume 21, ISBN 0-8247-7939-8. [Google Scholar]
- Joyner, L.G.; Barrett, E.P.; Skold, R. The Determination of Pore Volume and Area Distributions in Porous Substances. II. Comparison between Nitrogen Isotherm and Mercury Porosimeter Methods. J. Am. Ceram. Soc. 1951, 73, 3155–3158. [Google Scholar] [CrossRef]
- Jenkins, R.; Snyder, R.L. Introduction to X-Ray Powder Diffractometry; John Wiley and Sons: New York, NY, USA, 1996; ISBN 978-0-471-51339-1. [Google Scholar]
- Praveen, P.; Viruthagiri, G.; Mugundan, S.; Shanmugam, N. Structural, optical and morphological analyses of pristine titanium di-oxide nanoparticles--synthesized via sol-gel route. Spectrochim. Acta A Mol. Biomol. Spectrosc. 2014, 117, 622–629. [Google Scholar] [CrossRef] [PubMed]
- Global Solar Atlas. Available online: https://globalsolaratlas.info/map (accessed on 25 March 2020).
- Garcia-Muñoz, P.; Dachtler, W.; Altmayer, B.; Schulz, R.; Robert, D.; Seitz, F.; Rosenfeldt, R.; Keller, N. Reaction pathways, kinetics and toxicity assessment during the photocatalytic degradation of glyphosate and myclobutanil pesticides: Influence of the aqueous matrix. Chem. Eng. J. 2020, 384, 123315. [Google Scholar] [CrossRef]


| Set | Sample | Crystalline Phase Amount (%) | Amorphous TiO2 (%) | Average Crystallite Size (nm) | ||
|---|---|---|---|---|---|---|
| A | R | A | R | |||
| 1 | P25 | 73 | 14 | 13 | 22 | 28 |
| TiO2 (nt) | 62 | - | 38 | 6 | - | |
| TiO2 (350) | 76 | - | 24 | 9 | - | |
| TiO2 (400) | 76 | - | 24 | 10 | - | |
| TiO2 (450) | 77 | - | 23 | 14 | - | |
| TiO2 (500) | 78 | - | 22 | 16 | - | |
| 2 | TiO2 (350) | 76 | - | 24 | 9 | - |
| TiO2-AC0.5 (350) | 74 | - | 26 | 9 | - | |
| TiO2-AC1 (350) | 74 | - | 26 | 8 | - | |
| TiO2-AC5 (350) | 73 | - | 27 | 8 | - | |
| TiO2-AC10 (350) | 74 | - | 26 | 8 | - | |
| A = Anatase, R = Rutile. | ||||||
| Set | Sample | kapp × 103 (min−1) | R2 | Diuron Removal Efficiency * (%) |
|---|---|---|---|---|
| 1 | P25 | 63.4 | 0.997 | 76.4 |
| Without catalyst | 0.0 | - | 0.0 | |
| TiO2 (nt) | 0.0 | - | 21.4 | |
| TiO2 (350) | 19.2 | 0.992 | 40.6 | |
| TiO2 (400) | 19.6 | 0.998 | 34.8 | |
| TiO2 (450) | 18.5 | 0.997 | 27.4 | |
| TiO2 (500) | 20.5 | 0.984 | 28.7 | |
| 2 | TiO2 (350) | 19.2 | 0.992 | 40.6 |
| TiO2-AC0.5 (350) | 18.9 | 0.988 | 36.7 | |
| TiO2-AC1 (350) | 23.6 | 0.998 | 47.1 | |
| TiO2-AC5 (350) | 38.4 | 0.998 | 82.1 | |
| TiO2-AC10 (350) | 78.2 | 0.994 | 99.8 |
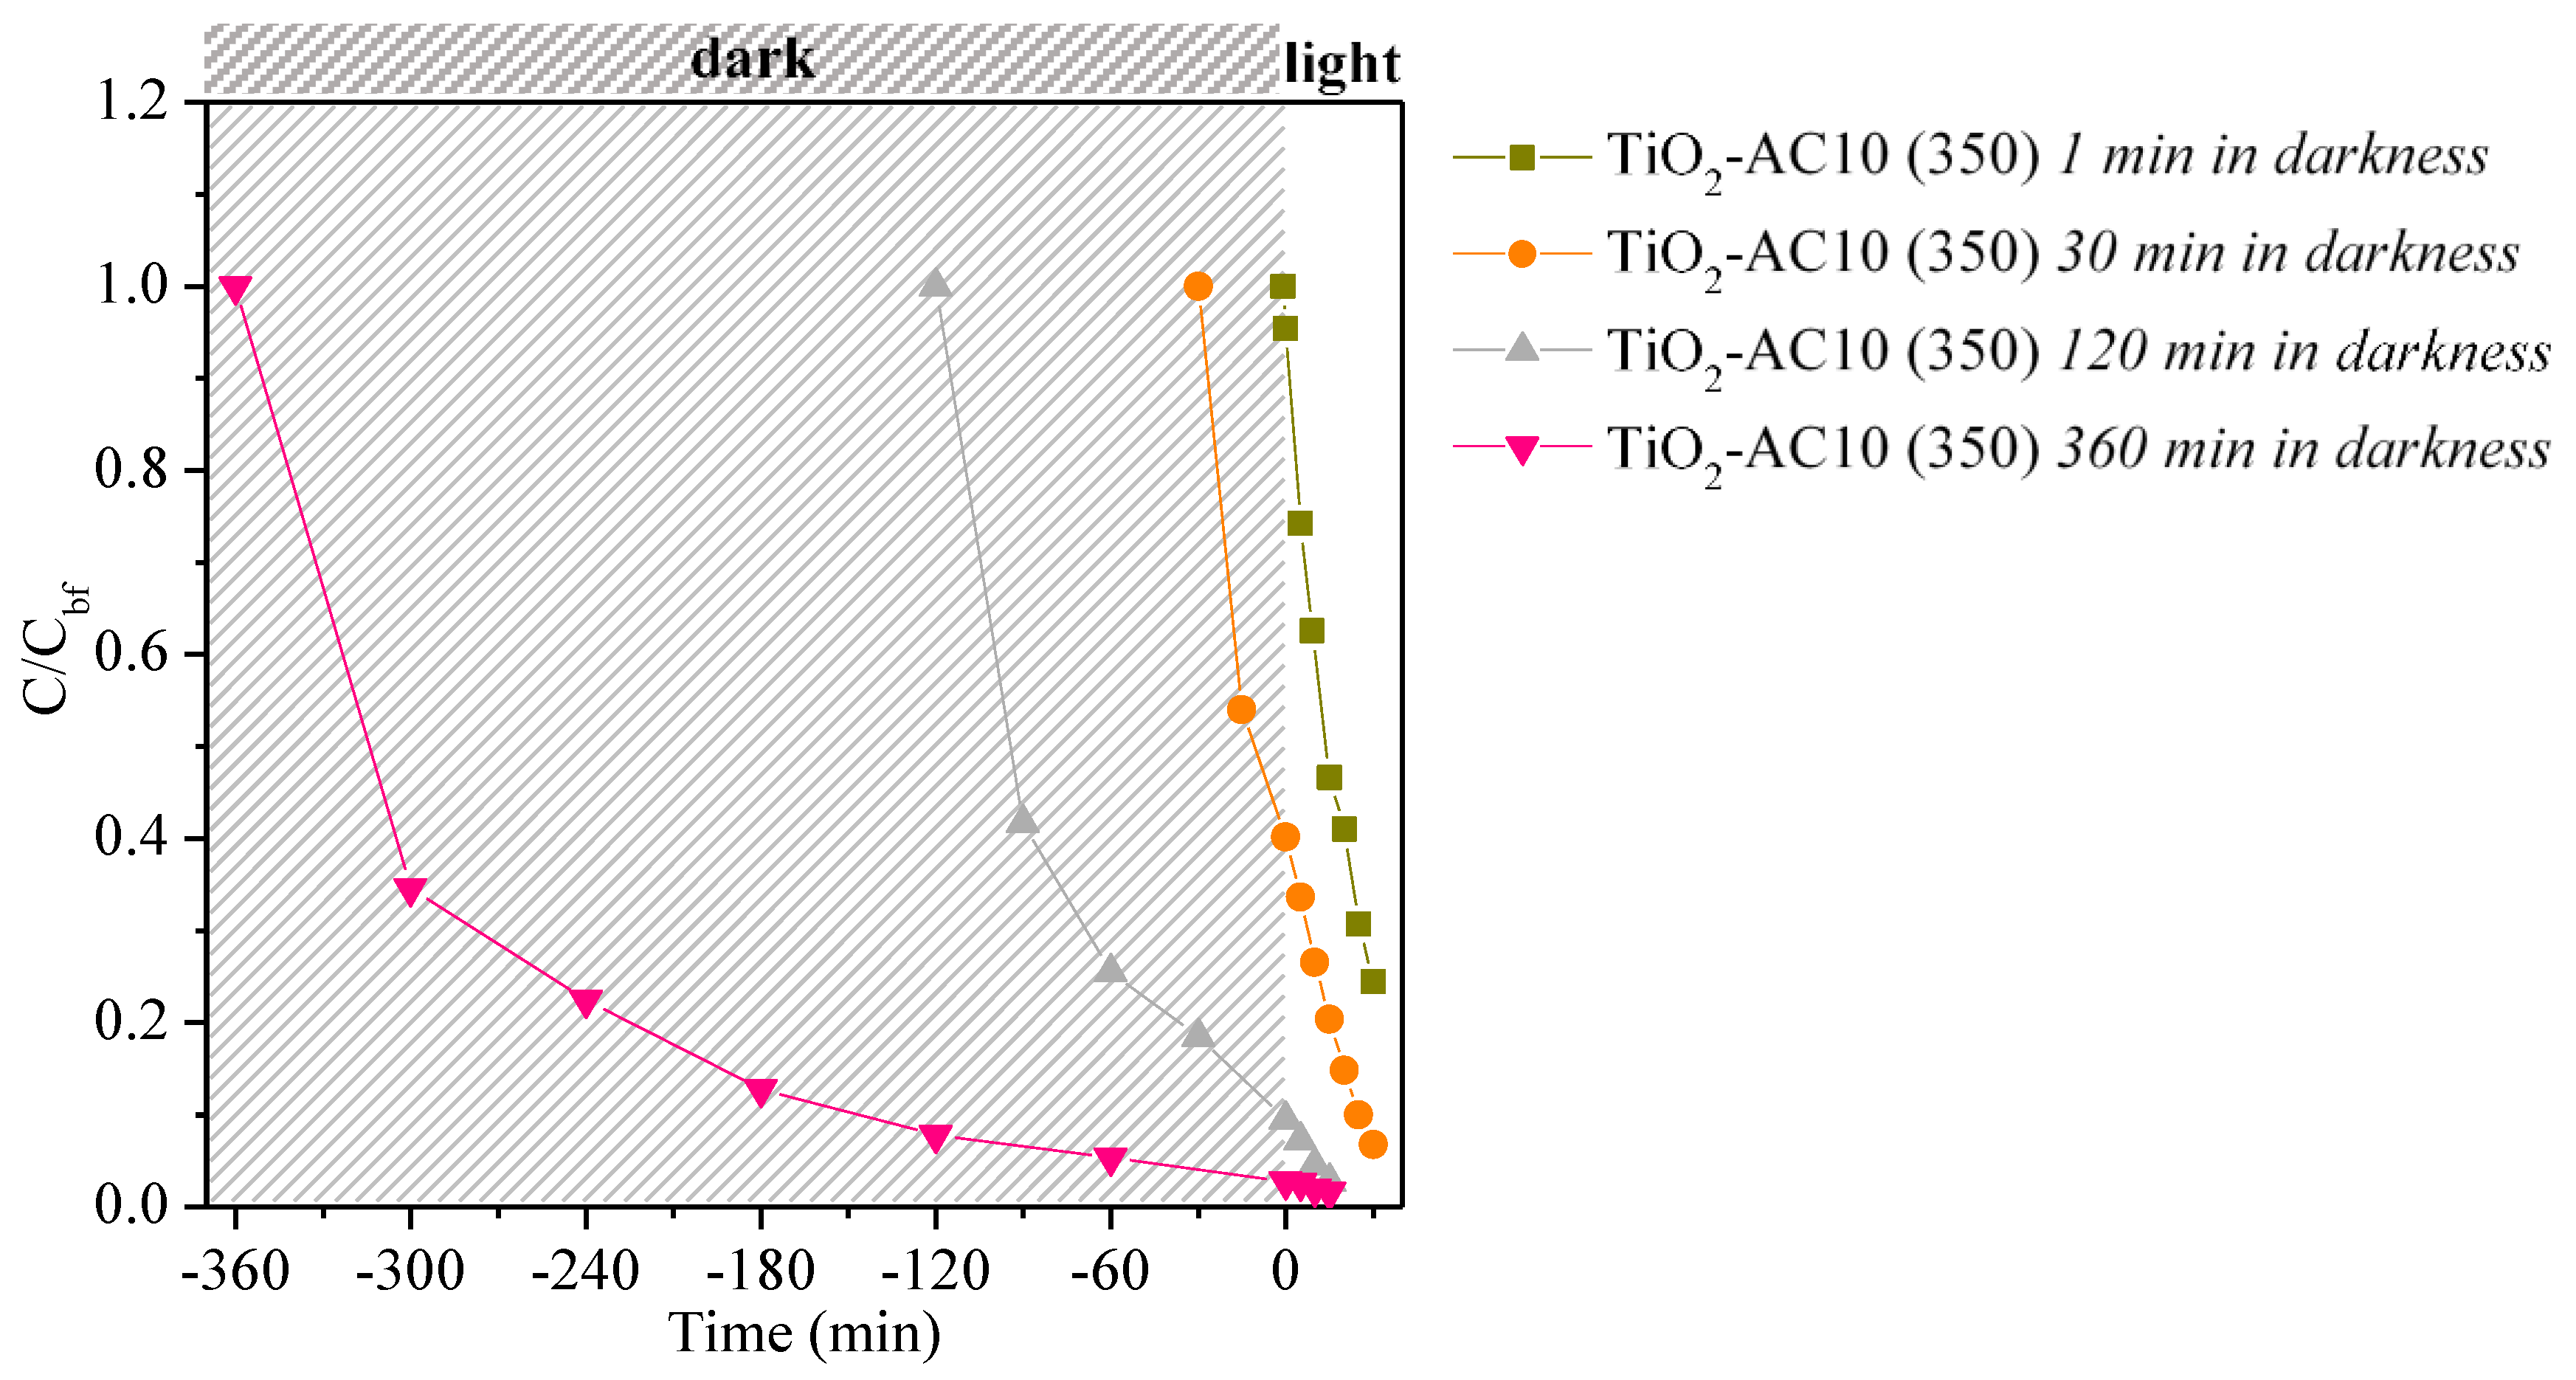
| Sample | Time in Darkness (min) | kapp × 103 (min−1) | R2 |
|---|---|---|---|
| TiO2-AC10 (350) | 1 | 45.2 | 0.998 |
| TiO2-AC10 (350) | 30 | 54.3 | 0.987 |
| TiO2-AC10 (350) | 120 | 78.2 | 0.994 |
| TiO2-AC10 (350) | 360 | 33.6 | 0.959 |
Publisher’s Note: MDPI stays neutral with regard to jurisdictional claims in published maps and institutional affiliations. |
© 2021 by the authors. Licensee MDPI, Basel, Switzerland. This article is an open access article distributed under the terms and conditions of the Creative Commons Attribution (CC BY) license (https://creativecommons.org/licenses/by/4.0/).
Share and Cite
Amorós-Pérez, A.; Lillo-Ródenas, M.Á.; Román-Martínez, M.d.C.; García-Muñoz, P.; Keller, N. TiO2 and TiO2-Carbon Hybrid Photocatalysts for Diuron Removal from Water. Catalysts 2021, 11, 457. https://doi.org/10.3390/catal11040457
Amorós-Pérez A, Lillo-Ródenas MÁ, Román-Martínez MdC, García-Muñoz P, Keller N. TiO2 and TiO2-Carbon Hybrid Photocatalysts for Diuron Removal from Water. Catalysts. 2021; 11(4):457. https://doi.org/10.3390/catal11040457
Chicago/Turabian StyleAmorós-Pérez, Ana, María Ángeles Lillo-Ródenas, María del Carmen Román-Martínez, Patricia García-Muñoz, and Nicolas Keller. 2021. "TiO2 and TiO2-Carbon Hybrid Photocatalysts for Diuron Removal from Water" Catalysts 11, no. 4: 457. https://doi.org/10.3390/catal11040457