
Promoting Effect of Copper Loading and Mesoporosity on Cu-MOR in the Carbonylation of Dimethyl Ether to Methyl Acetate


Abstract
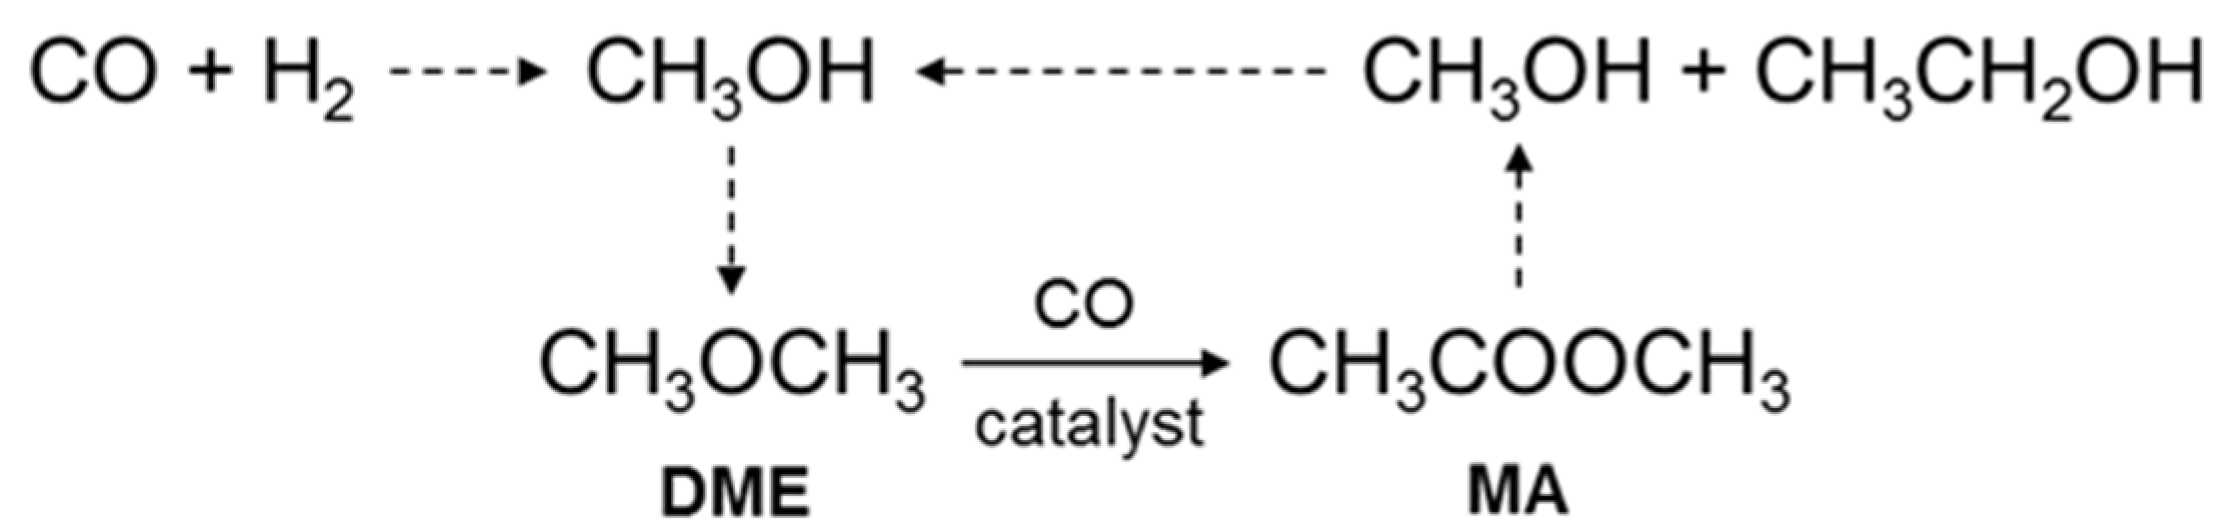
:1. Introduction
2. Results and Discussion
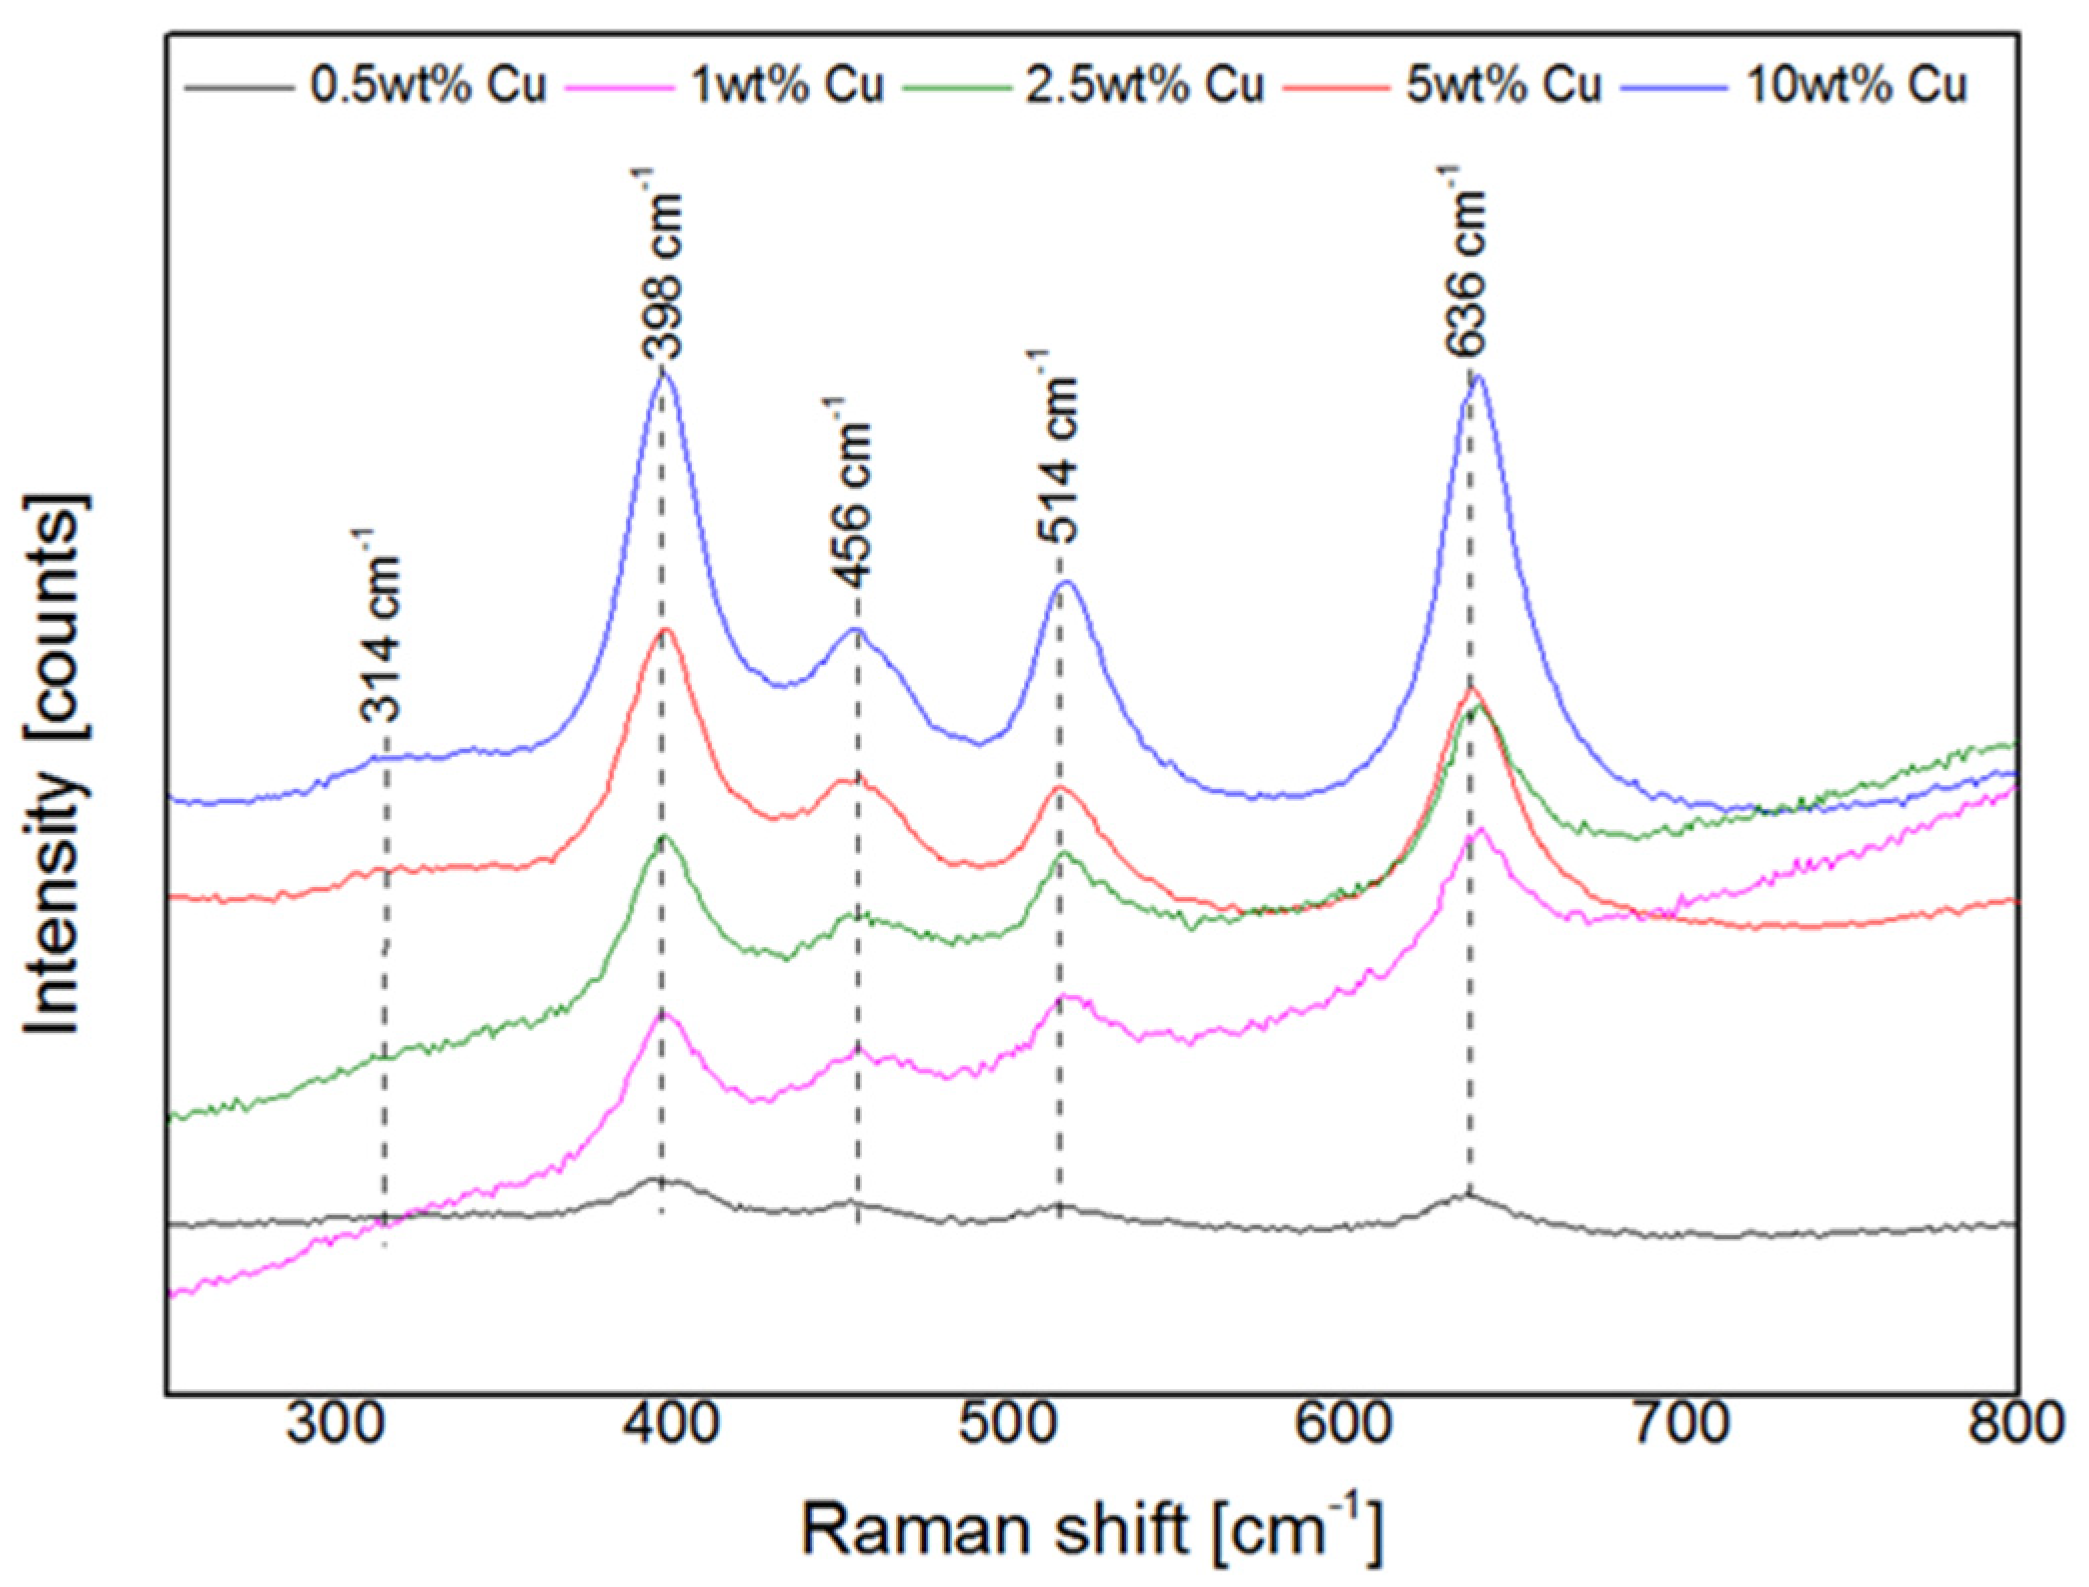
2.1. Characterization of Fresh Cu-MOR Catalysts
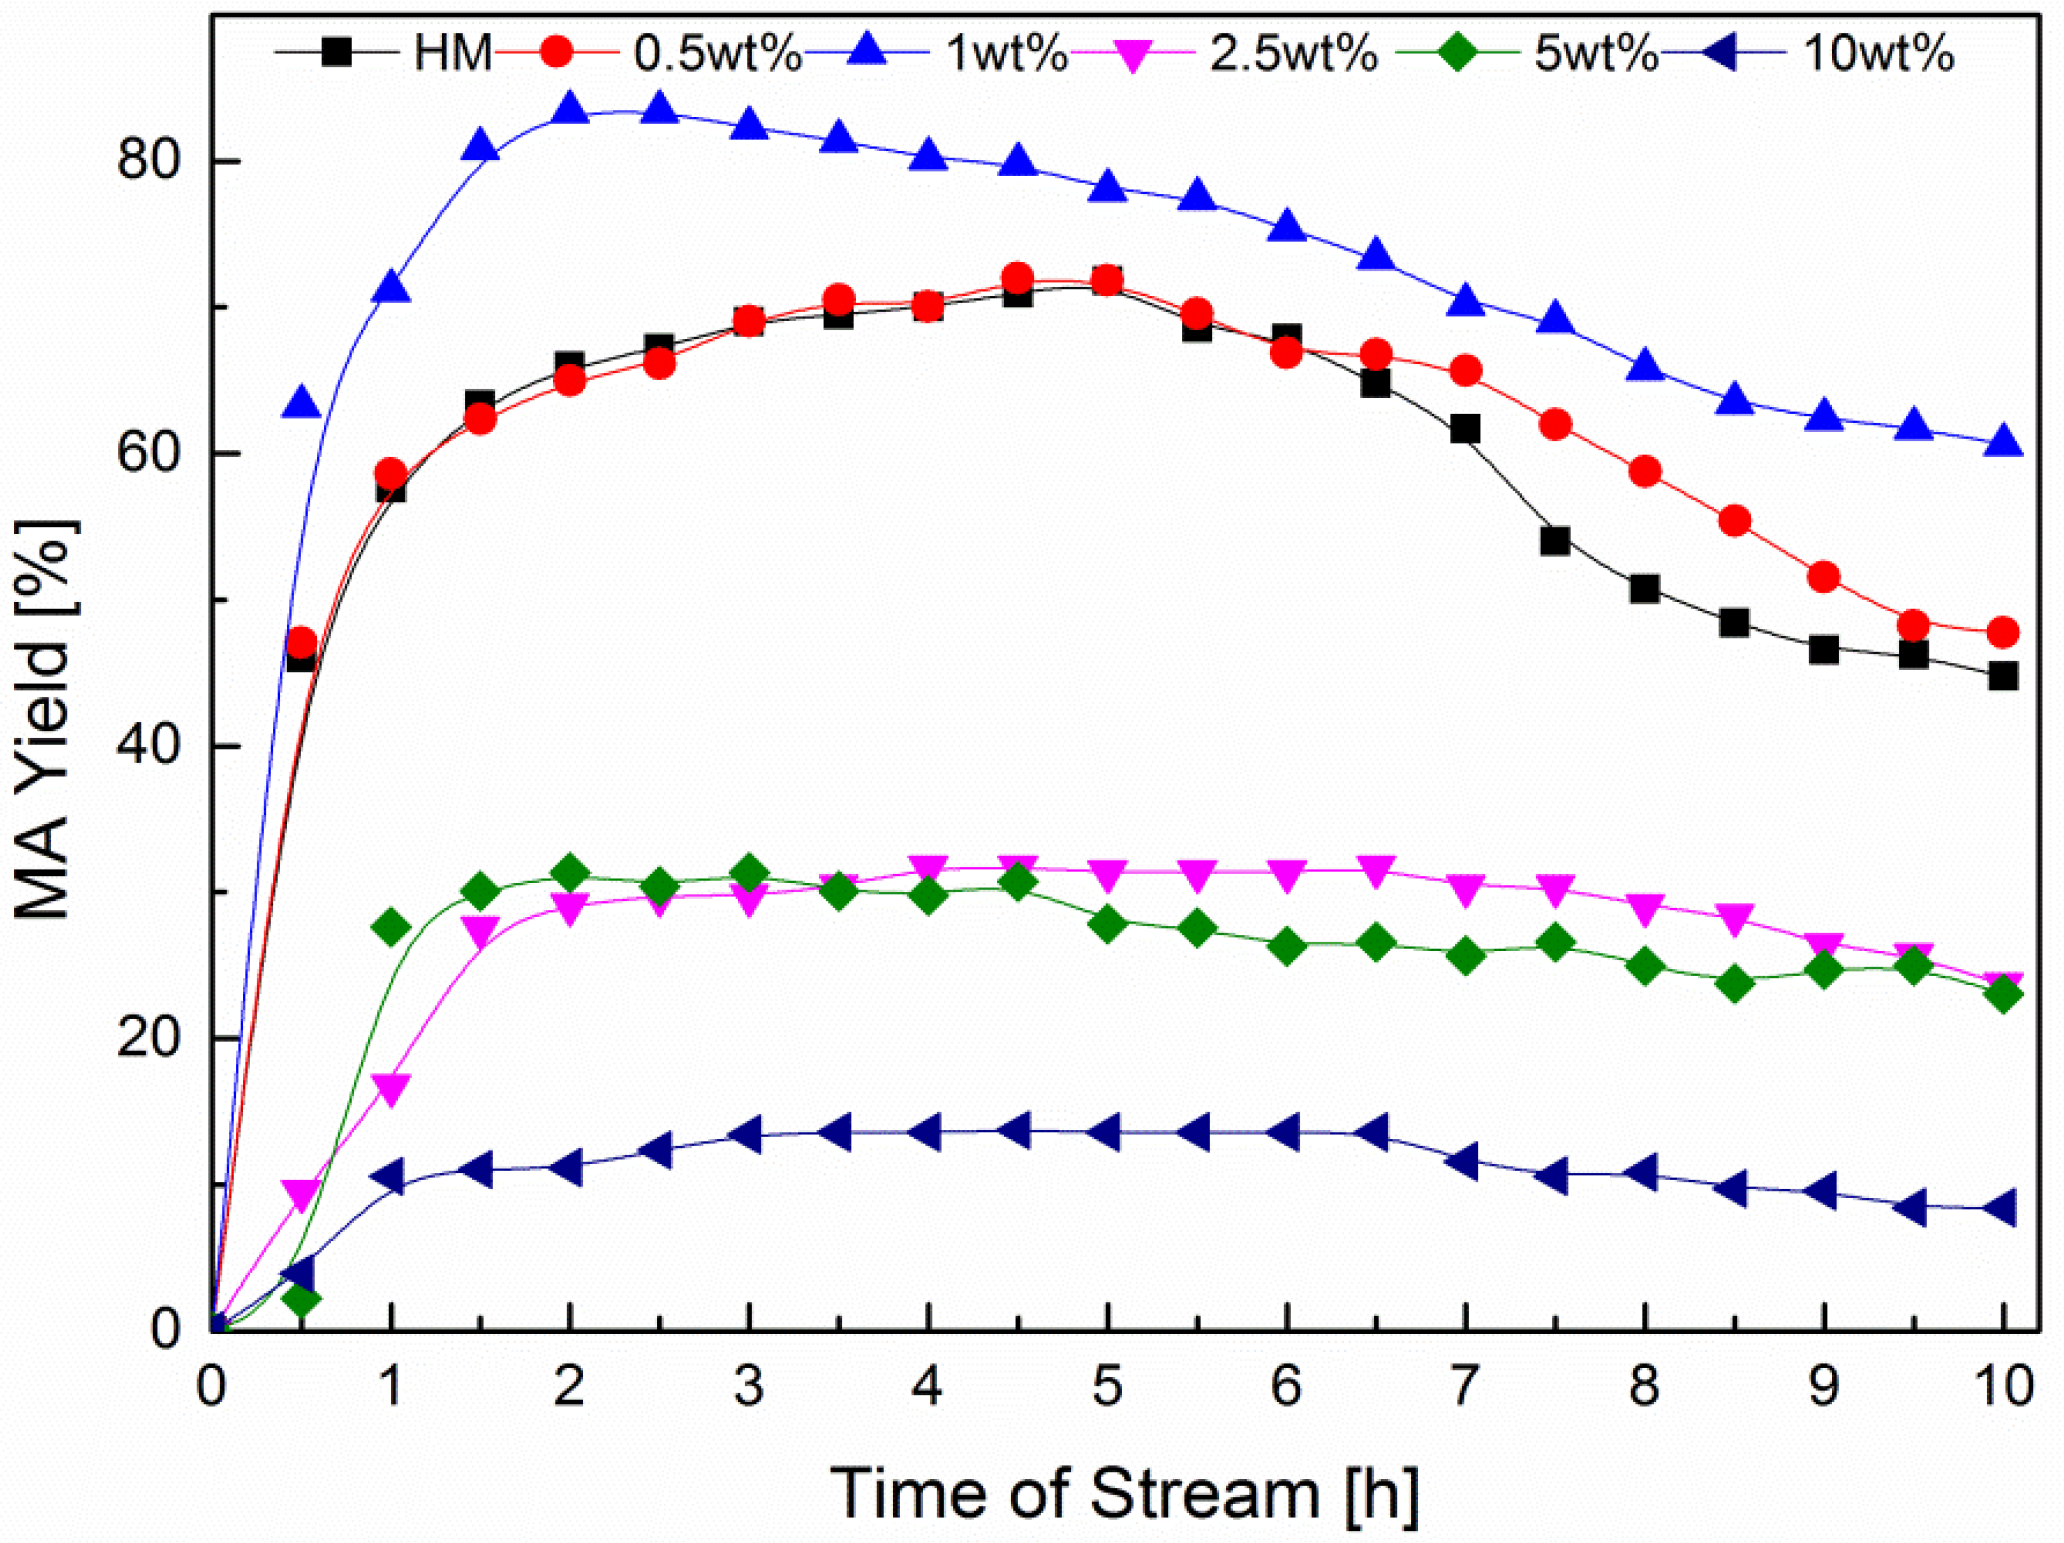
2.2. DME Carbonylation with Cu-MOR Catalysts
2.3. Characterization of Spent Cu-MOR Catalysts
2.4. Characterization of Recrystallized MOR Catalysts
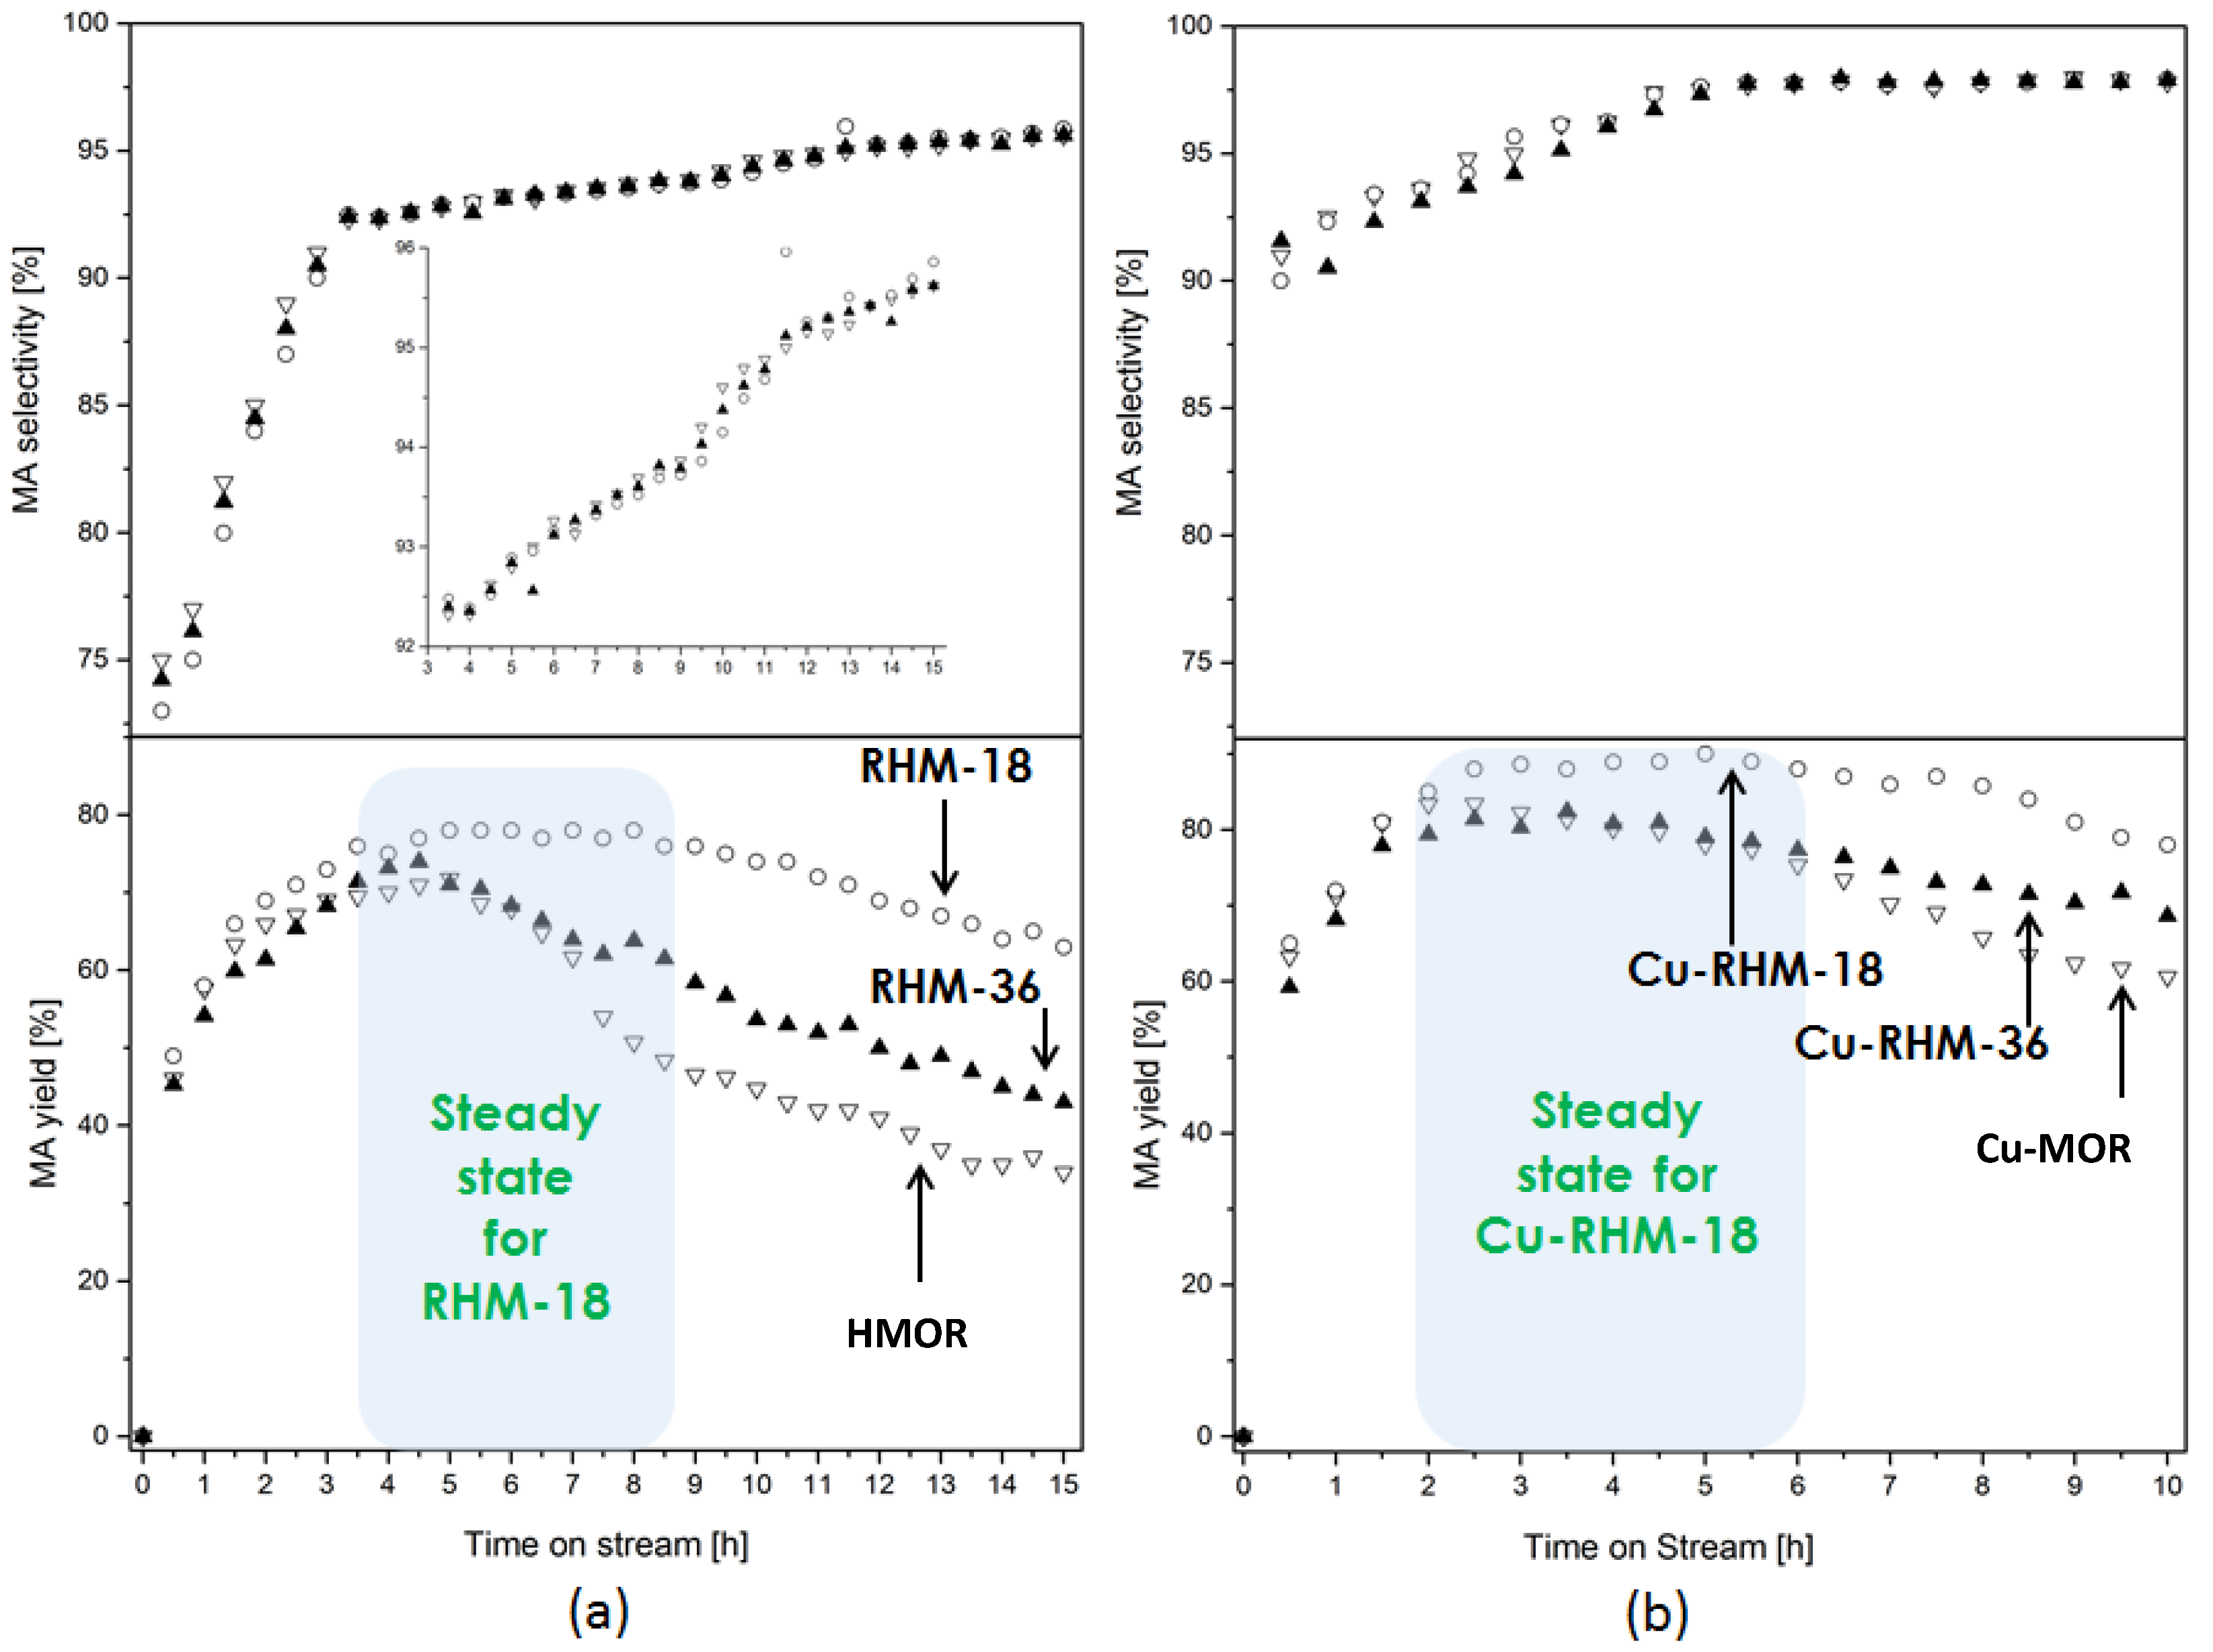
2.5. DME Carbonylation with Recrystallized MOR Catalysts
3. Materials and Methods
3.1. Chemicals
3.2. Catalyst Preparation
3.3. Catalyst Characterization
3.4. Catalytic DME Carbonylation
4. Conclusions
Supplementary Materials
Author Contributions
Funding
Acknowledgments
Conflicts of Interest
References
- Huang, X.; Ma, M.; Miao, S.; Zheng, Y.; Chen, M.; Shen, W. Hydrogenation of methyl acetate to ethanol over a highly stable Cu/SiO2 catalyst: Reaction mechanism and structural evolution. Appl. Catal. A Gen. 2017, 531, 79. [Google Scholar] [CrossRef]
- Zhang, Y.; San, X.; Tsubaki, N.; Tan, Y.; Chen, J. Novel ethanol synthesis method via C1 chemicals without any agriculture feedstocks. Ind. Eng. Chem. Res. 2010, 49, 5485. [Google Scholar] [CrossRef]
- Zoeller, J.R.; Agreda, V.H.; Cook, S.L.; Lafferty, N.L.; Polichnowski, S.W.; Pond, D.M. Eastman chemical company acetic anhydride process. Catal. Today 1992, 13, 73. [Google Scholar] [CrossRef]
- Stepanov, A.G.; Luzgin, M.V.; Romannikov, V.N.; Sidelnikov, V.N.; Zamaraevy, K.I. Formation of carboxylic acids from alcohols and olefins in zeolite H-ZSM-5 under mild conditions via trapping of alkyl carbenium ions with carbon monoxide: An in situ 13C solid state NMR study. J. Catal. 1996, 164, 411. [Google Scholar] [CrossRef]
- Ellis, B.; Howard, M.J.; Joyner, R.W.; Reddy, K.N.; Padley, M.B.; Smith, W.J. Heterogeneous catalysts for the direct, halide-free carbonylation of methanol. Stud. Surf. Sci. Catal. 1996, 101, 771. [Google Scholar]
- Xu, Q.; Inoue, S.; Tsumori, N.; Mori, H.; Kameda, M.; Tanaka, M.; Fujiwara, M.; Souma, Y. Carbonylation of tert-butyl alcohol over H-zeolites. J. Mol. Catal. A 2001, 170, 147. [Google Scholar] [CrossRef]
- Liu, Y.; Murata, K.; Inaba, M.; Takahara, I. Synthesis of ethanol from methanol and syngas through an indirect route containing methanol dehydrogenation, DME carbonylation, and methyl acetate hydrogenolysis. Fuel Proc. Technol. 2013, 110, 206. [Google Scholar] [CrossRef]
- Sardesai, A.; Lee, S. Synthesis of methyl acetate from dimethyl ether using Group VIII metal salts of phosphotungstic acid. Energy Sources 2002, 24, 301. [Google Scholar] [CrossRef]
- Zhan, E.; Xiong, Z.; Shen, W. Dimethyl ether carbonylation over zeolites. J. Energy Chem. 2019, 36, 51. [Google Scholar] [CrossRef] [Green Version]
- Lusardi, M.; Chen, T.T.; Kale, M.; Kang, J.H.; Neurock, M.; Davis, M.E. Carbonylation of dimethyl ether to methyl acetate over SSZ-13. ACS Catal. 2020, 10, 842. [Google Scholar] [CrossRef] [Green Version]
- Cheung, P.; Bhan, A.; Sunley, G.J.; Iglesia, E. Selective carbonylation of dimethyl ether to methyl acetate catalyzed by acidic zeolites. Angew. Chem. Int. Ed. 2006, 45, 1617. [Google Scholar] [CrossRef]
- Cheung, P.; Bhan, A.; Sunley, G.J.; Lawb, D.J.; Iglesia, E. Site requirements and elementary steps in dimethyl ether carbonylation catalyzed by acidic zeolites. J. Catal. 2007, 245, 110. [Google Scholar] [CrossRef]
- Bhan, A.; Allian, A.D.; Sunley, G.J.; Lawb, D.J.; Iglesia, E. Specificity of sites within eight-membered ring zeolite channels for carbonylation of methyls to acetyls. J. Am. Chem. Soc. 2007, 129, 4919. [Google Scholar] [CrossRef]
- Blasco, T.; Boronat, M.; Concepcion, P.; Corma, A.; Law, D.; Vidal-Moya, J.A. Carbonylation of methanol on metal–acid zeolites: Evidence for a mechanism involving a multisite active center. Angew. Chem. Int. Ed. 2007, 46, 3938. [Google Scholar] [CrossRef]
- Li, B.; Xu, J.; Han, B.; Wang, X.; Qi, G.; Zhang, Z.; Wang, C.; Deng, F. Insight into dimethyl ether carbonylation reaction over Mordenite zeolite from in-situ solid-state NMR spectroscopy. J. Phys. Chem. C 2013, 117, 5840. [Google Scholar] [CrossRef]
- He, T.; Ren, P.; Liu, X.; Xu, S.; Han, X.; Bao, X. Direct observation of DME carbonylation in the different channels of H-MOR zeolite by continuous-flow solid-state NMR spectroscopy. Chem. Commun. 2015, 51, 16868. [Google Scholar] [CrossRef]
- Rasmussen, D.B.; Christensen, J.M.; Temel, B.; Studt, F.; Moses, P.G.; Rossmeisl, J.; Riisager, A.; Jensen, A.D. Ketene as a reaction intermediate in the carbonylation of dimethyl ether to methyl acetate over Mordenite. Angew. Chem. Int. Ed. 2015, 54, 7261. [Google Scholar] [CrossRef]
- Boronat, M.; Martinez, C.; Corma, A. Mechanistic differences between methanol and dimethyl ether carbonylation in side pockets and large channels of mordenite. Phys. Chem. Chem. Phys. 2011, 13, 2603. [Google Scholar] [CrossRef]
- Guisnet, M.; Costa, L.; Ribeiro, F.R.J. Prevention of zeolite deactivation by coking. J. Mol. Catal. A 2009, 305, 69. [Google Scholar] [CrossRef]
- Huifu, X.; Xiumin, H.; Evert, D.; Ensheng, Z.; Meng, M.; Wenjie, S. Dimethyl ether carbonylation to methyl acetate over nanosized mordenites. Ind. Eng. Chem. Res. 2013, 52, 11510. [Google Scholar]
- Liu, J.; Xue, H.; Huang, X.; Wu, P.; Huang, S.; Liu, S.; Shen, W. Stability enhancement of H-Mordenite in dimethyl ether carbonylation to methyl acetate by pre-adsorption of pyridine. Chin. J. Catal. 2010, 31, 729. [Google Scholar] [CrossRef]
- Zhao, N.; Tian, Y.; Zhang, L.F.; Cheng, Q.P.; Lyu, S.S.; Ding, T.; Hu, Z.P.; Ma, X.B.; Li, X.G. Spacial hindrance induced recovery of over-poisoned active acid sites in pyridine-modified H-mordenite for dimethyl ether carbonylation. Chin. J. Catal. 2019, 40, 895. [Google Scholar] [CrossRef]
- Li, L.; Wang, Q.; Liu, H.; Sun, T.; Fan, D.; Yang, M.; Tian, P.; Liu, Z. Preparation of spherical mordenite zeolite assemblies with excellent catalytic performance for dimethyl ether carbonylation. ACS Appl. Mater. Interfaces 2018, 10, 32239. [Google Scholar] [CrossRef]
- Xue, H.; Huang, X.; Zhan, E.; Ma, M.; Shen, W. Selective dealumination of mordenite for enhancing its stability in dimethyl ether carbonylation. Catal. Commun. 2013, 37, 75. [Google Scholar]
- Liu, S.; Liu, H.; Ma, X.; Liu, Y.; Zhu, W.; Liu, Z. Identifying and controlling the acid site distributions in mordenite zeolite for dimethyl ether carbonylation reaction by means of selective ion-exchange. Catal. Sci. Technol. 2020, 10, 4663. [Google Scholar] [CrossRef]
- Zhang, X.; Li, Y.P.; Qiu, S.B.; Wang, T.J.; Ding, M.Y.; Zhang, Q.; Ma, L.L.; Yu, Y.X. Synthesis of methyl acetate by dimethyl ether carbonylation over Cu/HMOR: Effect of catalyst preparation method. Chin. J. Chem. Phys. 2013, 26, 77. [Google Scholar] [CrossRef] [Green Version]
- Wang, S.; Guo, W.; Zhu, L.; Wang, H.; Qiu, K.; Cen, K. Methyl acetate synthesis from dimethyl ether carbonylation over mordenite modified by cation exchange. J. Phys. Chem. C 2015, 119, 524. [Google Scholar] [CrossRef]
- Zhou, L.; Li, S.; Qi, G.; Su, Y.; Li, J.; Zheng, A.; Yi, X.; Wang, Q.; Deng, F. Methanol carbonylation over copper-modified mordenite zeolite: A solid-state NMR study. Solid State Nucl. Magn. Reson. 2016, 80, 1. [Google Scholar] [CrossRef]
- Zhan, H.; Huang, S.; Li, Y.; Lv, J.; Wang, S.; Ma, X. Elucidating the nature and role of Cu species in enhanced catalytic carbonylation of dimethyl ether over Cu/H-MOR. Catal. Sci. Technol. 2015, 5, 4378. [Google Scholar] [CrossRef]
- Li, Y.; Huang, S.; Cheng, Z.; Wang, S.; Ge, Q.; Ma, X. Synergy between Cu and Brønsted acid sites in carbonylation of dimethyl ether over Cu/H-MOR. J. Catal. 2018, 365, 440. [Google Scholar] [CrossRef]
- Wang, S.; Li, S.; Zhang, L.; Qin, Z.; Chen, Y.; Dong, M.; Li, J.; Fan, W.; Wang, J. Mechanistic insights into the catalytic role of various acid sites on ZSM-5 zeolite in the carbonylation of methanol and dimethyl ether. Catal. Sci. Technol. 2018, 8, 3193. [Google Scholar] [CrossRef]
- Available online: https://europe.iza-structure.org/IZA-SC/framework.php?STC=MOR (accessed on 21 April 2021).
- Poreddy, R.; Engelbrekt, C.; Riisager, A. Copper oxide as efficient catalyst for oxidative dehydrogenation of alcohols with air. Catal. Sci. Technol. 2015, 5, 2467. [Google Scholar] [CrossRef] [Green Version]
- Sarkany, J.; d’Itri, J.L.; Sachtler, W.M.H. Redox chemistry in excessively ion-exchanged Cu/Na-ZSM-5. Catal. Lett. 1992, 16, 241. [Google Scholar] [CrossRef]
- Lee, C.; Ha, B. Reduction behavior of copper oxide in copper/mordenites. Stud. Surf. Sci. Catal. 1994, 84, 1563. [Google Scholar]
- Richter, M.; Fait, M.J.G.; Eckelt, R.; Schreier, E.; Schneider, M.; Pohl, M.-M.; Fricke, R. Oxidative gas phase carbonylation of methanol to dimethyl carbonate over chloride-free Cu-impregnated zeolite Y catalysts at elevated pressure. Appl. Catal. B 2007, 73, 269. [Google Scholar] [CrossRef]
- Wichterlová, B.; Sobalík, Z.; Skokánek, M. Effect of water vapour and ammonia on the solid-solid interaction of Cu oxide with Y-type zeolite: Preparation of catalyst for reduction of nitric oxide with ammonia at low temperature. Appl. Catal. A 1993, 103, 269. [Google Scholar] [CrossRef]
- Szegedi, Á.; Kónya, Z.; Méhn, D.; Solymár, E.; Pál-Borbély, G.; Horváth, Z.E.; Biró, L.P.; Kiricsi, I. Spherical mesoporous MCM-41 materials containing transition metals: Synthesis and characterization. Appl. Catal. A 2004, 272, 257. [Google Scholar] [CrossRef]
- Roy, P.K.; Prins, R.; Pirngruber, G.D. The effect of pretreatment on the reactivity of Fe-ZSM-5 catalysts for N2O decomposition: Dehydroxylation vs. steaming. Appl. Catal. B 2008, 80, 226. [Google Scholar] [CrossRef]
- Baker, M.D.; Ozin, G.A.; Godber, J. Far-infrared studies of silver atoms, silver ions, and silver clusters in zeolites A and Y. J. Phys. Chem. 1985, 89, 305. [Google Scholar] [CrossRef]
- Jacobs, P.A.; Wilde, W.D.; Schoonheydt, R.A.; Uytterhoeven, J.B.; Beyer, H. Redox behaviour of transition metal ions in zeolites. Part 3.—Auto-reduction of cupric ions in Y zeolites. J. Chem. Soc. Faraday Trans. 1 1976, 72, 1221. [Google Scholar] [CrossRef]
- da Costa, P.; Moden, B.; Meitzner, G.; Lee, D.; Iglesia, E. Spectroscopic and chemical characterization of active and inactive Cu species in NO decomposition catalysts based on Cu-ZSM5. Phys. Chem. Chem. Phys. 2002, 4, 4590. [Google Scholar] [CrossRef] [Green Version]
- Peterson, A.L. The Scherrer formula for X-ray particle size determination. Phys. Rev. 1939, 56, 987. [Google Scholar] [CrossRef]
- Putluru, S.S.R.; Jensen, A.D.; Riisager, A.; Fehrmann, R. Alkali resistant Fe-zeolite catalysts for SCR of NO with NH3 in flue gases. Top. Catal. 2011, 54, 1286. [Google Scholar] [CrossRef]
- Kapustin, G.L.; Brueva, T.R.; Klyachko, A.L.; Beran, S.; Wichterlova, B. Determination of the number and acid strength of acid sites in zeolites by ammonia adsorption: Comparison of calorimetry and temperature-programmed desorption of ammonia. Appl. Catal. 1988, 42, 239. [Google Scholar] [CrossRef]
- Salker, A.V.; Weisweiler, W. Catalytic behaviour of metal based ZSM-5 catalysts for NOx reduction with NH3 in dry and humid conditions. Appl. Catal. A 2000, 203, 221. [Google Scholar] [CrossRef]
- Knight, C.L.; Williamson, M.A.; Bodnar, R.J. Raman Spectroscopy of Zeolites: Characterization of Natural Zeolites with the Laser Raman Microprobe; Microbeam, Analysis; Russell, P.E., Ed.; San Francisco Press: San Francisco, CA, USA, 1989; pp. 571–573. [Google Scholar]
- Xu, J.F.; Ji, W.; Shen, Z.X.; Li, W.S.; Tang, S.H.; Ye, X.R.; Jia, D.Z.; Xin, X.Q. Raman spectra of CuO nanocrystals. J. Raman Spectrosc. 1999, 30, 413. [Google Scholar] [CrossRef]
- Guisnet, M.; Magnoux, P. Organic chemistry of coke formation. Appl. Catal. A 2001, 212, 83. [Google Scholar] [CrossRef]
- Liu, J.L.; Xue, H.F.; Huang, X.M.; Li, Y.; Shen, W.J. Dimethyl ether carbonylation to methyl acetate over HZSM-35. Catal. Lett. 2010, 139, 33. [Google Scholar] [CrossRef]
- Xu, J.F.; Ji, W.; Shen, Z.X.; Tang, S.H.; Ye, X.R.; Jia, D.Z.; Xin, X.Q. Preparation and characterization of CuO nanocrystals. J. Solid State Chem. 1999, 147, 516. [Google Scholar] [CrossRef]
- Kong, X.J.; Chen, L.G. Hydrogenation of aromatic aldehydes to aromatic hydrocarbons over Cu-HZSM-5 catalyst. Catal. Commun. 2014, 57, 45. [Google Scholar] [CrossRef]
- Pereda-Ayo, A.B.; Torre, U.D.L.; Illán-Gómez, M.J.; Bueno-López, A.; Gonzáles-Velasco, J.R. Role of the different copper species on the activity of Cu/zeolite catalysts for SCR of NOx with NH3. Appl. Catal. B 2014, 147, 420. [Google Scholar] [CrossRef] [Green Version]
- XPS Elements Table. Available online: http://xpssimplified.com/periodictable.php (accessed on 12 December 2020).
- Mohamed, M.M.; Vansant, E.F. Redox behaviour of copper mordenite zeolite. J. Mater. Sci. 1995, 30, 4834. [Google Scholar] [CrossRef]
- Huang, S.; Zhang, J.; Wang, Y.; Chen, P.; Wang, S.; Ma, X. Insight into the tunable CuY catalyst for diethyl carbonate by oxycarbonylation: Preparation methods and precursors. Ind. Eng. Chem. Res. 2014, 53, 5838. [Google Scholar] [CrossRef]
- Carl, P.J.; Larsen, S.C. EPR study of copper-exchanged zeolites: Effects of correlated g- and A-strain, Si/Al ratio, and parent zeolite. J. Phys. Chem. B 2000, 104, 6568. [Google Scholar] [CrossRef]
- Kuncherov, A.V.; Hubbard, C.P.; Shelef, M. Rearrangement of cationic sites in CuH-ZSM-5 and reactivity loss upon high-temperature calcination and steam aging. J. Catal. 1995, 157, 603. [Google Scholar] [CrossRef]
- Stefanidis, S.; Kalogiannis, K.; Iliopoulou, E.F.; Lappas, A.A.; Martinez-Triguero, J.; Navarro, M.T.; Chica, A.; Rey, F. Mesopore-modified mordenites as catalysts for catalytic pyrolysis of biomass and cracking of vacuum gasoil processes. Green Chem. 2013, 15, 1647. [Google Scholar] [CrossRef] [Green Version]
- Kasyanov, I.A.; Maerle, A.A.; Ivanova, I.I.; Zaikovskii, V.I. Towards understanding of the mechanism of stepwise zeolite recrystallization into micro/mesoporous materials. J. Mater. Chem. A 2014, 2, 16978. [Google Scholar] [CrossRef]
- Ordomsky, V.V.; Murzin, V.Y.; Monakhova, Y.V.; Zubavichus, Y.V.; Knyazeva, E.E.; Nesterenko, N.S.; Ivanova, I.I. Nature, strength and accessibility of acid sites in micro/mesoporous catalysts obtained by recrystallization of zeolite BEA. Microporous Mesoporous Mater. 2007, 105, 101. [Google Scholar] [CrossRef]
- Konnov, S.V.; Ivanova, I.I.; Ponomareva, O.A.; Zaikovskii, V.I. Hydroisomerization of n-alkanes over Pt-modified micro/mesoporous materials obtained by mordenite recrystallization. Microporous Mesoporous Mater. 2012, 164, 222. [Google Scholar] [CrossRef]


| Catalyst | Specific Surface Area 1 (m2 g−1) | External Surface Area 2 (m2 g−1) | Micropore Surface Area (m2 g−1) | Micropore Volume 2 (cm3 g−1) | Mesopore Volume 3 (cm3 g−1) | Total Pore Volume 4 (cm3 g−1) |
|---|---|---|---|---|---|---|
| HMOR | 447 | 51 | 396 | 0.185 | 0.088 | 0.273 |
| 0.5 wt% Cu-MOR | 449 | 52 | 397 | 0.185 | 0.089 | 0.274 |
| 1 wt% Cu-MOR | 451 | 53 | 399 | 0.184 | 0.1 | 0.284 |
| 2.5 wt% Cu-MOR | 433 | 55 | 378 | 0.176 | 0.12 | 0.296 |
| 5 wt% Cu-MOR | 401 | 54 | 347 | 0.162 | 0.11 | 0.272 |
| 10 wt% Cu-MOR | 341 | 50 | 291 | 0.135 | 0.097 | 0.232 |
| 1 wt% CuO/HMOR 5 | 454 | 51 | 402 | 0.188 | 0.086 | 0.274 |
| Catalyst | Type I Acid Sites (100–270 °C) (μmol g−1) | Type II Acid Sites (270–600 °C) (μmol g−1) | Total Acid Sites (μmol g−1) | CuO Particle Size 1 (nm) |
|---|---|---|---|---|
| HMOR | 726 | 1045 | 1771 | - |
| 0.5 wt% Cu-MOR | 718 | 1010 | 1728 | 8 |
| 1 wt% Cu-MOR | 699 | 986 | 1685 | 14 |
| 2.5 wt% Cu-MOR | 706 | 1005 | 1711 | 17 |
| 5 wt% Cu-MOR | 709 | 1620 | 2329 | 18 |
| 10 wt% Cu-MOR | 674 | 1624 | 2298 | 22 |
| Catalyst | Specific Surface Area 1 (m2 g−1) | External Surface Area 2 (m2 g−1) | Micropore Surface Area(m2 g−1) | Micropore Volume 2 (cm3 g−1) | Mesopore Volume 3 (cm3 g−1) | Total Pore Volume 4 (cm3 g−1) |
|---|---|---|---|---|---|---|
| HMOR | 447 | 51 | 396 | 0.185 | 0.088 | 0.274 |
| RHM-18 | 488 | 206 | 282 | 0.102 | 0.340 | 0.442 |
| RHM-36 | 456 | 98 | 358 | 0.155 | 0.167 | 0.322 |
Publisher’s Note: MDPI stays neutral with regard to jurisdictional claims in published maps and institutional affiliations. |
© 2021 by the authors. Licensee MDPI, Basel, Switzerland. This article is an open access article distributed under the terms and conditions of the Creative Commons Attribution (CC BY) license (https://creativecommons.org/licenses/by/4.0/).
Share and Cite
Poreddy, R.; Mossin, S.; Jensen, A.D.; Riisager, A. Promoting Effect of Copper Loading and Mesoporosity on Cu-MOR in the Carbonylation of Dimethyl Ether to Methyl Acetate. Catalysts 2021, 11, 696. https://doi.org/10.3390/catal11060696
Poreddy R, Mossin S, Jensen AD, Riisager A. Promoting Effect of Copper Loading and Mesoporosity on Cu-MOR in the Carbonylation of Dimethyl Ether to Methyl Acetate. Catalysts. 2021; 11(6):696. https://doi.org/10.3390/catal11060696
Chicago/Turabian StylePoreddy, Raju, Susanne Mossin, Anker Degn Jensen, and Anders Riisager. 2021. "Promoting Effect of Copper Loading and Mesoporosity on Cu-MOR in the Carbonylation of Dimethyl Ether to Methyl Acetate" Catalysts 11, no. 6: 696. https://doi.org/10.3390/catal11060696