Article

Synthesis and Characterization of Cobalt and Nitrogen Co-Doped Peat-Derived Carbon Catalysts for Oxygen Reduction in Acidic Media

1
Institute of Chemistry, University of Tartu, Ravila 14a, 50411 Tartu, Estonia
2
Department of Materials Science, Tallinn University of Technology, Ehitajate tee 5, 19086 Tallinn, Estonia
3
Department Electrochemical Energy Storage, Helmholtz-Zentrum Berlin, Hahn-Meitner-Platz 1, 14109 Berlin, Germany
4
Institute of Ecology and Earth Sciences, University of Tartu, Ravila 14a, 50411 Tartu, Estonia
5
Institute of Physics, University of Tartu, W. Ostwaldi 1, 50411 Tartu, Estonia
*
Author to whom correspondence should be addressed.
Catalysts 2021, 11(6), 715; https://doi.org/10.3390/catal11060715
Submission received: 20 May 2021 / Revised: 3 June 2021 / Accepted: 4 June 2021 / Published: 8 June 2021

Abstract

:
In this study, several peat-derived carbons (PDC) were synthesized using various carbonization protocols. It was found that depending on the carbonization method, carbons with very different surface morphologies, elemental compositions, porosities, and oxygen reduction reaction (ORR) activities were obtained. Five carbons were used as carbon supports to synthesize Co-N/PDC catalysts, and five different ORR catalysts were acquired. The surface analysis revealed that a higher nitrogen content, number of surface oxide defects, and higher specific surface area lead to higher ORR activity of the Co-N/PDC catalysts in acidic solution. The catalyst Co-N/C-2(ZnCl2), which was synthesized from ZnCl2-activated and pyrolyzed peat, showed the highest ORR activity in both rotating disk electrode and polymer electrolyte membrane fuel cell tests. A maximum power density value of 210 mW cm−2 has been obtained. The results of this study indicate that PDCs are promising candidates for the synthesis of active non-platinum group metal type catalysts.

Graphical Abstract

1. Introduction

The European Union aims to be climate neutral by 2050 (European Green Deal). As a result, several initiatives will be carried out in order to protect the environment and boost the green economy [1,2,3]. Moreover, because it is critical to use resources as efficiently as possible, the synthesis process of materials should be given special consideration, including minimizing the usage of harmful chemicals and keeping the CO2 footprint as low as possible [1].
In recent years, biomass has been studied as a precursor for the synthesis of advanced carbonaceous materials for different applications like wastewater purification from various metals [2,3,4] and low-temperature fuel cells [5,6]. Furthermore, using a carbonization process, peat-derived carbon (PDC) can be used for various applications, such as battery electrodes, adsorbents, and electrical double-layer capacitor electrodes [7,8,9,10]. Regarding low-temperature fuel cells, carbonaceous materials are already being widely used as catalyst-support materials [11,12,13,14,15,16]. However, cost-effective and environmentally friendly biomass-derived carbons seem to be promising candidates in order to increase the efficiency of fuel cell catalyst materials. This is especially true in the case of non-platinum group metal (NPGM) type catalysts, where the used carbon support can remarkably affect the final catalytic activity [17,18,19,20,21].
Despite increasing interest in advanced biomass-derived materials, PDC has not yet been explored fully as a potential carbon support material in the synthesis of catalyst materials for low-temperature fuel cells. Consequently, in this study, we used five different methods to produce PDC materials, which have been characterized using several physical and electrochemical characterization methods. After that, the prepared carbons were used as carbon support materials to synthesize cobalt and nitrogen co-doped catalysts. The activity of these Co-N/PDCs has been analyzed in a three-electrode system in an acidic solution, and the acquired results were compared with each other [22]. It was found that highly active ORR catalysts comparable to previously synthesized NPGM materials based on silicon carbide-derived carbon can be obtained by choosing suitable carbonization procedures [22,23,24]. Finally, the most promising NPGM catalysts were studied as cathodes in a polymer electrolyte membrane fuel cell (PEMFC). To our best knowledge, this is the first attempt to use PDC-based NPGM catalyst materials in a PEMFC.

2. Peat-Derived Carbons and NPGM Catalysts Preparation

2.1. Synthesis of Peat-Derived Carbons

The synthesis and activation scheme of the peat-derived carbons is shown in Figure 1.
The well-decomposed peat used in this work originated from Möllatsi peatland, Estonia. In the first step of all synthesis procedures, the peat was blended with water and then dried and ground. After that, the PDCs can be divided into three groups based on the proceeding treatment:
(1)
The pre-treated peat was pyrolyzed in a tube oven for 3 h at 800 °C in an Ar flow (200 mL min–1, AGA, 99.999%, Tartu, Estonia) and the received material was denoted C-1 [22,24].
(2)
Using a direct activation method, the dry peat was mechanically mixed together with reactants (either KOH (prepared from 99.99% KOH pellets, Sigma-Aldrich, St. Louis, MO, USA) or ZnCl2 (anhydrous, free-flowing, Redi-Dri™, reagent grade, ≥98% Sigma-Aldrich, St. Louis, MO, USA)) and pyrolyzed in a flow of Ar for 2 h at 700 °C. The received carbons were marked with the abbreviations: C-2(KOH) and C-2(ZnCl2), respectively [9,24,25,26].
(3)
The pre-treated peat was pre-pyrolyzed in a flow of Ar at 450 °C for 3 h. After that, a washing procedure was performed using 20 wt% KOH and then 50 wt% HCl solution. The obtained mixture was washed with Milli-Q® water, dried, and named C-3. A fifth material (C-3(pyr)) was prepared using a post-pyrolysis in Ar at 1000 °C for 2 h [10,24].

2.2. Preparation of Cobalt and Nitrogen Co-Doped Catalysts

PDCs were further modified into cobalt and nitrogen co-doped catalyst using a dry ball-milling method described previously [22,23,24]. All the reagents (PDC, Co(NO3)2∙6H2O (Sigma-Aldrich, ≥99.0%, St. Louis, MO, USA), and 2,2′-bipyridine (Sigma-Aldrich, ReagentPlus®, ≥99%, St. Louis, MO, USA)) were ball-milled (FRITSCH Pulverisette 6, Idar-Oberstein, Germany) in a ceramic crucible at 300 rpm for 2 h using five ZrO2 grinding balls (20 mm diameter). After that, the received powder was pyrolyzed at 800 °C for 1.5 h in Ar flow (200 mL min–1). In total, five cobalt and nitrogen co-doped catalysts were synthesized, and their abbreviations were: Co-N/C-1, Co-N/C-2(KOH), Co-N/C(ZnCl2), Co-N/C-3, Co-N/C-3(pyr).

3. Physical and Electrochemical Characterization Methods

3.1. Physical Characterization Methods

Several physical characterization methods were used to understand the effects of the different carbonization and synthesis methods on the characteristics of the materials explored in this work.
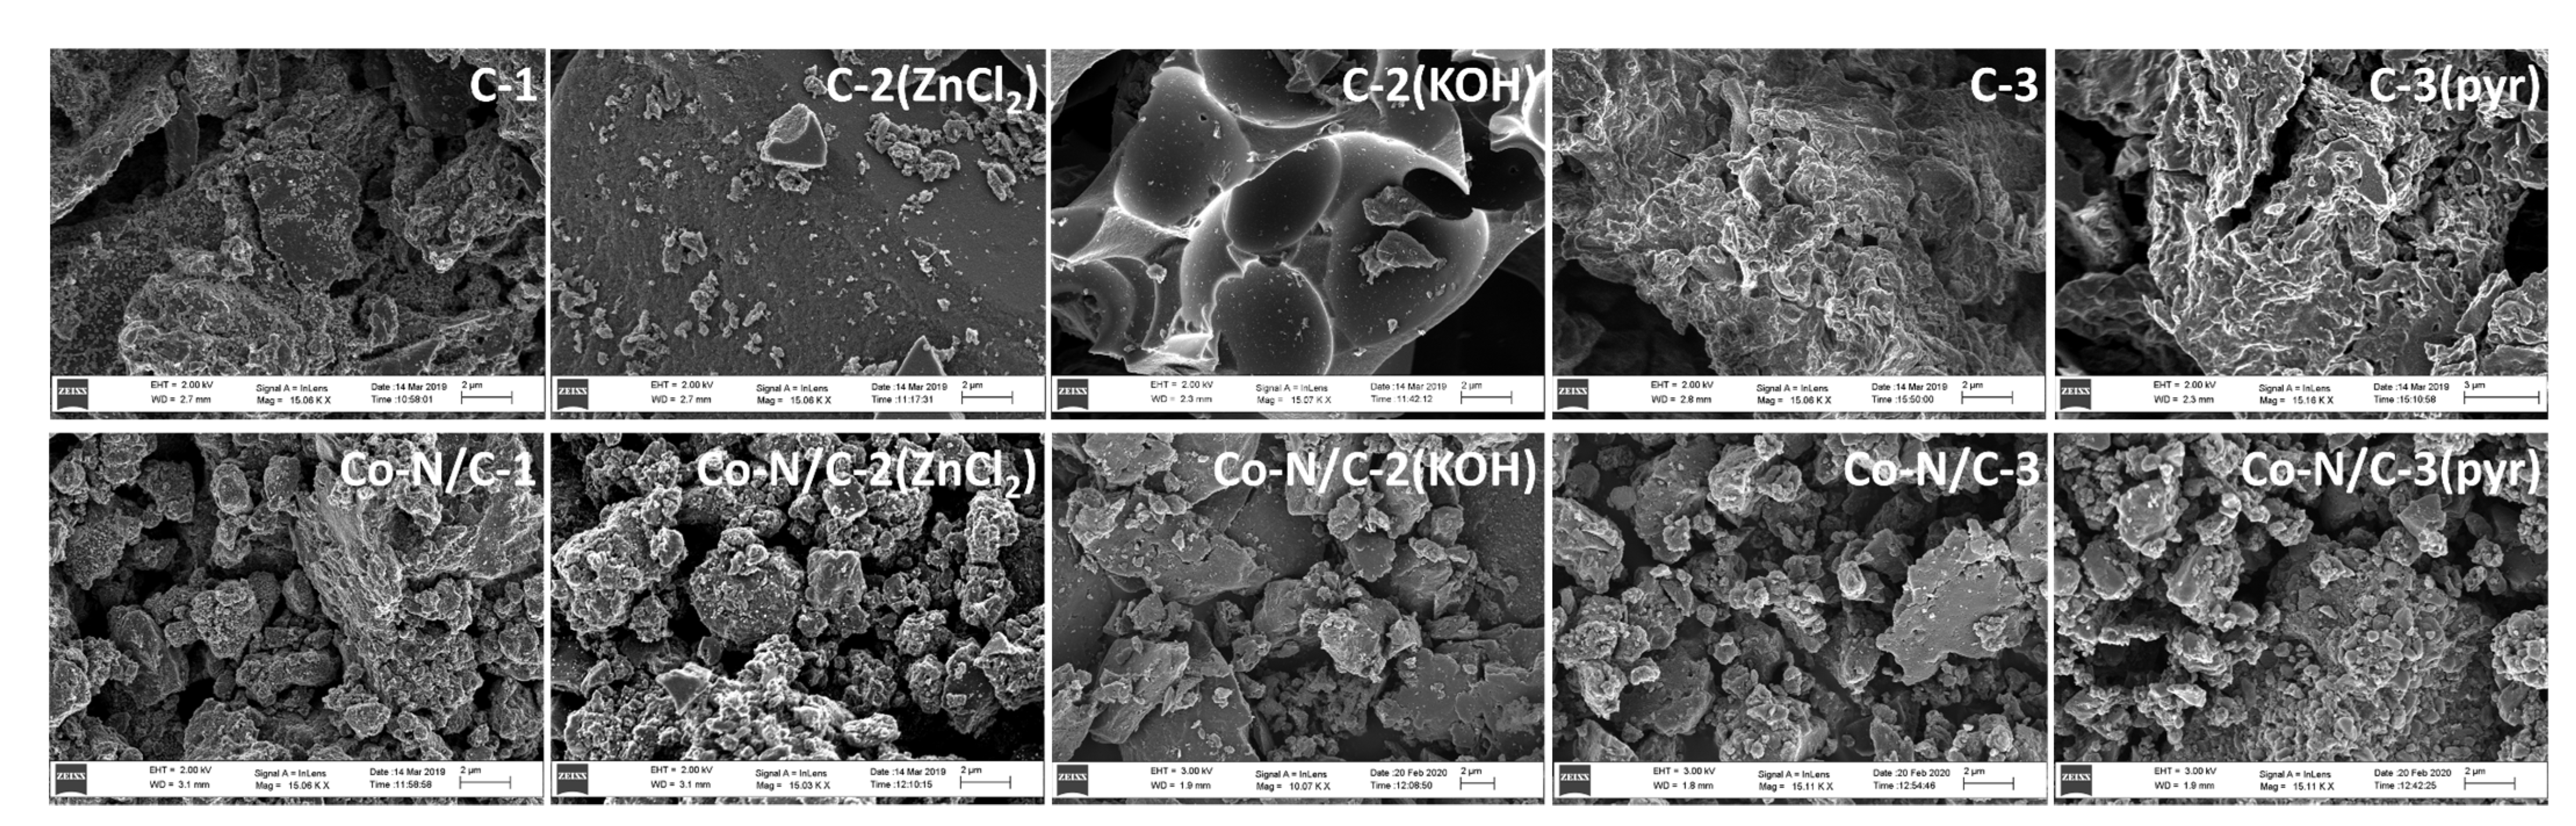
  • High-resolution scanning electron microscopy (HR-SEM) measurements were conducted with a Zeiss Merlin microscope(ZEISS, Oberkochen, Germany). For HR-SEM studies, the samples were placed on a copper sample holder. The composition of the materials was analyzed by energy-dispersive X-ray spectroscopy (EDX) on an HR-SEM Zeiss Merlin equipped with a Bruker EDX-XFlash® 6/30 detector (Bruker, Billerica, MA, USA) with an accelerating voltage of 8 kV. The elemental composition of the materials was determined using P/B-ZAF standardless mode.
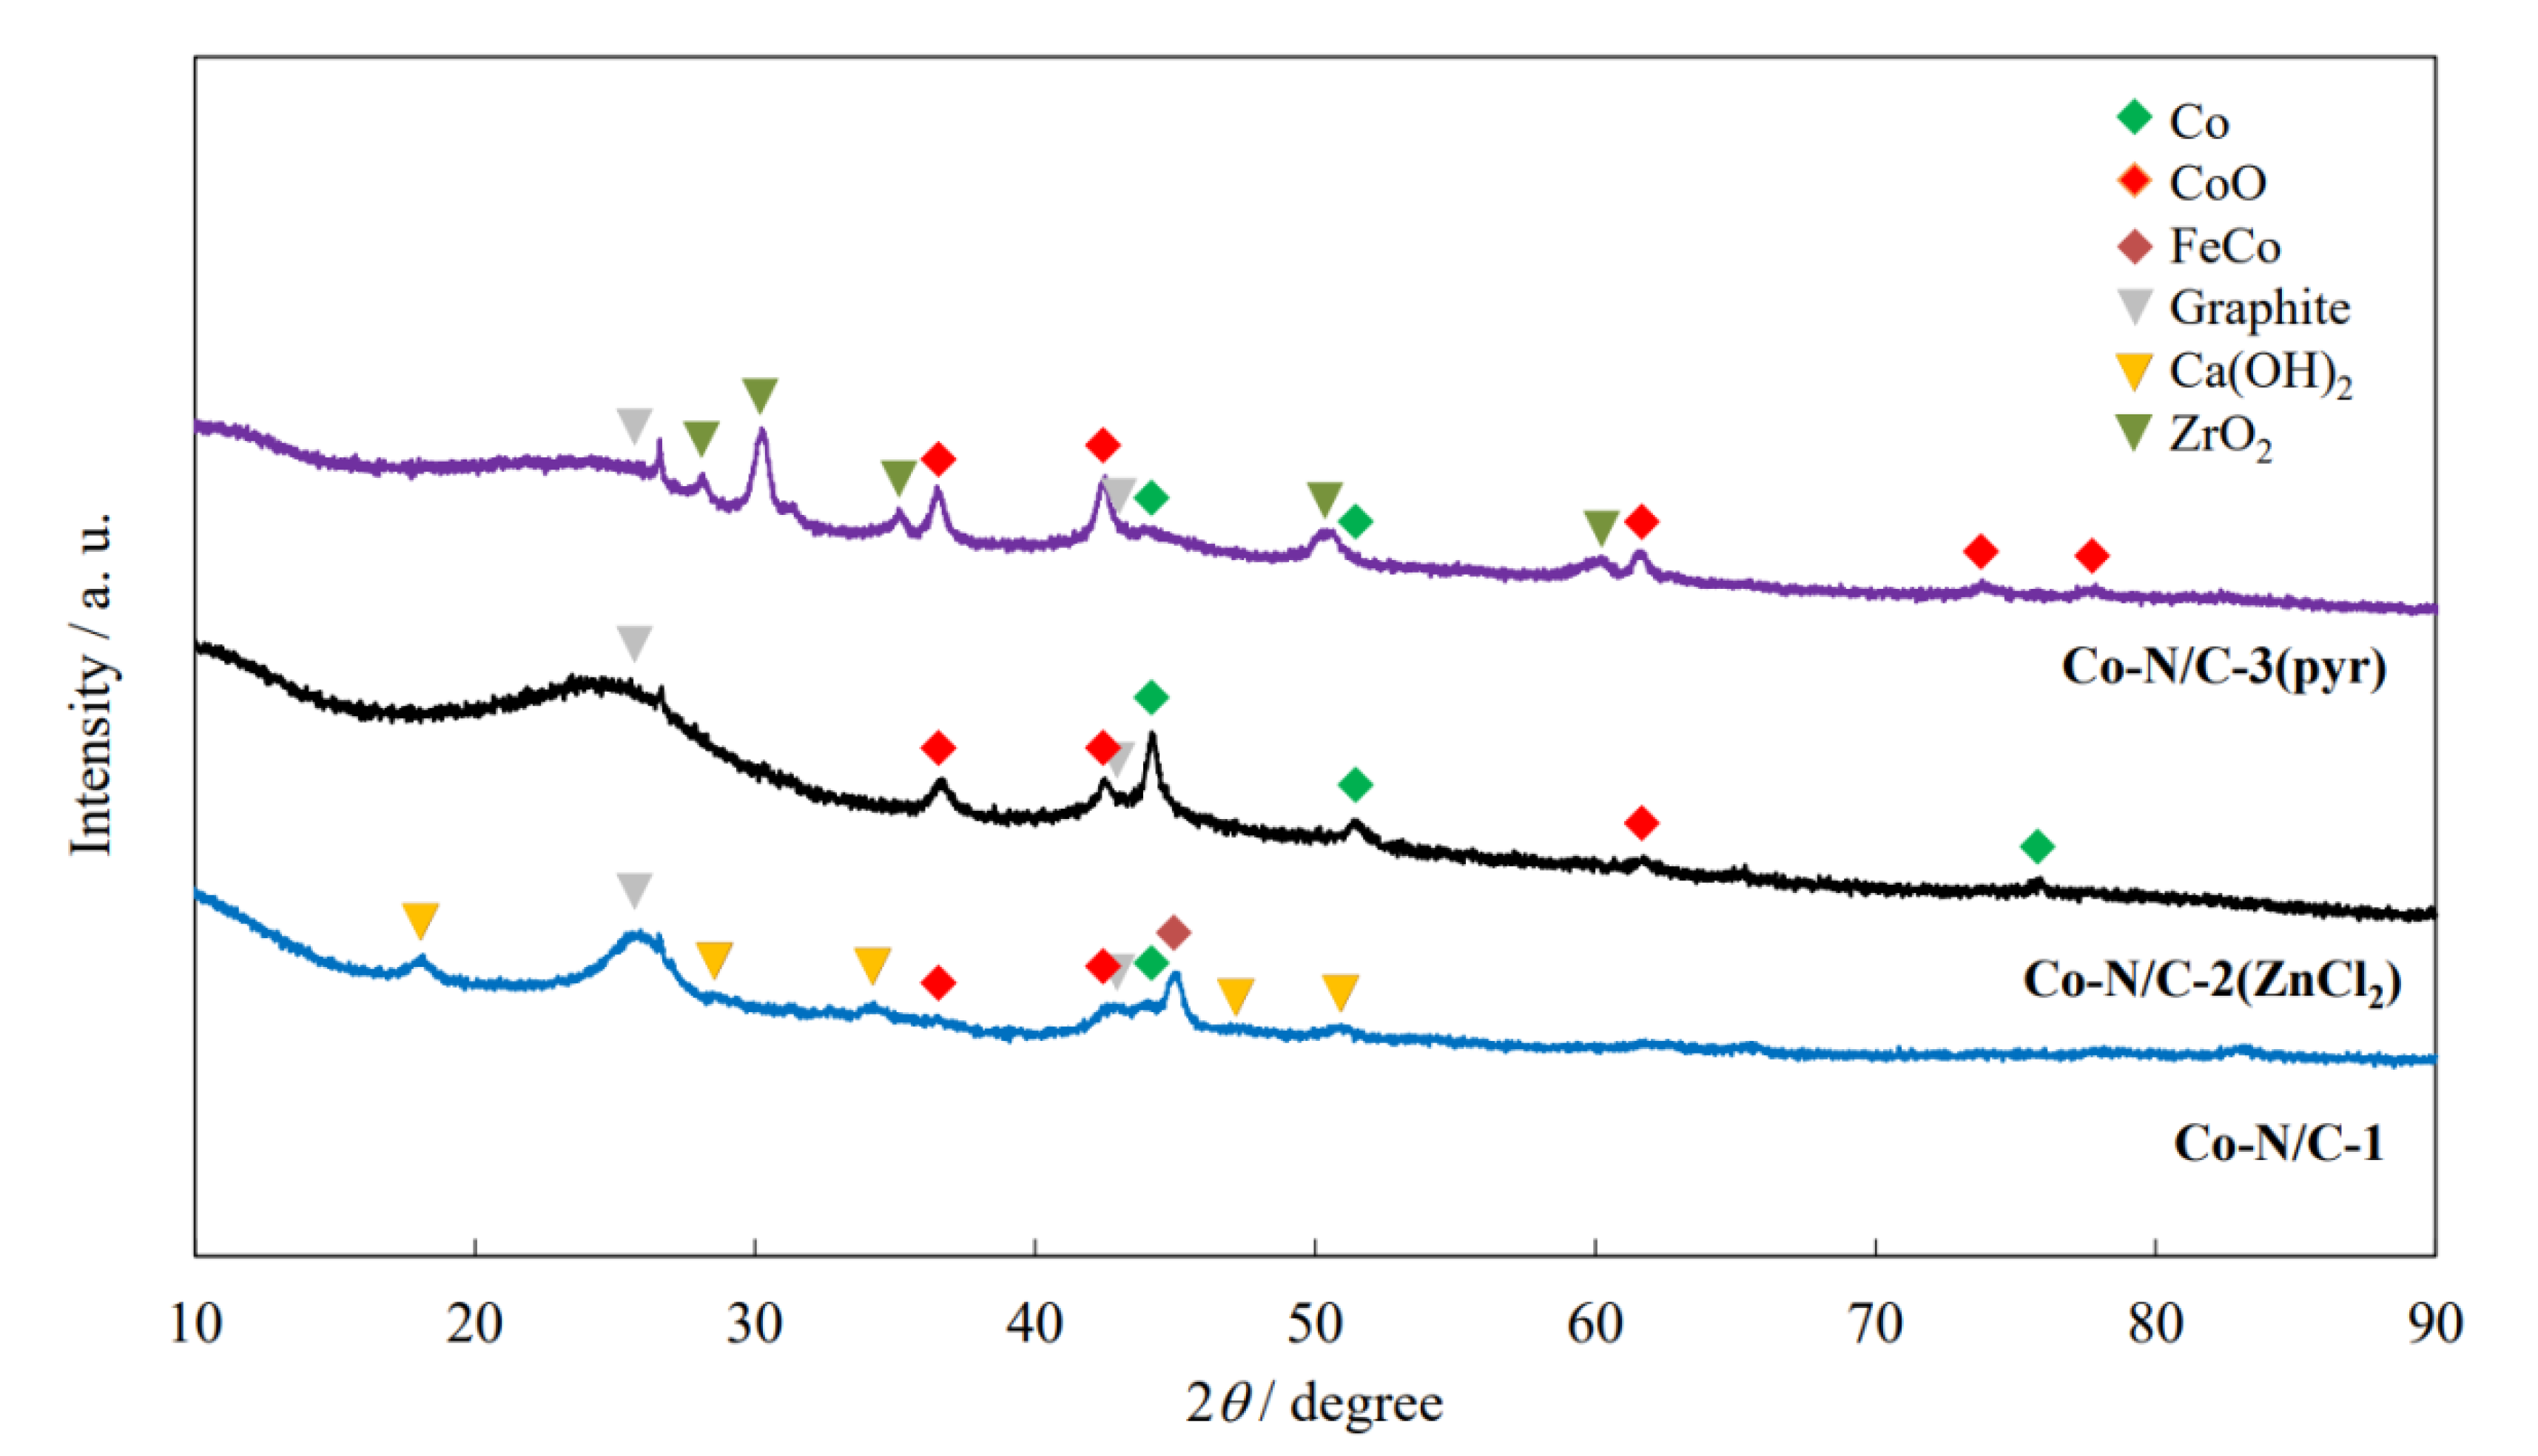
  • X-ray diffraction (XRD) patterns of the synthesized catalysts were recorded using a Bruker D8 Advanced diffractometer (Bruker, Billerica, MA, USA) equipped with a Ni-filtered CuK radiation source (λ = 1.5406 Å). Topas software (v6, Bruker, Billerica, MA, USA, 2019) was used for data analysis.
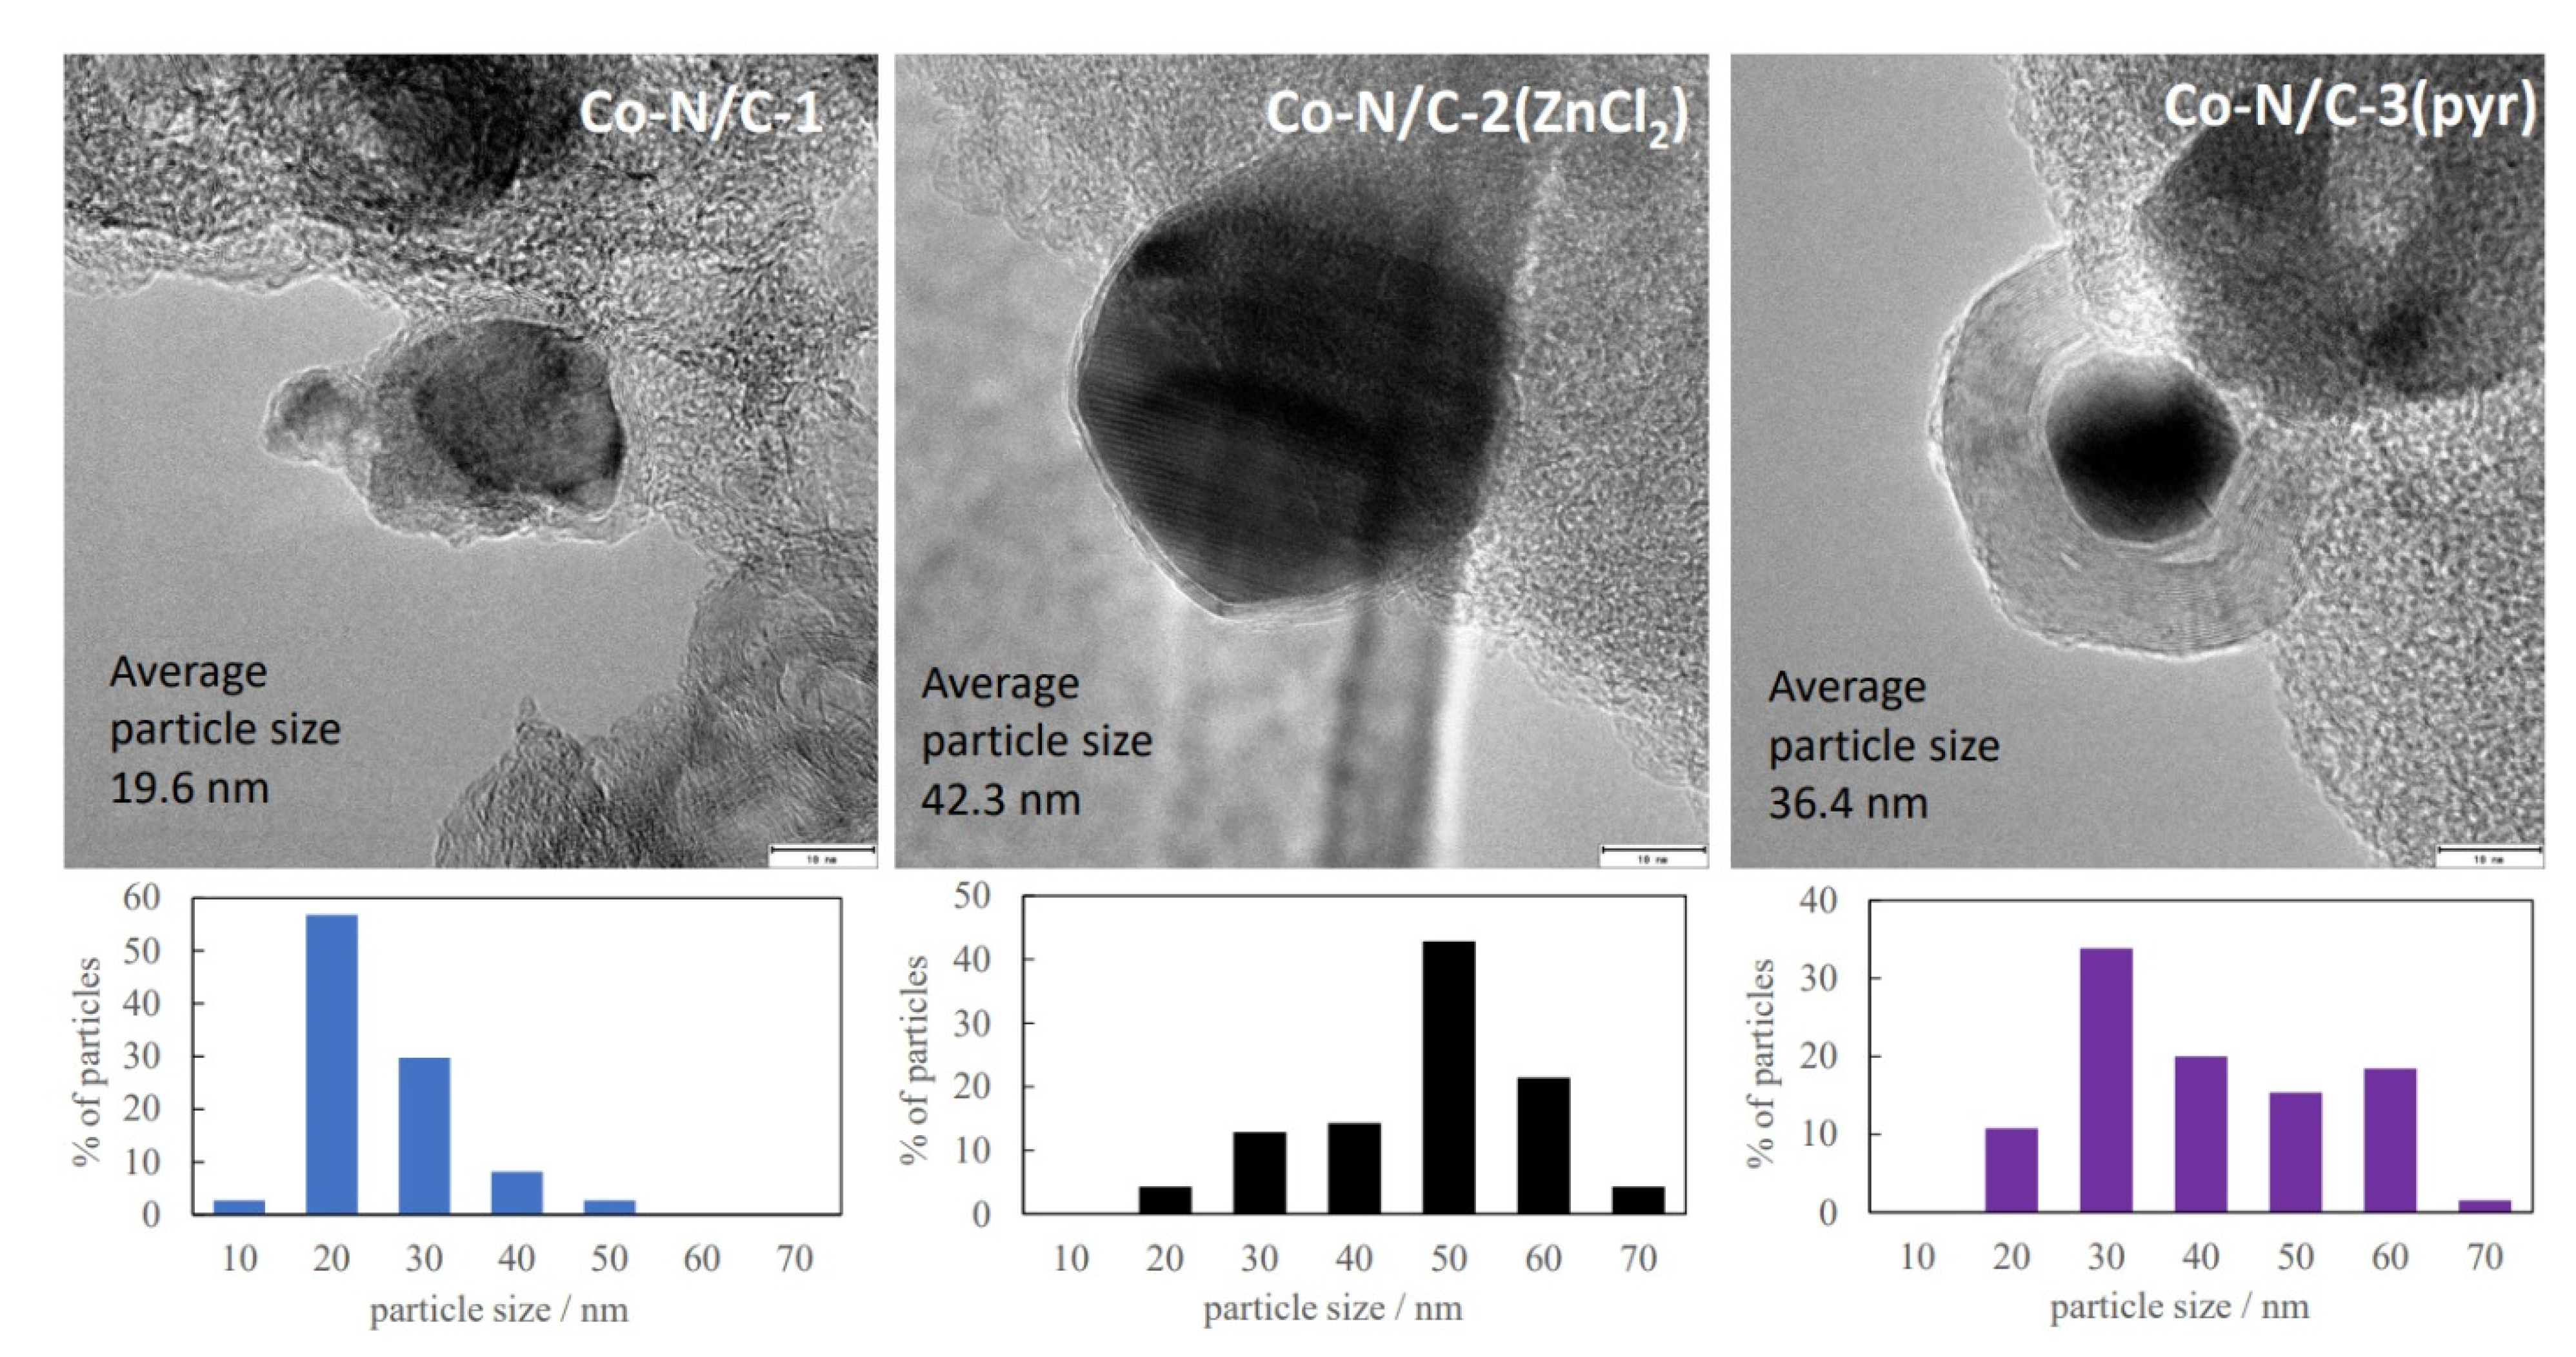
  • High-resolution transmission electron microscopy (HR-TEM) analysis was performed with a JEOL JEM-2100 (JEOL, Tokyo, Japan) device at a working voltage of 200 kV.
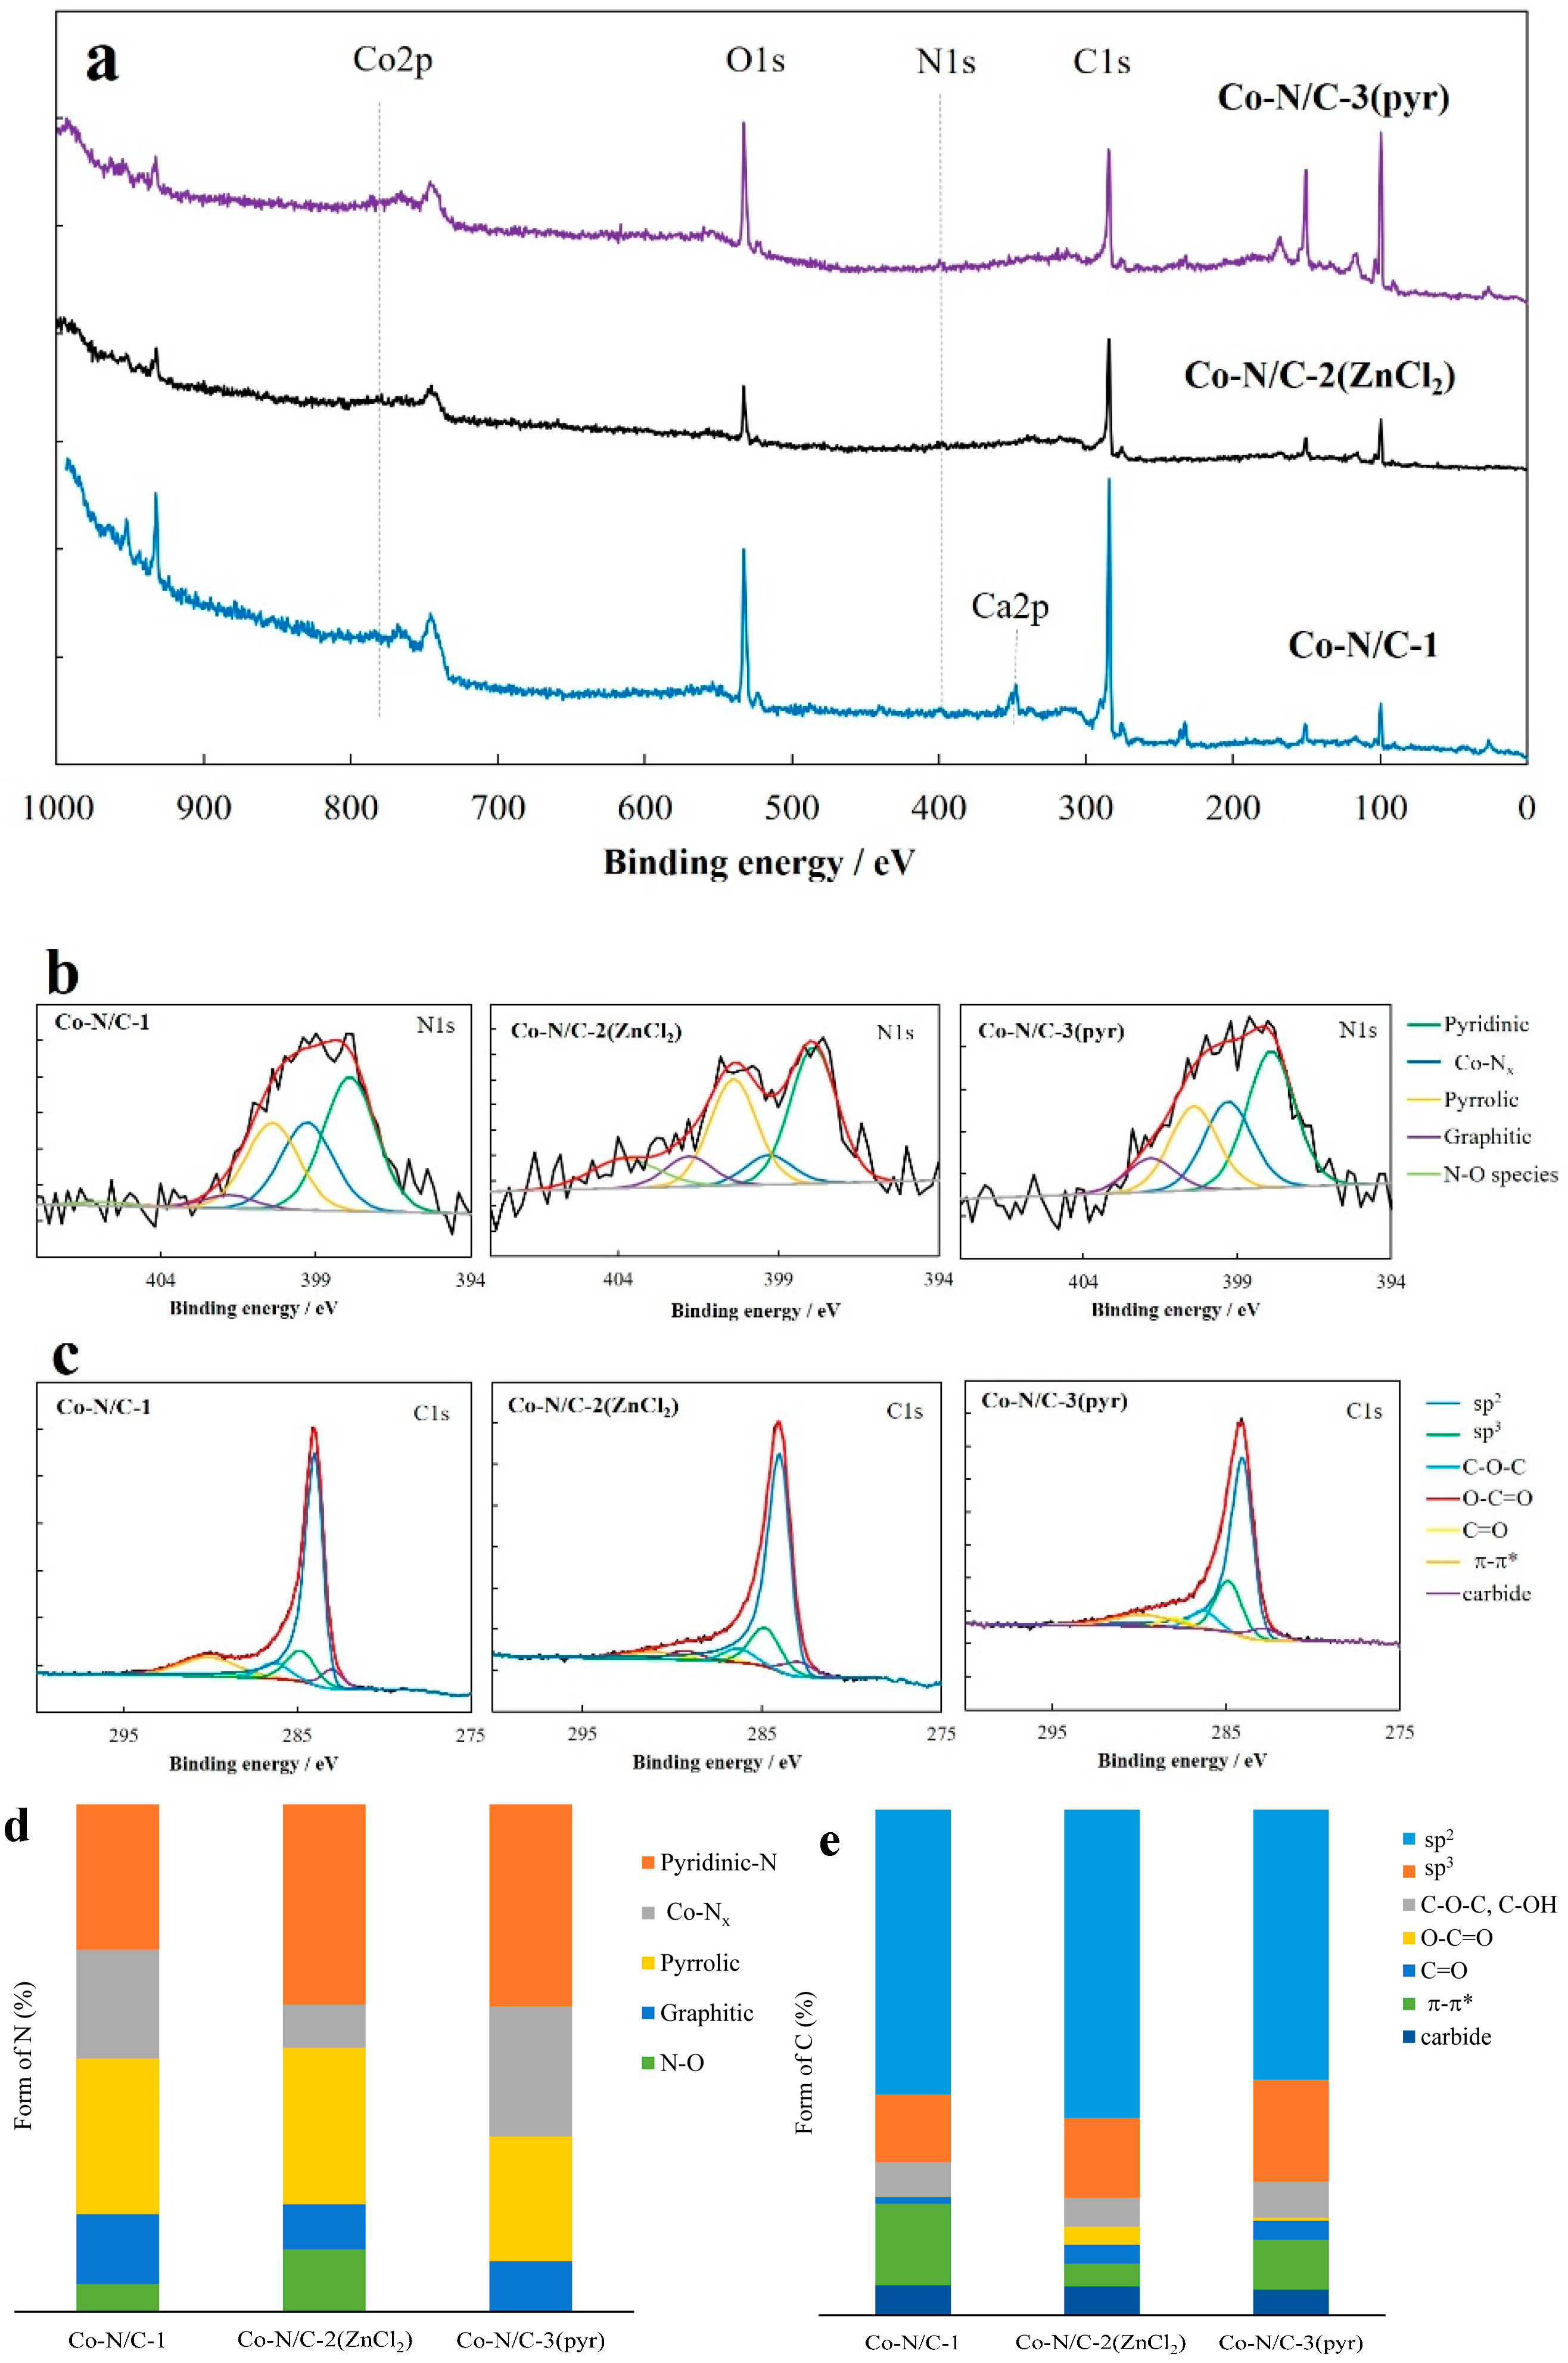
  • X-ray photoelectron spectroscopy (XPS) was used to determine the surface elemental composition of the Co-N/PDC catalysts. The measurements were carried out using a SCIENTA SES 100 spectrometer (SCIENTA, Uppsala, Sweden) with a non-monochromatic twin anode X-ray tube (Thermo XR3E2 (Thermo Fisher Scientific, Waltham, MA, USA)). Casa XPS software (v2.3.24, Casa Software, Tokyo, Japan, 2020) was applied to analyze the N1s and C1s spectra [27].
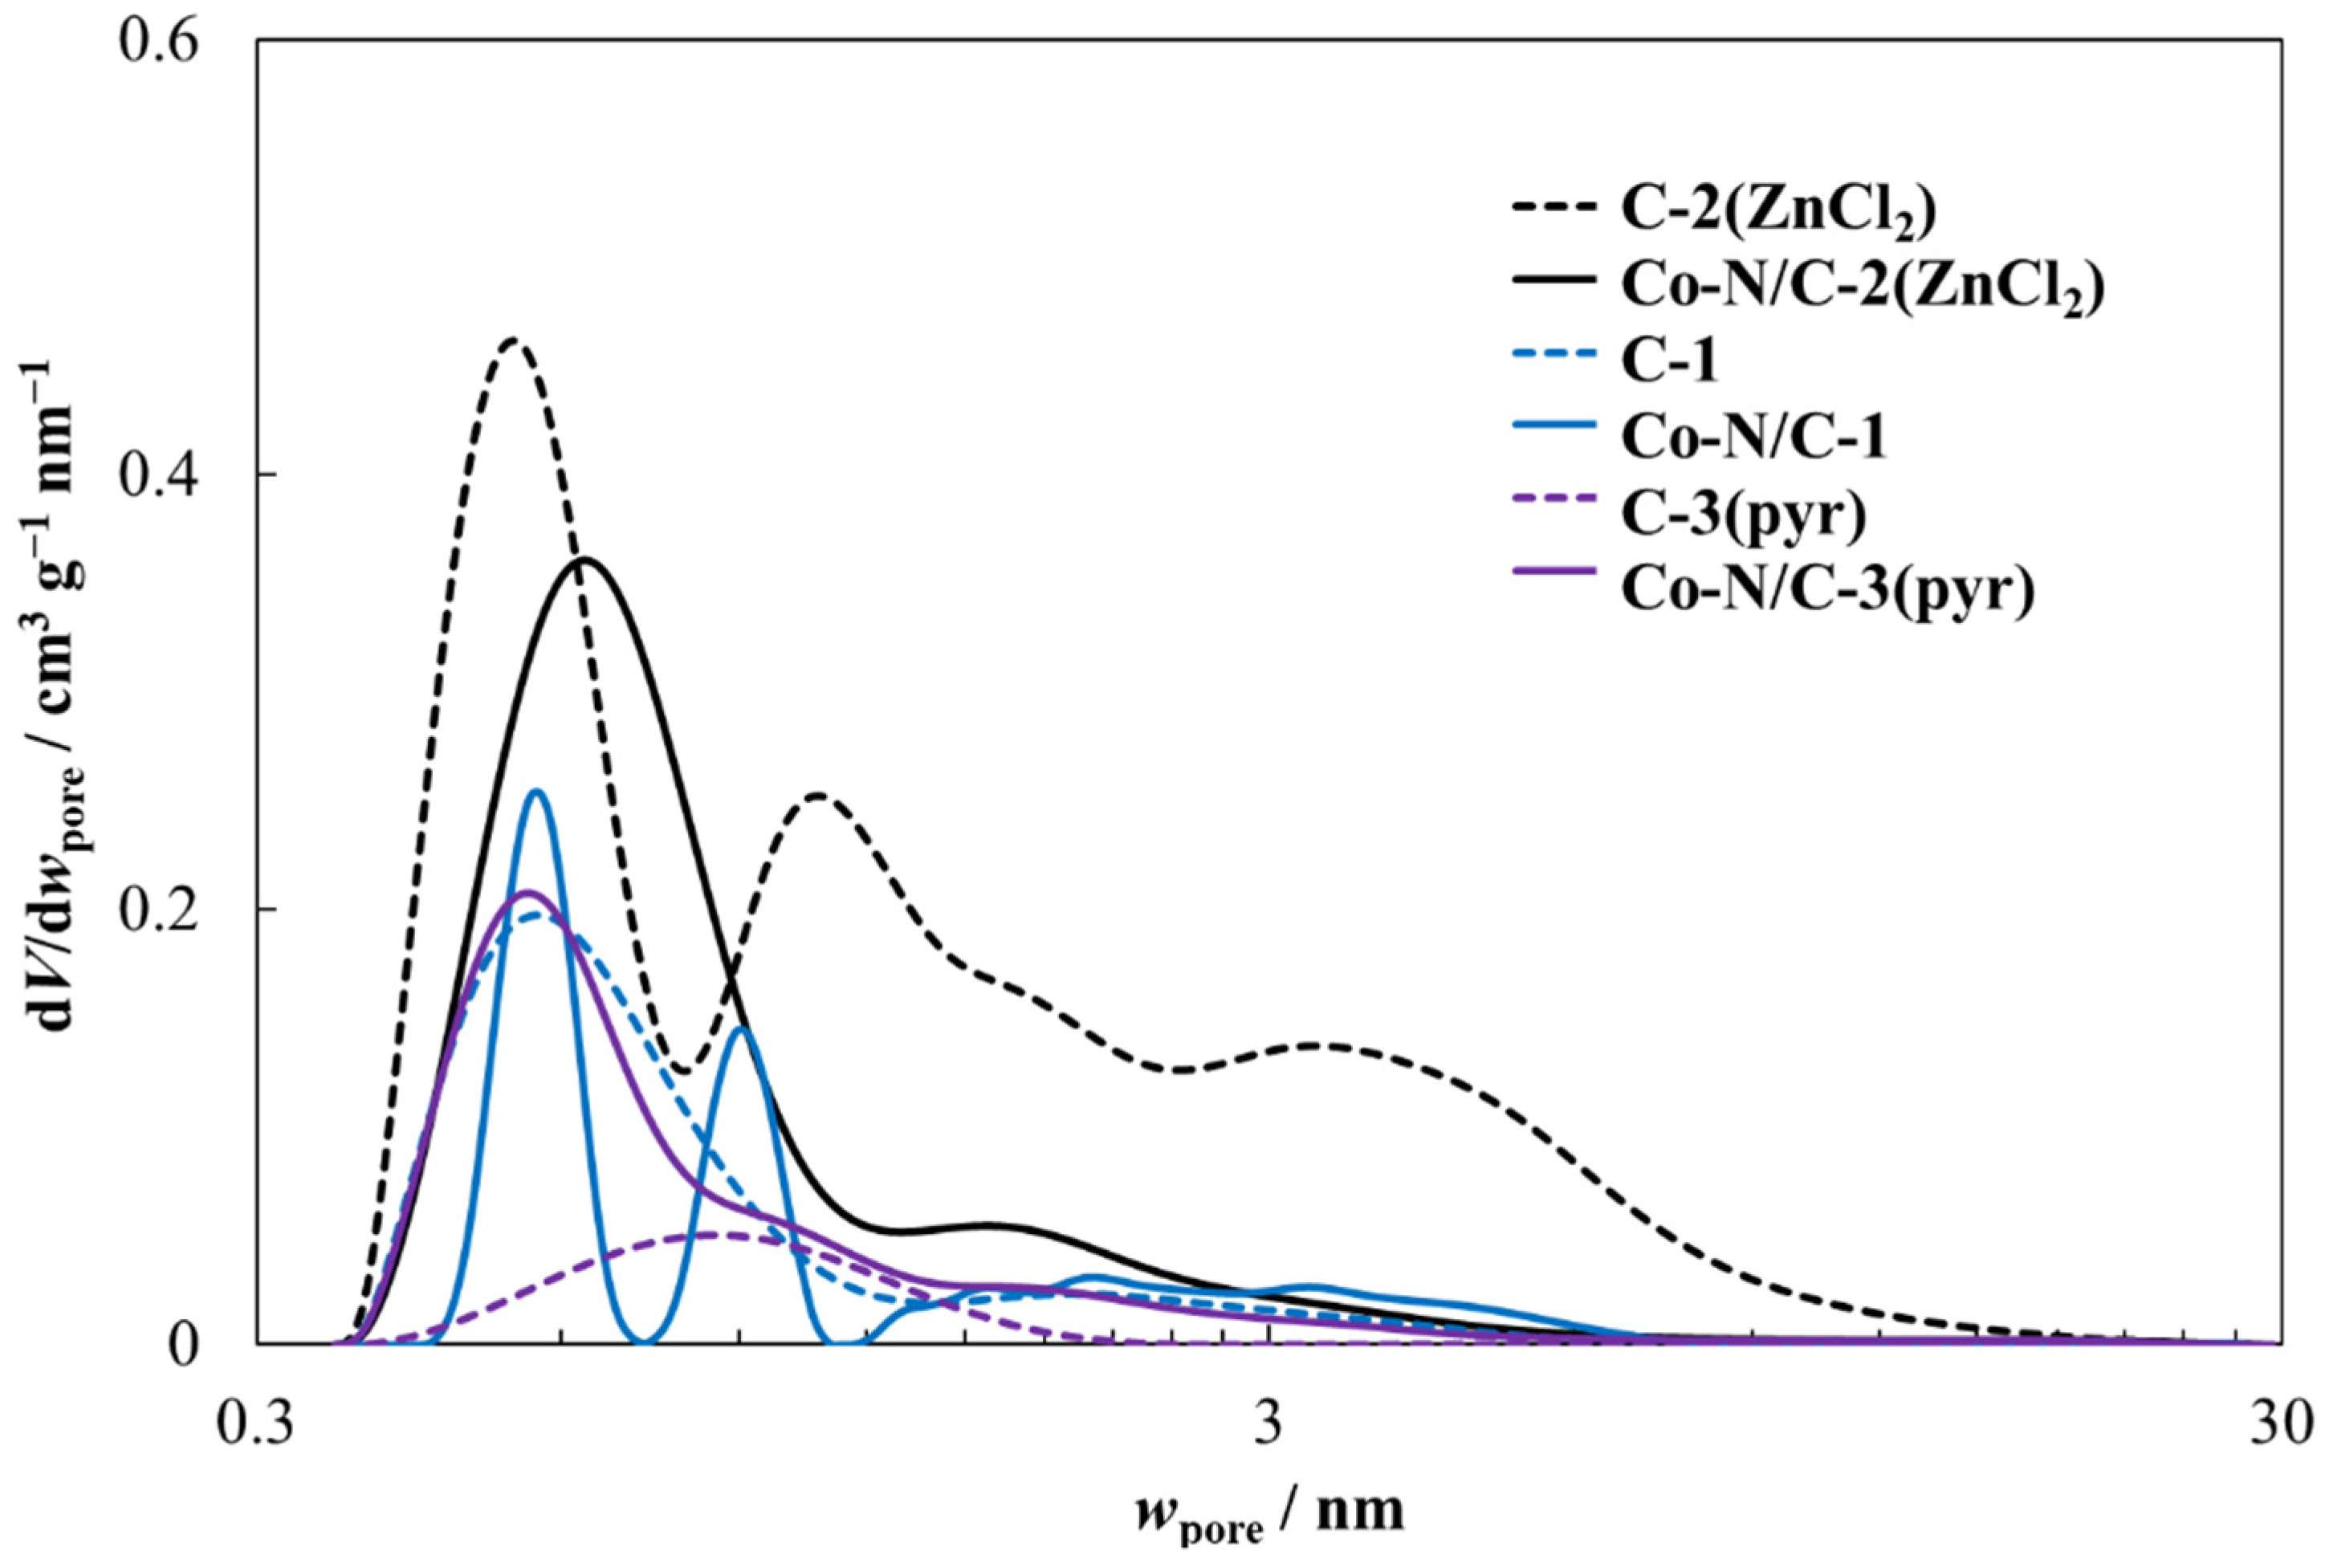
  • The specific surface areas (SBET) and pore size distributions were analyzed with the low-temperature nitrogen sorption method using an ASAP 2020 device (Micromeritics, Norcross, GA, USA). The SBET values were calculated using the Brunauer–Emmett–Teller (BET) multipoint theory. The specific surface area (SDFT), total pore volume (VDFT), and pore size distribution curves were calculated from N2 gas sorption isotherms by applying 2D-NLDFT theory using SAIEUS (v3.0, Micromeritics, Norcross, GA, USA, 2020) software [9,28,29,30].
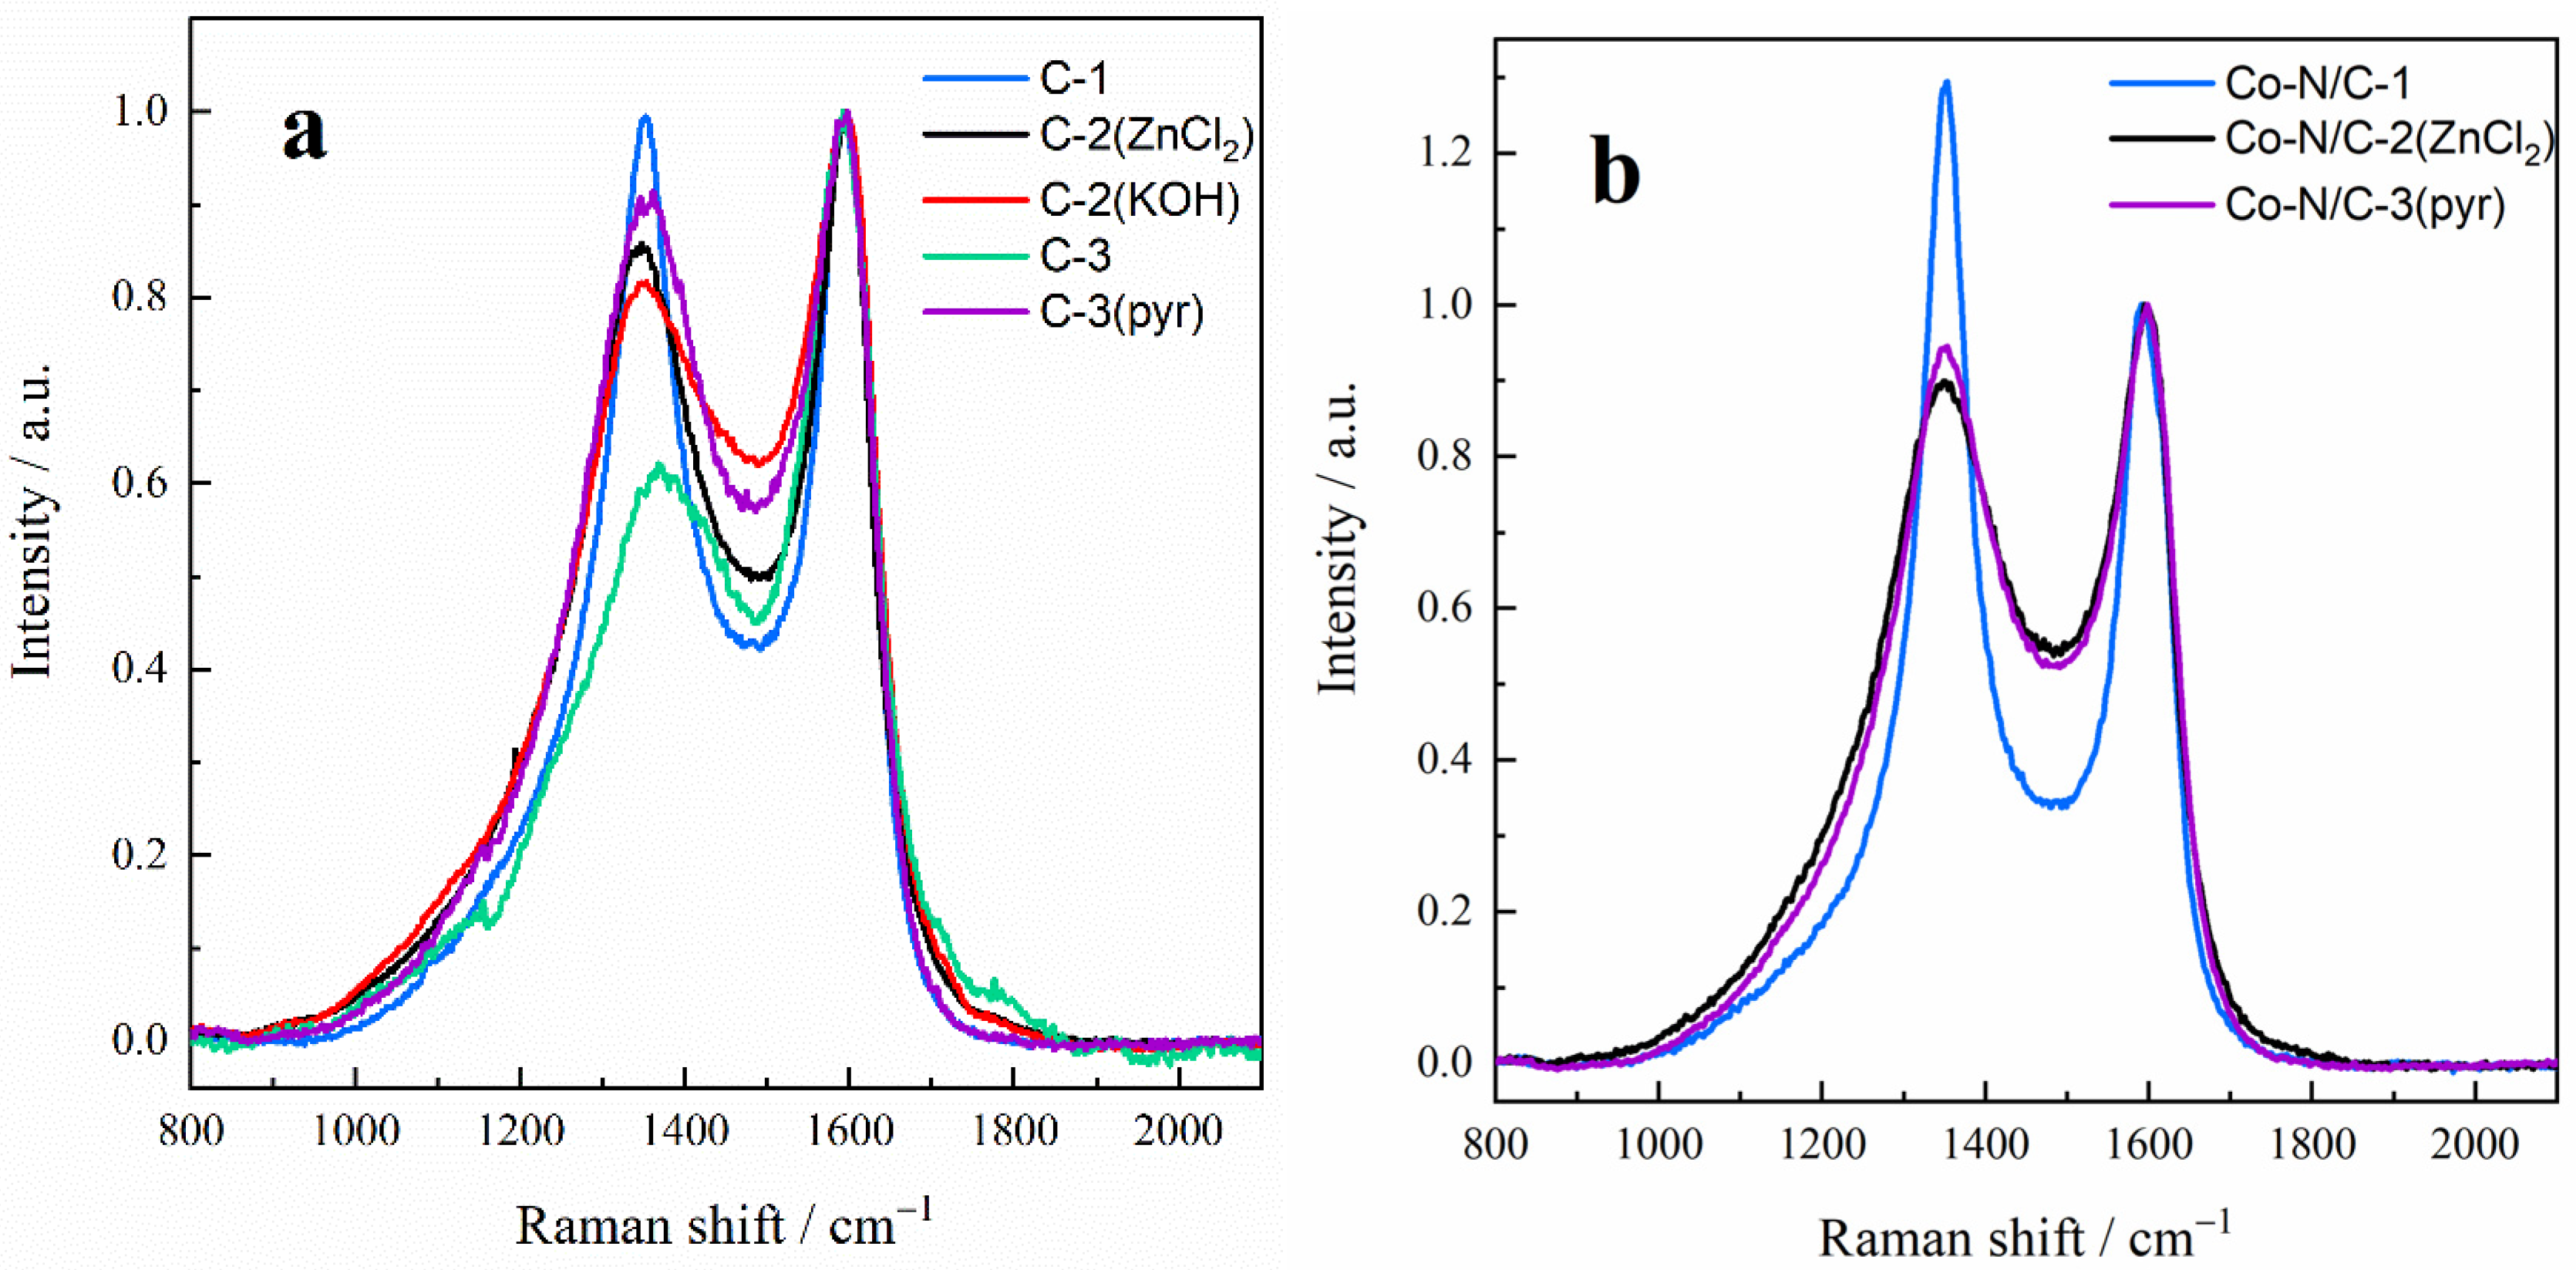
  • Raman spectroscopy was applied to characterize the graphitization degree of the PDCs and Co-N/PDCs. Raman spectra were recorded using a Renishaw inVia Raman spectrometer (Renishaw, West Dundee, IL, USA) with a 514 nm laser line. OriginPro 2016 software (v2016, Originlab, Northampton, MA, USA, 2016) was used for data analysis [31].

3.2. Electrochemical Characterization

The oxygen reduction reaction (ORR) activity of the materials was evaluated in a 0.1 M HClO4 solution (made from 67–72% HClO4, Sigma-Aldrich, St. Louis, MO, USA) using the rotating disc electrode (RDE) method. Voltammograms were recorded in a three-electrode system consisting of a catalyst-covered working electrode, a reference electrode (saturated calomel electrode), and a glassy carbon rod as the counter electrode. All measured potentials were converted to values versus the reversible hydrogen electrode (RHE). Electrochemical impedance spectroscopy data have been used to correct the measured current values against the ohmic potential drop.
The catalyst ink was prepared by first mixing the carbon material with isopropyl alcohol (99.0%, Sigma-Aldrich, St. Louis, MO, USA) and Milli-Q® water. Nafion® (~5% solution, Sigma-Aldrich, Aldrich Chemistry, St. Louis, MO, USA) was then added to the suspension. The mixture was sonicated in a cooled ultrasonic bath for 1 h. The polished glassy carbon electrodes were coated with the catalyst ink (9 µL), and the final catalyst loading was 1.0 ± 0.1 mg cm–2 for all studied materials.

3.3. PEMFC Measurements

Membrane-electrode-assemblies (MEAs, S = 5 cm2) were prepared by hot-pressing (135 °C, pressure, 2 min) together a Nafion® HP (FuelCellStore, College Station, TX, USA) membrane and two Sigracet 25 BC (FuelCellStore, College Station, TX, USA) gas diffusion media, which were previously coated with catalyst layers. Beforehand, catalyst inks were prepared from certain Co-N/PDC materials described in the previous section but with an ionomer to catalyst ratio of 1.75:1. Next, the inks were deposited in 200 µL aliquots onto the gas diffusion media and left to dry in ambient conditions resulting in a final cathode loading of 4.0 ± 0.1 mg cm−2. The catalyst coated (1.0 ± 0.1 mg cm−2, 60 wt% Pt/Vulcan, FuelCellStore, College Station, TX, USA) gas diffusion media used as the anodes were prepared using an ultrasonic spray coating method [32]. The PEMFC measurements were conducted by directing fully humidified O2 and H2 into a cell heated up to 80 °C at a flow rate of 200 mL min−1 and applying backpressure of 100 kPa. The polarization curves were measured galvanostatically with a current step of 0.04 A cm−2 and by allocating 1 min of collection time for each data point.

4. Results and Discussion

4.1. Physical Characterization of Materials

HR-SEM images for all materials under study are shown in Figure 2, which indicate that depending on the carbonization method used to prepare the PDCs, the received carbon materials have noticeably different morphologies. The synthesized PDCs consist of large carbon grains of various sizes (images in the top row of Figure 2).
The peat-derived carbons are very inhomogeneous due to the original structure of the peat moss [9]. A particularly large difference is evident when comparing the structure of materials activated with ZnCl2 and KOH. Activating peat with KOH leads to a sponge-like structure because KOH reacts directly with the carbon while ZnCl2 acts as a templating agent [33,34,35,36]. A similar phenomenon was observed in the synthesis of carbons using glucose-derived carbon [25]. It is interesting to mention that contrary to PDC, the surface structure of cobalt and nitrogen co-doped materials are morphologically quite similar (images in the bottom row of Figure 2). It seems that the further synthesis process via ball-milling and pyrolysis leads to a more homogenized morphology. Furthermore, the average grain size is comparable for different materials. SEM-EDX demonstrates that C-1 consists mainly of C, Ca (almost 20 wt%), O, and less than 1 wt% other elements, which probably originate from various minerals and compounds naturally occurring in peat moss [37,38]. In order to reduce the amount of impurities, the carbonization procedure was altered to include a chemical activation step for the other PDC materials. As a result, the PDCs contain significantly fewer residual elements (Table 1). After the Co-N/PDC catalyst synthesis procedure, the content of residual elements was unchanged. Moreover, the modification process increased the amount of nitrogen in the samples. Additionally, all Co-N/PDC catalysts contain cobalt ranging from 3.0 to 5.9 wt%, which indicates that co-doping the PDC materials with Co and N was successful.
Powder XRD method (Figure 3) was used to determine the crystalline phases in the Co-N/PDC catalysts. Based on the analysis, metallic cobalt and cobalt oxide species have been identified in XRD patterns for all studied Co-N/PDC catalysts. Co-N/C-1 showed a peak at 45.0°, which interestingly corresponds to a FeCo alloy (wairauite). Since the undoped carbon (C-1) contained a small amount of iron (determined by SEM-EDX (Table 1), this alloy was consequently formed during the synthesis of Co-N/C-1. This catalyst also contains a significant amount of calcium, which according to XRD data exists mainly as the mineral portlandite (Ca(OH)2) but a smaller amount in the form of oldhamite ([Ca, Mg]S) [24]. The diffractogram corresponding to Co-N/C-3(pyr) includes ZrO2, which originates from the ZrO2 balls and crucible used in the catalyst synthesis process. However, for Co-N/C-1 and Co-N/C-2(ZnCl2) no visible diffraction peaks characteristic of ZrO2 have been assigned.
For comparison, the detailed structures of three Co-N/PDC catalysts are illustrated in HR-TEM images (images in the top row of Figure 4). Most of the cobalt particles are encapsulated in graphitic carbon layers. HR-TEM images indicate that Co-N/C-3(pyr) material shows a much higher number of graphitic carbon layers (from 12 up to 30) compared to Co-N/C-1 (~7) and Co-N/C-2(ZnCl2) (~5) materials. The interplanar distance of the Co particles calculated from the HR-TEM images is around 2.5 Å for both Co-N/C-1 and Co-N/C-2(ZnCl2) materials indicating that the particles are mainly composed of CoO, which confirms the XRD results. For the Co-N/C-3(pyr) sample, we cannot resolve any lattice planes in the particles due to the thickness of the encapsulating carbon layer. Unfortunately, nothing can be deduced from the SAED data.
Additionally, approximately 100 cobalt nanoparticles were measured to evaluate the average cobalt particle size of the catalysts (diagrams in the bottom row of Figure 4). Although the synthesis of these Co-N/PDC catalysts was performed under the same conditions, the particle size distribution appears to depend on the carbon support material used. The average cobalt particle size was smallest in Co-N/C-1 material (19.6 nm), while in Co-N/C-3(pyr) and Co-N/C-2(ZnCl2) materials the average particle size was 36.4 nm and 42.3 nm, respectively.
XPS was used to study the surface chemistry and the elemental composition of the three most active ORR catalysts (discussed below). Data are summarized in Table 2. From the wide-scan spectra (Figure 5a), it is possible to distinguish peaks for C1s, O1s, N1s, and in the case of Co-N/C-1 material, even Ca2p at ~347 eV. Detection of Co peak failed mainly because the metal particles were highly encapsulated and covered by thick carbon layers (shown in TEM images in Figure 4) [39,40]. All catalysts contained a notable amount of nitrogen (from 1.5 to 2.4 at%). The highest total nitrogen content was found for Co-N/C-2(ZnCl2), which also displayed the highest ORR activity in the acidic solution.
The N1s region was divided into five nitrogen species, which correspond to pyridinic, Co–Nx, pyrrolic, graphitic, N–O bonds [41,42,43]. A majority of the nitrogen was distributed among the pyridinic, Co–Nx, and pyrrolic species (Figure 5b,d). However, in the C1s spectra (Figure 5c,e), the peak was deconvoluted into seven different carbon forms dominated by sp2 carbon. It is interesting to mention that the proportion of carbon-oxygen functionalities (such as C–O–C, C–OH, O–C=O, C=O) increases in the same order as the ORR activity of the catalysts under study, i.e., Co-N/C-1 ˂ Co-N/C-3(pyr) ˂ Co-N/C-2(ZnCl2). Serov et al. [44] have shown that in an acidic solution, the ORR activity correlates with the number of active sites (i.e., N content and pyridinic N) and concentration of defects (i.e., carbon oxides), indicating that a bifunctional mechanism of ORR occurs in acidic media. The data obtained in our work supports this observation, and it can be argued that a higher nitrogen content (pyridinic N) and the number of defects lead to higher ORR activity in acidic solution.
The N2 sorption method was used to investigate the porosity characteristics of both the undoped PDC materials and Co and N co-doped PDC catalysts. As shown in Table 3, the synthesized PDC materials have very different specific surface area values (SBET) in the range from 90 to 1270 m2 g–1.
Doping these carbon support materials with cobalt and nitrogen centers influences their porosity characteristics noticeably, and after the modification the SBET values are in the range from 246 to 520 m2 g−1. Based on our previous data [23,24], co-doping highly porous carbon materials with Co and N via ball-milling decreases the specific surface area significantly. This is probably due to the fact that the pores of the carbon support material are filled to some extent with the complex compound of cobalt and 2,2′-bipyridine during the ball-milling, which is evident when comparing the pore size distributions calculated for C-2(ZnCl2) and Co-N/C-2(ZnCl2) (Figure 6). In contrast, when doping a low specific surface area carbon (C-3(pyr)) in the same way, the specific surface area and the total pore volume increase drastically. This is caused by the ball-milling and subsequent pyrolysis step, which modify the carbon structure. However, it can be seen that doping C-1 with Co and N does not affect the SBET value or the pore size distribution [24]. Therefore, we can conclude that the SBET values for the synthesized Co-N/PDC catalysts differ less (2-fold) compared with the data for undoped carbon materials (14 times).
Raman spectra for PDCs show two characteristics peaks: D peak (at Raman shift 1334 cm−1) and G peak (1594 nm−1) (Figure 7a) [45,46]. The Raman profile is influenced by the neighboring atoms of the vibrating molecule or atoms. Any variation in the nearby structure will affect the width of the Raman mode. When disorder decreases, the bands become narrower, and the relative intensities of the bands change. In the graphitization pathway, when starting with amorphous carbon, the intensity of the D band first increases (Stages I-III of graphitization) and then decreases when the structure of the carbon approaches that of graphitic carbon (Stage IV of graphitization) [47]. Considering the intensity ratio ID/IG and the width of the D band, the sequence of the peat-derived carbons by their graphitization degree decreases in the following order C-1 >> C-2(KOH) > C-2(ZnCl2)~C-3(pyr) >> C-3 (Table 4). This sequence correlates closely with the pyrolysis temperature used in the carbonization procedure, i.e., a higher treatment temperature results in a carbon material with a higher degree of graphitization. The exception was observed for C-3(pyr), which was produced by applying two independent pyrolysis steps. In this case, the initial pyrolysis conducted at 450 °C resulted in the formation of local graphitic domains [10]. The second pyrolysis step (at 1000 °C) only reorganizes the already existing graphitic domains, resulting in a lower graphitization degree compared to the C-1 carbon.
Additionally, Raman spectra for the three most active ORR catalysts were collected (Figure 7b). Doping the PDC with cobalt and nitrogen makes the D and G peaks narrower (Table 4), suggesting that the Co-N/PDC catalysts have become more ordered. The ratio of the D and G band intensities increases after doping the carbon with Co and N, which also indicates that the level of disorder somewhat decreases during the catalyst synthesis process. According to the width of the D band, the graphitization of the Co-N/PDC catalysts decreases in the following order: Co-N/C-1 >> Co-N/C-3(pyr) >> Co-N/C-2(ZnCl2).

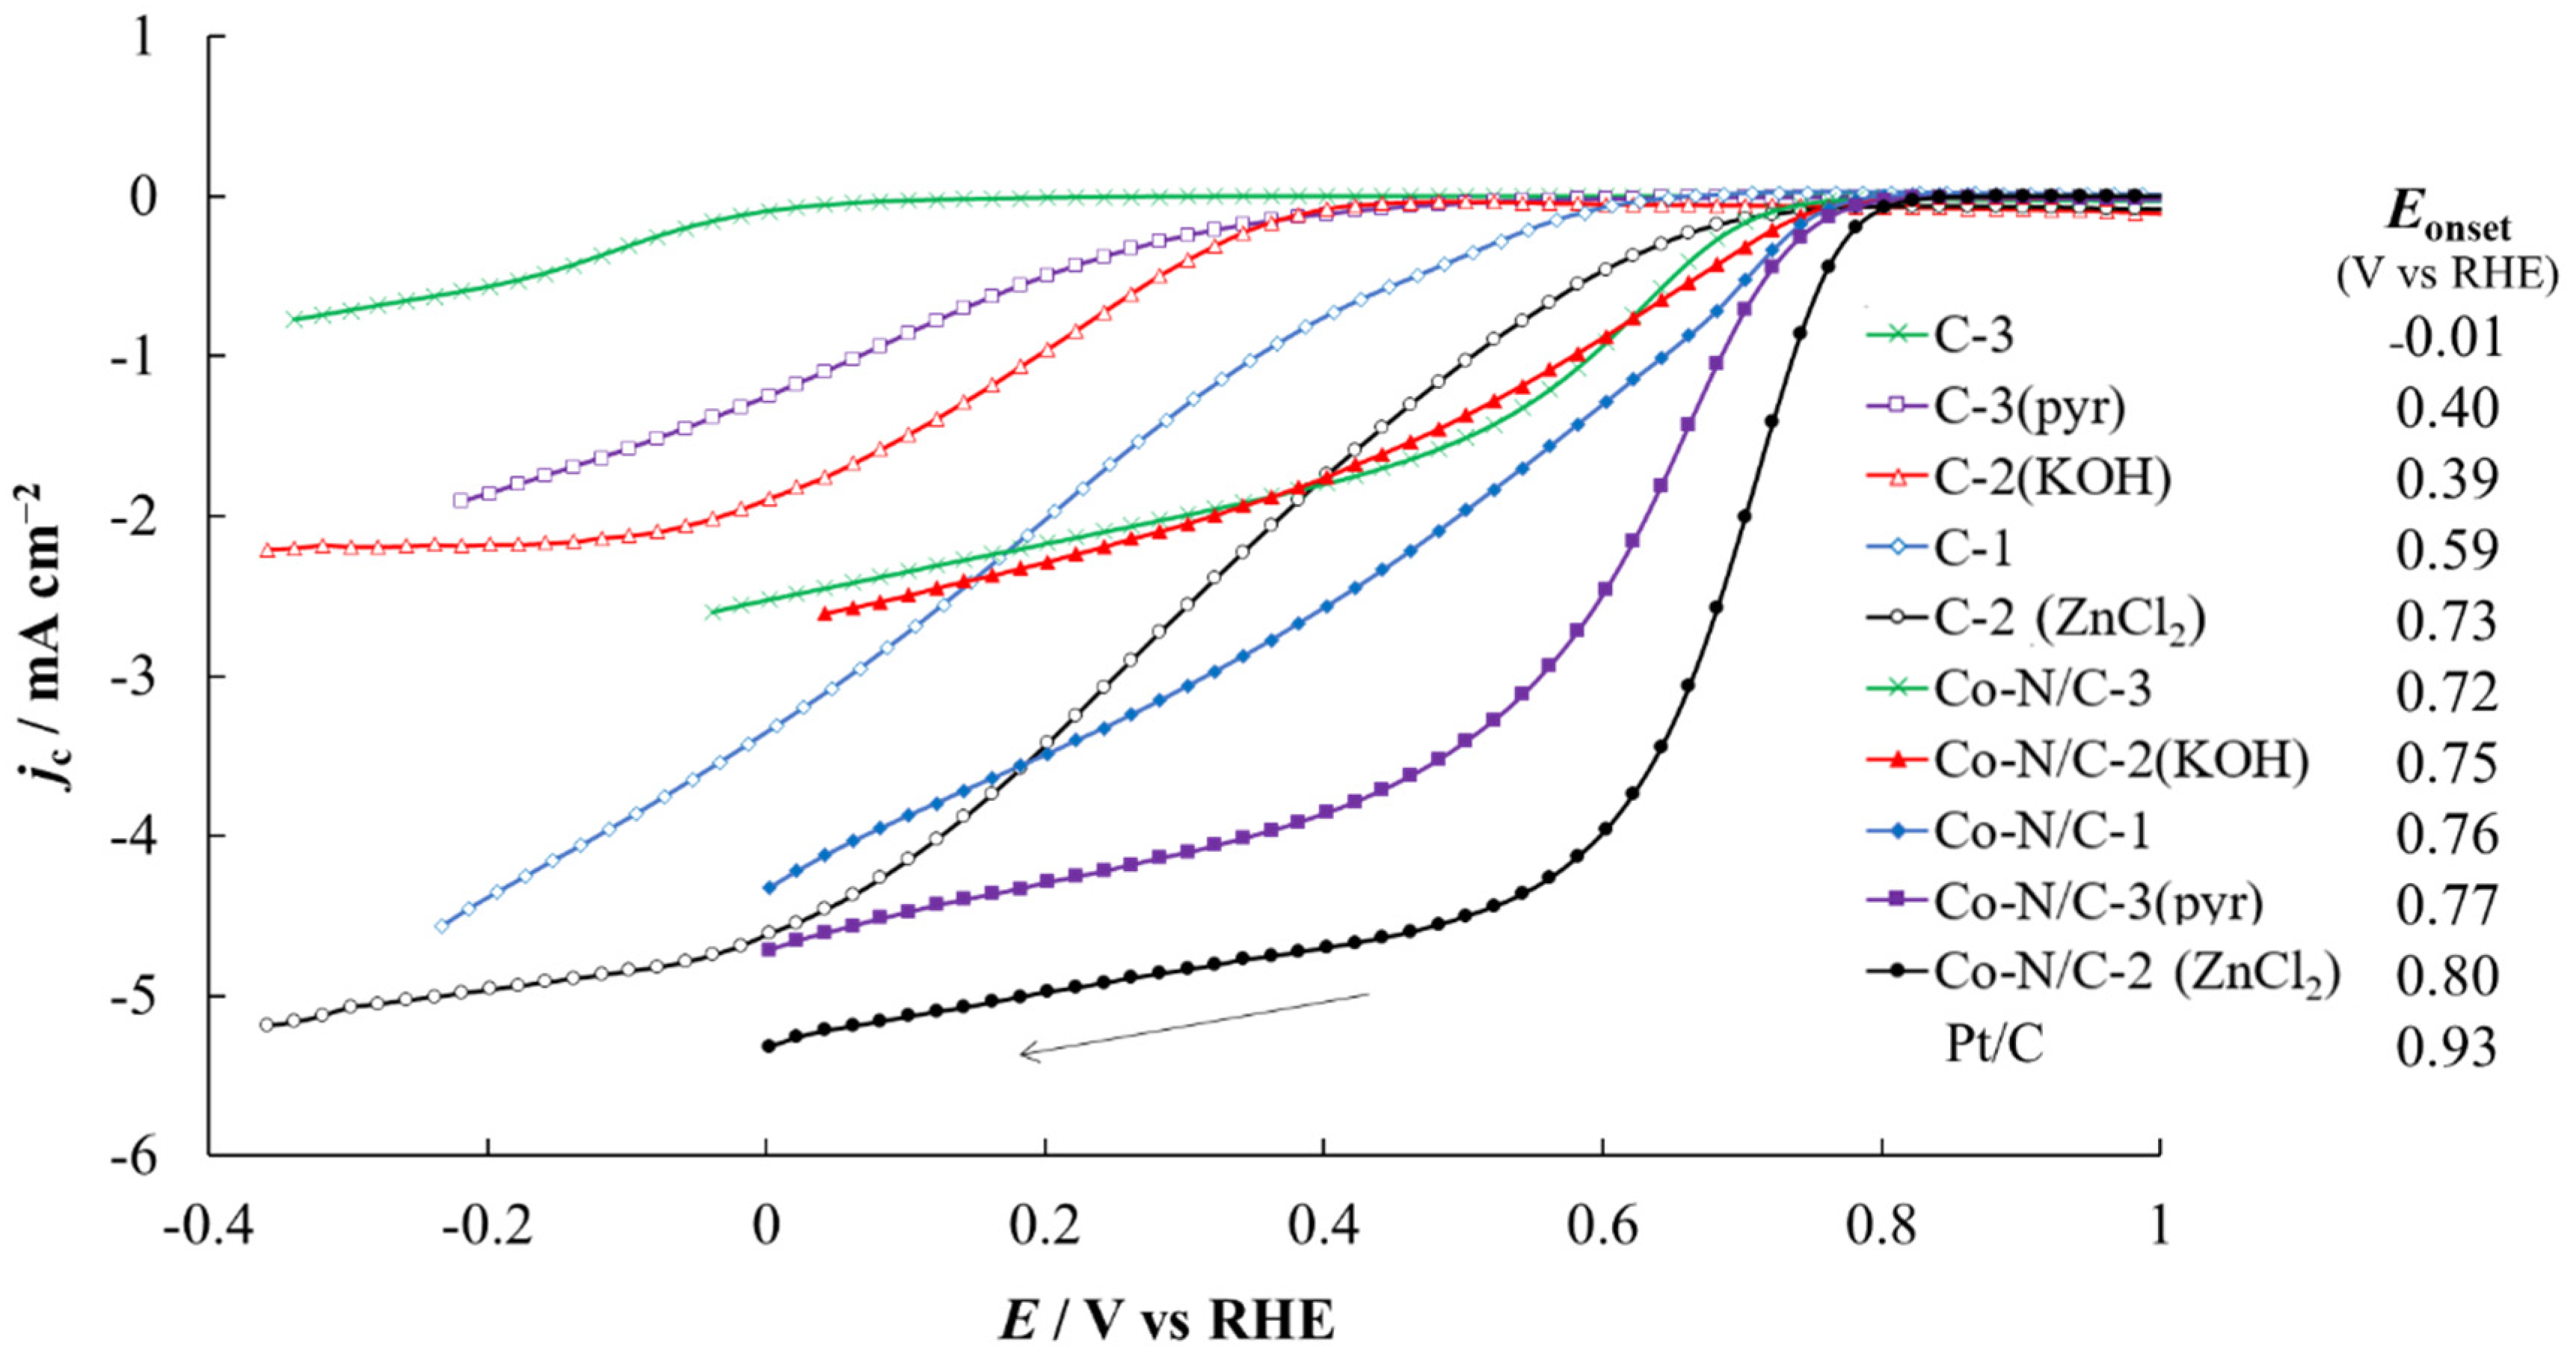
4.2. ORR Analysis by RDE
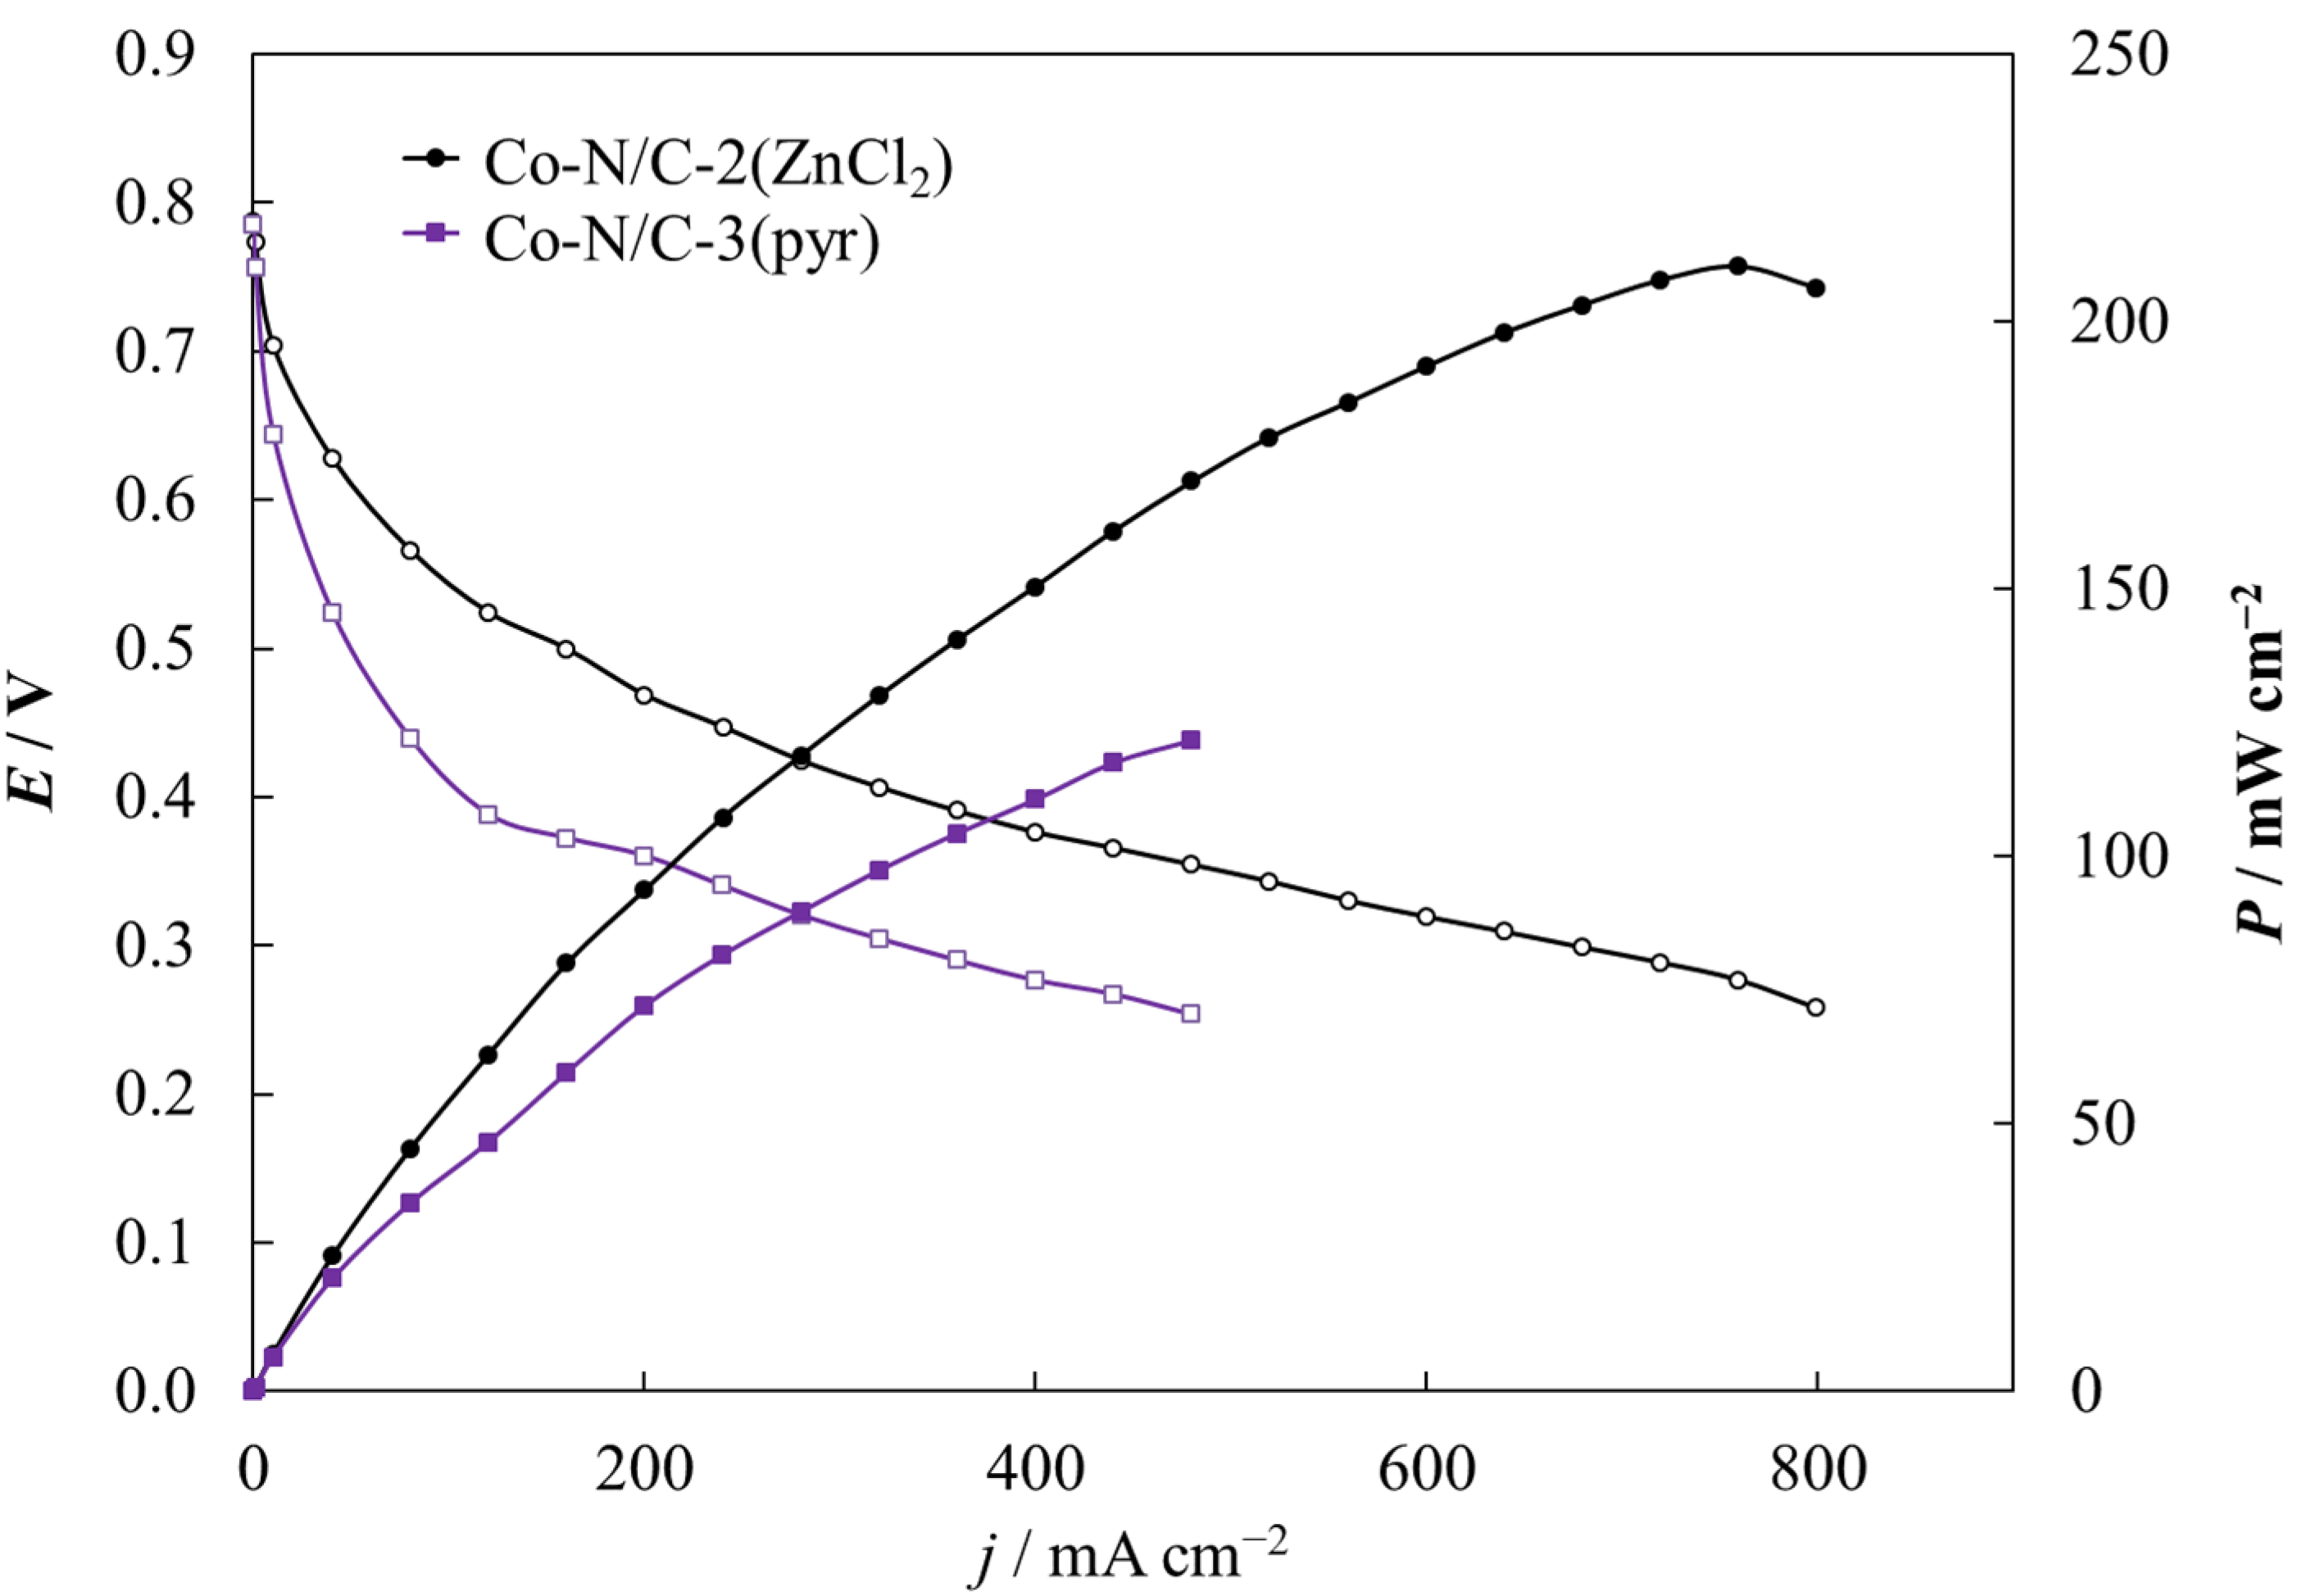
In order to evaluate the ORR activity of the materials, RDE curves were obtained in 0.1 M HClO4 solution at 2000 rpm (Figure 8). As expected, since the undoped PDC materials have different surface morphologies and physical properties, they also display significantly different ORR activity. The obtained onset potential (Eonset) values increase in the following order: C-3 ˂ C-3(pyr) ˂ C-2(KOH) ˂ C-1 ˂ C-2(ZnCl2). The difference in onset potentials is about 740 mV, indicating that the method used to synthesize the carbon support is exceedingly important. Additionally, for most PDC materials, a plateau of diffusion-limited currents has not formed, and therefore the calculation of the half-wave potential (E1/2) values and number of electrons transferred (n) is not reliable. The highest ORR activity (Eonset value of 0.73 V vs RHE) was achieved for C-2(ZnCl2), where the peat was activated with ZnCl2 and pyrolyzed at 700 °C.
As expected, the Co and N co-doped PDC catalysts display much higher ORR activity than the undoped PDC materials (Figure 8) and the Eonset values increase in the following order: Co-N/C-3 ˂ Co-N/C-2(KOH) ˂ Co-N/C-1 ˂ Co-N/C-3(pyr) ˂ Co-N/C-2(ZnCl2). The two highest Eonset values of 0.80 V and 0.77 V vs RHE were measured for Co-N/C-2(ZnCl2) and Co-N/C-3(pyr), respectively. In general, it appears that the more active the carbon support material used in the synthesis, the more active ORR catalyst can be synthesized from it. It is worth noting that the Eonset values of the Co-N/PDC catalysts differ only by 75 mV, when the difference in Eonset values of the PDC materials was almost ten times greater, which may be because the specific surface area of the PDCs differed significantly more than that of the synthesized Co-N/PDCs. Additionally, based on HR-SEM images (Figure 2), the surface morphologies of the Co-N/PDC catalysts are similar, but the surface morphologies of the PDCs are very different. Moreover, ORR activity is highly influenced by the proportion of carbon-oxygen functionalities as well as by the total nitrogen content supported by the XPS analysis results (Figure 5 and Table 2). Comparing the Eon values of the Co-N/PDCs to the Eon value of a commercial 20% Pt/Vulcan XC-72® (Fuel Cell Earth, Woburn, MA, USA, noted as Pt/C in Figure 8) catalyst reveals that improvements can still be made to reach higher ORR activities.

4.3. PEMFC Analysis

Single cell experiments were conducted to investigate the electrochemical activity of the two more promising Co-N/PDC catalysts, demonstrated by RDE analysis. The polarization and power density curves for the assembled PEMFC single cells are presented in Figure 9. From the calculated power density curves, we can see that the maximum power density is almost two-fold higher for a single cell with an MEA prepared from Co-N/C-2(ZnCl2) as the cathode (210 mW cm−2) compared to a Co-N/C-3(pyr) cathode (122 mW cm−2). The single cell based on Co-N/C-2(ZnCl2) displayed better performance than Co-N/C-3(pyr) due to the presence of a higher amount of surface oxides and nitrogen as it was obtained from XPS data (Figure 5), which increase the electrochemical activity of an NPGM-type catalyst according to the literature [48]. In addition, the difference in performance correlates well to the almost two-fold difference in the specific surface area values of the studied materials, 520 m2 g−1 and 273 m2 g−1 for Co-N/C-2(ZnCl2) and Co-N/C-3(pyr), respectively. There are examples in the literature that catalysts with higher porosity have better activity in PEMFC tests [49,50].
It should be noted that to our knowledge, this is the first attempt at utilizing PDC-based catalyst materials as cathodes in a PEMFC and thus the MEA fabrication procedure was not optimized yet for such type of catalysts. Even in the case of platinum-based cathodes, widely different results have been obtained by various groups utilizing different MEA fabrication procedures [51,52]. For example, as we know from the literature, ionomer content optimization can drastically change the performance of MEAs containing NPGM catalysts [48,53,54,55]. The preparation of the catalyst layer and MEA is critically important when better performance is desired. The catalyst layer is applied either directly to the membrane or to the gas diffusion layers, which are then hot pressed together with the membrane [56,57,58]. In both cases, there is a multitude of parameters that severely influence the final performance of an MEA and thus require rigorous optimization. Overall, our experiments indicate that synthesizing promising NPGM catalysts is possible by co-doping PDCs with Co and N. These results can be improved by modifying the morphology and porosity of Co-N/PDC materials via altering the used synthesis procedure.

5. Conclusions

This study compared the physical properties and catalytic activity of five peat-derived carbons and Co-N/PDC catalysts synthesized from PDCs. According to the physical characterization methods data (N2 sorption, XPS, HR-SEM, etc.), we can conclude that depending on the carbonization method used, carbons with very different surface morphologies, elemental compositions, porosities, and graphitization levels were obtained. In addition, the electrochemical ORR activity in acidic solution determined by the RDE method very strongly depends on the physical characteristics of the carbon and is very different for the studied carbon materials. The difference in onset potentials is about 740 mV, indicating that the method used for peat carbonization is critical. Co-doping the peat-derived carbons with both cobalt and nitrogen shows significantly better ORR performance compared to the undoped carbons. The Co-N/PDC catalyst synthesized from ZnCl2-activated and pyrolyzed peat showed the highest ORR activity in both RDE experiments (Eonset = 0.80 V vs. RHE) and polymer electrolyte membrane fuel cell tests (maximum power density value of 210 mW cm−2). The catalyst with the best ORR performance has the highest nitrogen content and the highest number of surface oxides species as confirmed by XPS.
In summary, the results of this study confirm that peat is a very good material for synthesizing carbon supports and the received carbons are promising candidates for the further synthesis of NPGM type catalysts. This result is significant because well-decomposed peat is currently an unused resource in Estonia, and when it is left exposed in the peat strip mines, it begins to emit methane, carbon dioxide, and other gases. It cannot be used in agriculture or for heating. Our work presents an opportunity to utilize peat, of which approximately 1 million tons remain unused every year in Estonia, as a precursor for the preparation of advanced functional materials.

Author Contributions

R.J.: conceptualization, investigation, formal analysis, validation, writing—original draft, writing—review and editing, visualization. P.T.: conceptualization, investigation, formal analysis, validation, writing—original draft, writing—review and editing, visualization. M.P.: methodology, resources. M.H.: methodology, resources. A.A.: methodology, resources. O.V.: investigation, formal analysis. E.H.: investigation, formal analysis. Z.K.: investigation. T.R.: investigation. R.H.: formal analysis, writing—review and editing. J.A.: investigation, formal analysis. A.K.: investigation, formal analysis. E.L.: writing—review and editing, supervision, funding acquisition. All authors have read and agreed to the published version of the manuscript.

Funding

This research received no external funding.

Acknowledgments

This work was supported by the EU through the European Regional Development Fund under projects TK141 “Advanced materials and high-technology devices for energy recuperation systems” (2014-2020.4.01.15-0011), NAMUR “Nanomaterials - research and applications” (3.2.0304.12-0397), PRG676 “Development of express analysis methods for micro-mesoporous materials for Estonian peat derived carbon supercapacitors” (01.01.2020–31.12.2024) and PUT1581 (1.01.2017–31.12.2020).

Conflicts of Interest

The authors declare no conflict of interest.

References

  1. Gröger, O.; Gasteiger, H.A.; Suchsland, J.-P. Review—Electromobility: Batteries or Fuel Cells? J. Electrochem. Soc. 2015, 162, A2605–A2622. [Google Scholar] [CrossRef]
  2. Bailey, S.E.; Olin, T.J.; Bricka, R.; Adrian, D. A review of potentially low-cost sorbents for heavy metals. Water Res. 1999, 33, 2469–2479. [Google Scholar] [CrossRef]
  3. Brown, P.A.; Gill, S.A.; Allen, S.J. Metal removal from wastewater using peat. Water Res. 2000, 34, 3907–3916. [Google Scholar] [CrossRef]
  4. Couillard, D. The use of peat in wastewater treatment. Water Res. 1994, 28, 1261–1274. [Google Scholar] [CrossRef]
  5. Jain, A.; Balasubramanian, R.; Srinivasan, M. Hydrothermal conversion of biomass waste to activated carbon with high porosity: A review. Chem. Eng. J. 2016, 283, 789–805. [Google Scholar] [CrossRef]
  6. Deng, J.; Li, M.; Wang, Y. Biomass-derived carbon: Synthesis and applications in energy storage and conversion. Green Chem. 2016, 18, 4824–4854. [Google Scholar] [CrossRef]
  7. Ding, J.; Wang, H.; Li, Z.; Kohandehghan, A.; Cui, K.; Xu, Z.; Zahiri, B.; Tan, X.; Lotfabad, E.M.; Olsen, B.C.; et al. Carbon Nanosheet Frameworks Derived from Peat Moss as High Performance Sodium Ion Battery Anodes. ACS Nano 2013, 7, 11004–11015. [Google Scholar] [CrossRef]
  8. Varila, T.; Bergna, D.; Lahti, R.; Romar, H.; Hu, T.; Lassi, U. Activated carbon production from peat using ZnCl2: Characterization and applications. Bioresources 2017, 12, 8078–8092. [Google Scholar] [CrossRef]
  9. Härmas, M.; Palm, R.; Thomberg, T.; Härmas, R.; Koppel, M.; Paalo, M.; Tallo, I.; Romann, T.; Jänes, A.; Lust, E. Hydrothermal and peat-derived carbons as electrode materials for high-efficient electrical double-layer capacitors. J. Appl. Electrochem. 2020, 50, 15–32. [Google Scholar] [CrossRef]
  10. Adamson, A.; Väli, R.; Paalo, M.; Aruväli, J.; Koppel, M.; Palm, R.; Härk, E.; Nerut, J.; Romann, T.; Lust, E.; et al. Peat-derived hard carbon electrodes with superior capacity for sodium-ion batteries. RSC Adv. 2020, 10, 20145–20154. [Google Scholar] [CrossRef]
  11. Antolini, E. Carbon supports for low-temperature fuel cell catalysts. Appl. Catal. B Environ. 2009, 88, 1–24. [Google Scholar] [CrossRef]
  12. Dombrovskis, J.K.; Palmqvist, A.E.C. Recent Progress in Synthesis, Characterization and Evaluation of Non-Precious Metal Catalysts for the Oxygen Reduction Reaction. Fuel Cells 2016, 16, 4–22. [Google Scholar] [CrossRef]
  13. Stariha, S.; Artyushkova, K.; Serov, A.; Atanassov, P. Non-PGM membrane electrode assemblies: Optimization for performance. Int. J. Hydrogen Energy 2015, 40, 14676–14682. [Google Scholar] [CrossRef] [Green Version]
  14. Shao, M.; Chang, Q.; Dodelet, J.-P.; Chenitz, R. Recent Advances in Electrocatalysts for Oxygen Reduction Reaction. Chem. Rev. 2016, 116, 3594–3657. [Google Scholar] [CrossRef] [Green Version]
  15. Velázquez-Palenzuela, A.; Zhang, L.; Wang, L.; Cabot, P.L.; Brillas, E.; Tsay, K.; Zhang, J. Fe–N/C electrocatalysts synthesized by pyrolysis of Fe(II)–2,3,5,6-tetra(2-pyridyl)pyrazine complex for PEM fuel cell oxygen reduction reaction. Electrochim. Acta 2011, 56, 4744–4752. [Google Scholar] [CrossRef]
  16. Zhang, H.-J.; Yuan, X.; Sun, L.; Zeng, X.; Jiang, Q.-Z.; Shao, Z.; Ma, Z.-F. Pyrolyzed CoN4-chelate as an electrocatalyst for oxygen reduction reaction in acid media. Int. J. Hydrogen Energy 2010, 35, 2900–2903. [Google Scholar] [CrossRef]
  17. Chen, Z.; Higgins, D.; Yu, A.; Zhang, L.; Zhang, J. A review on non-precious metal electrocatalysts for PEM fuel cells. Energy Environ. Sci. 2011, 4, 3167–3192. [Google Scholar] [CrossRef]
  18. Bezerra, C.W.; Zhang, L.; Lee, K.; Liu, H.; Marques, A.L.; Marques, E.P.; Wang, H.; Zhang, J. A review of Fe–N/C and Co–N/C catalysts for the oxygen reduction reaction. Electrochim. Acta 2008, 53, 4937–4951. [Google Scholar] [CrossRef]
  19. Wu, G.; More, K.; Johnston, C.M.; Zelenay, P. High-Performance Electrocatalysts for Oxygen Reduction Derived from Polyaniline, Iron, and Cobalt. Science 2011, 332, 443–447. [Google Scholar] [CrossRef] [PubMed] [Green Version]
  20. Wu, G.; Santandreu, A.; Kellogg, W.; Gupta, S.; Ogoke, O.; Zhang, H.; Wang, H.-L.; Dai, L. Carbon nanocomposite catalysts for oxygen reduction and evolution reactions: From nitrogen doping to transition-metal addition. Nano Energy 2016, 29, 83–110. [Google Scholar] [CrossRef] [Green Version]
  21. Du, J.; Cheng, F.; Wang, S.; Zhang, T.; Chen, J. M(Salen)-derived Nitrogen-doped M/C (M = Fe, Co, Ni) Porous Nanocomposites for Electrocatalytic Oxygen Reduction. Sci. Rep. 2014, 4, 4386. [Google Scholar] [CrossRef] [PubMed] [Green Version]
  22. Jäger, R.; Teppor, P.; Härk, E.; Härmas, M.; Adamson, A.; Paalo, M.; Volobujeva, O.; Kikas, A.; Kochovski, Z.; Romann, T.; et al. Cobalt and Nitrogen Co-Doped Peat Derived Carbon Based Catalysts for Oxygen Reduction. ECS Trans. 2020, 97, 605–613. [Google Scholar] [CrossRef]
  23. Teppor, P.; Jäger, R.; Härk, E.; Sepp, S.; Kook, M.; Volobujeva, O.; Paiste, P.; Kochovski, Z.; Tallo, I.; Lust, E. Exploring Different Synthesis Parameters for the Preparation of Metal-Nitrogen-Carbon Type Oxygen Reduction Catalysts. J. Electrochem. Soc. 2020, 167, 054513. [Google Scholar] [CrossRef]
  24. Teppor, P.; Jäger, R.; Paalo, M.; Palm, R.; Volobujeva, O.; Härk, E.; Kochovski, Z.; Romann, T.; Härmas, R.; Aruväli, J.; et al. Peat-derived carbon-based non-platinum group metal type catalyst for oxygen reduction and evolution reactions. Electrochem. Commun. 2020, 113, 106700. [Google Scholar] [CrossRef]
  25. Härmas, M.; Thomberg, T.; Kurig, H.; Romann, T.; Jänes, A.; Lust, E. Microporous-mesoporous carbons for energy storage synthesized by activation of carbonaceous material by zinc chloride, potassium hydroxide or mixture of them. J. Power Source 2016, 326, 624–634. [Google Scholar] [CrossRef]
  26. Härmas, M.; Thomberg, T.; Romann, T.; Jänes, A.; Lust, E. Carbon for Energy Storage Derived from Granulated White Sugar by Hydrothermal Carbonization and Subsequent Zinc Chloride Activation. J. Electrochem. Soc. 2017, 164, A1866–A1872. [Google Scholar] [CrossRef]
  27. Seah, M.; Gilmore, I.; Spencer, S. Quantitative XPS. I. Analysis of X-ray Photoelectron Intensities from Elemental Data in a Digital Photoelectron Database. J. Electron Spectrosc. Relat. Phenom. 2001, 120, 93–111. [Google Scholar] [CrossRef]
  28. Jagiello, J.; Olivier, J.P. 2D-NLDFT adsorption models for carbon slit-shaped pores with surface energetical heterogeneity and geometrical corrugation. Carbon 2013, 55, 70–80. [Google Scholar] [CrossRef]
  29. Jagiello, J.; Ania, C.; Parra, J.B.; Cook, C. Dual gas analysis of microporous carbons using 2D-NLDFT heterogeneous surface model and combined adsorption data of N2 and CO2. Carbon 2015, 91, 330–337. [Google Scholar] [CrossRef] [Green Version]
  30. Jagiello, J.; Olivier, J.P. Carbon slit pore model incorporating surface energetical heterogeneity and geometrical corrugation. Adsorption 2013, 19, 777–783. [Google Scholar] [CrossRef]
  31. Ribeiro-Soares, J.; Oliveros, M.; Garin, C.; David, M.; Martins, L.; Almeida, C.; Martins-Ferreira, E.; Takai, K.; Enoki, T.; Magalhães-Paniago, R.; et al. Structural analysis of polycrystalline graphene systems by Raman spectroscopy. Carbon 2015, 95, 646–652. [Google Scholar] [CrossRef] [Green Version]
  32. Sepp, S.; Nerut, J.; Vaarmets, K.; Kanarbik, R.; Tallo, I.; Lust, E. Activity and Stability of Carbide Derived Carbon Supports in PEMFC Application. ECS Trans. 2018, 86, 507–517. [Google Scholar] [CrossRef]
  33. Lillo-Ródenas, M.; Juan-Juan, J.; Cazorla-Amoros, D.; Linares-Solano, A. About reactions occurring during chemical activation with hydroxides. Carbon 2004, 42, 1371–1375. [Google Scholar] [CrossRef]
  34. Lillo-Ródenas, M.; Cazorla-Amoros, D.; Linares-Solano, A. Understanding chemical reactions between carbons and NaOH and KOH: An insight into the chemical activation mechanism. Carbon 2003, 41, 267–275. [Google Scholar] [CrossRef]
  35. Marsh, H.; Reinoso, F.R. Activated Carbon; Elsevier: Amsterdam, The Netherlands, 2006. [Google Scholar]
  36. Gonzalez-Serrano, E.; Cordero, T.; Mirasol, J.R.; Rodríguez, J.J. Development of Porosity upon Chemical Activation of Kraft Lignin with ZnCl2. Ind. Eng. Chem. Res. 1997, 36, 4832–4838. [Google Scholar] [CrossRef]
  37. Stepanova, V.; Pokrovsky, O.S.; Viers, J.; Mironycheva-Tokareva, N.; Kosykh, N.; Vishnyakova, E. Elemental composition of peat profiles in western Siberia: Effect of the micro-landscape, latitude position and permafrost coverage. Appl. Geochem. 2015, 53, 53–70. [Google Scholar] [CrossRef]
  38. Rydelek, P. Origin and Composition of Mineral Constituents of Fen Peats from Eastern Poland. J. Plant Nutr. 2013, 36, 911–928. [Google Scholar] [CrossRef]
  39. Sahraie, N.R.; Paraknowitsch, J.P.; Göbel, C.; Thomas, A.; Strasser, P. Noble-Metal-Free Electrocatalysts with Enhanced ORR Performance by Task-Specific Functionalization of Carbon using Ionic Liquid Precursor Systems. J. Am. Chem. Soc. 2014, 136, 14486–14497. [Google Scholar] [CrossRef] [PubMed]
  40. He, Y.; Hwang, S.; Cullen, D.A.; Uddin, A.; Langhorst, L.; Li, B.; Karakalos, S.; Kropf, A.J.; Wegener, E.C.; Sokolowski, J.; et al. Highly active atomically dispersed CoN4 fuel cell cathode catalysts derived from surfactant-assisted MOFs: Carbon-shell confinement strategy. Energy Environ. Sci. 2019, 12, 250–260. [Google Scholar] [CrossRef]
  41. Kabir, S.; Artyushkova, K.; Serov, A.; Kiefer, B.; Atanassov, P. Binding energy shifts for nitrogen-containing graphene-based electrocatalysts—Experiments and DFT calculations. Surf. Interface Anal. 2016, 48, 293–300. [Google Scholar] [CrossRef]
  42. Ratso, S.; Sahraie, N.R.; Sougrati, M.T.; Käärik, M.; Kook, M.; Saar, R.; Paiste, P.; Jia, Q.; Leis, J.; Mukerjee, S.; et al. Synthesis of highly-active Fe–N–C catalysts for PEMFC with carbide-derived carbons. J. Mater. Chem. A 2018, 6, 14663. [Google Scholar] [CrossRef]
  43. Liu, J.; Liu, Y.; Li, P.; Wang, L.; Zhang, H.; Liu, H.; Liu, J.; Wang, Y.; Tian, W.; Wang, X.; et al. Fe-N-doped porous carbon from petroleum asphalt for highly efficient oxygen reduction reaction. Carbon 2018, 126, 1–8. [Google Scholar] [CrossRef]
  44. Serov, A.; Artyushkova, K.; Andersen, N.I.; Stariha, S.; Atanassov, P. Original Mechanochemical Synthesis of Non-Platinum Group Metals Oxygen Reduction Reaction Catalysts Assisted by Sacrificial Support Method. Electrochim. Acta 2015, 179, 154–160. [Google Scholar] [CrossRef]
  45. Tuinstra, F.; Koenig, J.L. Raman Spectrum of Graphite. J. Chem. Phys. 1970, 53, 1126–1130. [Google Scholar] [CrossRef] [Green Version]
  46. Ferrari, A.C.; Robertson, J. Resonant Raman spectroscopy of disordered, amorphous, and diamondlike carbon. Phys. Rev. B 2001, 64, 075414. [Google Scholar] [CrossRef] [Green Version]
  47. Schuepfer, D.B.; Badaczewski, F.; Guerra-Castro, J.M.; Hofmann, D.M.; Heiliger, C.; Smarsly, B.; Klar, P.J. Assessing the structural properties of graphitic and non-graphitic carbons by Raman spectroscopy. Carbon 2020, 161, 359–372. [Google Scholar] [CrossRef]
  48. Hossen, M.; Artyushkova, K.; Atanassov, P.; Serov, A. Synthesis and characterization of high performing Fe-N-C catalyst for oxygen reduction reaction (ORR) in Alkaline Exchange Membrane Fuel Cells. J. Power Source 2018, 375, 214–221. [Google Scholar] [CrossRef]
  49. Ratso, S.; Sougrati, M.T.; Kaarik, M.; Merisalu, M.; Rähn, M.; Kisand, V.; Kikas, A.; Paiste, P.; Leis, J.; Sammelselg, V.; et al. Effect of Ball-Milling on the Oxygen Reduction Reaction Activity of Iron and Nitrogen Co-doped Carbide-Derived Carbon Catalysts in Acid Media. ACS Appl. Energy Mater. 2019, 2, 7952–7962. [Google Scholar] [CrossRef]
  50. Teppor, P.; Jäger, R.; Hints, J.; Volobujeva, O.; Valk, P.; Koppel, M.; Lust, E. Highly Active Fe-N/C Oxygen Electrocatalysts Based on Silicon Carbide Derived Carbon. ECS Trans. 2020, 98, 607–615. [Google Scholar] [CrossRef]
  51. Ye, F.; Xu, C.; Liu, G.; Li, J.; Wang, X.; Du, X.; Lee, J.K. A novel PtRuIr nanoclusters synthesized by selectively electrodepositing Ir on PtRu as highly active bifunctional electrocatalysts for oxygen evolution and reduction. Energy Convers. Manag. 2019, 155, 182–187. [Google Scholar] [CrossRef]
  52. Mauger, S.A.; Pfeilsticker, J.R.; Wang, M.; Medina, S.; Yang-Neyerlin, A.; Neyerlin, K.; Stetson, C.; Pylypenko, S.; Ulsh, M. Fabrication of high-performance gas-diffusion-electrode based membrane-electrode assemblies. J. Power Source 2021, 450, 227581–227591. [Google Scholar] [CrossRef]
  53. Jaouen, F.; Goellner, V.; Lefèvre, M.; Herranz, J.; Proietti, E.; Dodelet, J. Oxygen reduction activities compared in rotating-disk electrode and proton exchange membrane fuel cells for highly active FeNC catalysts. Electrochim. Acta 2013, 87, 619–628. [Google Scholar] [CrossRef]
  54. Shui, J.; Chen, C.; Grabstanowicz, L.; Zhao, D.; Liu, D.-J. Highly efficient nonprecious metal catalyst prepared with metal–organic framework in a continuous carbon nanofibrous network. Proc. Natl. Acad. Sci. USA 2015, 112, 10629–10634. [Google Scholar] [CrossRef] [PubMed] [Green Version]
  55. Banham, D.; Kishimoto, T.; Zhou, Y.; Sato, T.; Bai, K.; Ozaki, J.-I.; Imashiro, Y.; Ye, S. Critical advancements in achieving high power and stable nonprecious metal catalyst–based MEAs for real-world proton exchange membrane fuel cell applications. Sci. Adv. 2018, 4, eaar7180. [Google Scholar] [CrossRef] [PubMed] [Green Version]
  56. Sung, C.-C.; Liu, C.-Y.; Cheng, C.C. Performance improvement by a glue-functioned Nafion layer coating on gas diffusion electrodes in PEM fuel cells. Int. J. Hydrogen Energy 2014, 39, 11700–11705. [Google Scholar] [CrossRef]
  57. Vierrath, S.; Breitwieser, M.; Klingele, M.; Britton, B.; Holdcroft, S.; Zengerle, R.; Thiele, S. The reasons for the high power density of fuel cells fabricated with directly deposited membranes. J. Power Source 2016, 326, 170–175. [Google Scholar] [CrossRef]
  58. Klingele, M.; Britton, B.; Breitwieser, M.; Vierrath, S.; Zengerle, R.; Holdcroft, S.; Thiele, S. A completely spray-coated membrane electrode assembly. Electrochem. Commun. 2016, 70, 65–68. [Google Scholar] [CrossRef]
Figure 1. Synthesis steps and abbreviations of prepared carbons.
Catalysts 11 00715 g001
Figure 2. Surface images measured using HR-SEM for various samples (noted in Figure).
Catalysts 11 00715 g002
Figure 3. XRD patterns for selected Co-N/PDC catalysts.
Catalysts 11 00715 g003
Figure 4. HR-TEM images and particle size distribution for three catalyst materials (noted in Figure).
Catalysts 11 00715 g004
Figure 5. Wide-scan XPS spectra (a), detailed N1s (b), and C1s (c) spectra for selected Co-N/PDC catalysts (noted in Figure). Relative content of different nitrogen (d) and carbon (e) species obtained from detailed XPS spectra.
Catalysts 11 00715 g005
Figure 6. Calculated pore size distribution data for selected undoped and co-doped materials (noted in Figure).
Catalysts 11 00715 g006
Figure 7. Raman spectra for PDC (a) and selected Co-N/PDC (b) materials (noted in Figure).
Catalysts 11 00715 g007
Figure 8. ORR curves (background and iR-corrected) for the studied materials (noted in Figure) in 0.1 M HClO4 solution at 2000 rpm and 10 mV s−1.
Catalysts 11 00715 g008
Figure 9. The polarization and power density curves for the assembled single cells with different Co-N/PDC catalysts (noted in Figure). Measurement conditions were as follows: cathode catalyst loading 4.0 ± 0.1 mg cm−2, anode catalyst loading 1.0 ± 0.1 mg cm−2, cell temperature 80 °C, gas inlet temperature 82 °C, O2 and H2 flow rate 200 mL min−1, backpressure of gases 100 kPa.
Catalysts 11 00715 g009
Table 1. Elemental composition (wt%) of studied materials measured by SEM-EDX.
MaterialCONCaCoOther Elements (<1 wt%)
C-168.338.87-18.27-Si, S, Fe, Mg, Al, Cl, P, Na
C-2(KOH)83.419.805.68--Si, S, Cl, Al
C-2(ZnCl2)84.5611.102.49--Si, S, Al
C-376.7817.045.49--Si, S
C-3(pyr)96.442.77-0.31-Si, S
Co-N/C-167.9814.772.808.363.07Si, S, Mg, Al, Cl
Co-N/C-2(KOH)83.926.195.75-2.97Si, Cl
Co-N/C-2(ZnCl2)74.0013.843.36-5.93Al, Cl, S
Co-N/C-378.2511.285.54-4.61Si, Al
Co-N/C-3(pyr)80.939.714.11-3.59Si, Al, Cl
Table 2. Elemental composition (at%) of selected materials obtained by XPS.
MaterialC (at%)O (at%)N (at%)Ca (at%)
Co-N/C-170.9420.891.516.66
Co-N/C-2(ZnCl2)82.9814.642.36-
Co-N/C-3(pyr)70.6027.292.11-
Table 3. Specific surface area values and porosity characteristics of selected materials.
MaterialSBET
(m2 g1)
SDFT
(m2 g1)
Vtot
(cm3 g1)
VDFT
(cm3 g1)
Sµ
(m2 g1)
Vµ
(cm3 g1)
C-12703040.160.151300.06
C-2(ZnCl2)127011101.141.112000.08
C-3(pyr)90890.030.05800.02
Co-N/C-12462410.240.18480.02
Co-N/C-2(ZnCl2)5205500.310.302500.11
Co-N/C-3(pyr)2733010.180.171350.06
Table 4. Raman spectroscopy analysis results.
ID/IGG Peak Width (FWHM, cm−1)D Peak Width (FWHM, cm−1)
C-10.9971.3105.3
C-2(KOH)0.8177.2180.2
C-2(ZnCl2)0.8674.5187.1
C-30.6186.1239.0
C-3(pyr)0.974.5207.5
Co-N/C-11.2966.073.4
Co-N/C-2 (ZnCl2)0.9064.8191.8
Co-N/C-3(pyr)0.9472.8157.5
Publisher’s Note: MDPI stays neutral with regard to jurisdictional claims in published maps and institutional affiliations.

