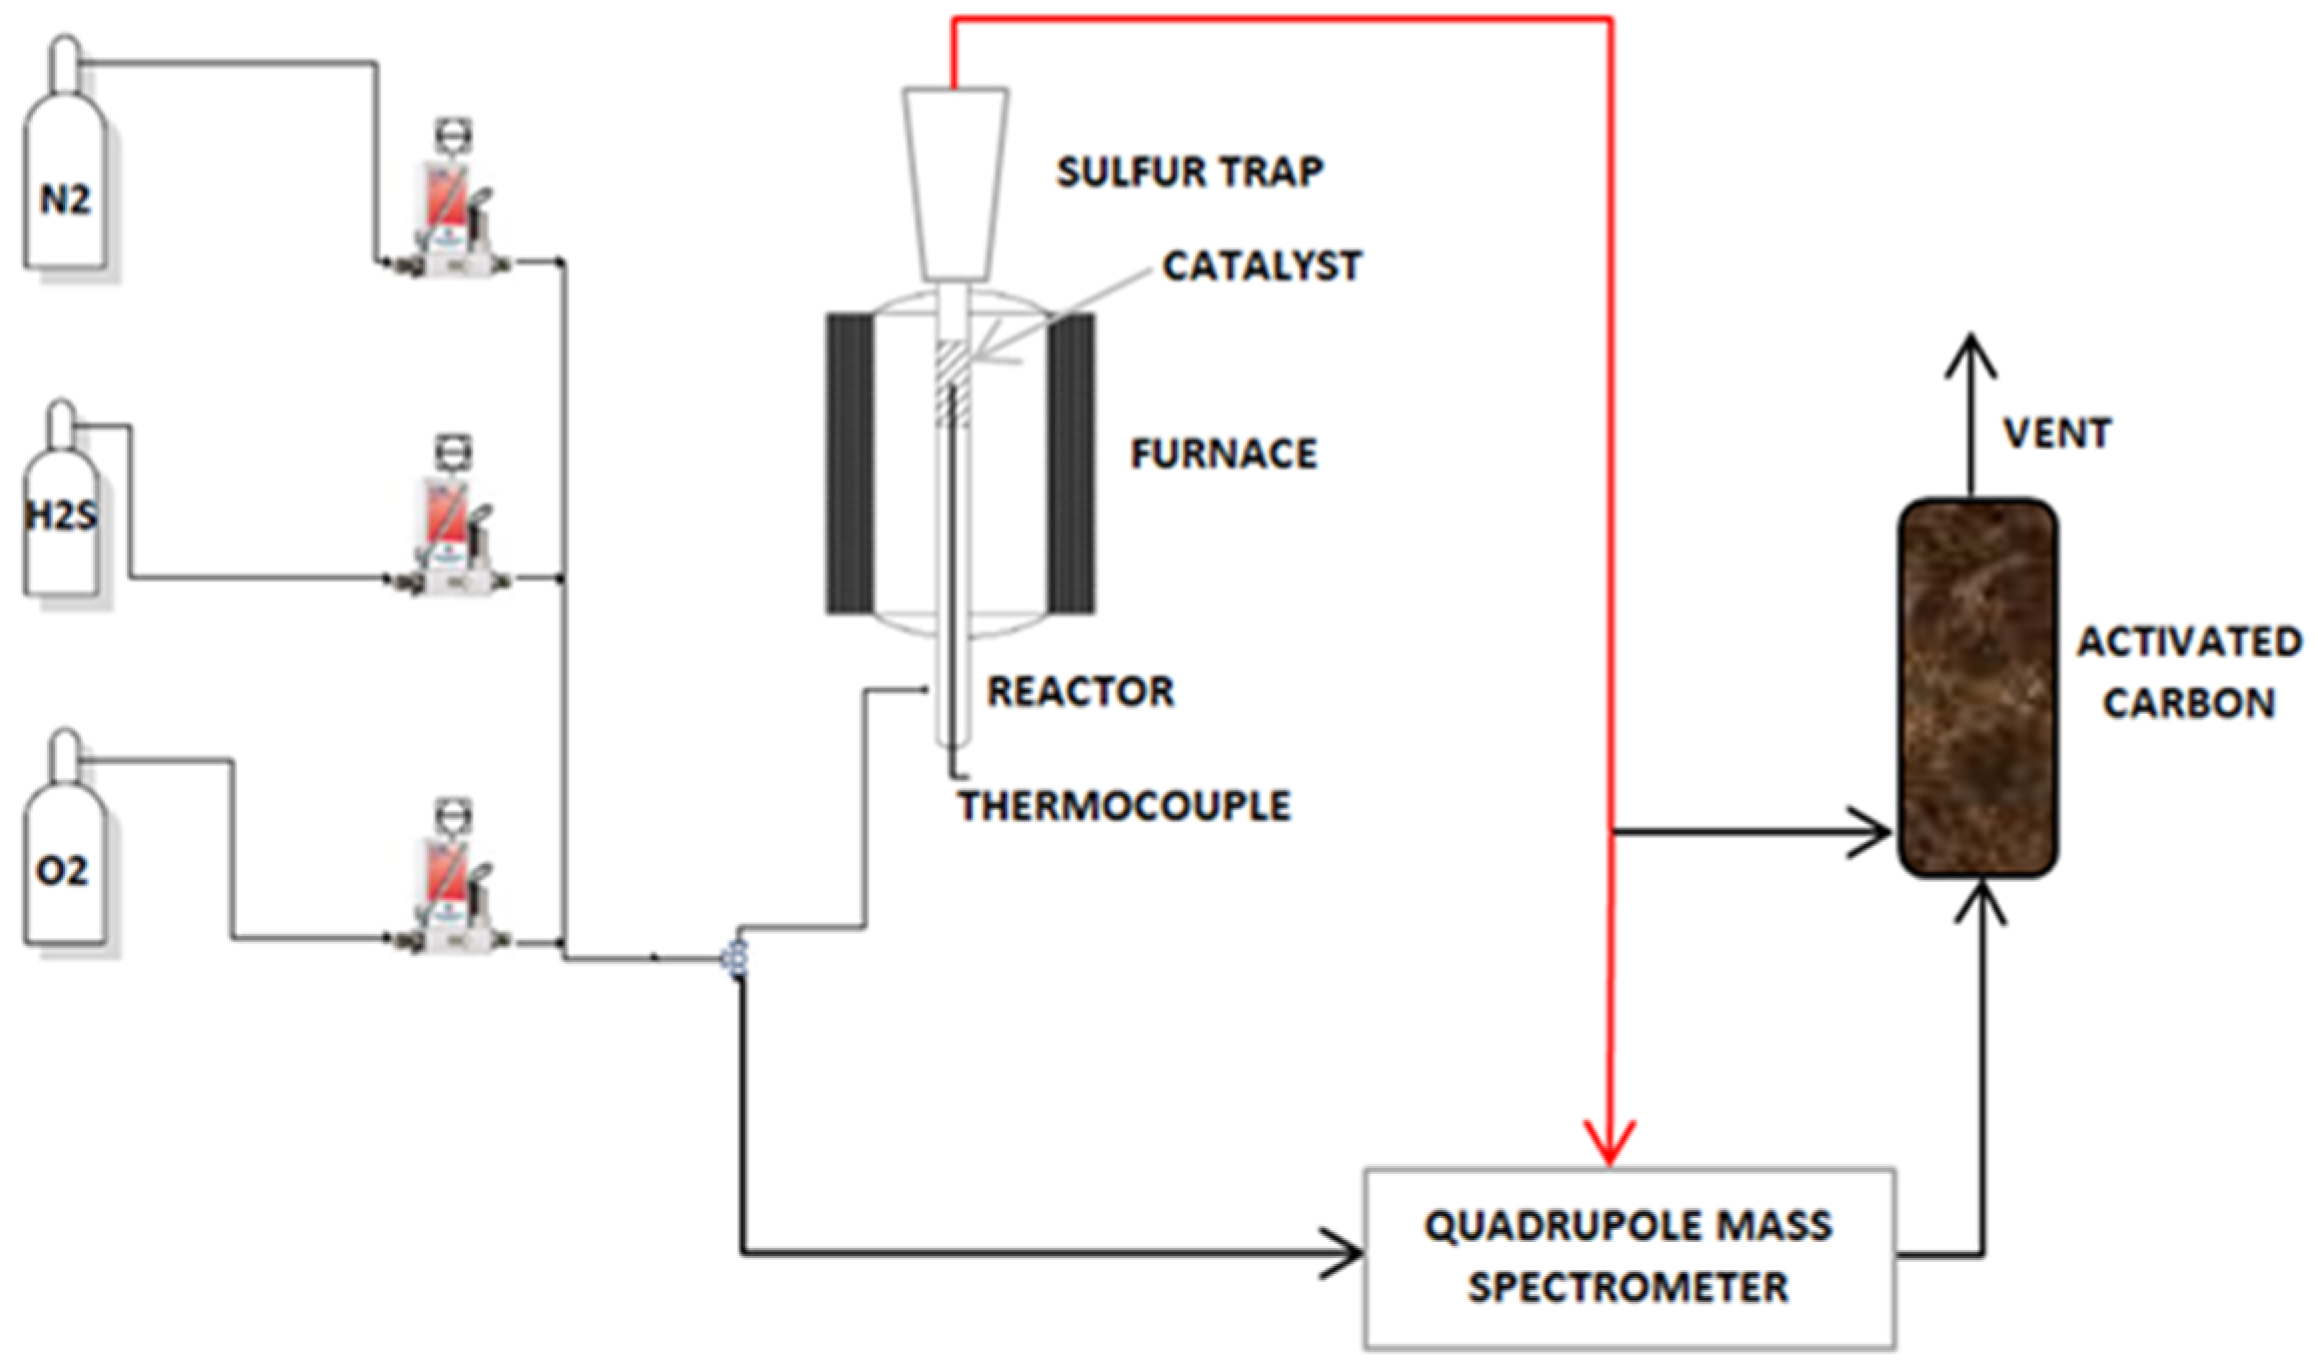
2.1. Catalytic Activity Test
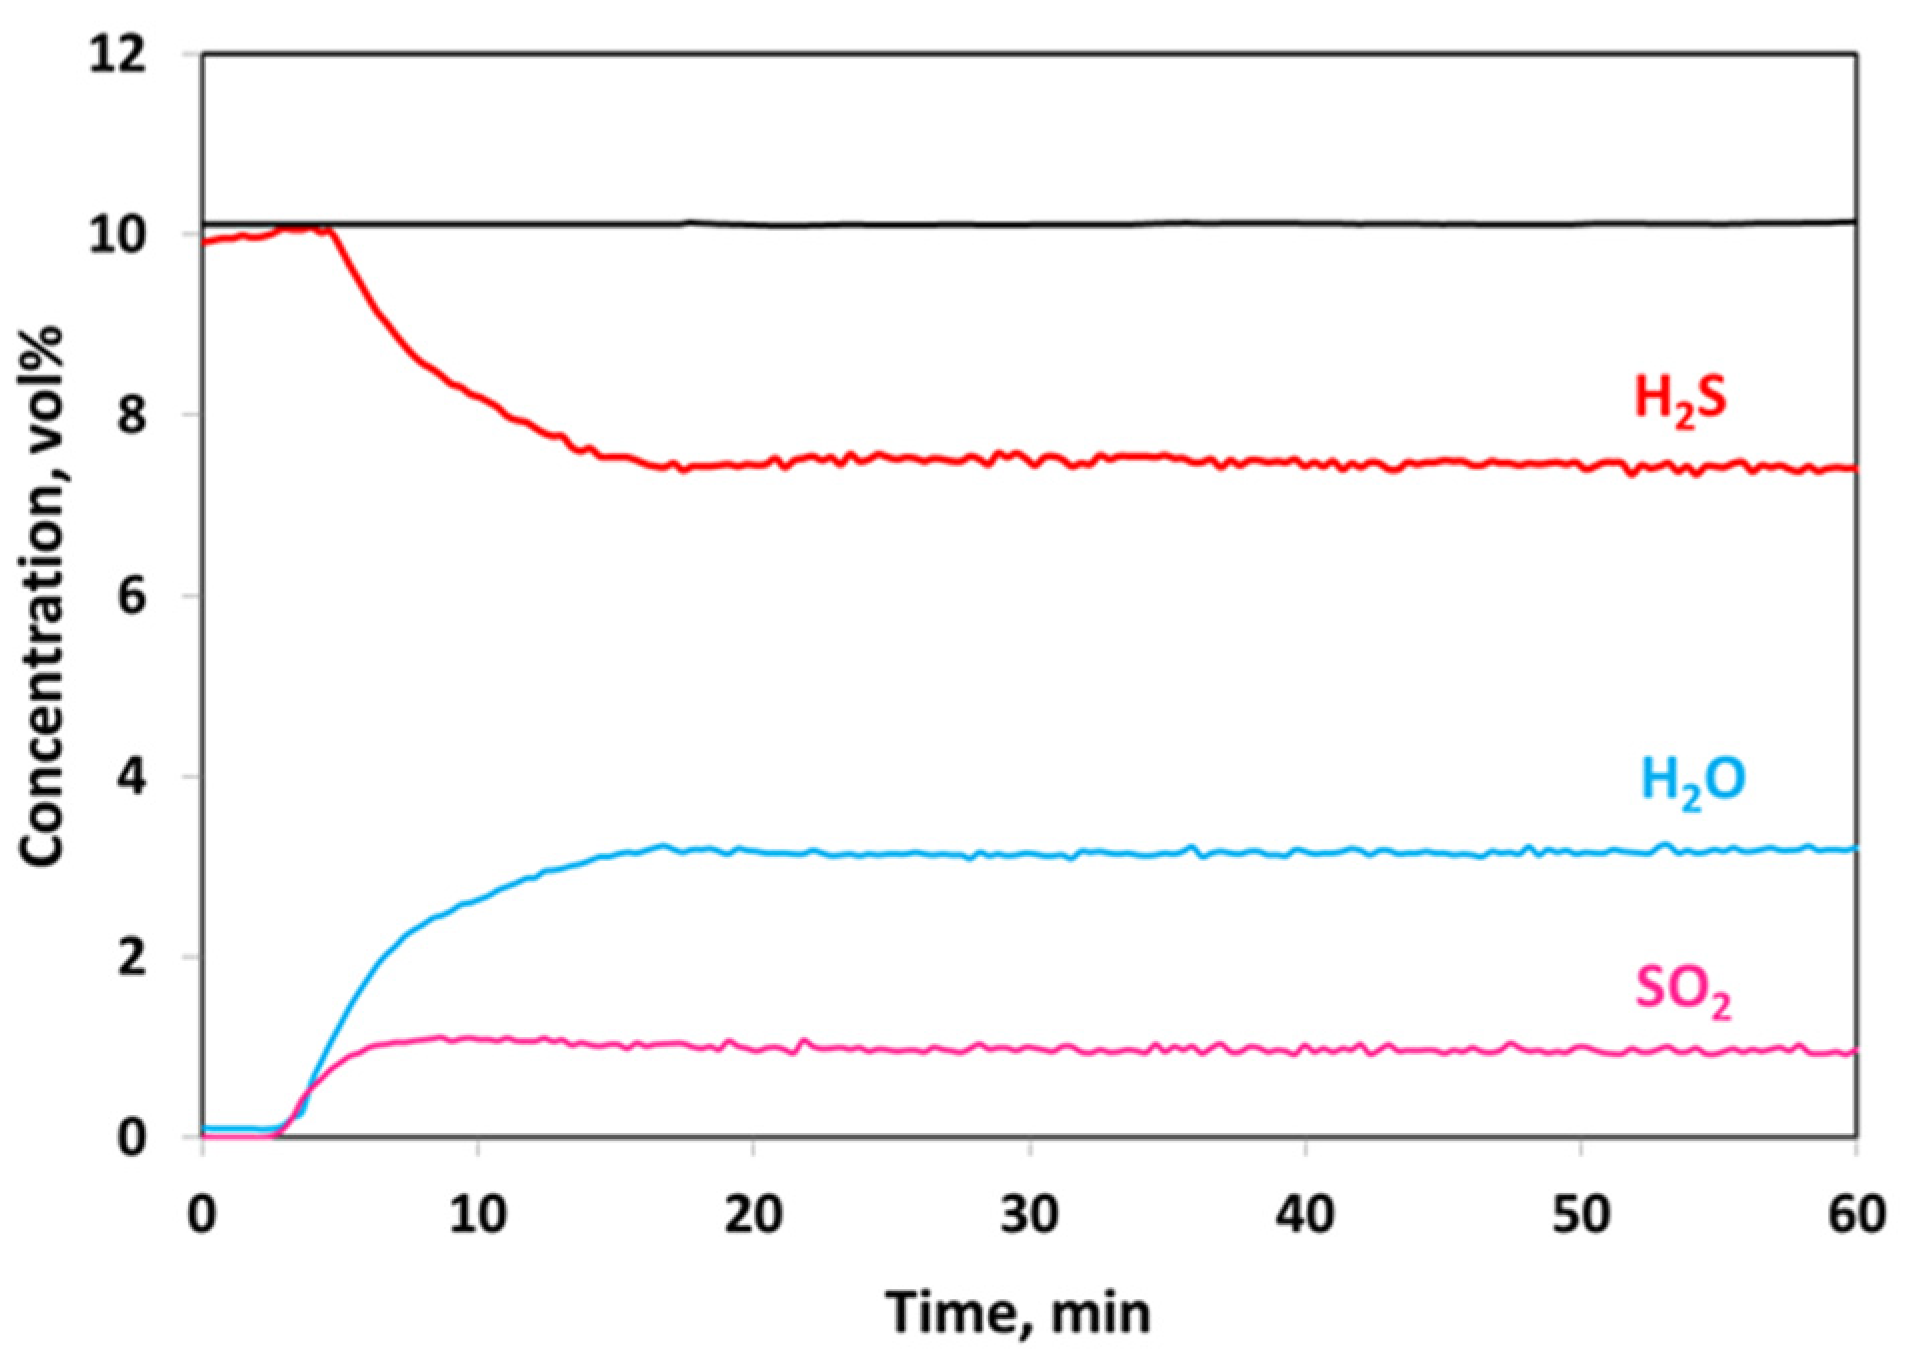
First of all, the reaction system was studied in the presence of 10 vol% of H
2S at the temperature of 327 °C without the catalyst (
Figure 1).
Figure 1 shows the behavior of H
2S, H
2O, and SO
2 during 1 h of time on stream.
After the first 5 min, the feed stream was sent to the reactor and the formation of SO
2 and water could be observed. The sulfur formation was not detectable because of the removal by the gaseous stream in the sulfur trap. The final H
2S conversion was 26%, while the SO
2 selectivity was high enough (~39%). The SO
3 formation (m/z = 80) was not observed either for the test in the absence of a catalyst or for all the catalytic tests. In
Table 1, the values obtained by the test carried out without the catalyst were compared with the ones expected by the thermodynamic equilibrium and with the experimental data achieved with 20 V-CeO
2 catalyst.
It is evident that the reaction system without the catalyst is very far from the equilibrium conditions; in fact, the expected H2S conversion and SO2 concentration would be, respectively, 90% and 0.5 vol%. Conversely, the catalytic performance of the 20 V-CeO2 sample is very close to that expected from the equilibrium, confirming the key role of the catalyst for maximizing the H2S conversion and inhibiting the SO2 formation.
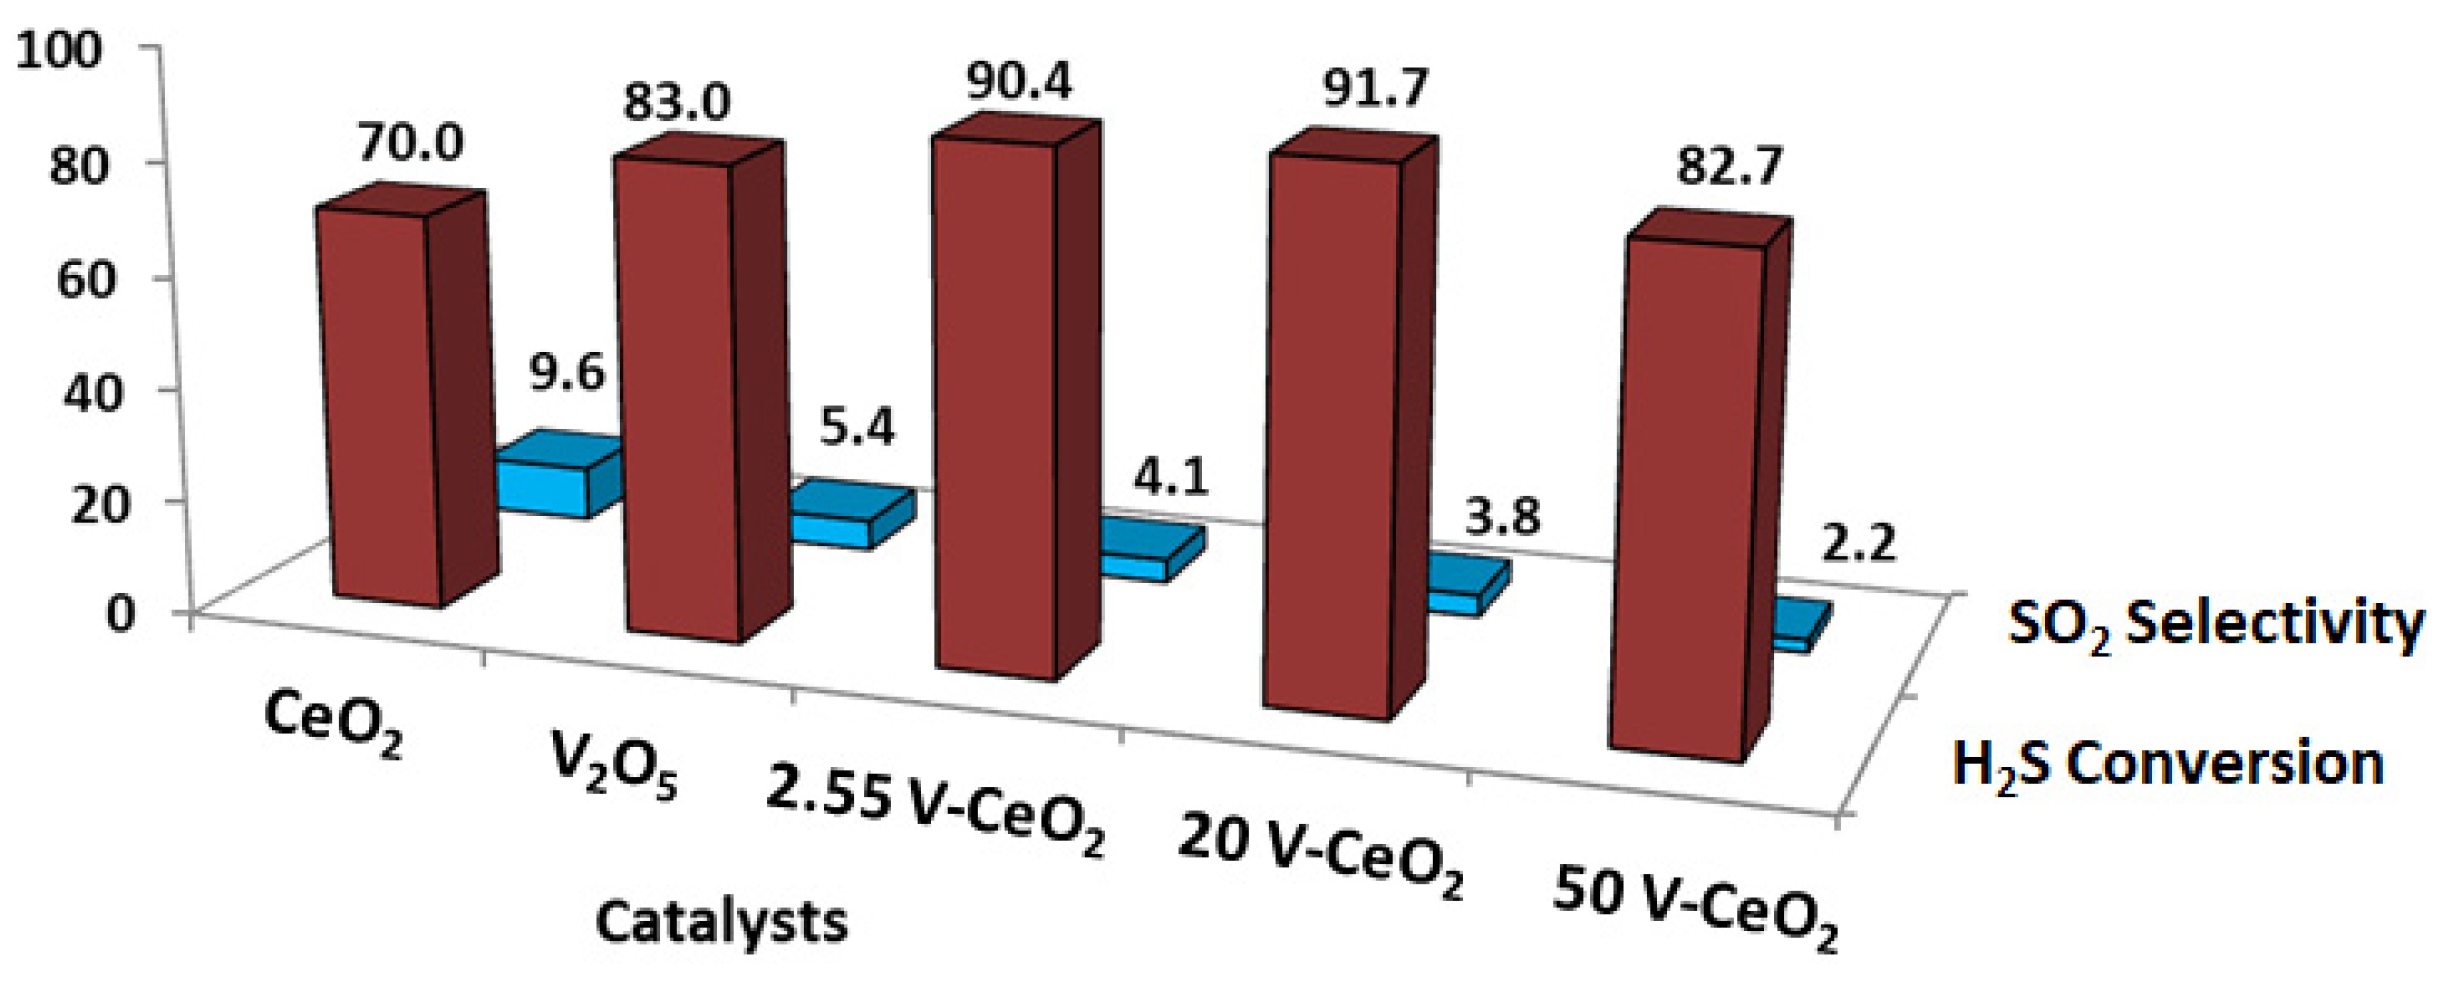
The screening of the vanadium-based catalysts was performed at 327 °C and the catalytic activity of the V-CeO
2 samples was also compared with the support (CeO
2) and with the bulk V
2O
5. For each sample, the catalytic performance under steady-state conditions is reported in
Figure 2.
The best catalytic performance can be observed for the catalysts having a V2O5 loading of 2.55 and 20 wt%, for which the H2S conversion and SO2 selectivity values are very similar. Although the lowest SO2 selectivity (2.2%) was observed for the 50 V-CeO2 sample, it unfortunately showed the lowest H2S conversion (83%).
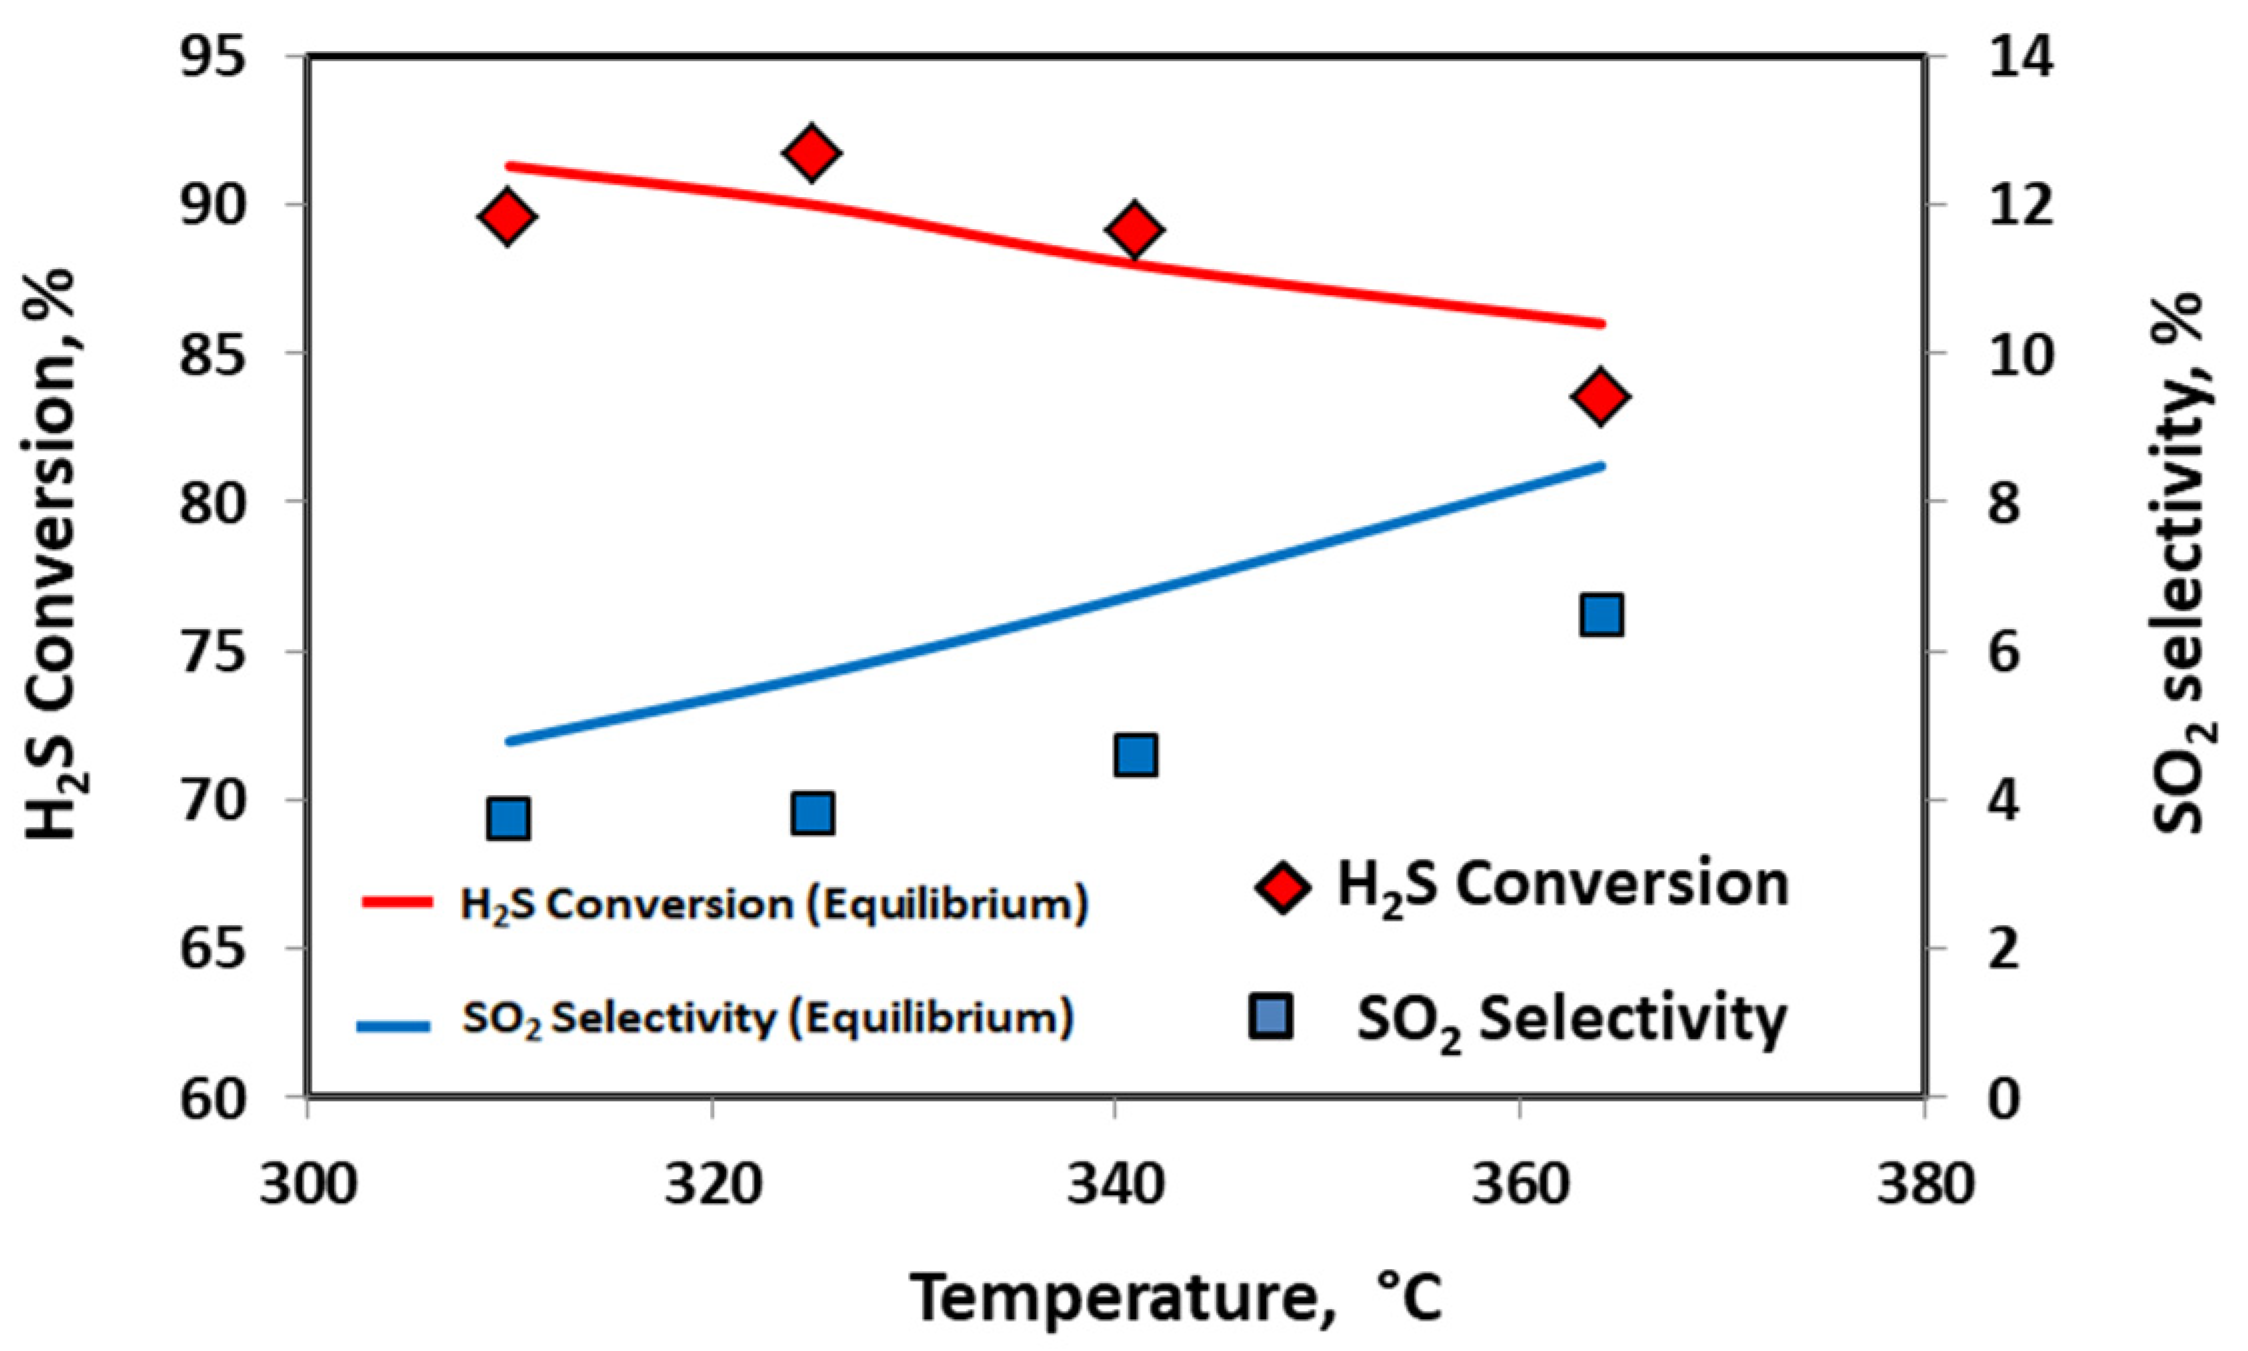
The influence of the temperature was investigated for the 20 V-CeO
2 catalyst and the experimental data for H
2S conversion and SO
2 selectivity were compared with the equilibrium data (red and blue lines, respectively) (
Figure 3).
As it is possible to observe from
Figure 3, the H
2S conversion is very close to the equilibrium values (red line) while the SO
2 selectivity is, in the overall investigated temperature range, slightly below the equilibrium calculation (blue line), evidencing that the catalyst is able to inhibit the SO
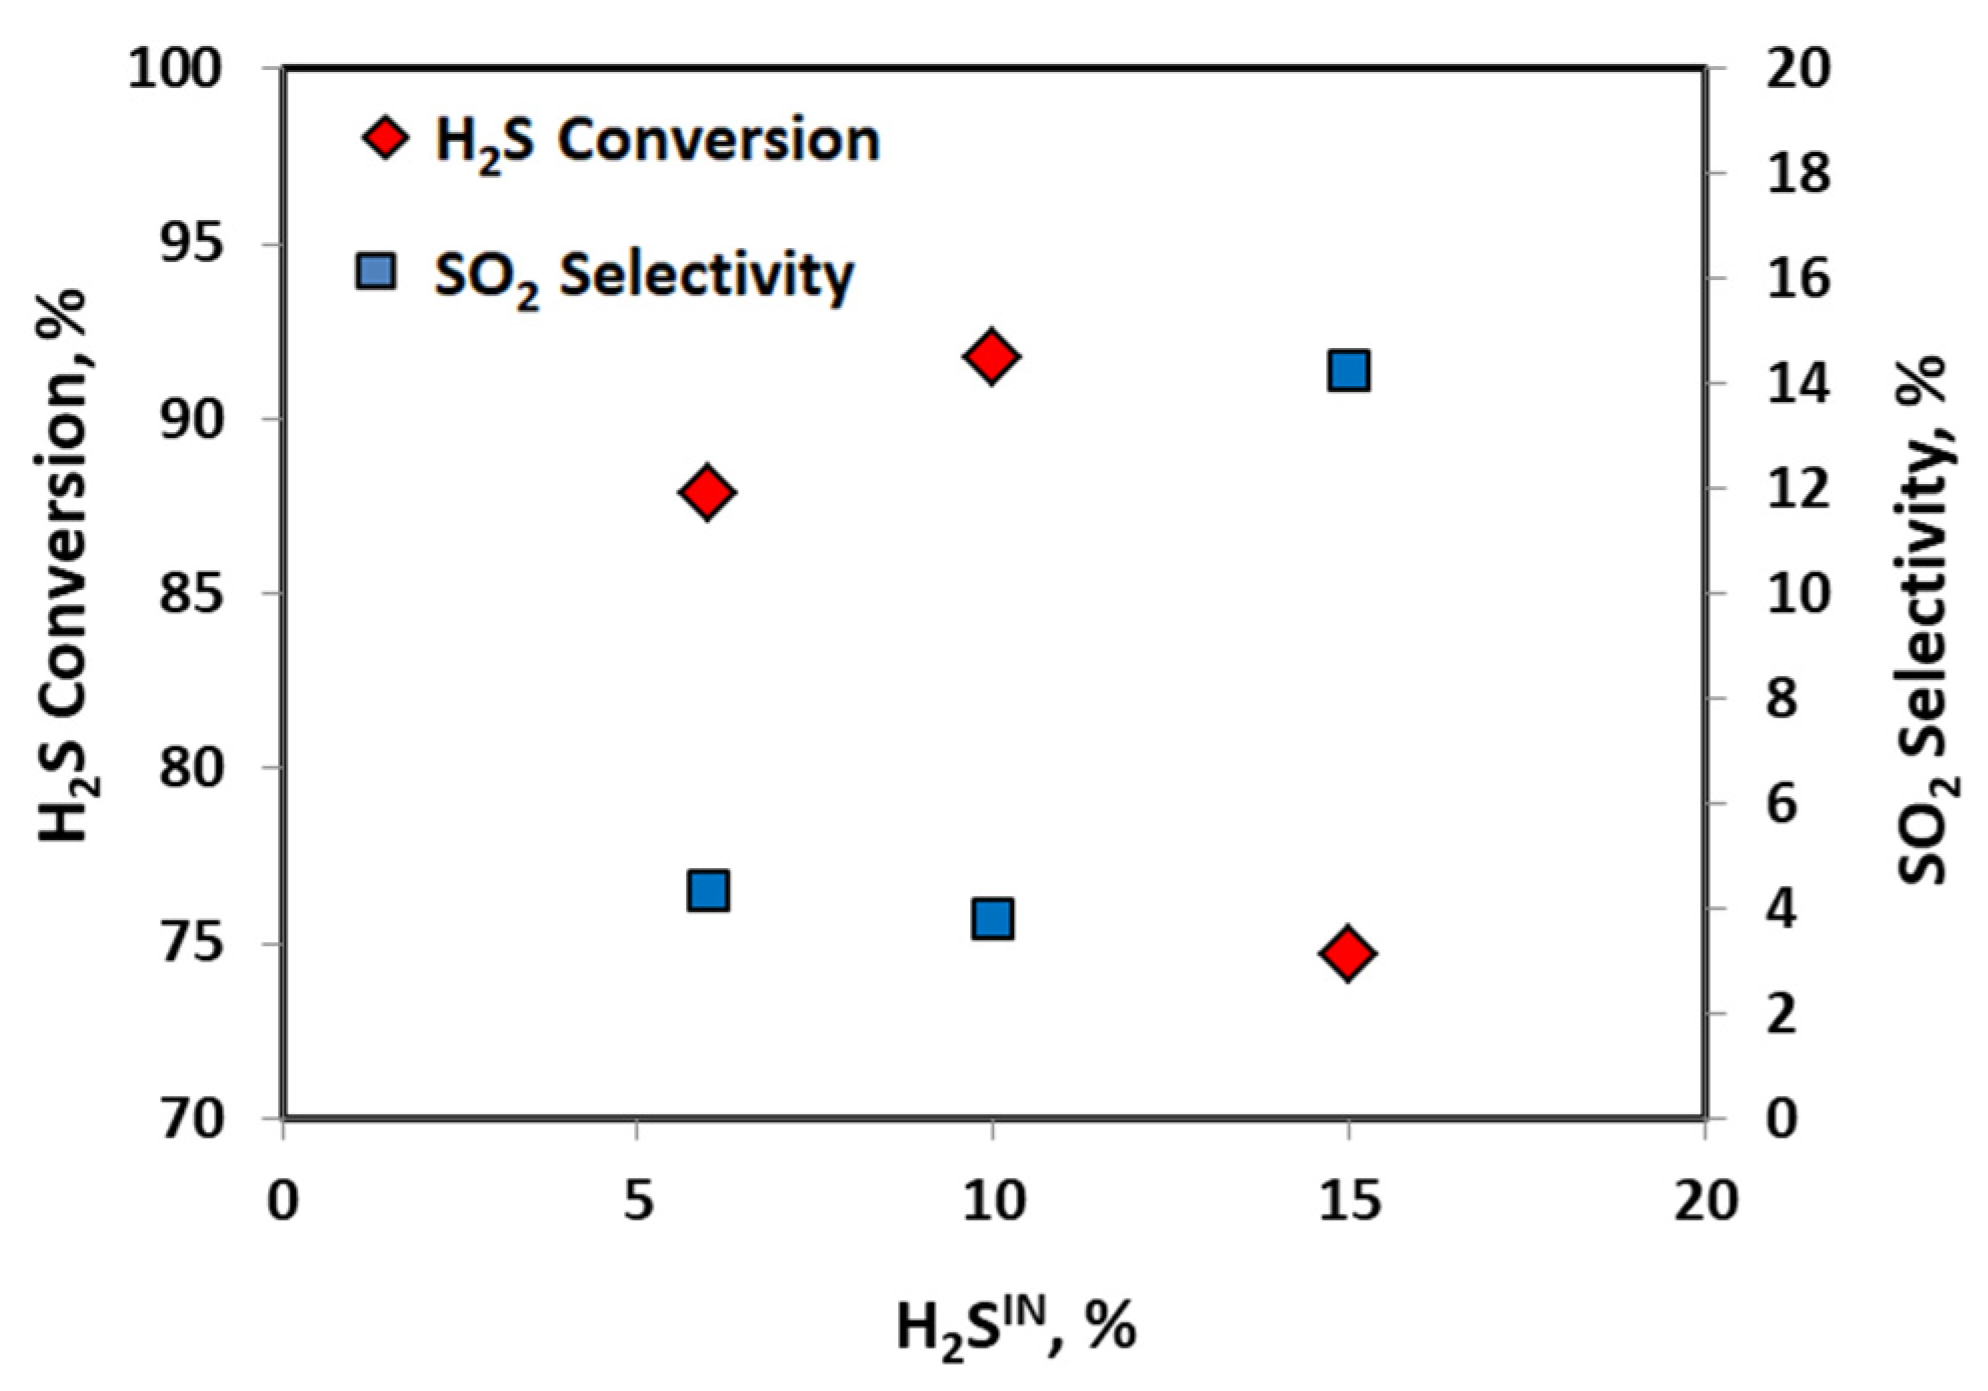
2 formation. The effect of the H
2S concentration, in the range 6–15 vol%, was then evaluated at the temperature of 327 °C (
Figure 4).
The highest value of H
2S conversion and the lowest SO
2 selectivity were observed when the H
2S inlet concentration was 10 vol%. In the presence of a feed stream more concentrated in H
2S (15 vol%), the conversion was drastically reduced to 75% and the SO
2 concentration was about 1.5 vol%; in this case, the selectivity increase is of one magnitude order (14%) with respect to the other obtained values. In
Table 2, the equilibrium data are compared with those obtained experimentally at different H
2S inlet concentrations.
Based on the data listed in
Table 2, it is possible to see that the reaction system deviates from the equilibrium values especially in presence of 15 vol% of H
2S.
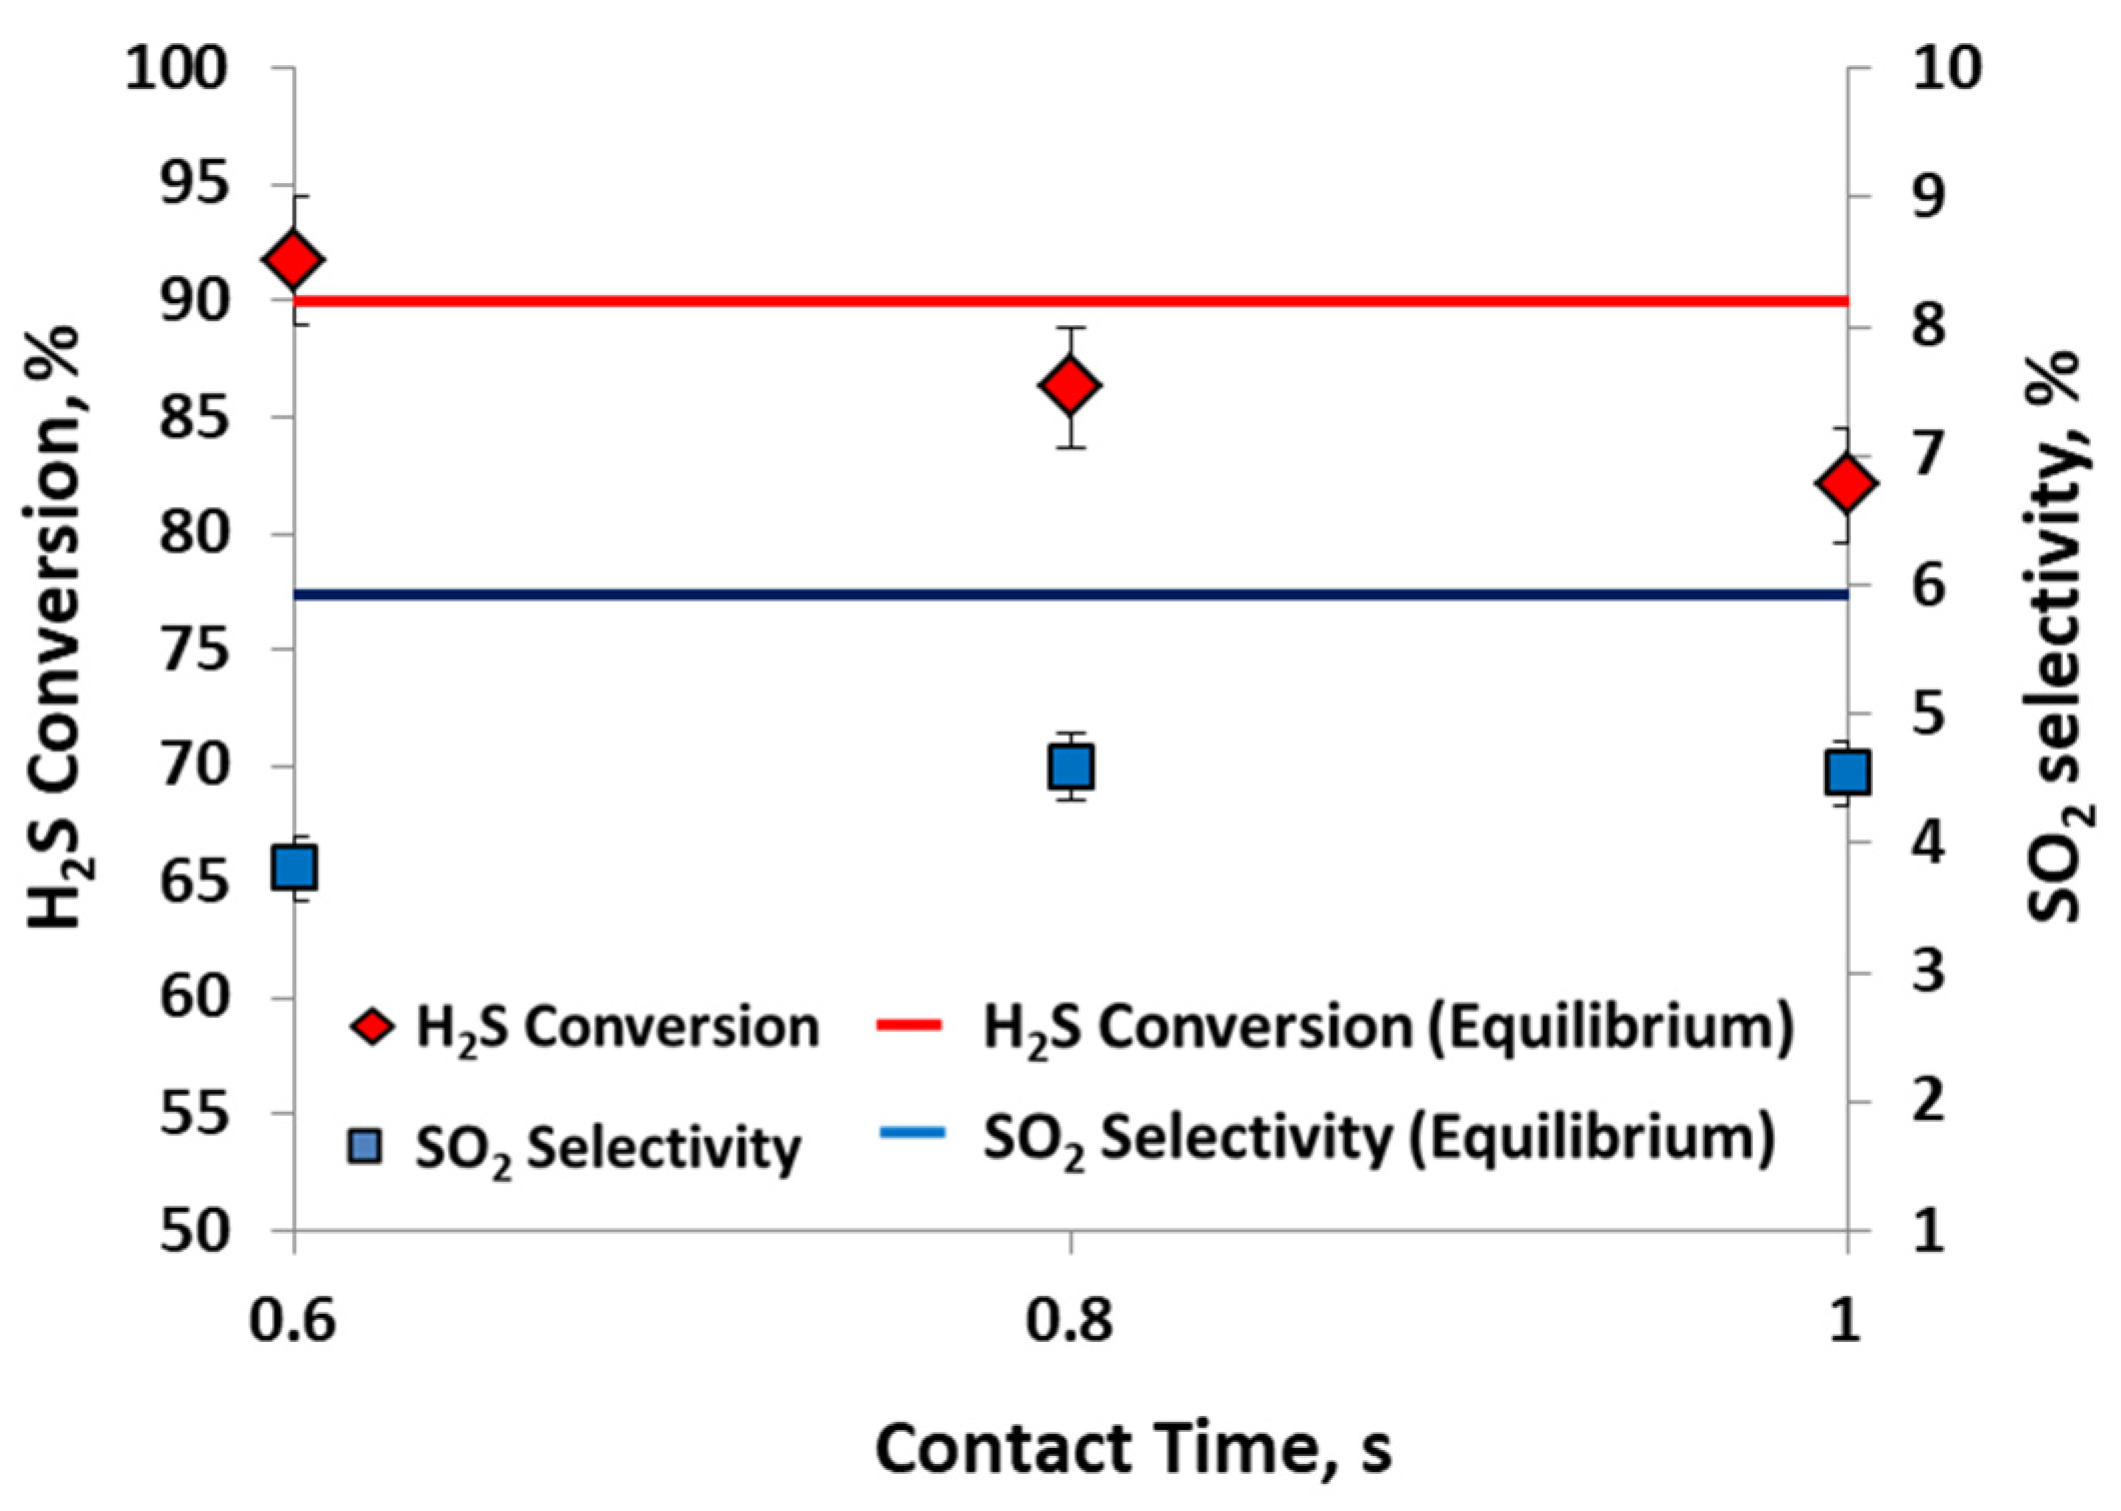
The influence of the contact time on the catalytic performance is reported in
Figure 5. For comparison, the equilibrium data for both H
2S conversion and SO
2 selectivity at the temperature of 327 °C are also shown.
The catalytic performance resulted in little affected from the variation of the contact time. In particular, it is noteworthy to evidence that the H2S conversion is quite close to the equilibrium values, while the SO2 selectivity is in all cases below the equilibrium value.
2.2. Catalyst Characterization
The nominal and measured vanadium oxide content of the catalysts before the activation step is reported in
Table 3.
The results reported evidence that the nominal V2O5 loading is very close to the measured loading.
The specific surface areas of the fresh and used catalysts are reported in
Table 4.
The lowest SSA was observed for the sample that was not supported (V2O5). In particular, the value of bulk V2O5 (8 m2/g) decreased more than 50% after the catalytic test. For the fresh V-CeO2 catalysts, the values of SSA were slightly lower than the CeO2 support (~30 m2/g). After the catalytic activity tests, the SSA decrease was likely due to the sulfur deposition on the catalyst surface. This aspect was more evident for the 20 V-CeO2 sample (SSA = 4 m2/g) and was confirmed by XRD and Raman characterizations.
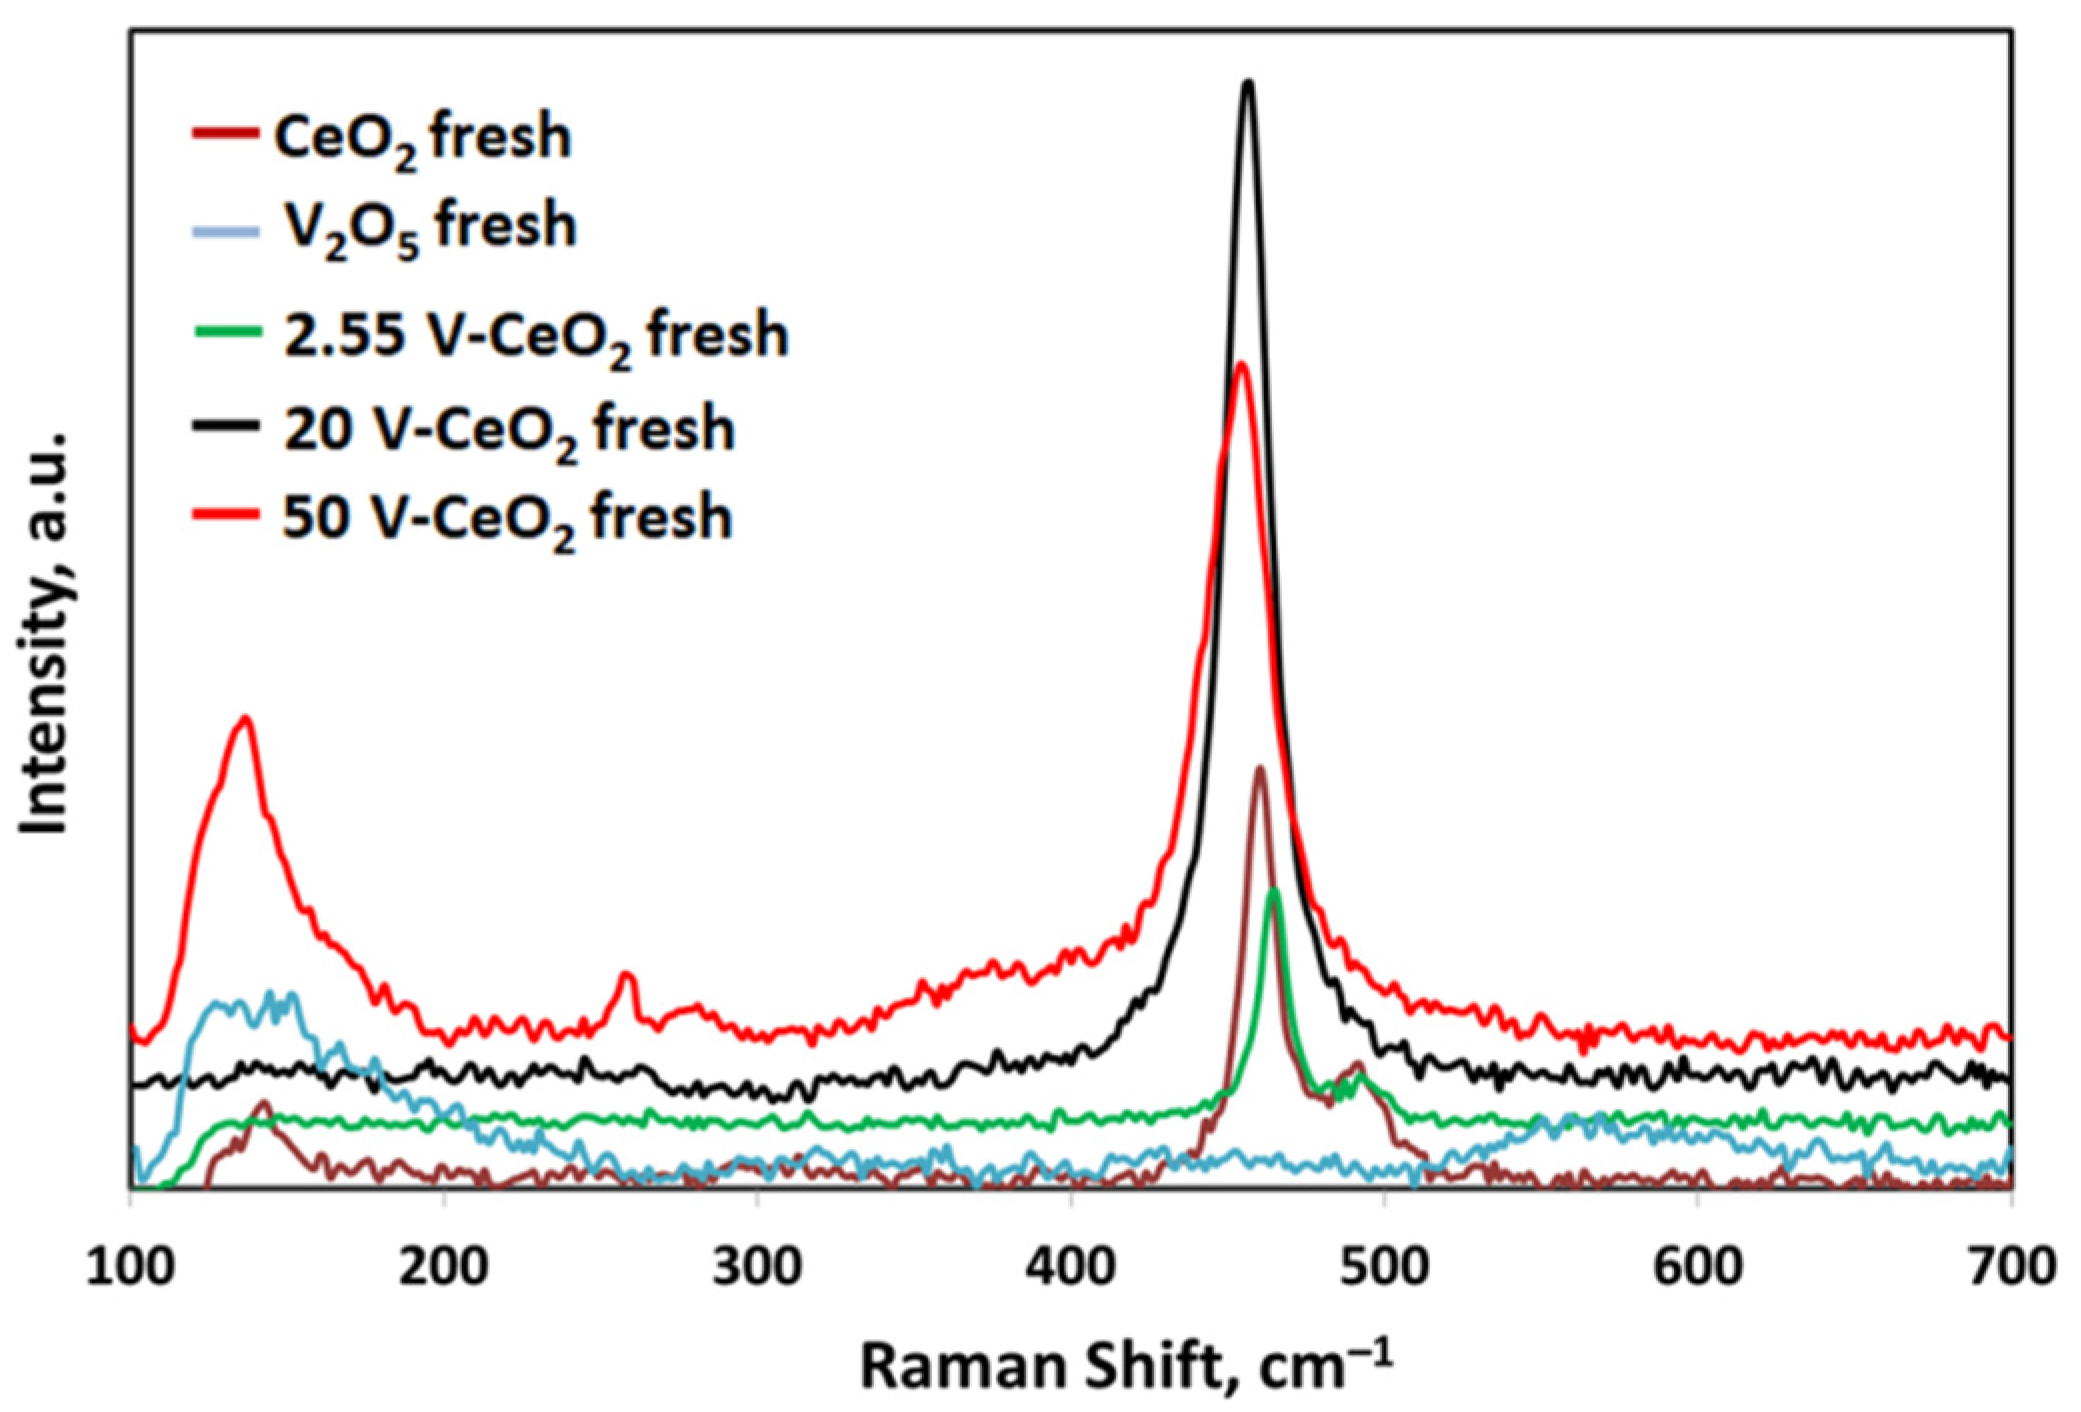
Raman spectra of the support and fresh catalysts are shown in
Figure 6. The Raman spectrum for pure CeO
2 shows the main band at 460 cm
−1, ascribable to ceria in the typical cubic crystal structure of fluorite-type cerium oxide [
22,
23]. The 2.55 V-CeO
2 sample shows that such Raman band slightly shifted to 465 cm
−1, while in the case of the catalysts with the highest V loading this band shifted up to 454 cm
−1. A more detailed discussion of these results is reported in the
Supplementary Materials (
Figure S1).
The XRD spectra of CeO
2 and the fresh catalysts are shown in
Figure 7. All the catalysts exhibit the characteristic peaks of CeO
2 at 28.3°, 32.8°, 47.3°, 56.1°, 58°, and 69°, corresponding to diffraction planes indexed as (1 1 1), (2 0 0), (2 2 0), (3 1 1), (2 2 2), and (4 0 0), respectively [
24]. These patterns are ascribable to the typical cubic crystal structure of fluorite-type cerium oxide [
25]. No additional reflections attributable to V
2O
5 are detectable, evidencing that the sulfuration of the catalysts completely occurred [
26]. Furthermore, there were no peaks detected that related to typical vanadium sulfides (VS
2, VS
4, V
2S
3, V
3S
4) that might have formed following the sulfuration treatment [
27].
In
Figure 8, the Raman spectra of the fresh samples (CeO
2 and V-CeO
2 catalysts) are compared with the used catalysts. The used CeO
2, equally to the fresh one, has the characteristic Raman peak perfectly centered at 460 cm
−1 (
Figure 8a) [
22,
23]. A slight shift of this Raman band up to 465 cm
−1, 457 cm
−1, and 454 cm
−1 (
Figure 8b–d) is detectable for 2.55 V-CeO
2, 20 V-CeO
2, and 50 V-CeO
2 fresh catalysts, respectively, as already previously observed (
Figure 6). A detailed discussion of the Raman results is reported in the
Supplementary Materials (
Figure S2).
Furthermore, the absence of any characteristic bands of the vibrational modes of crystalline V
2O
5 [
28] and V = O stretching vibration ascribable to monovanadate species (VO
43−) denotes that the sulfuration of the catalysts occurred completely [
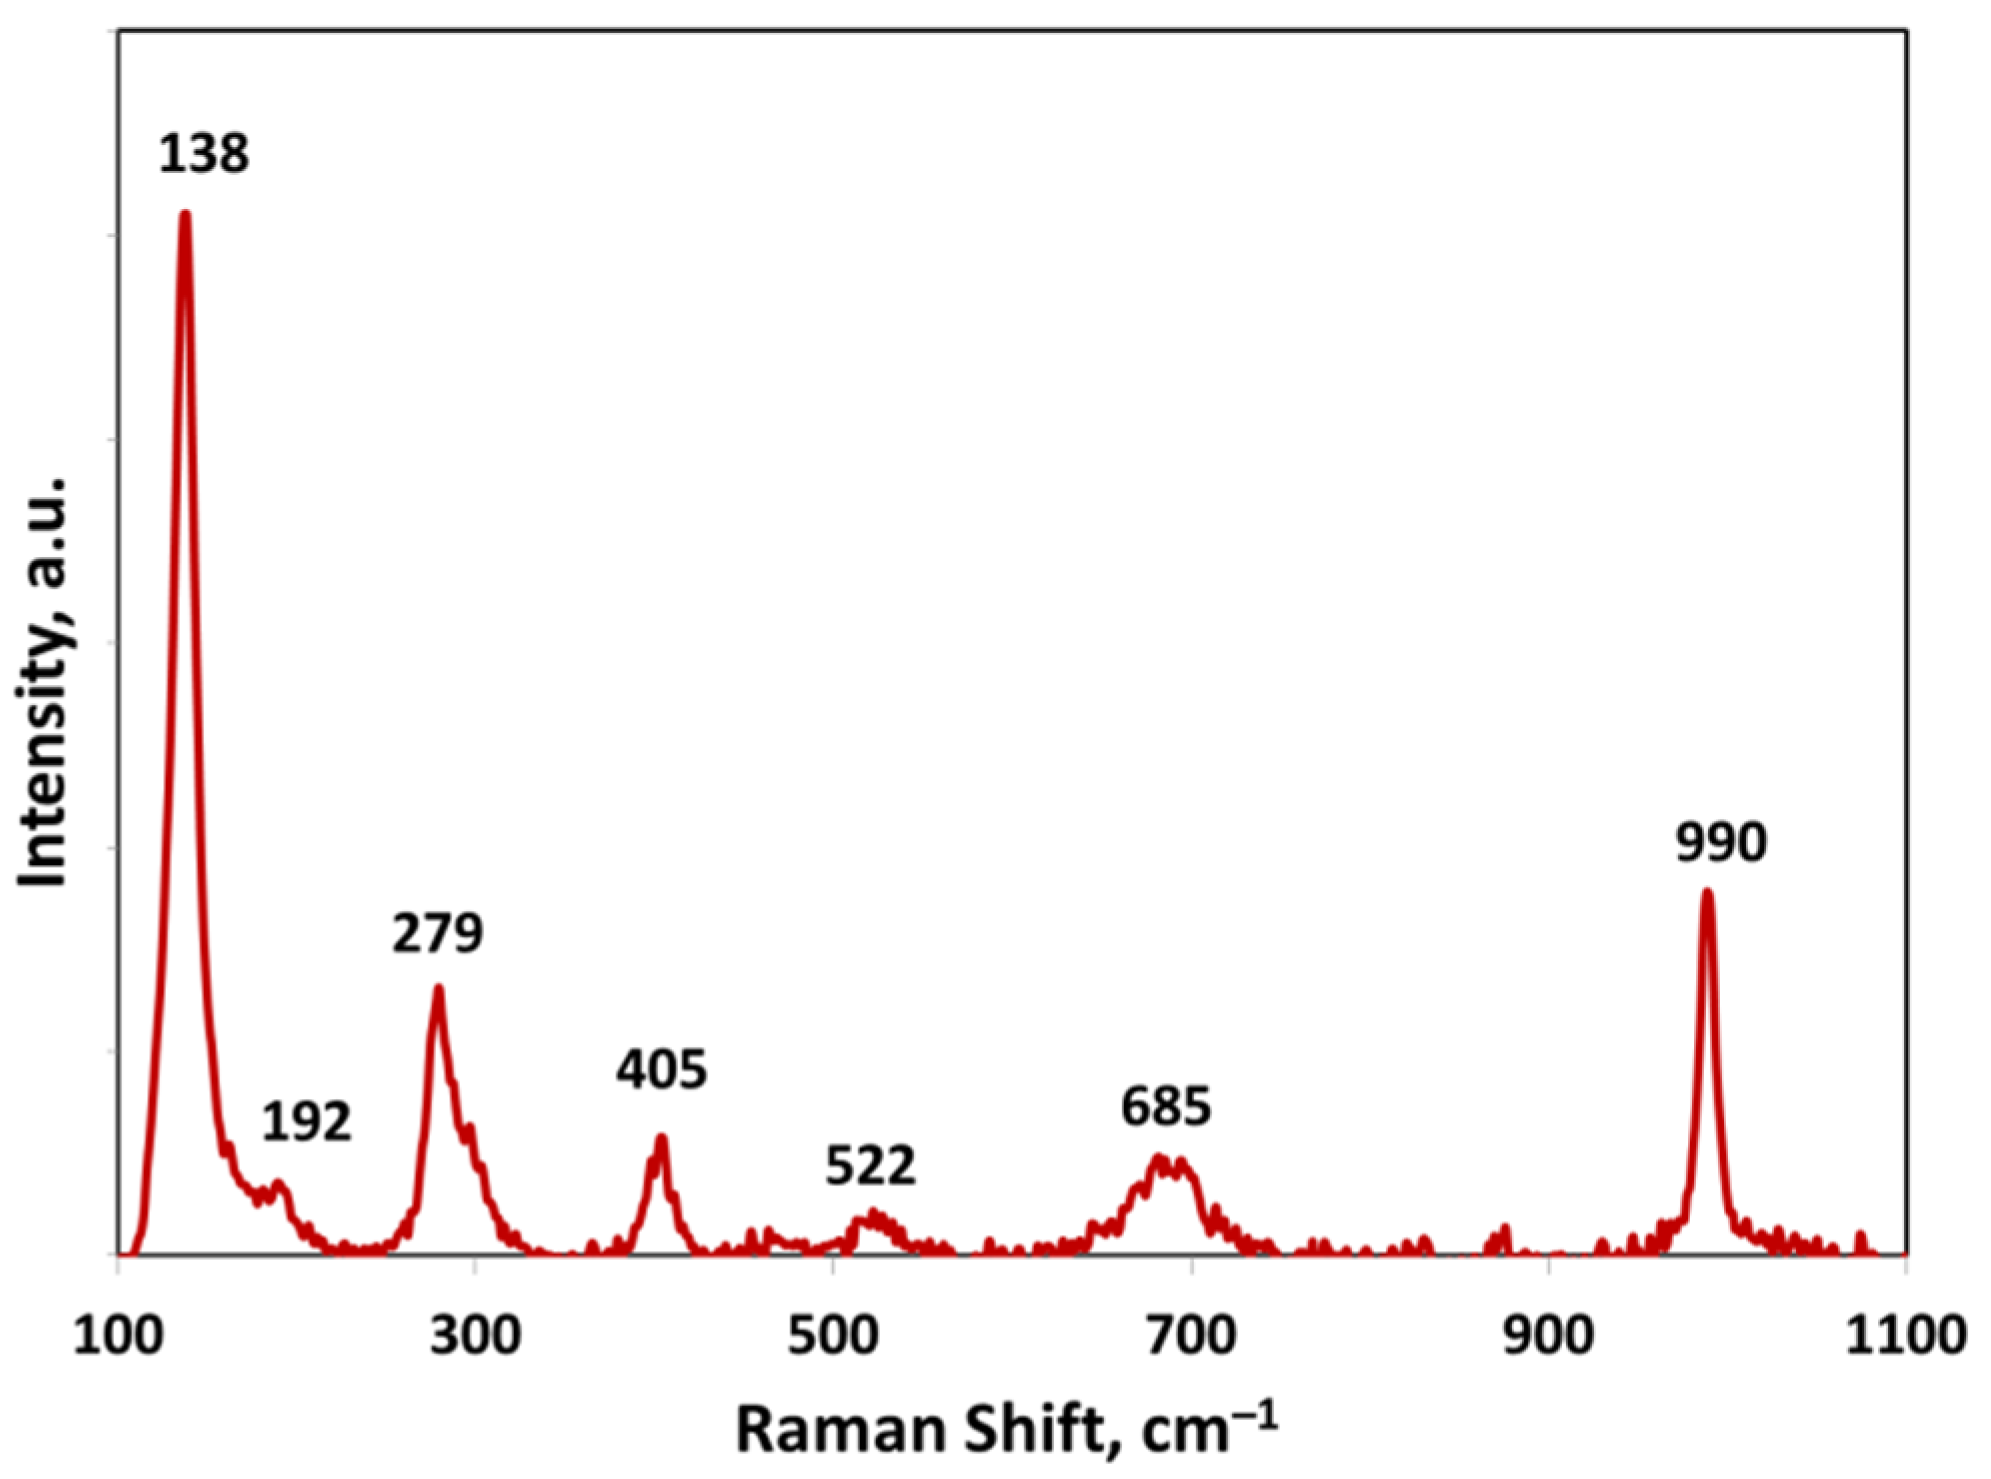
16]. The Raman spectrum of the bulk V
2O
5 after the catalytic test is reported in
Figure 9.
The Raman bands at 140, 192, 282, 405, 688, and 993 cm
−1 are characteristic of the vanadium sulfide in VS
2 form, as reported in the literature [
29]. In particular, all the signals correspond to the rocking combination and stretching vibrations of V–S bonds or their combination [
30]. Moreover, no bands related to the formation of vanadyl sulfate (984 cm
−1 and 1060 cm
−1) were observed [
31].
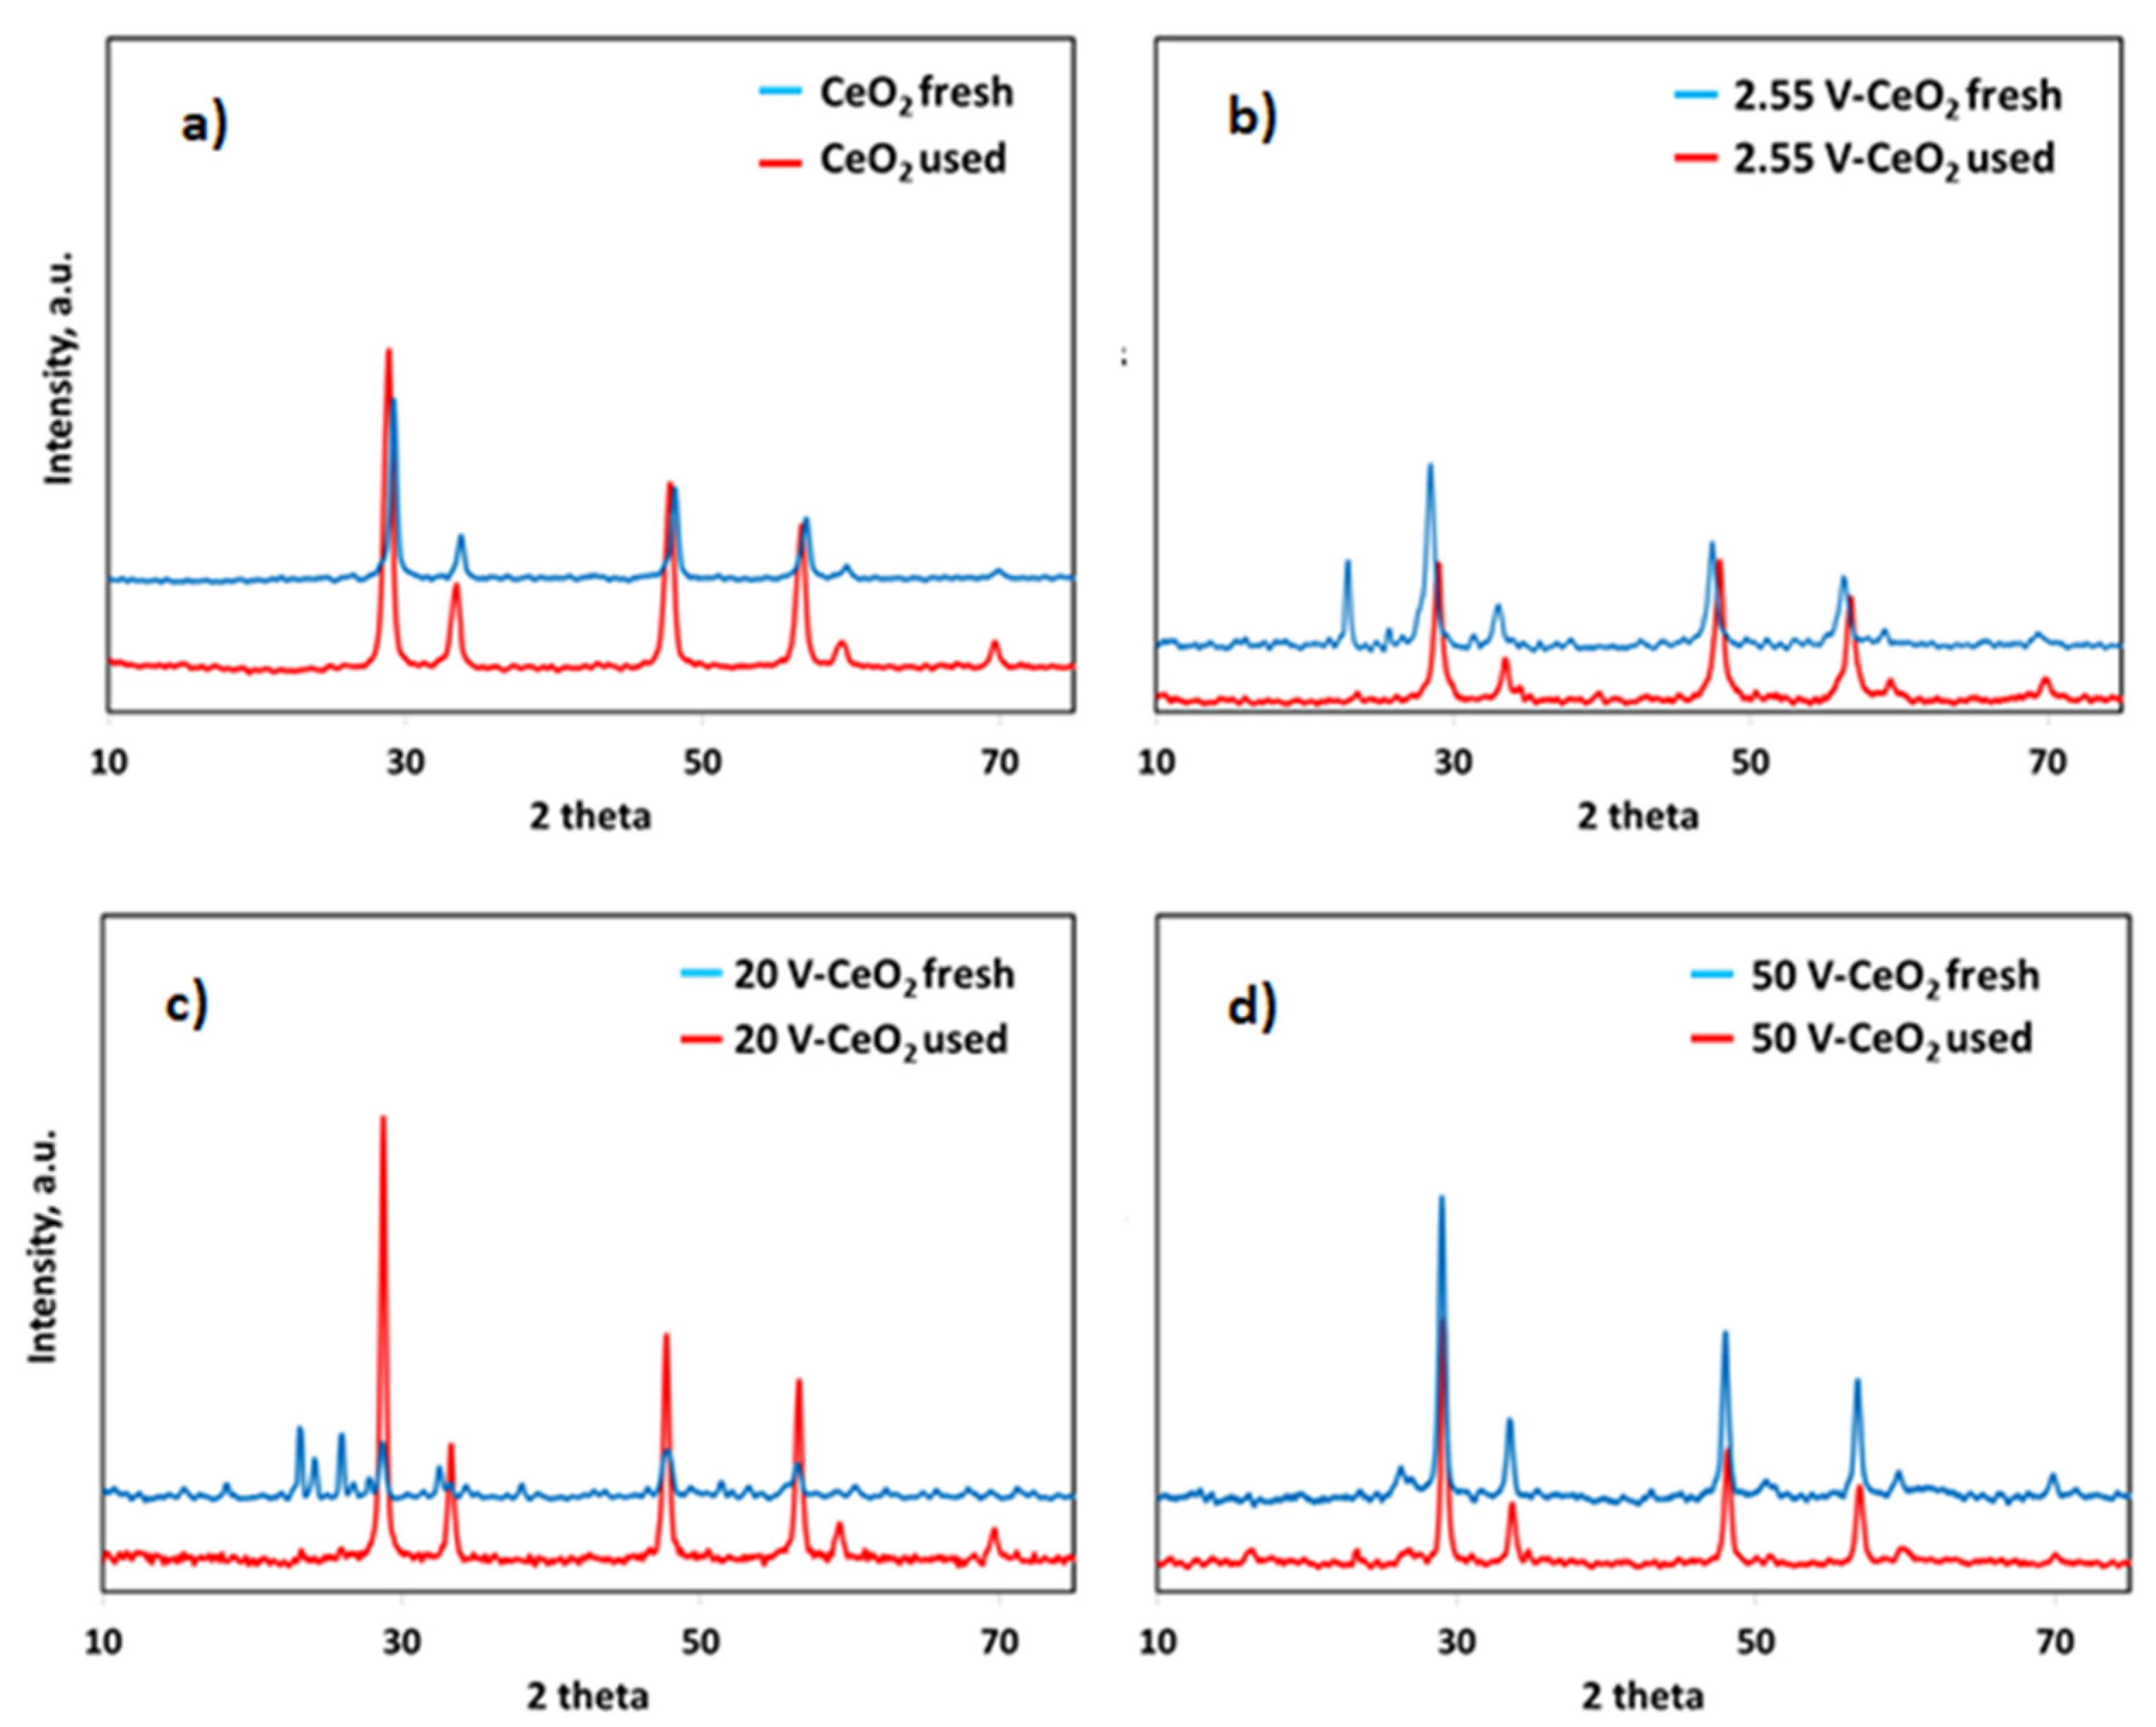
In
Figure 10, the XRD patterns of the fresh samples are compared with the used ones. There are no differences between the XRD spectra of the fresh/used bulk CeO
2; for the used sample less intensity of the peaks is observed, which is likely due to the sulfur deposition (
Figure 10a). For the used 2.55 V-CeO
2 catalyst, in addition to the characteristic peaks of the CeO
2 fresh sample, a signal is visible at 2θ = 23° due to the sulfur formation [
32], as also confirmed from Raman analysis (
Figure 10b). The spectra of the used 20 V-CeO
2 catalyst (
Figure 10c) are different, where other peaks attributable to the sulfur are observable at 2θ = 23°, 24°, 26°, 27°, and 28° [
32]. For the 50 V-CeO
2 catalyst, the XRD spectrum of the fresh sample is perfectly stackable with that of the used sample (
Figure 10d) because all the peaks are ascribable only to the CeO
2 support.
The average crystallite size of ceria for the different catalysts, calculated with the Scherrer equation, are listed in
Table 5.
As it is possible to observe from
Table 5, the increase of the V-loading for the different catalysts has involved an increase in the crystallite size of the CeO
2, as reported in the literature for supported vanadium catalysts [
25]. The average crystallite size of bulk CeO
2 before the catalytic tests was 13 nm; it increased to 24 nm for the catalyst having the highest V-content (50 V-CeO
2). Relatively to the catalysts, there is a negligible variation of the ceria average crystallite size between fresh and used samples.
The only significant variation between fresh and used samples was obtained for the support; the greater segregation of the CeO
2 after the catalytic activity tests involved the increase of the crystallite dimension (21 nm). The segregation of the CeO
2 crystallite may be due to the high SO
2 formation observed on the support in the absence of the active phase; in fact, among the catalysts, the highest value of SO
2 selectivity (~10%) was obtained for the CeO
2 at 327 °C as previously reported in
Figure 2. The reaction temperature could favor the formation of sulfate species and also the oxygen in the ceria lattice could facilitate the CeO
2 sulfuration [
33]; therefore, the reaction between CeO
2 and SO
2 could occur, leading to the formation of cerium sulfate Ce(SO
4)
2, which is stable at high temperature and decomposes between 722 and 843 °C to CeO
2 [
34].


