Article

Photo-Oxidation of Ammonia to Molecular Nitrogen in Water under UV, Vis and Sunlight Irradiation

1
Chemical Plants and Industrial Chemistry Group, Dipartimento di Chimica, Università degli Studi di Milano, CNR-ISTM and INSTM Unit Milano-Università, Via C. Golgi 19, 20133 Milan, Italy
2
Dipartimento di Ingegneria, Civile ed Ambientale, Università degli Studi di Genova and INSTM Unit Genova, Via all’Opera Pia 15A, 16145 Genoa, Italy
*
Author to whom correspondence should be addressed.
Catalysts 2021, 11(8), 975; https://doi.org/10.3390/catal11080975
Submission received: 10 July 2021 / Revised: 12 August 2021 / Accepted: 12 August 2021 / Published: 14 August 2021

Abstract

:
Titanium dioxide-based photocatalysts have been used to perform the photo-oxidation of ammonium/ammonia to molecular nitrogen. Different light sources were employed, i.e., UV, LED visible light and natural sunlight, and their performance was compared in order to understand which setup was the most efficient. It was found that under selected conditions, the LED lamp, in combination with silver-promoted TiO2, was able to push the conversion of ammonium toward 48% after 4 h of reaction time. On the other hand, with a more powerful UV lamp, lower conversion was achieved, ca. 40%. Natural sunlight under the same conditions attained more than 38% conversion, but the fluctuation of the reaction conditions remain a very critical issue for the real exploitation of sunlight in water treatment.

1. Introduction

The global human population almost grew by a factor of eight during the last 150 years from 1 to 7.7 billion [1], and one of the key factors of that rise has been the continuous and reliable supply of food ensured by the usage of synthetic fertilizers. Most of these compounds contain activated nitrogen (i.e., ammonia and nitrates), obtained mainly through the Haber–Bosch and related processes, and are employed as a nutrient for crops and for feeding fish into breeding tanks [2].
However, the extensive use of these compounds has altered the equilibrium of the nitrogen cycle because ca. 121 million tons of nitrogen per year from the atmosphere are converted into reactive forms, while it has been calculated that to not impact Earth’s ecosystems, the highest amount of nitrogen should not exceed 35 million tons per year [3]. Synthetic fertilizers contain more than 70% of the activated nitrogen produced globally, and they are commonly injected or dispersed over soils in order to boost plant growth [4]. Due to the low efficiency of traditional cultivation techniques, most of the compounds are lost through evaporation or leached into the groundwater, and the uncontrolled release of N contaminants in the atmosphere has a negative effect on the quality of air, as they are quite readily converted into NOx, which are both noxious and greenhouse gases, or contribute to the formation of ozone at ground level [5,6]. Moreover, nitrogen oxides and ammonium can dissolve into rain and significantly lower its pH (4.5), leading to acid rainfall [7]. On the other hand, the destiny of the reactive nitrogen unabsorbed into soil is to enter the water cycle, leading to groundwater pollution and eutrophication [8]. Although the negative effect decreased with the increasing size of the organism exposed, it was found that a concentration of 10 parts per million (ppm) of nitrates in water could kill or seriously wound most of the invertebrates that populate freshwater sources (i.e., lakes, rivers, etc.) [9]. The World Health Organization (WHO) guidelines set the maximum exposure level in drinking water at 50 ppm for nitrates, 3 ppm for nitrites and 500 ppb (parts per billion) for ammonia [10]. Higher concentrations of NOx are associated with an increased incidence of DNA damage and tumoral formations [11], whereas ammonia can cause irritations, burns and alter the natural pH equilibria of the human body [12].
Several treatments have been developed in order to reduce the N content of industrial wastewater such as heterotrophic denitrification, which employs microorganisms capable of converting ammonium and nitrate into nitrite and subsequently reducing NO2 to N2 [13,14]; however, the bacteria are usually active under a narrow range of conditions and require constant feeding. Other approaches are sequestration through ion exchange columns [15], chemical oxidation/reduction, stripping (for ammonia) or the more expensive membrane separation [16], but these usually require stoichiometric amounts of reagents or produce a rich brine that is difficult to dispose of. Although these processes are suitable for larger treatment plants, there is still a lack of a cheap, scalable and sustainable process able to perform the removal of nitrogen-containing compounds, even when it comes to a smaller scale.
In the present work, we exploited photocatalytic processes to selectively oxidise ammonia after irradiation with light of the proper wavelength [17,18,19,20,21], e.g., titanium dioxide, a semiconductor widely used as a photocatalyst for the degradation of organic pollutants or CO2 activation because it is a safe, stable and inexpensive material, under UV radiation. However, its major limitation is that it is not active under visible light, though it was successfully proven that the deposition of metallic co-catalysts such as Au, Ag, Pt, etc., over the titania surface could effectively narrow the bang gap (mainly thanks to post deposition reduction) and shift the absorption edge toward greater wavelengths, allowing the absorption of visible light, also thanks to plasmonic effects [22,23]. Moreover, the deposed metal can act as an electron sink when its Fermi level is above that of the semiconductor, thus reducing the recombination rate of the photo-generated electron–hole couple and improving the overall efficiency of the photocatalyst. Furthermore, the TiO2 band gap is suitable for performing degradation of inorganic nitrogen pollutants because the potential of its conduction band (−0.05 V) is more negative than the redox potential of the couple N2/NH3 (E0 0.06 V), whereas the potential of both the couples NO3/N2 (E0 1.25 V) and NO2/N2 (E0 1.52 V) are below the valence band (2.7 V), so titania is a strong oxidising and a mild reductive catalyst.
The key point of this study was to find the best conditions under which to perform the photo-oxidation of ammonia using titania-based photocatalysts and proving that this unconventional process could be a sustainable and scalable alternative to traditional treatments. In order to achieve those results, we performed the selective photo-conversion of NH3/NH4+ to N2 in a glass reactor, using several titania photocatalysts based on commercial TiO2 (P25) and TiO2 nanoparticles synthetised via flame spray pyrolysis (FSP). Different co-catalysts were also tested with both titania samples. Moreover, the abatement of this pollutant was successfully carried out under different radiation sources, i.e., UV (ultraviolet) lamp, LED (light emitting diode) visible lamp and natural sunlight.

2. Results and Discussion

2.1. Materials Characterisation

The pore volume and specific surface area were obtained from adsorption and desorption isotherms, using N2 as the adsorbate (Figure 1). Overall, the catalysts prepared from P25 were characterised by a ca. 20–25% lower surface area when compared with the ones based on FSP titania (Table 1). Moreover, the addition of a co-catalyst showed a slightly positive effect on the surface area of the resulting material and, in general, on the total pore volume. Indeed, these flame-prepared materials were typically characterized by small porosity connected with interparticle voids in small agglomerates. The impregnation procedure and heat treatment likely led to the formation of further particle agglomerates, apparently increasing the pore volume but without significantly affecting surface area. On the contrary, micropore volume was calculated using the t-plot method, and the results highlighted that it was always much lower for the impregnated catalysts because the metal was likely to occlude the pores.
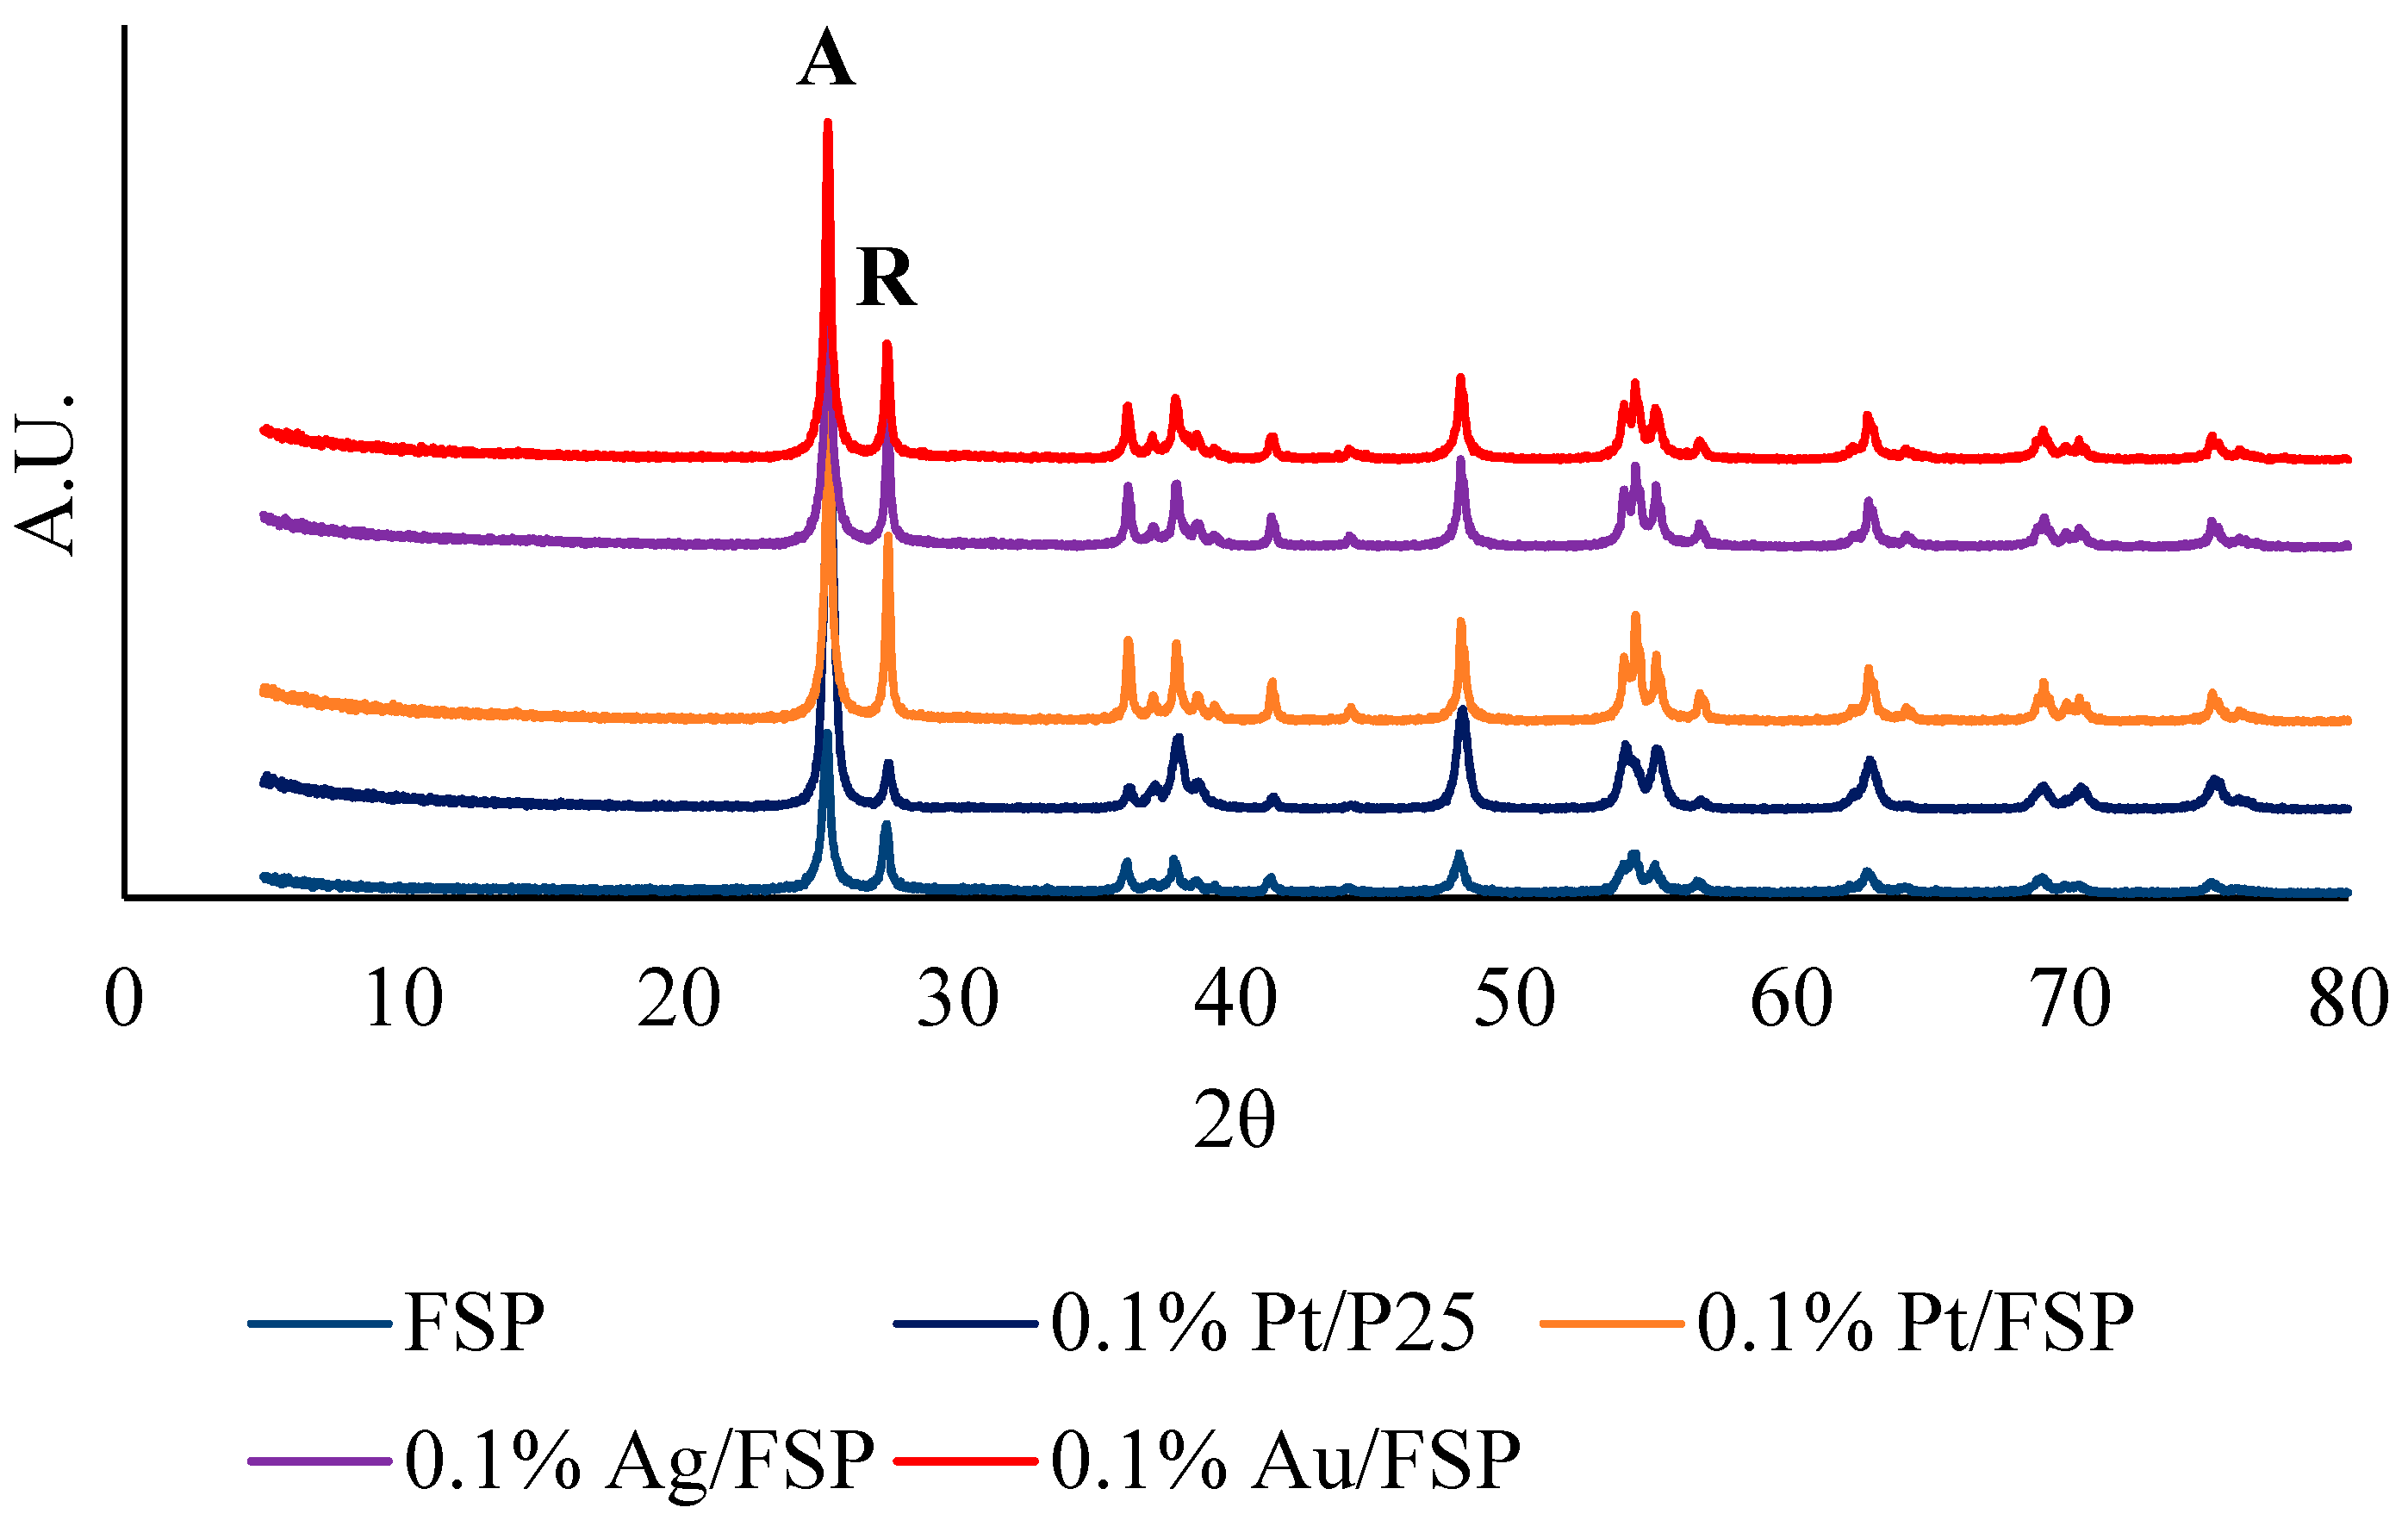
The XRD patterns are reported in Figure 2 and are similar to what has been reported in the literature [24]. According to the literature [24], the phase composition of all the samples was determined from the intensity ratio between the reflections of the anatase and rutile planes at (101) and (110), respectively. They showed that these materials are mainly composed of these two phases with similar proportions: that is, 65–87% for anatase with a lower anatase fraction for the FSP samples than for the P25 ones due to the higher flame temperature or slightly longer residence time in the hot zone of the flame during the synthesis. On the other hand, the presence of a co-catalyst did not seem to significantly influence the amount of each phase but generally increased the crystallite size, which was calculated according to Scherrer’s equation and referred to the most intense peak of the anatase phase, ca. 2θ = 26°. Indeed, P25 loaded with platinum showed a crystallite size 40% larger than the bare titania, whereas in the case of catalysts based on FSP titania, the trend was similar (10–30% larger crystal size) with the exception of Pd/FSP, which showed a −22% contraction in crystallite size. There was no evidence of other titania polymorphs or further phases associated with the co-catalyst, as the latter was highly dispersed and present in very small loading.
Based on the values of Table 1, the addition of a co-catalyst was effective in narrowing the BG [17] and thus shifting the adsorption of the photocatalysts toward longer wavelengths. These results were already observed by us, as the reduction of the metal at high temperatures led to partial reduction of the titania, which decreased the band gap. Furthermore, the titania prepared via pyrolysis showed a band gap similar to P25, although it was slightly lower due to its greater rutile fraction and defectiveness of the surface. Finally, most of the co-catalysts selected induced additional visible absorption due to surface plasmon resonance, which was important during testing under visible light.

2.2. Photo-Oxidation of Ammonium under UV Light

Firstly, we checked through preliminary blank testing that the negligible amount of NH3 was stripped with the gas flow (also at basic pH), and a non-significant amount of reactant was adsorbed over the catalyst under dark conditions (within the experimental precision reported in Section 2.4).
The optimal conditions under which to perform the reaction under UV irradiation were studied previously [25,26,27,28] and were pH 5, 0.2 M of NH4Cl and 0.2 mol/g of the ammonium/catalyst ratio to optimize selectivity to N2. On the contrary, operating under basic conditions boosted the conversion due to the creation of a higher amount of homogeneous, strongly oxidizing species (OH·) but with unsatisfactory selectivity to N2 [28]. Indeed, unselective overoxidation to nitrite and nitrate prevailed at a basic pH.
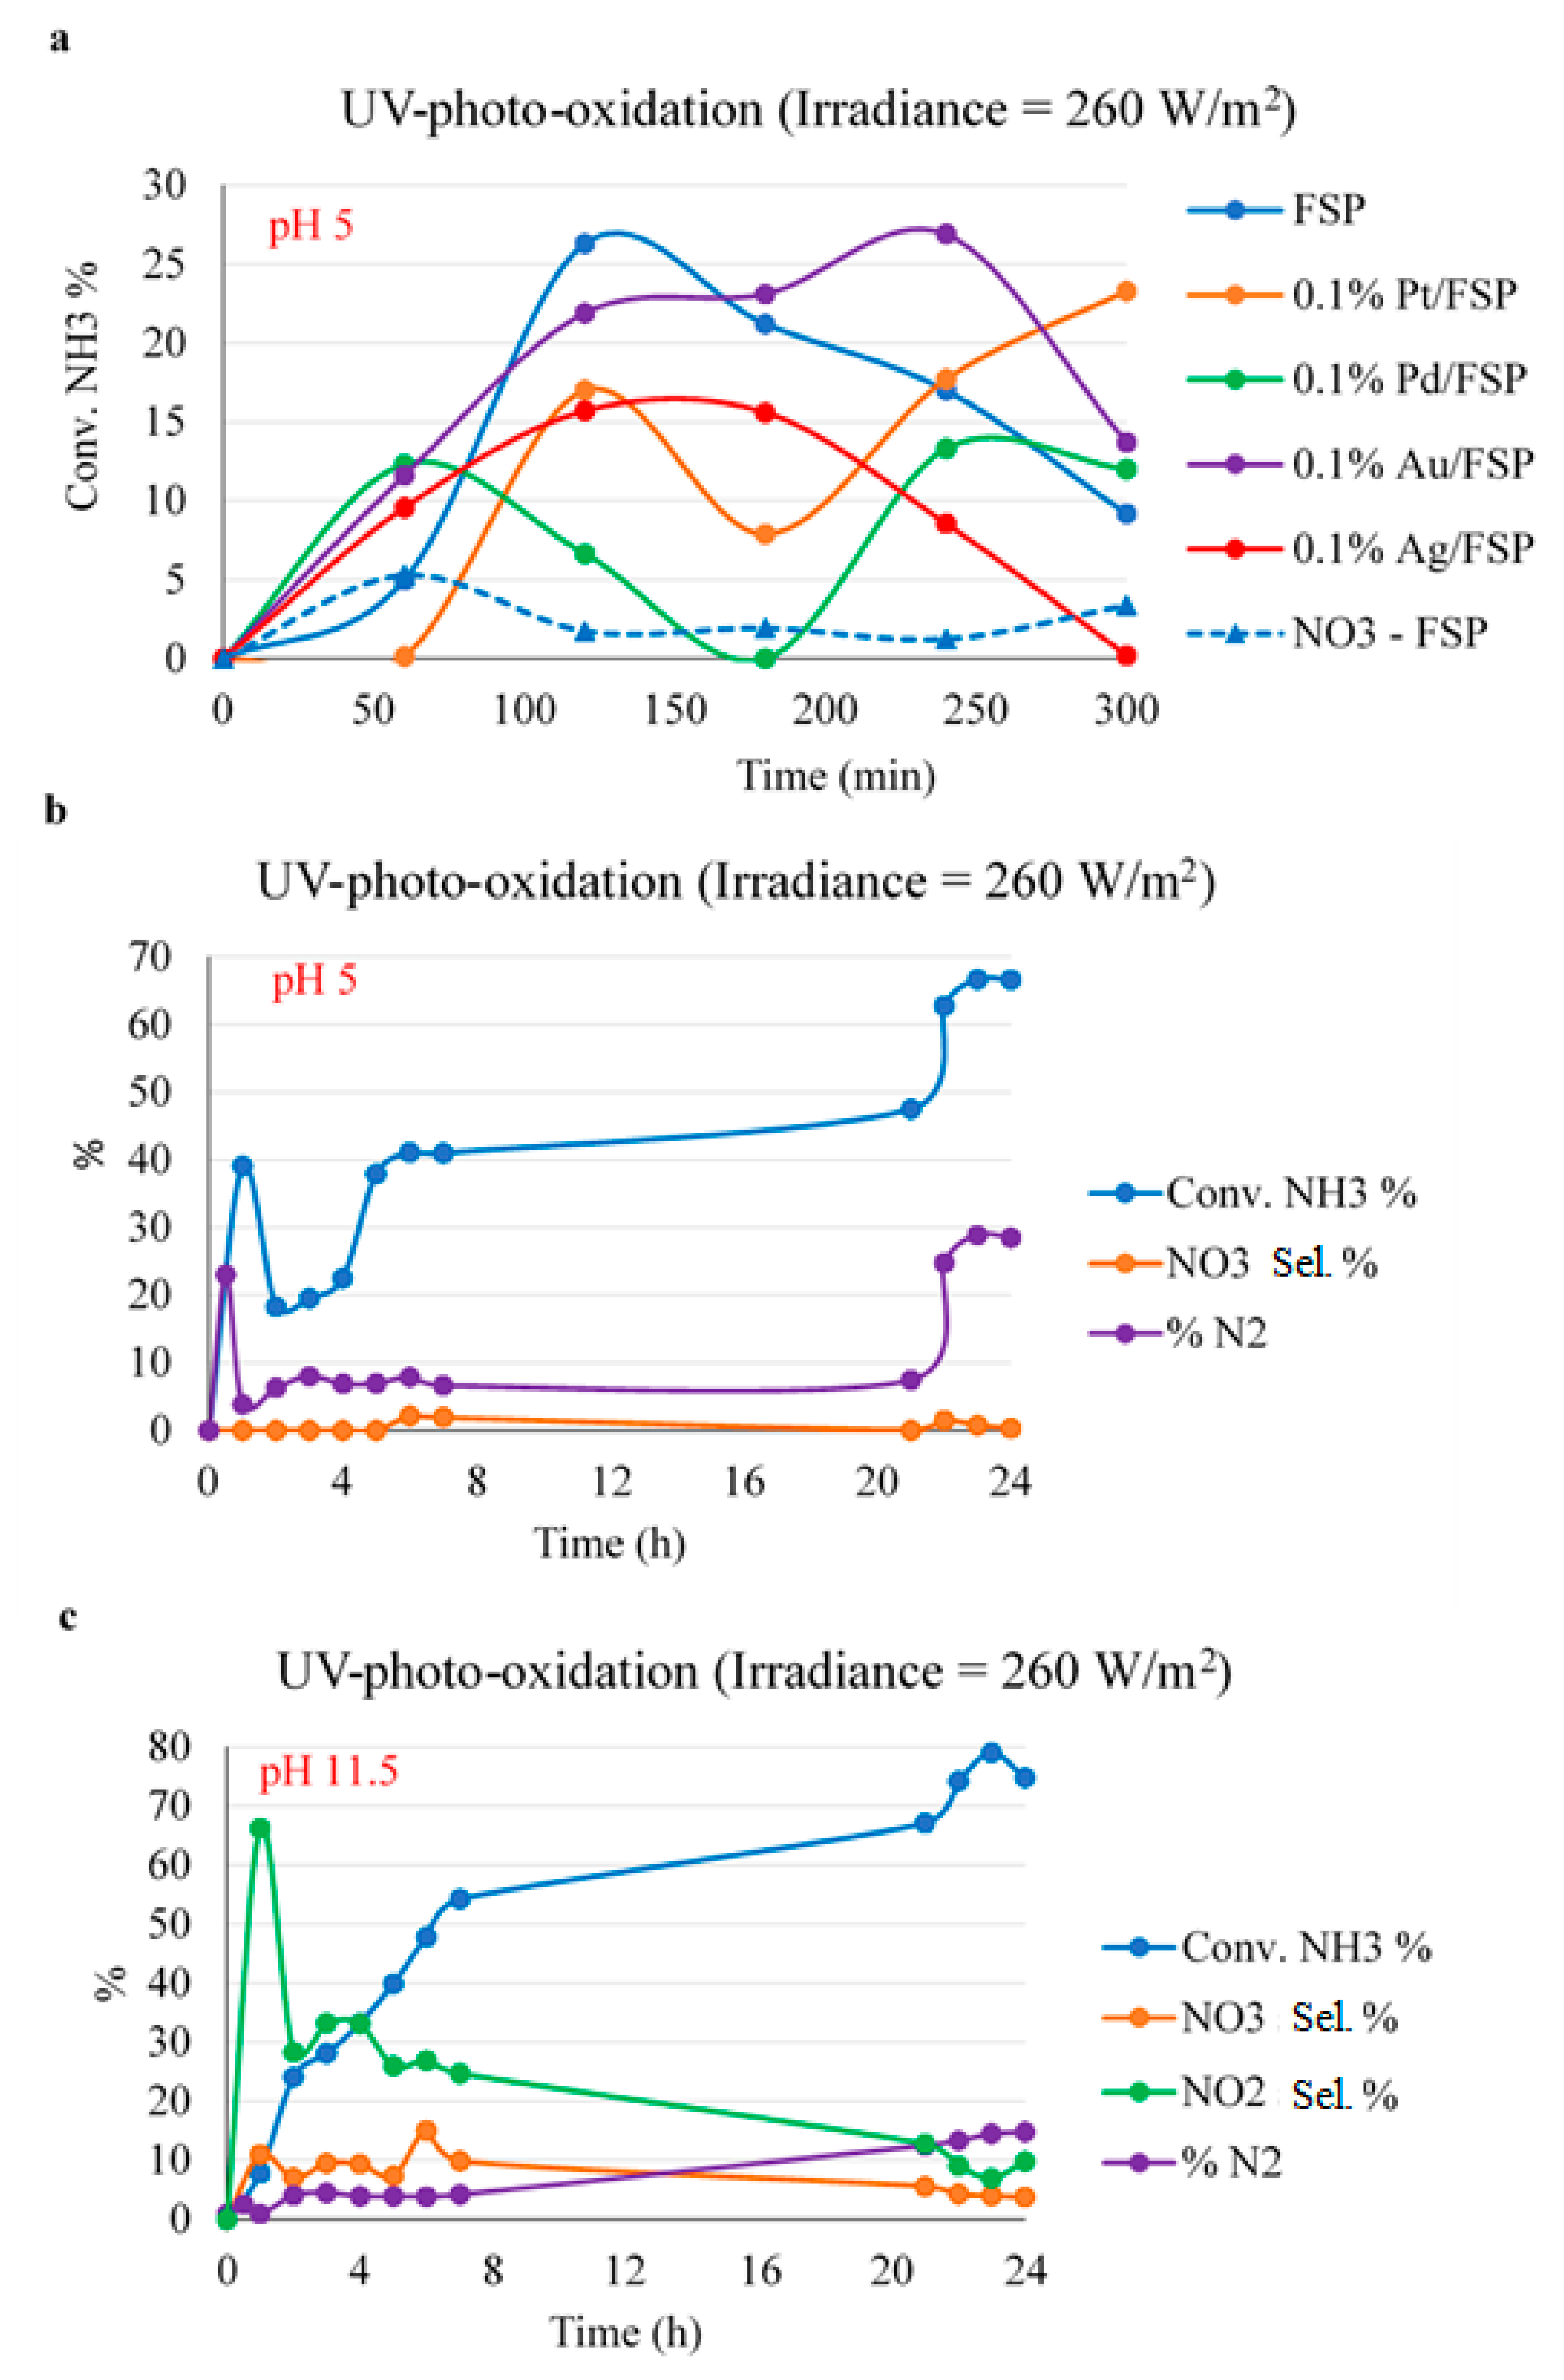
These conditions were applied in a 250 mL sealed reactor with a co-axial UV lamp immersed inside. After saturation in He/O2 to avoid injection of N2, one of the detectable products, as reported in Figure 3a, it was evident that all the catalysts reached a maximum conversion after different reaction times, and then the conversion dropped and two possible evolutions were present: In the case of the platinum- and palladium-promoted catalysts, the conversion increased further, while for bare FSP and the gold- and silver-promoted catalysts, it decreased continuously to nil conversion.
This strange but reproducible behaviour, in the sense that three randomly repeated measures on the same material gave the same trend as well as different catalysts manifesting a similar pattern, may be ascribed to the conversion of the substrate into more oxidised products (i.e., nitrite and nitrate) and their subsequent reduction back to ammonia because these catalysts were active under similar conditions for the photoreduction of nitrates. However, negligible amounts of these anions were detected in solution, except in the case of bare FSP titania (dashed line in Figure 3a), indicating the permanence of these species adsorbed over the catalyst surface. Subsequently they reversibly transformed into the oxidized or reduced forms after their accumulation on the surface. Overall, when testing under UV light irradiation, the addition of a metallic co-catalyst seemed to poorly affect the activity of FSP titania, even lowering it, except for 0.1% Au/FSP.
Further tests were performed, increasing the reaction time to 24 h in order to better understand the evolution of the reaction products over time. The 0.1% Pt/FSP was selected as the photocatalyst due its better performance over time (i.e., the sample that in the 5-h tests showed a significant conversion in the last sampling with conversion not decreasing with time), and the results are reported in Figure 3b, which confirms the first increasing, and then decreasing, conversion, followed by a stationary conversion value overnight (switched-off lamp) and a further increase upon switching the lamp on again.
In accordance with the previous screening, the selectivity towards over-oxidized products was very low or nil at pH = 5. Moreover, this unusual behaviour vs. time of the photo-catalyst was confirmed by the quantitative analysis of the nitrogen evolution, whose trend was almost superimposable to the ammonium conversion. Therefore, it was as if the photo-catalyst experienced a sort of activation but then was flattened out, and then the last few hours of evolution depended on the material.
It is well-known that for pH values above the PZC (point of zero charge) of titania, which was previously measured as 6.25 in the case of P25 and 4.5 for FSP [28], the surface of the catalyst is negatively charged, thus enhancing interactions with cations due to electrostatic attraction in a pH interval between PZC and pKa, while over the pKa, neutral ammonia should interact with a negatively charged surface [29].
On the contrary, a higher concentration of hydroxyl radicals may form at pH > pKa. Therefore, in order to boost the conversion of ammonia, we performed the reaction for 24 h at a pH of 11.5. According to Figure 3c, at first glance, it seems that there was no more activation time and the reaction rate was greater than the one recorded at pH 5. Nevertheless, we observed a poor selectivity toward N2, as the substrate was mainly converted into NO2 and NO3, as already described elsewhere [28]. Despite the good conversion achieved after 24 h of treatment, ca. 75%, it was not acceptable to convert the ammonium into more noxious compounds; next, we decided to work at a slightly acidic pH even though the conversion was lower, but with very limited selectivity to nitrate and nitrite, if any.
Thus, the catalysts were more active under more basic conditions. In this case, the photocatalyst effectively acted as a generator of strongly oxidising species, which are active as homogeneous phase oxidants. This led to a higher photooxidation activity, but OH· acted unselectively, also leading to the overoxidation of ammonia to nitrites and nitrates.
By contrast, the photocatalyst acted more selectively, though less actively, through the direct photooxidation of ammonia when it was adsorbed over the surface. In order to maximise adsorption, the reaction should be carried out at PZC < pH < pKa. However, the oxidation reaction is rate limiting, with a conversion flattening out while saturating the surface.
The activity of the different catalysts, indeed, reflected quite well the specific surface area trend. For instance, the surface area of FSP and Au/FSP was very similar, and the same activity was observed, while Pd/FSP was characterised by the lowest surface area and the lowest activity. Furthermore, very low selectivity to nitrate was observed only with the unpromoted FSP and P25 catalysts at pH = 5, while metal addition, even if sometimes depressing the conversion, improved the selectivity to N2.
In general, metals with proper workfunctions may act as electron sinks, improving the lifetime of photogenerated charges and thus boosting activity. In this particular application, electrons could be effectively scavenged by also using the dissolved oxygen to form peroxy-radicals, subsequently exploited to oxidise ammonia. On the other hand, some metals may exhibit a plasmonic resonance that improves light absorption in the visible region (e.g., Ag), contributing to better light harvesting. This effect was not really visible under UV light irradiation, as shown in Figure 3a, but may be pivotal in the case of LED white light or sunlight irradiation, as will be explained in the next sections.
In particular, noble metals such as Pt, Pd and Au have Fermi levels below the conduction band of titania, so they act as electron traps for photo-promoted electrons and therefore, avoid charge recombination. Other metals such as Ag, Cr and Cu are able to change their oxidised states in the reaction environment, leading to a decrease in the calculated band gap and improving light harvesting.
Regarding the role of metal addition to the bare titanium dioxide catalyst, J. Nemoto et al. [30] found that ammonia could be converted photochemically into H2/N2 if reacted under alkaline conditions using Pt-TiO2. It was shown that the addition of oxygen to the reaction system of aqueous ammonia on Pt-TiO2 led to an increase in the ammonia decomposition rate [31]. A possible cause is the enhancement of the charge separation efficiency. As said above, an electron generated through UV irradiation of TiO2 could easily react with O2 to give O2∙− with efficient consumption of the resulting photogenerated electron, thus preventing the accumulation of negative charge on the surface of the photocatalyst.

2.3. Comparison between Different Light Sources

An external LED lamp emitting white light was employed in order to simulate the effect of white light irradiation. The best reaction conditions had already been screened under UV light irradiation, though here we focused our attention on the most relevant parameters to discern the different performances of the two radiation sources such as the substrate/catalyst ratio and the type of catalyst, which might affect the amount of energy effectively absorbed by the photoactive material.
As reported in Figure 4a, the configuration with an LED lamp offered better results than the one with UV irradiation because with catalyst 0.1% Ag/FSP, the conversion rose in the first hour of reaction and then remained stable at around 20% with respect to a maximum 18% conversion achieved with the UV lamp and then decreasing to nil conversion. This latter phenomenon was not observed under white light irradiation. Indeed, ammonium conversion increased for the first hours of reaction for every catalyst and then flattened out or possibly decreased a bit only to increase again (Figure 4b). However, no significant decrease in conversion was observed, as when using UV irradiation. This can be explained when considering that TiO2-based catalysts have lower activity for the photoreduction of nitrates [27,32], and thus, possibly nitrates and nitrites can form and accumulate on the surface, saturating it and provoking a flattening conversion pattern. Nevertheless, they were not released in the solution and slowly converted to N2, freeing the surface sites for further ammonium absorption and conversion. The activity for nitrate photoreduction, although moderate under UV activation, was even more depressed under white light, preventing the over-reduction and release of ammonium with apparent decrease of conversion.

2.4. Optimisation of Reaction Conditions under LED White Light Irradiation

Operating at pH = 5, we tuned the amount of catalyst, as exemplified for Ag/FSP, the catalyst with the highest surface area of this group (Figure 5), reaching satisfactory results with a moderate cost. The NH4+/catalyst ratio varied from 0.05 (fixed ammonium amount, high catalyst concentration) to 0.2 mol/gcat (vice versa), outperforming the performance obtained with a smaller amount of catalyst. with a 40% conversion of ammonium at a high catalyst concentration.
Secondly, we varied the concentration of the pollutant, starting from 0.2 mol/L (simulating highly concentrated zootechnical or industrial wastewater) and decreasing by two orders of magnitude the concentration of ammonium (0.0025 mol/L, simulating civil/urban wastewater).
From the curves reported in Figure 6, one can observe that the best results were obtained for concentrations between 0.01 and 0.02 mol/L. Indeed, the tests were carried out with a fixed NH4+/catalyst ratio, thus decreasing the catalyst amount with respect to the benchmark analysis conditions. On the other hand, for the lowest concentration of ammonium, the effect of dilution worsened the results. Moreover, it seemed that in all cases, the conversion reached a maximum after 1–3 h, as previously observed with the UV tests. Because the highest conversion was achieved using the 0.01 mol/L solution, it was selected as the optimal concentration for the following treatments.
The effect of the substrate-to-catalyst ratio was checked in order to enhance the conversion. Thus, starting from the initial ratio of moles/grams catalyst of 0.2 mol/gcat, it was progressively decreased while keeping the amount of NH4Cl constant. Figure 6 shows that an increased amount of catalyst was beneficial in all cases, though when reaching the ratio of 0.01 mol/gcat, the presence of an induction time was evident during the first 50 min of treatment, and the conversion values were not greater than the ones recorded using 0.05 mol/gcat. This latter ratio was then kept in the further tests.
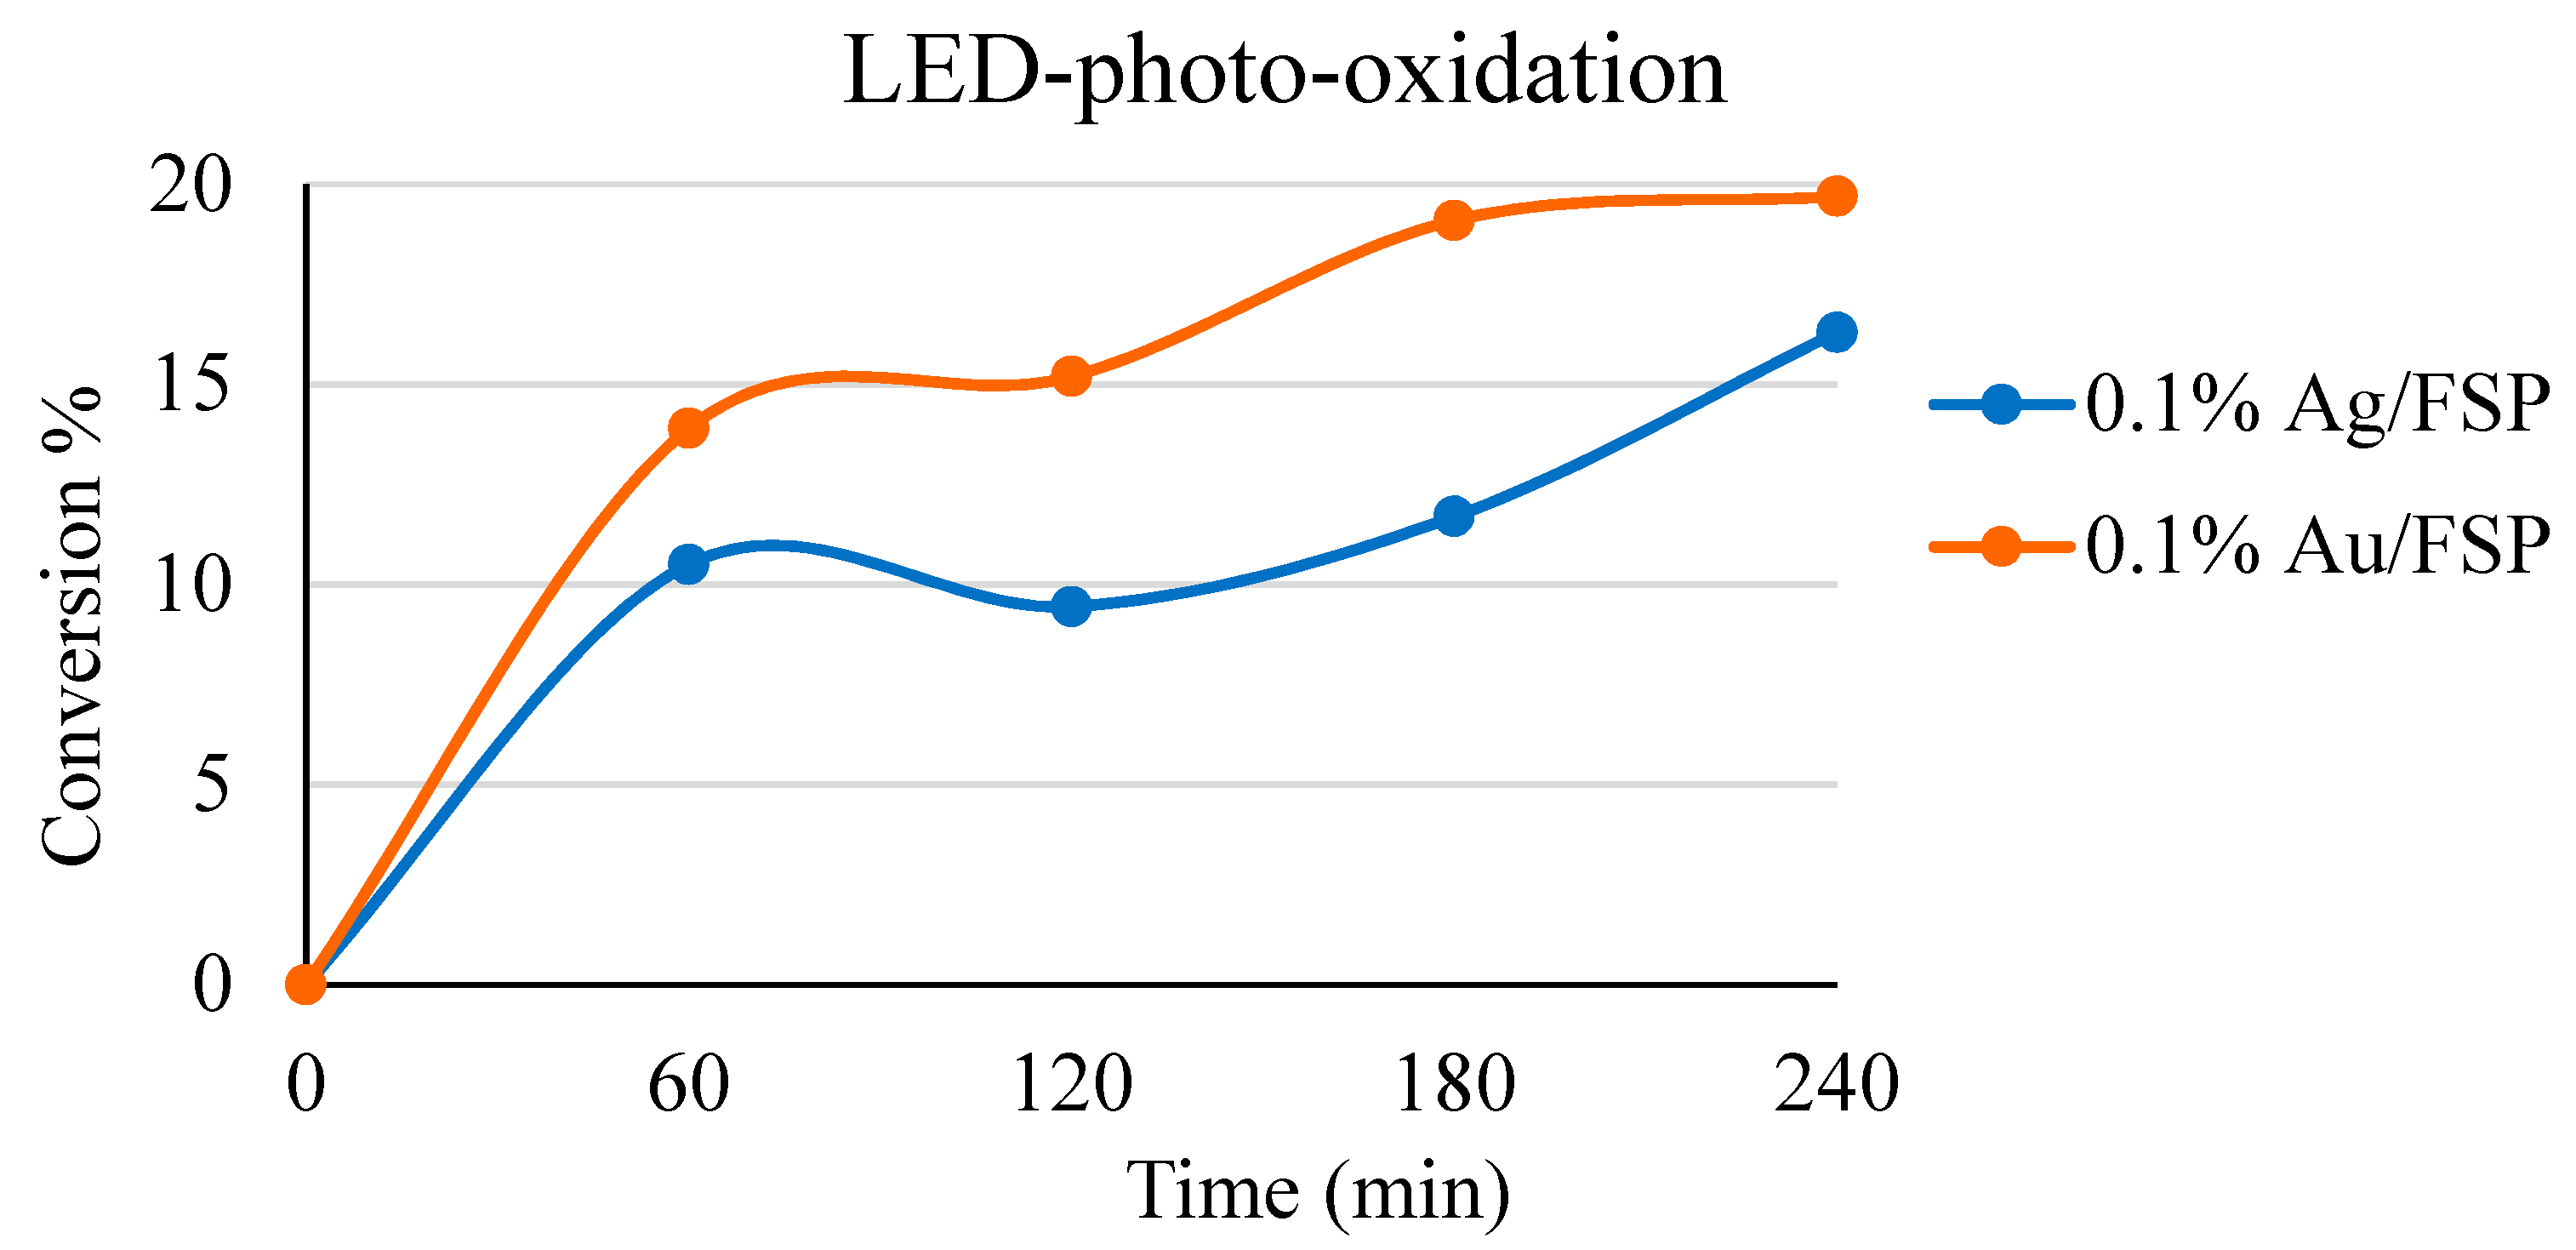
Under the latter optimised photooxidation conditions, we compared the differently promoted samples (Figure 7), namely the ones containing the most abundant and less expensive metals, Ag and Au, and which led to the lowest and highest band gaps among the metal-promoted samples, to be tested under visible LED irradiation.
The ammonium conversion under these conditions ranged between 40% and 50% after 4 h of reaction with a faster response from the Au-promoted sample. Again, a plateau conversion was reached, with newly increasing values after few hours. As a comparative reference, the P25 catalyst showed a similar conversion pattern as the shape, but never reached 20% conversion during the whole course of the test.
The experiment was also repeated while constantly flowing molecular oxygen through the solution to keep it saturated. The ammonium conversion decreased due to the competition between O2 and NH4+ for the valence band holes.
To deepen the application possibilities, a further test was performed by dissolving the ammonium precursor into tap water, which has a very complex composition, including other inorganic cations and anions as well as organic pollutants, and hence it is a good benchmark for applications such as ground water potabilisation. The results, which are reported in Figure 8, underline a reduction of activity for both the Ag- (conversion 16% vs. 48%) and Au-promoted (20% vs. 49%) catalysts, though the latter remained the most active one. It was not fully clear if the catalysts underperformed due to intrinsically lower activity or due to the presence of competing species for other photo-oxidation reactions, although this point deserves deeper exploration, especially if application of this treatment with wastewater is envisaged.
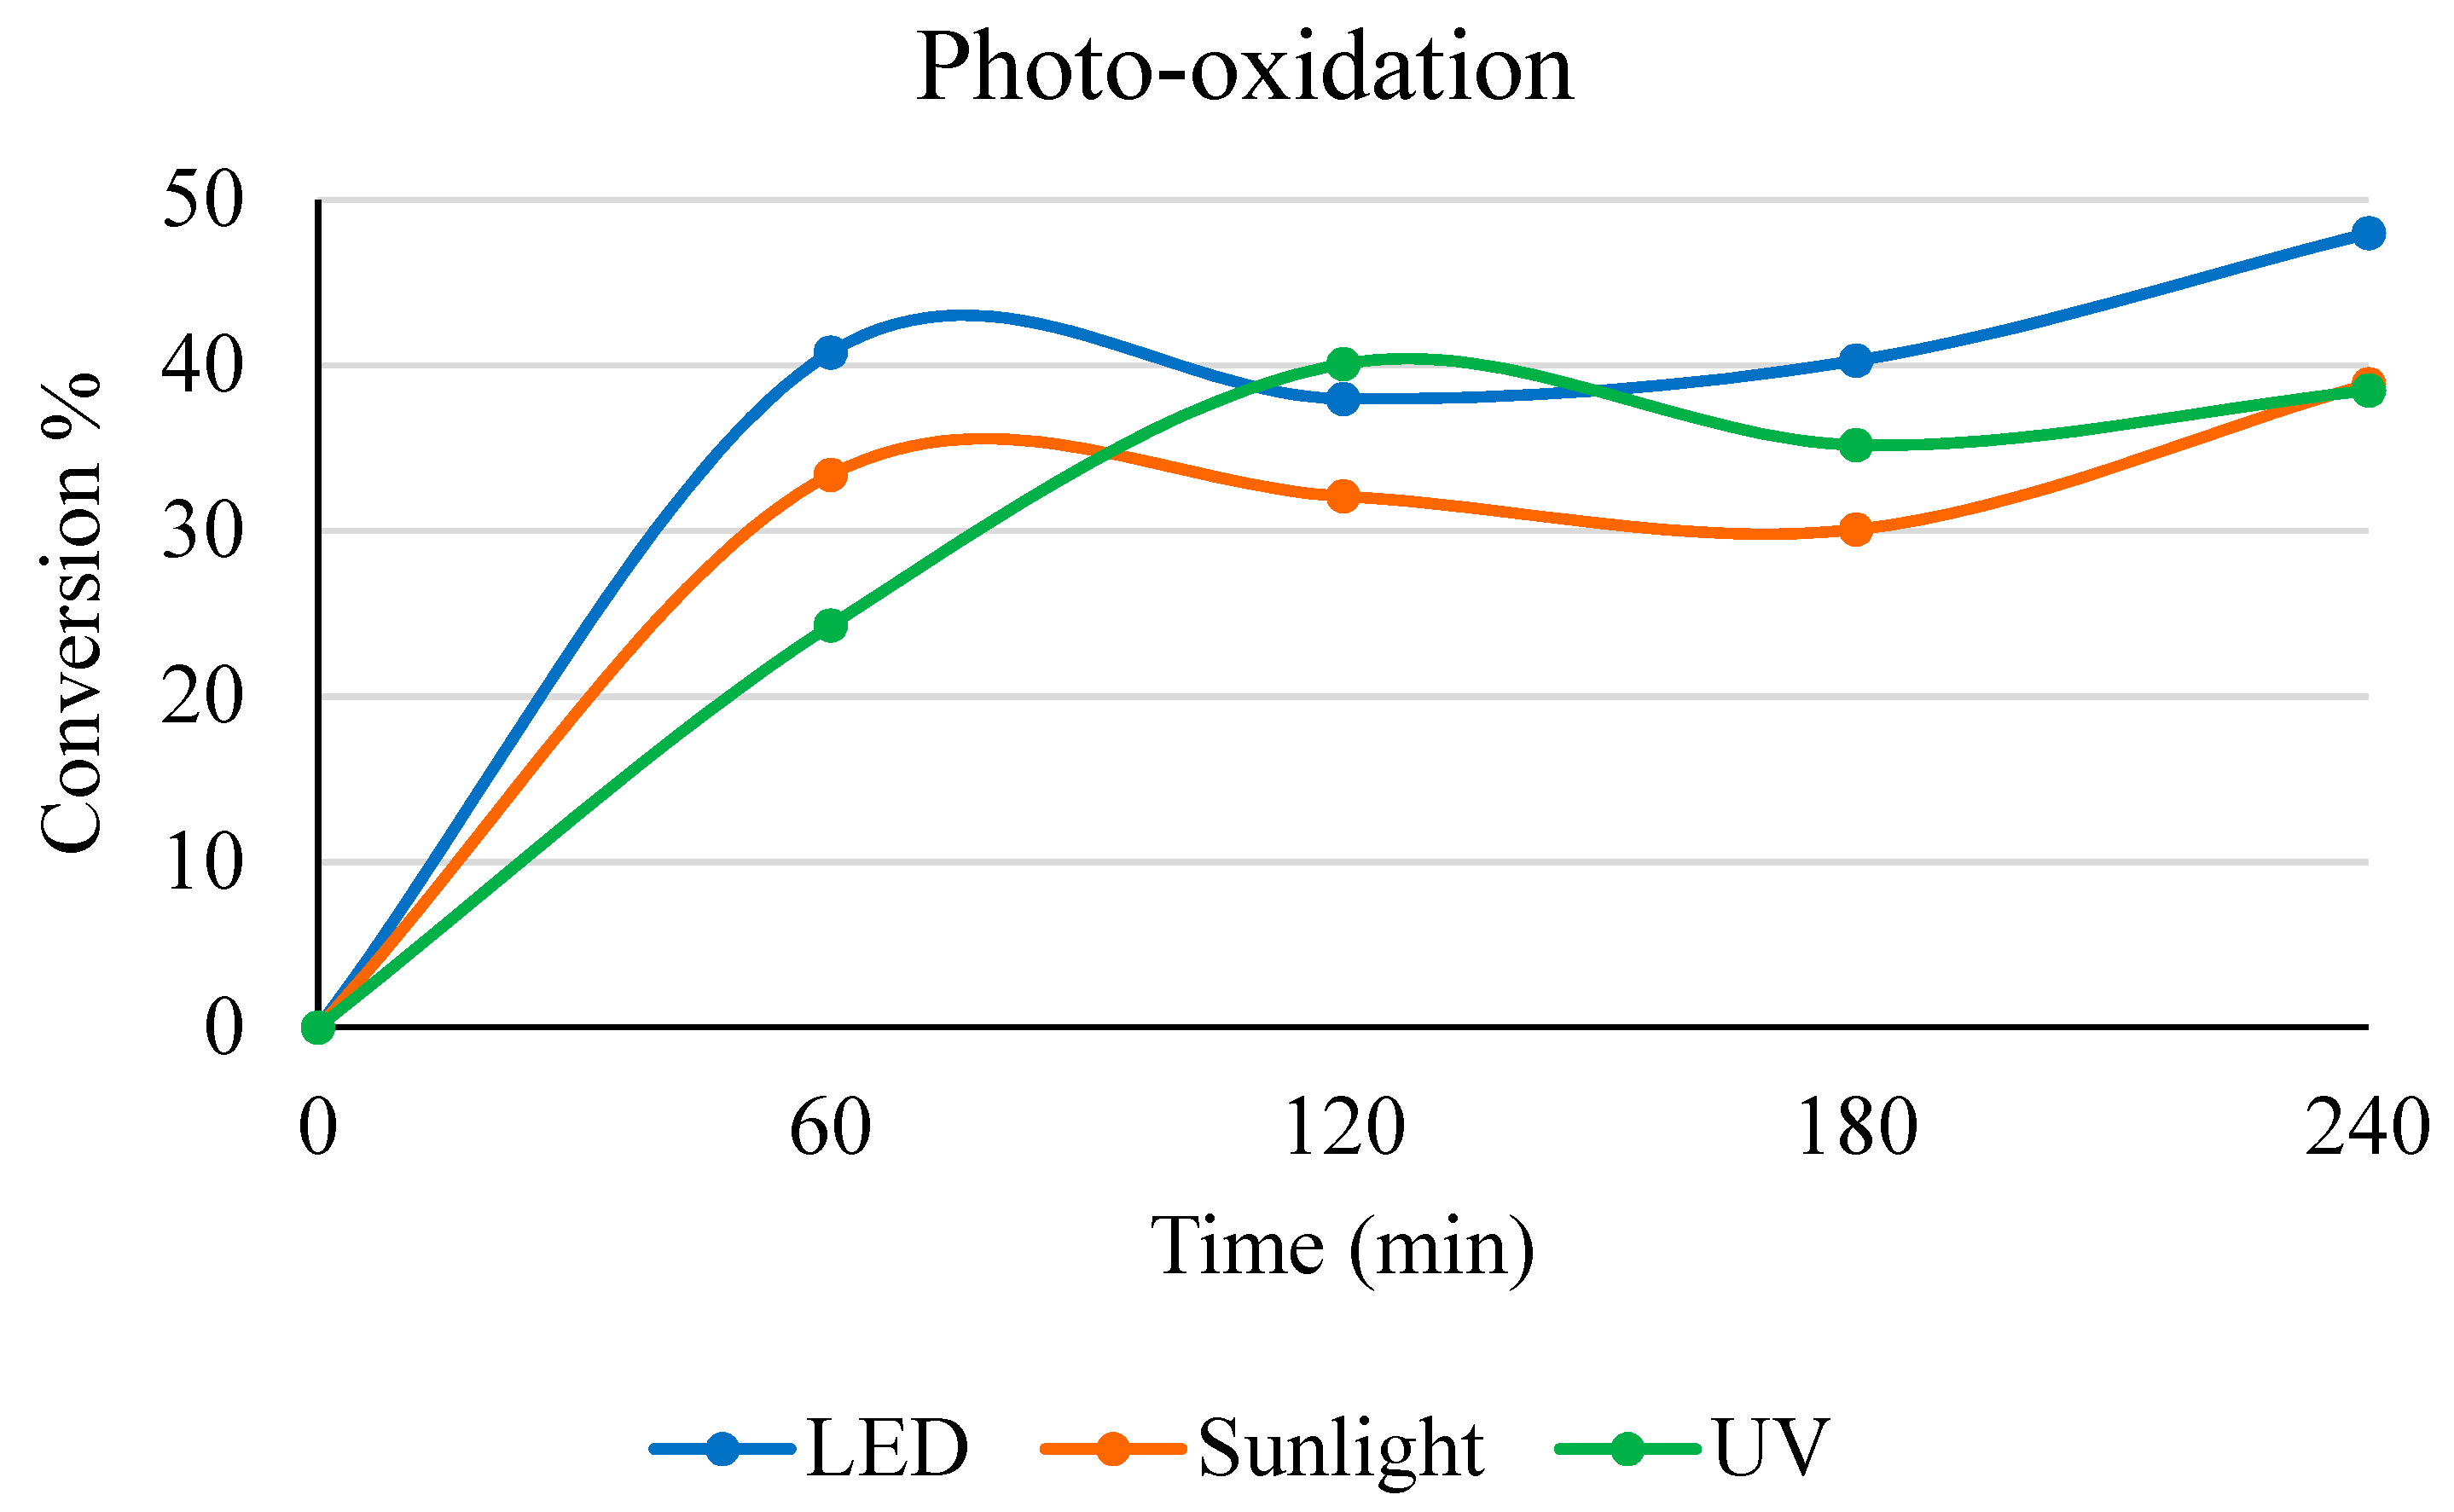
Finally, the effect of natural irradiation with sunlight was tested while keeping the same reaction conditions of the LED photo-oxidation experiments. If looking at the 0.1% Ag/FSP curve in Figure 9, it is evident that the results were very similar to the reaction under UV lamp, reaching 35–40% conversion after 4 h.

2.5. Light Source Comparison

A final assessment could be done through comparison of all the light sources employed during this work. Figure 9 illustrates for the Ag-loaded sample that the photo-oxidation led to higher conversion of the ammonium when the reactor was equipped with the LED lamp, ca. 48%, with quite close results (40% max conversion) using UV irradiation, though the reaction rate seemed to be slower in the early stages of the treatment. On the other hand, when sunlight was used to perform the reaction, the conversion dropped to 38.5%, which, however, suffered due to the strong variability of the weather conditions and the mean irradiance, which was retrieved from weather data and resulted in 600 W/m2. Nevertheless, this was a very promising result regarding the possibility of exploiting direct sunlight for the removal of this pollutant from water.
Some actinometric measurements were performed to compare the irradiance of the different light sources and understand the reasons for the different performances of the visible LED vs. UV sources. The results unveiled that the power emitted by the LED lamp and absorbed by the solution over six minutes of irradiation was on average 0.93 W, with a power density of 46 W/m2 when considering the internal area of the reactor. Our UV lamp, in the same setup, could deliver nearly 25 W/m2 [33]; therefore, it was much less efficient in transmitting the energy, although the consumed power was 125 W for the UV lamp vs. 30 W for the LED one.
Therefore, when using UV light, simpler titania unpromoted catalysts perform better. Under white light, co-catalysts are needed to ensure a reasonable conversion, but the process is anyway feasible and more convenient due to higher light absorption efficiency. Sunlight irradiation is also feasible and effective, provided it is possible to cope with the hourly and daily fluctuations of the irradiance.

3. Experimental

3.1. Materials Preparation

All the chemical reagents were purchased from Sigma Aldrich − Merck Life Science S.r.l., Milan, Italy at the highest purity available and were used without further treatment.
P25 is the commercial name of the TiO2 nanoparticles supplied by Evonik (Essen, Germany) [34].
Flame spray pyrolysis titania nanoparticles (FSP) were prepared thanks to a homemade apparatus, whose details are reported elsewhere [35,36]. Briefly, the instrument was mainly composed of a burner with a central hole surrounded by several flamelets fed with methane (0.5 L/min) and oxygen (1 L/min). The precursor solution was prepared by dissolving titanium isopropoxide (pur. 97%) in a mixture of 50:50 propionic acid (pur. 97%) and o-xylene (pur. 97%) while the concentration was 0.4 M. Next, it was pumped at 2.7 mL/min through a needle fixed in the central hole, where a co-current of oxygen (5 L/min) dispersed the solution at the nozzle and created small droplets, which were rapidly vaporised and burned by the flame. The resulting powder was deposited over the wall of a glass bell which covered the burner plate. In order to obtain nanoparticles of the proper size, the pressure drop at the nozzle was set at 1.5 bar.
P25 and FSP-supported catalysts were prepared via wet impregnation (WI) [37]. The selected amount of metal precursor and titania were added to a round-bottom flask, distilled water was added, and the suspension was stirred for 2 h or until homogeneity. Next, the water was removed through heating under reduced pressure to obtain a grainy powder, which was dried in a static oven (105 °C for one night). In order to reduce the metal precursor, the powder was heated with a ramp of 5 °C/min in a tubular oven, while flowing hydrogen and the set temperature were maintained for 3 h. The detailed recipes and conditions used for each catalyst are reported in Table 2. The metal loading 0.1 mol% was selected after a preliminary investigation [28,32].

3.2. Materials Characterisation

X-ray diffraction (XRD) analyses were performed by means of a Rigaku (Neu-Isenburg, Germany) D III-MAX horizontal-scan powder diffractometer equipped with Cu-Kα radiation and a graphite monochromator on the diffracted beam. The phase composition was calculated according to the intensity ratio between the most intense peaks of both anatase and rutile [38].
N2 adsorption and desorption isotherms of catalysts were collected using a Micromeritics ASAP2020 (Norcross, GA, US) apparatus.
Diffuse reflectance (DR) UV–Vis spectra of samples were recorded with a Cary 500 UV–Vis NIR r (Varian instruments, Palo Alto, CA, US) spectrophotometer in the range of 200–800 nm. Band gap (BG) values were determined from Tauc plots obtained from DR UV–Vis spectra [39].

3.3. Instrumentation Setup and Procedures

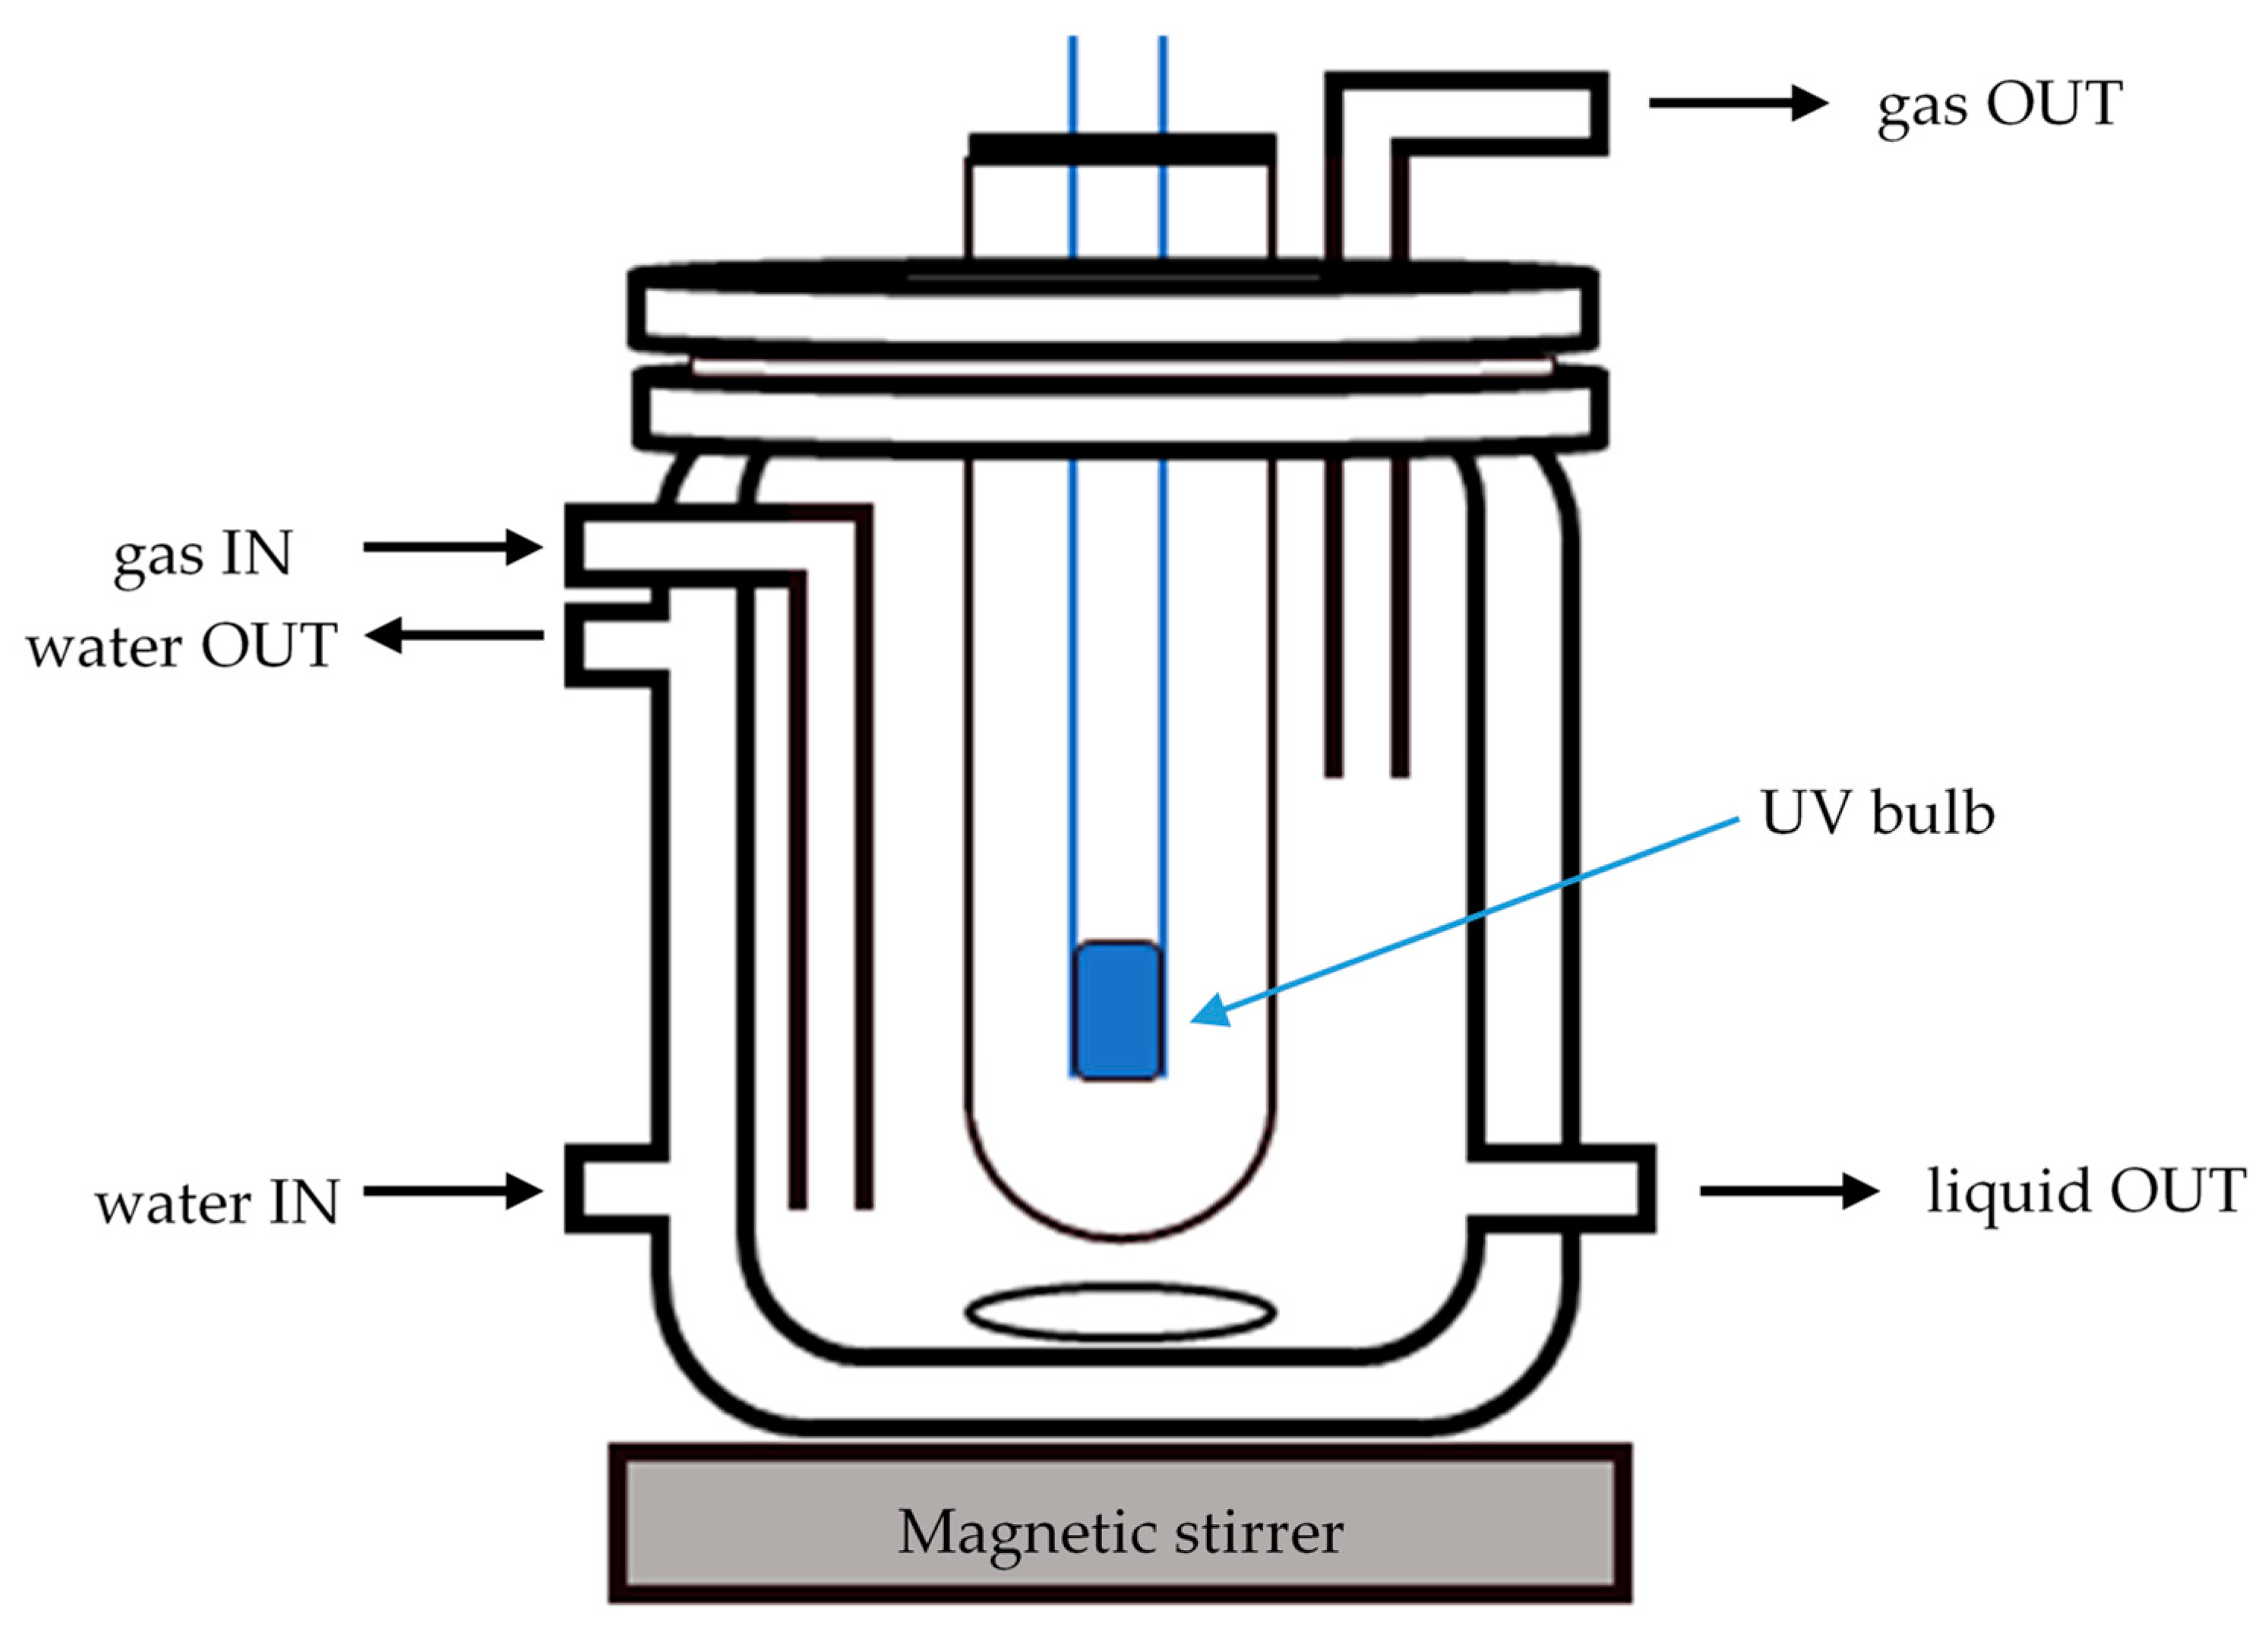
The photoreactor used in these tests was made of glass and had a cylindrical shape with a central hole that allowed the insertion of the Ultraviolet A (UVA) lamp (maximum emission 365 nm, 125 W, Jelosil HG 100 AS, Vimercate, Milan, Italy), and once inserted, the reactor capacity was about 0.35 L. The irradiance of the lamp was measured using a photo-radiometer (delta OHM HD2102,2; Jelosil, Vimercate, Milan, Italy), and it was, on average 260 W/m2. In the case of LED white light, some actinometric measurements were performed (vide infra). In addition,, the sunlight irradiance was retrieved for our city at the day and time of measurement from the Regional Agency for Environment Protection (ARPA Lombardia). The mean solar irradiance was reported as 600 W/m2. The mixing was assured by a magnetic stirrer, and the temperature was controlled by recirculating water in the cooling jacket (Figure 10).
This system could be used in a sealed configuration or open to air. In the first case, the reactor was outgassed, flowing a mixture of helium and oxygen (4:1) at a rate of 100 mL/min, which was lowered to 60 mL/min during the tests. The outgoing gas flow was analysed by means of a gas chromatograph (HP 5890, Santa Clara, CA, USA, equipped with a Porapak Q column) in order to evaluate the nitrogen production. A second setup was used with an external LED lamp (white light, Yonkers Inspire, 30 W, Yonkers, NY, USA), and the reactor was open to air, with the lamp fixed at 100 mm over the surface of the solution or with direct exposure to sunlight. In addition, this second assembly allowed blowing with synthetic air, as did the former one (He/O2).
The tests were performed by adding the selected amount of water (distilled, except when specified as testing with tap water), catalyst and NH4Cl to the reactor and when needed, adjusting the pH with diluted HCl (0.002 M) or sodium hydroxide solution (0.01 M). Different conditions were tested and are explicated in the Results and Discussion section. Furthermore, the treatment started when the lamp was switched on. Tap water was provided as such from the Milan municipality (Milan, Italy).
The activity performance was evaluated based on conversion and selectivity, calculated as:
C o n v e r s i o n   o f   a m m o n i a   ( % ) = n N H 3 0 n N H 3 n N H 3 0 × 100
S e l e c t i v i t y   t o   P r o d u c t   ( % ) = n P r o d u c t n N H 3 0 n N H 3 × 100
where n N H 3 0 represents the initial ammonium amount (mol), n N H 3 the residual ammonium amount after time t and n P r o d u c t the moles of the indicated product found after time t.
N2 is mainly reported as percentage in the gas phase because the methods to assess the selectivity in the liquid phase were not adaptable to the GC analysis of the gas phase.

3.4. Analytical Methods

In every reactor configuration, the liquid phase was sampled by means of a glass syringe, and the catalyst was removed before the analysis, using cellulose acetate filter (Sartorius Stedim, 0.2 µm). The filter size was larger than the mean primary particle size of nanometric titania, e.g., P25 and FSP [25], which was ca. 15–40 nm, depending on the synthesis conditions. However, the powder consisted of agglomerates of primary particles that were bigger than the filter size. The recovered material, collected by centrifugation after testing, had approximately the same weight loaded at the beginning of the test, indicating negligible catalyst loss during the sampling procedure. In the early stage of the research, the concentration of ammonium was analysed using the indophenol determination technique, described in detail elsewhere [40]. Briefly, the reaction between ammonia, sodium salicylate and chlorine results in an indophenol derivative, which gives a strong blue-green solution after the addition of sodium nitroprusside and sodium hydroxide. The spectrophotometric determination was performed at 690 nm, using a Perkin Elmer (Milan, Italy) Lambda 35 spectrophotometer. After the proper calibration, it was possible to calculate the initial concentration of ammonium; however, this method was applicable only in a narrow range of concentration, i.e., 0.05–2 mg/L of NH4+, and thus a two-step dilution (1:50 and then 1:40) of our sample was necessary to meet that restriction. A faster and more precise determination was obtained by means of ion exchange chromatography (Metrohm 883 Basic IC Plus, Origgio, VA, Italy, equipped with a cationic column) and using diluted nitric acid in water as the eluent (HNO3 1.7 mmol/L, dipicolinic acid 0.7 mmol/L). Moreover, nitrite and nitrate were determined with the same IC equipment, using an anionic column with a solution of Na2CO3 (3.2 mmol/L) and NaHCO3 (1 mmol/L) as eluents. In this latter case, the background noise was minimised by connecting a chemical suppressor before the column.
The error upon UV analysis of NH3/NH4+ was <5%, while the IC analysis resulted in <1.5%. Two replicates of each analysis were typically carried out, calculating the average result, except for outliers, where additional measurements were added for consistency (for instance, at very low analyte concentrations).
The N2 formed during testing was measured within the experimental sensibility using an HP 5890 Gas Chromatograph GC. The gas collected in the head of the reactor was conveyed to the GC sampling loop by the synthetic air flow passing through the reacting mixture. Because the two sampling and analysis methods applied for the liquid and gas phases were not the same (i.e., a given static volume of liquid vs. a flowing gas flowrate), the N2 amount was not expressed as selectivity, but as N2 vol% in the gas phase flowing through the headspace of the reactor. This prevented a rigorous computation of the N balance but allowed a qualitative inspection of the products’ distribution as a function of the operating parameters.
Actinometric measurements were performed according to the literature [41]. A calibration curve was obtained through several dilutions of iron sulphate-buffered solution and by measuring the absorbance at 510 nm after the addition of o-phenanthroline.

4. Conclusions

The photo-abatement of ammonium was successfully performed using titania-based photocatalysts. It was observed that in the very first hours of treatment under UV irradiation, the conversion of ammonium peaked at a certain value, depending on the catalysts employed and the reaction conditions, and then it dropped and rose again, finally reaching a plateau after 24 h of reaction. This was attributed to ammonia overoxidation to NO3 and NO2, which were then reversibly reduced back to ammonia. This reverse over-reduction is possible under UV irradiation, while under white light it is slower. Therefore, when using white light, the conversion reaches a plateau just after saturation of the surface sites. The conversion increases again after conversion of some of the adsorbed species to N2, which is then release from the surface freeing the active sites.
The continuous supply of oxygen did not boost the reaction due to the competition of oxygen for holes and electrons. Moreover, the selectivity toward overoxidised product was minimised by working at a slightly acidic pH.
The addition of a metallic co-catalyst did not significantly improve performance under UV light when compared with bare FSP titania, but it allowed the adsorption of longer wavelengths, revealing the key for its application under visible light irradiation. Indeed, very good performances were achieved when simulating natural light through a white light LED lamp, as a 48% max conversion of ammonium was achieved using optimised conditions and either 0.1% Ag or 0.1% Au/FSP catalysts. When ammonium was dissolved into a more realistic matrix, i.e., tap water, the conversion was almost halved but remained significant for both the catalysts.
Finally, this setup was found to be effective even in exploiting natural sunlight (conversion ca. 38.5%), though this may vary significantly during tests and between days.

Author Contributions

Conceptualization, I.R. and G.R.; methodology, V.P. and F.C.; formal analysis, A.T.; investigation, V.P.; resources, I.R.; data curation, A.T.; writing—original draft preparation, F.C.; writing—review and editing, I.R. and G.R.; supervision, I.R.; project administration, I.R.; funding acquisition, I.R. and G.R. All authors have read and agreed to the published version of the manuscript.

Funding

This research was funded by Fondazione Cariplo, grant number 2015-0186.

Data Availability Statement

All the data relative to this research are reported in this manuscript.

Conflicts of Interest

The authors declare no conflict of interest.

References

  1. Roser, M.; Ritchie, H.; Ortiz-Ospina, E. World Population Growth. 2020. Available online: https://ourworldindata.org/world-population-growth (accessed on 15 May 2021).
  2. Galloway, J.N.; Cowling, E.B. Reactive nitrogen and the world: 200 Years of change. Ambio R. Swed. Acad. Sci. 2002, 31, 64–71. [Google Scholar] [CrossRef]
  3. Rockström, J.; Steffen, W.; Noone, K.; Persson, Å.; Chapin, F.S.; Lambin, E.F.; Lenton, T.M.; Scheffer, M.; Folke, C.; Schellnhuber, H.J.; et al. A safe operation space for humanity. Nature 2009, 461, 472–475. [Google Scholar] [CrossRef] [PubMed]
  4. Fageria, N.K. The Use of Nutrients in Crop Plants; Taylor & Francis Group: Boca Raton, FL, USA, 2016. [Google Scholar] [CrossRef]
  5. Goebes, M.D.; Strader, R.; Davidson, C. An ammonia emission inventory for fertilizer application in the United States. Atmos. Environ. 2003, 37, 2539–2550. [Google Scholar] [CrossRef]
  6. Shepherd, M.F.; Barzetti, S.; Hastie, D.R. The production of atmospheric NOx and N2O from a fertilized agricultural soil. Atmos. Environ. Part A Gen. Top. 1991, 25, 1961–1969. [Google Scholar] [CrossRef]
  7. Driscoll, C.T.; Whithall, D.; Aber, J.D.; Boyer, E.; Castro, M.; Cronon, C.; Goodale, C.L.; Groffman, P.M.; Hopkinson, C.; Lambert, K.F.; et al. Nitrogen Pollution: Source and Consequences in the U. S. Northeast. Environment 2003, 45, 22. [Google Scholar]
  8. Chislock, M.; Doster, E. Eutrophication: Causes, Consequences, and Controls in Aquatic Ecosystems. Nat. Educ. Knowl. 2013, 4, 10. [Google Scholar]
  9. Camargo, J.A.; Alonso, A.; Salamanca, A. Nitrate toxicity to aquatic animals: A review with new data for freshwater invertebrates. Chemosphere 2005, 58, 1255–1267. [Google Scholar] [CrossRef]
  10. Herschy, R.W. Water Quality for Drinking: WHO Guidelines; World Health Organization: Geneva, Switzerland, 2012. [Google Scholar] [CrossRef]
  11. Volkmer, B.G.; Ernst, B.; Simon, J.; Kuefer, R.; Bartsch, G.; Bach, D.; Gschwend, J.E. Influence of nitrate levels in drinking water on urological malignancies: A community-based cohort study. BJU Int. 2005, 95, 972–976. [Google Scholar] [CrossRef] [PubMed]
  12. Pyatt, F.B. Potential effects on human health of an ammonia rich atmospheric environment in an archaeologically important cave in southeast Asia. Occup. Environ. Med. 2003, 60, 986–988. [Google Scholar] [CrossRef] [Green Version]
  13. Mohseni-Bandpi, A.; Elliott, D.J.; Zazouli, M.A. Biological nitrate removal processes from drinking water supply—A review. J. Environ. Health Sci. Eng. 2013, 11, 1–11. [Google Scholar] [CrossRef]
  14. John, G.T.; Crittenden, C.; Trussell, R.R.; Hand, D.W.; Howe, K.J. MWH’s Water Treatment: Principles and Design, 3rd ed.; John Wiley & Sons: Hoboken, NJ, USA, 2012. [Google Scholar]
  15. Nur, T.; Shim, W.G.; Loganathan, P.; Vigneswaran, S.; Kandasamy, J. Nitrate removal using Purolite A520E ion exchange resin: Batch and fixed-bed column adsorption modelling. Int. J. Environ. Sci. Technol. 2015, 12, 1311–1320. [Google Scholar] [CrossRef]
  16. Ferro, S.; Australia, E. Removal of nitrates from highly-contaminated industrial wastewater Sustainable Environmental Technology for Chemical and Allied industries (SETCA) View project Innovative Technologies for the Remediation of Soils and Waters View project. La Chim. E L’Industria 2012, 94, 100–110. [Google Scholar]
  17. Ren, H.T.; Liang, Y.; Han, X.; Liu, Y.; Wu, S.H.; Bai, H.; Jia, S.Y. Photocatalytic oxidation of aqueous ammonia by Ag2O/TiO2 (P25): New insights into selectivity and contributions of different oxidative species. Appl. Surf. Sci. 2020, 504, 144433. [Google Scholar] [CrossRef]
  18. Pollema, C.H.; Milosavljevic’, E.B.; Hendrix, J.L.; Solujic’, L.; Nelson, J.H. Photocatalytic oxidation of aqueous ammonia (ammonium ion) to nitrite or nitrate at TiO2 particles. Mon. Chem. Chem. Mon. 1992, 123, 333–339. [Google Scholar] [CrossRef]
  19. Bravo, A.; Garcia, J.; Domenech, X.; Peral, J. Some aspects of the photocatalytic oxidation ofammoniumion by titanium dioxide. J. Chem. Res. 1993, 9, 376–377. [Google Scholar]
  20. Huang, L.; Li, L.; Dong, W.; Liu, Y.; Hou, H. Removal of ammonia by OH radical in aqueous phase. Environ. Sci. Technol. 2008, 42, 8070–8075. [Google Scholar] [CrossRef] [PubMed]
  21. Wang, A.; Edwards, J.G.; Davies, J.A. Photooxidation of aqueous ammonia with titania-based heterogeneous catalysts. Sol. Energy 1994, 52, 459–466. [Google Scholar] [CrossRef]
  22. Ni, M.; Leung, M.K.H.; Leung, D.Y.C.; Sumathy, K. A review and recent developments in photocatalytic water-splitting using TiO2 for hydrogen production. Renew. Sustain. Energy Rev. 2007, 11, 401–425. [Google Scholar] [CrossRef]
  23. Sá, J.; Agüera, C.A.; Gross, S.; Anderson, J.A. Photocatalytic nitrate reduction over metal modified TiO2. Appl. Catal. B Environ. 2009, 85, 192–200. [Google Scholar] [CrossRef]
  24. Thamaphat, K.; Limsuwan, P.; Ngotawornchai, B. Phase Characterization of TiO2 Powder by XRD and TEM. Nat. Sci. 2008, 42, 357–361. [Google Scholar]
  25. Bahadori, E.; Rapf, M.; Di Michele, A.; Rossetti, I. Photochemical vs. photocatalytic azo-dye removal in a pilot free-surface reactor: Is the catalyst effective? Sep. Purif. Technol. 2020, 237, 116320. [Google Scholar] [CrossRef]
  26. Rossetti, I.; Compagnoni, M.; Ramis, G.; Freyria, F.; Armandi, M.; Bonelli, B. Development of unconventional photocatalytic reactors and processes for the abatement of harmful N-containing pollutants. Chem. Eng. Trans. 2017, 57, 1663. [Google Scholar] [CrossRef]
  27. Bahadori, E.; Tripodi, A.; Ramis, G.; Rossetti, I. Semi-Batch Photocatalytic Reduction of Nitrates: Role of Process Conditions and Co-Catalysts. ChemCatChem 2019, 11, 4642–4652. [Google Scholar] [CrossRef]
  28. Bahadori, E.; Conte, F.; Tripodi, A.; Ramis, G.; Rossetti, I. Photocatalytic selective oxidation of ammonia in a semi-batch reactor: Unravelling the effect of reaction conditions and metal co-catalysts. Catalysts 2021, 11, 209. [Google Scholar] [CrossRef]
  29. Zeng, M. Influence of TiO2 surface properties on water pollution treatment and photocatalytic activity. Bull. Korean Chem. Soc. 2013, 34, 953–956. [Google Scholar] [CrossRef] [Green Version]
  30. Nemoto, J.; Gokan, N.; Ueno, H.; Kaneko, M. Photodecomposition of ammonia to dinitrogen and dihydrogen on platinized TiO2 nanoparticules in an aqueous solution. J. Photochem. Photobiol. A Chem. 2007, 185, 295–300. [Google Scholar] [CrossRef]
  31. Shibuya, S.; Aoki, S.; Sekine, Y.; Mikami, I. Influence of oxygen addition on photocatalytic oxidation of aqueous ammonia over platinum-loaded TiO2. Appl. Catal. B Environ 2013, 138--139, 294–298. [Google Scholar] [CrossRef]
  32. Bahadori, E.; Compagnoni, M.; Tripodi, A.; Freyria, F.; Armandi, M.; Bonelli, B.; Ramis, G.; Rossetti, I. Photoreduction of nitrates from waste and drinking water. Mater. Today Proc. 2018, 5, 17404–17413. [Google Scholar] [CrossRef]
  33. Atchard, C.G.H. A new sensitive chemical actinometer—II. Potassium ferrioxalate as a standard chemical actinometer. Proc. R. Soc. Lond. Ser. A Math. Phys. Sci. 1956, 235, 518–536. [Google Scholar] [CrossRef]
  34. P25—EVONIK. Available online: https://corporate.evonik.com/en/products/search-products/pages/product-details.aspx?productId=43469 (accessed on 15 May 2021).
  35. Chiarello, G.L.; Rossetti, I.; Forni, L. Flame-spray pyrolysis preparation of perovskites for methane catalytic combustion. J. Catal. 2005, 236, 251–261. [Google Scholar] [CrossRef]
  36. Compagnoni, M.; Lasso, J.; Di Michele, A.I.; Rossetti, I. Flame-pyrolysis-prepared catalysts for the steam reforming of ethanol. Catal. Sci. Technol. 2016, 6, 6247–6256. [Google Scholar] [CrossRef]
  37. Bahadori, E.; Tripodi, A.; Villa, A.; Pirola, C.; Prati, L.; Ramis, G.; Dimitratos, N.; Wang, D.; Rossetti, I. High pressure CO2 photoreduction using Au/TiO2: Unravelling the effect of co-catalysts and of titania polymorphs. Catal. Sci. Technol. 2019, 9, 2253–2265. [Google Scholar] [CrossRef]
  38. Spurr, R.A.; Myers, H. Quantitative Analysis of Anatase-Rutile Mixtures with an X-ray Diffractometer. Anal. Chem. 1957, 29, 760–762. [Google Scholar] [CrossRef]
  39. Morales, A.E.; Mora, E.S.; Pal, U. Use of diffuse reflectance spectroscopy for optical characterization of un-supported nanostructures. Rev. Mex. Física 2007, 53, 18–22. [Google Scholar]
  40. Verdouw, H.; Van Echteld, C.J.A.; Dekkers, E.M.J. Ammonia determination based on indophenol formation with sodium salicylate. Water Res. 1978, 12, 399–402. [Google Scholar] [CrossRef]
  41. Aillet, T.; Loubiere, K.; Dechy-Cabaret, O.; Prat, L. Accurate measurement of the photon flux received inside two continuous flow microphotoreactors by actinometry. Int. J. Chem. React. Eng. 2014, 12, 1–13. [Google Scholar] [CrossRef] [Green Version]
Figure 1. Nitrogen adsorption–desorption isotherms of selected photocatalysts: (a) FSP-based samples; (b) P25-based samples.
Catalysts 11 00975 g001
Figure 2. XRD spectra of selected photocatalysts, where “A” and “R” are, respectively, the reflections of the anatase and rutile forms.
Catalysts 11 00975 g002
Figure 3. Activity tests under UV lamp irradiation of (a) bare FSP and metal-promoted photo-catalysts at pH 5, (b) 0.1% Pt/FSP at pH 5 for 24 h, (c) 0.1% Pt/FSP at pH 11.5 for 24 h. Testing at room temperature (r.t.), 60 mL/min, 4:1 (vol/vol) He:O2 flow, 1 g/L of catalyst, 0.2 mol/L of NH4+ and 250 mL of solution. Conv. NH3%: ammonium conversion; Sel.%: selectivity to the given product; % N2: N2 percentage in the gas phase.
Catalysts 11 00975 g003
Figure 4. (a) Comparisons between the reaction performed with UV or LED lamps and with a 0.2 mol NH4+/g catalyst ratio, 0.1% Ag/FSP, pH 5, r.t. and 250 mL of solution. UV lamp irradiance was equal to 260 W/m2. (b) Comparison of selected photocatalysts under LED visible light irradiation.
Catalysts 11 00975 g004
Figure 5. Photo-oxidation of NH4+ at various substrate/catalyst ratios (0.01–0.2 mol/g under LED lamp irradiation, using 0.01 mol of NH4Cl, 0.1%Ag/FSP as a photocatalyst in different amounts), pH 5, r.t. and 250 mL of solution.
Catalysts 11 00975 g005
Figure 6. Photo-oxidation of NH4+ at various concentrations of ammonium (0.0025–0.2 M) under LED lamp irradiation, using 0.1% Ag/FSP as a photocatalyst with fixed 0.2 mol NH4+/g cat, pH 5, r.t. and 250 mL of solution.
Catalysts 11 00975 g006
Figure 7. Photo-oxidation of NH4 with various metal-promoted catalysts under LED lamp irradiation using 0.01 mol of NH4Cl, 0.2 g of photocatalyst, pH 5, r.t. and 250 mL of solution.
Catalysts 11 00975 g007
Figure 8. Photo-oxidation of NH4 in tap water with 0.1% Ag and 0.1% Au/FSP catalyst under LED lamp irradiation using 0.01 mol of NH4Cl, 0.2 g of photocatalyst, pH 5, r.t. and 250 mL of solution.
Catalysts 11 00975 g008
Figure 9. Photo-oxidation of NH4+ with a 0.1% Ag/FSP catalyst under sunlight, UV and visible LED irradiation using 0.01 mol of NH4Cl, 0.2 g of photocatalyst, 40 mL/min of air flow, pH 5, r.t. and 250 mL of solution.
Catalysts 11 00975 g009
Figure 10. Simplified scheme of the reactor in the sealed configuration.
Catalysts 11 00975 g010
Table 1. Results of the catalysts characterisation.
SampleP250.1% Pt/P25FSP0.1% Ag/FSP0.1% Pd/FSP0.1% Pt/FSP
Phase %A(78) + R(22)A(87) + R(13)A(65) + R(35)A(70) + R(30)A(53) + R(47)A(64) + R(36)
BET Surface Area (m2/g)455567725760
Crystallite Size (nm)152123301826
Total Pore Volume (cm3/g)0.110.320.140.360.210.25
t-plot Micropore Volume (cm3/g)0.0120.00360.020.000440.00030.0037
BJH Adsorption Pore Width (nm)222320171519
Band Gap (eV)3.413.123.313.243.133.11
Table 2. Details for preparation of each catalyst through wet impregnation. Acac: acetylacetonate.
PrecursorMetal Loading (%mol)Titania SourceReduction T (°C)Colour
AgNO3 (pur. > 99%)0.1FSP150Gry-Brown
AuCl3 (pur. > 99%)0.1FSP700Light Purple
Pd(NO3)2·2H2O0.1FSP300Grey
Pt(acac)2 (pur. > 97%)0.1FSP700Grey
Pt(acac)2 (pur. > 97%)0.1P25700Grey
Cu(ac)2 (pur. 98%) + Pt(acac)2 (pur > 97%)0.1 Cu + 0.1 PtP25700White
Publisher’s Note: MDPI stays neutral with regard to jurisdictional claims in published maps and institutional affiliations.