Abstract
The catalytic activity of cobalt and iron nanoparticles for the growth of carbon nanotubes (CNTs) was studied by a specific reproducible and up-scalable fabrication method. Co and Fe catalysts were deposited over SiO2 nanoparticles by a wet-impregnation method and two different annealing steps were applied for the catalyst formation/activation. The samples were calcined at an optimal temperature of 450 °C resulting in the formation of metal oxide nano-islands without the detection of silicates. Further reduction treatment (700 °C) under H2 successfully converted oxide nanoparticles to Co and Fe metallic species. Furthermore, the catalytic efficiency of both supported-metal nanoparticles at 2 and 5% in weight of silica was evaluated through the growth of CNTs. The CNT structure, morphology and size dispersion were tailored according to the metal catalyst concentration.
1. Introduction
Supported metal catalysts have been extensively used in a broad range of applications using gas-solid of liquid-solid reactions such as in the energy or biomass conversion [1]. Different applications may benefit these catalytic activities such as the hydrodesulfurization [2], the reforming reactions [3] and the hydrogenation/dehydrogenation [4,5], where the catalytic efficiency will be critically affected by the catalyst characteristics i.e., composition and phase [6,7], particle size [8], metal-support interaction [9]. Supported metal catalysts, when controlled to a nanometre-size, can be applied to the growth of CNTs by catalytic chemical vapor deposition (CCVD) [10]. CNTs can exhibit different intrinsic properties such as electrical conductivity [11], mechanical properties [12,13], or high specific surface [14], among others. For the growth of CNTs with the desired properties, the selection of the right catalyst is of fundamental importance. Transition metals are widely used as a catalyst for the CNT growth [15]. This group of metals presents a specific electronic structure, where the increase of unfilled d-orbitals enhances the bonding with carbon. For instance, Au or Pd (fully filled d-orbitals) present a low affinity with carbon, while elements with vacant d-orbitals such as Ti and Nb tend to form carbides (strong bond) [16]. For this reason, Fe and Co stand out as commonly used metal catalyst for CNT growth relying on their high solubility of carbon as well the high diffusion rate of carbon in these elements [17].
The catalyst behaviour may also change depending on the substrate used for the deposition. Commonly used substrates for CNT growth include quartz [18], alumina [19], aluminosilicates [20], silicon [21], silica, etc. Among the catalytic supports, silica has attractive features such as: active surface (presence of silanols) [22], good dispersion and distribution of metal catalyst (porosity related) [23], high chemical inertness [23] and low cost [24], revealing itself an interesting support for catalyst particles.
Many methods describe the preparation of metal supported catalysts such as deposition-precipitation [25], reductive deposition [26], colloidal synthesis [27] and wet impregnation. The wet impregnation approach appears to be an attractive technique for the deposition of Fe [28] or Co [29] nanocatalysts over SiO2 substrates due to its simplicity, low costs and efficiency on spreading metal particles over high surface area substrates [30]. During wet impregnation, Fe (III) and Co (II) acetylacetonates interact with the OH-sites from the silica substrate through the ligand exchange mechanism. The chemisorption is possible due to the decomposition of the metal acetylacetonate structure in two stages: the elimination of at least one acetylacetonate (H+ + acac−) at low temperature followed by the decomposition of the remaining (acac)− at higher temperature during annealing [31]. The annealing is essential for the catalytic activity once it defines the nanoparticles’ size and phase composition as well as their distribution over the support. Therefore, in the field of carbon-based nanostructures, different sizes of particles actually generate CNTs with distinct diameter/structures, once the growth is dictated by the particle initial size and its deformation during the process [32]. During the CCVD reaction, carbon species, decomposed at high temperature (500–900 °C) from hydrocarbons, are dissolved in the metal catalyst and, after achieving supersaturation, precipitate in the form of a carbon cylinder [33]. Because of this growth mechanism, a direct relation between CNT and catalyst diameter is established. For instance, Cheung et al. [34] reported the formation of CNTs with diameter of 3, 7 and 12 nm from particles with average diameter of 3, 9 and 13 nm, respectively. The same author mentions the formation of mainly single-walled carbon nanotubes (SWCNTs) from the smallest particles, while larger catalysts tend to form thin multi-walled carbon nanotubes (MWCNT) [34].
Being able to control the metal catalyst deposition over silica nanoparticles and its evolution during the annealing steps is fundamental to enabling controlled and tuneable CNT growth. For this purpose, much research efforts are still necessary to clearly correlate the catalyst properties to the obtained CNTs. Furthermore, many works show that the metals used as catalysts have different behaviour, influencing the CNT properties [35,36], but there is still a lack of experimental results to draw satisfying conclusions.
In this regard, this paper aims at contributing to a better understanding of the relation between catalyst and CNTs by comparing SiO2-supported cobalt and iron nanoislands produced following identical experimental conditions. In addition, it reports a detailed investigation of the calcination and the reduction parameter on the structure and morphology (size and shape) as well as the chemical composition, the oxidation state and the density of the nanoislands. Moreover, Co and Fe nanocatalyst with different sizes were finally obtained and tested in their catalytic performance enabling the selective growth of both SWCNTs and MWCNTs bundles by catalytic chemical vapor deposition (CCVD).
2. Results
2.1. Impregnation Optimisation
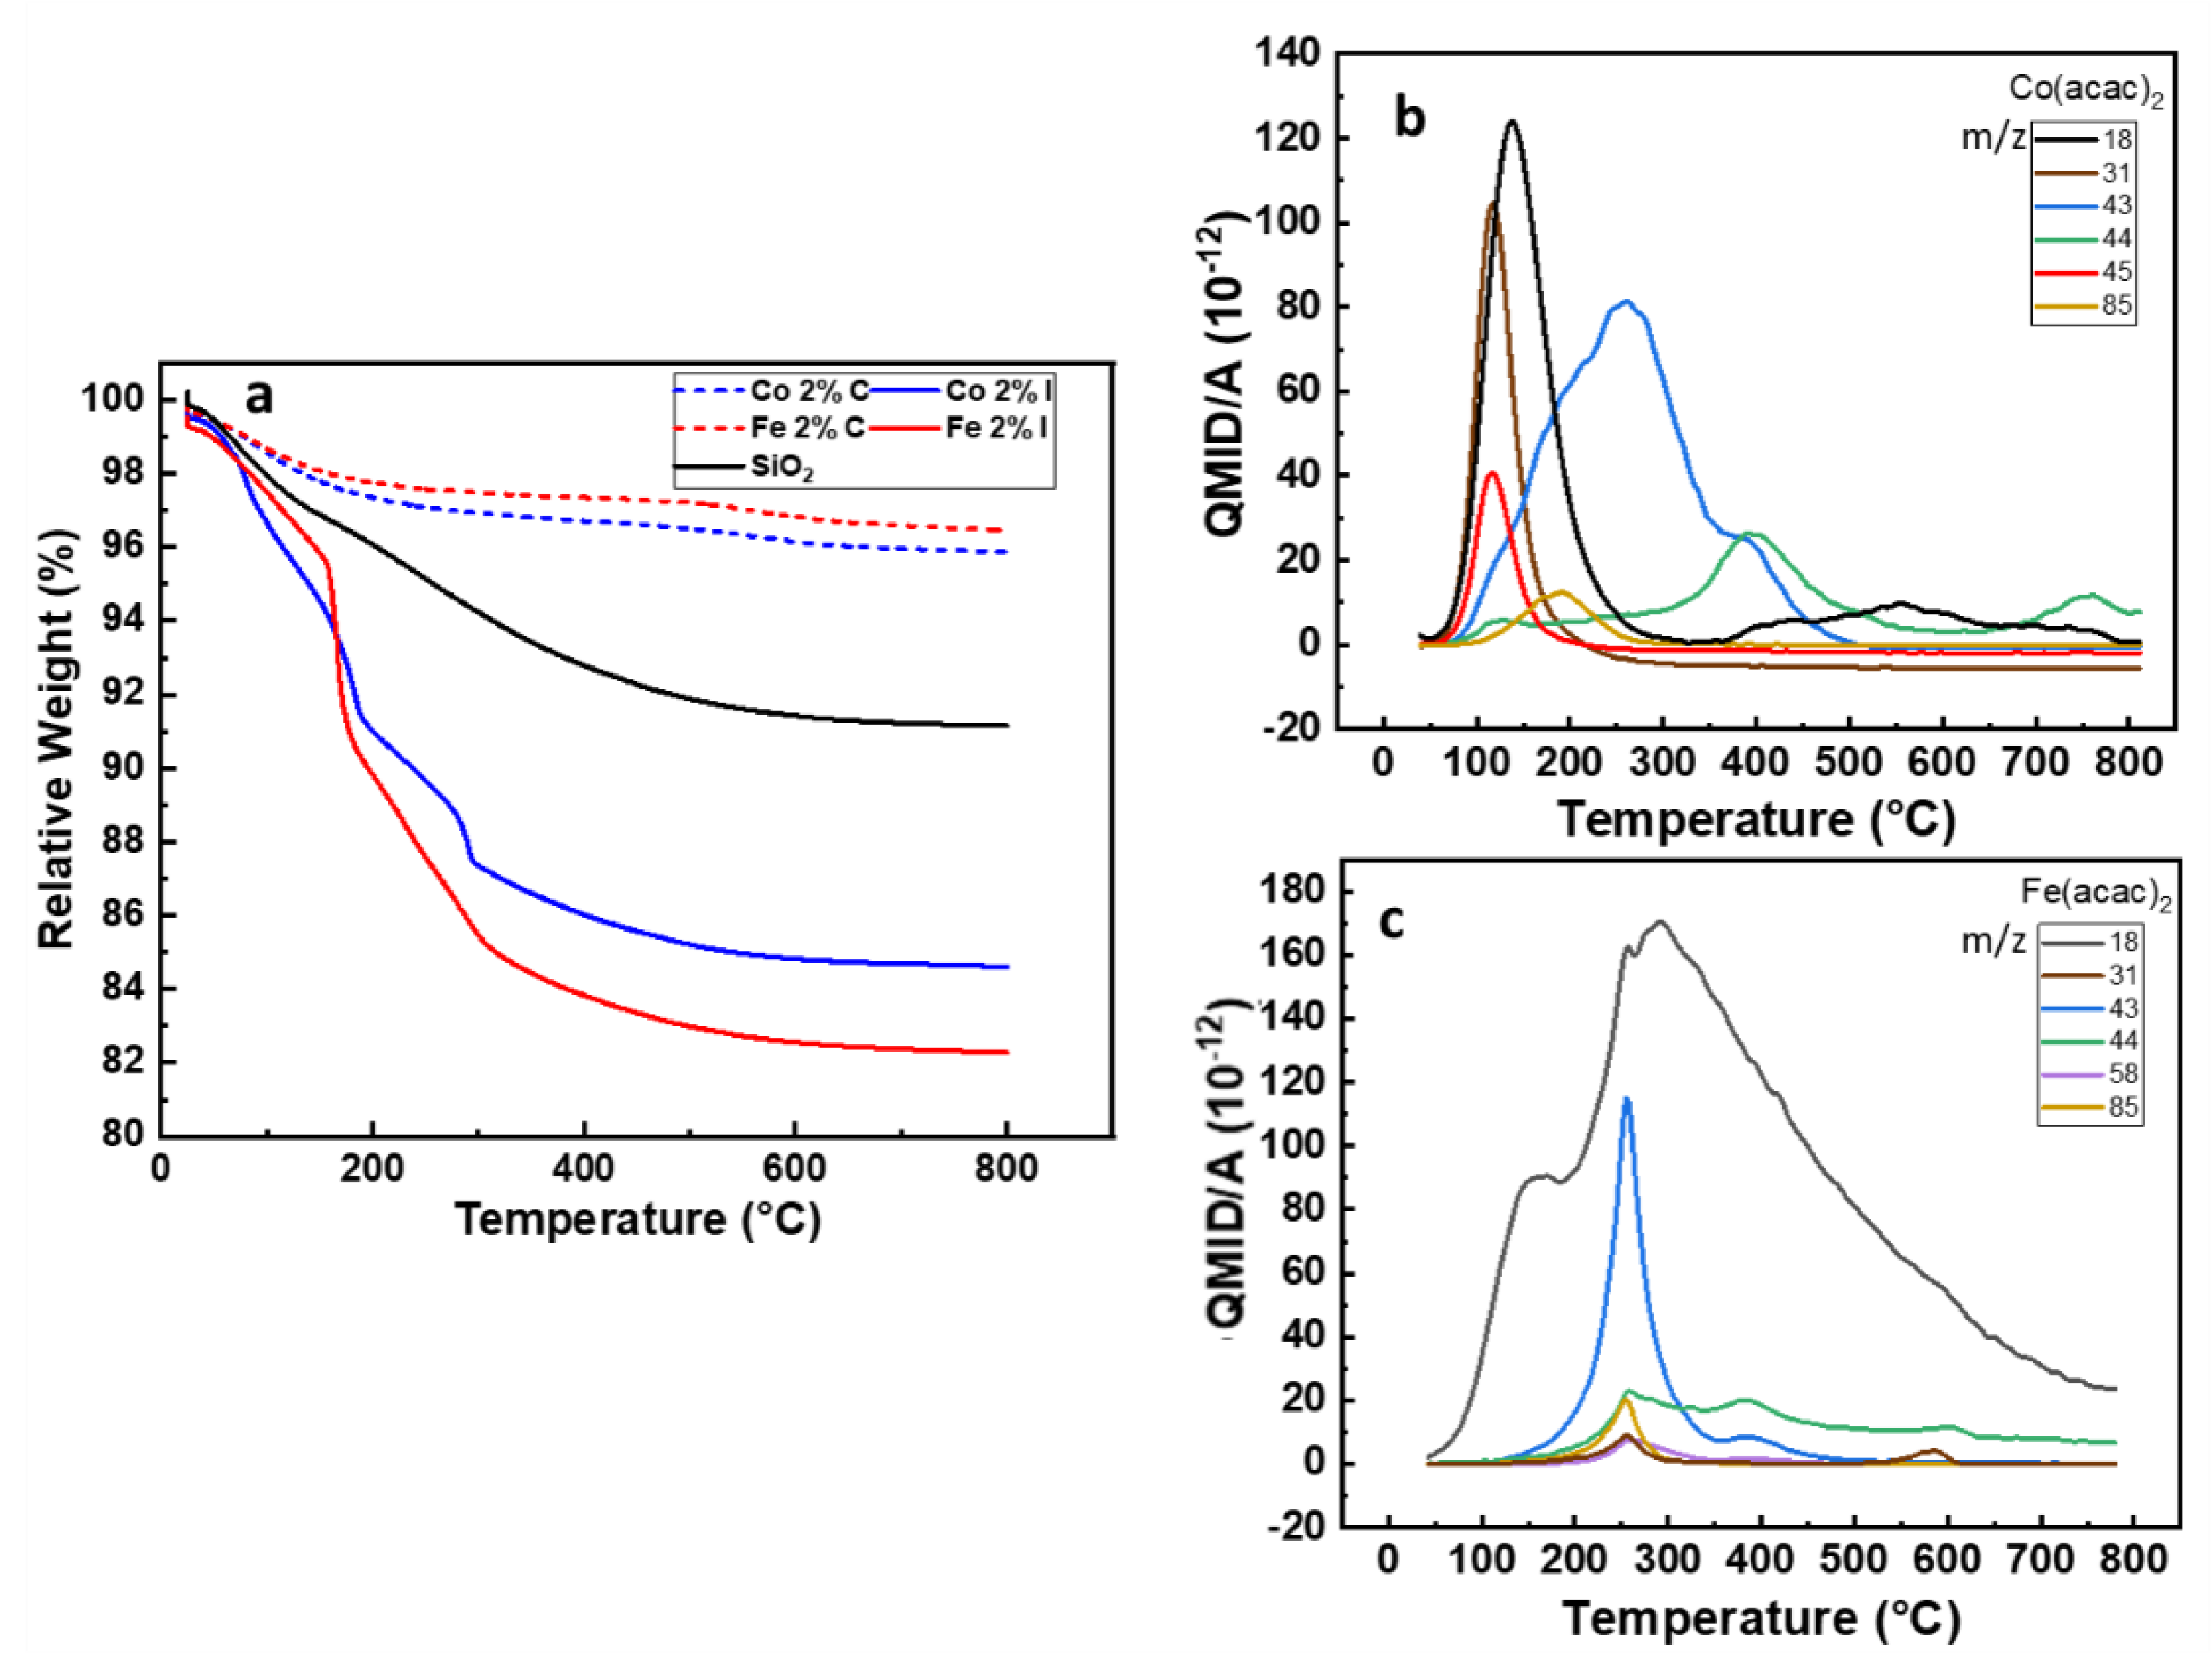
Organometallic coordination compounds are intensively used for the synthesis of metal nanoparticles either free standing or supported. The range of temperatures and/or pressures is driving the decomposition of the precursor as the strength of interaction between the metal ion and the ligands is modified [37]. As a consequence, the thermal decomposition of organometallic precursors used for the wet impregnation of SiO2 is a critical step to maximise the chemisorption/physisorption on 3D supports [38]. One of the main challenges was to ensure the complete desorption of the acetylacetonate molecule together with the formation of a covalent bond between the support and the precursor during the calcination step. To monitor the samples weight loss, the thermogravimetric analyses (TGA) were performed from room temperature to 800 °C as shown Figure 1a.
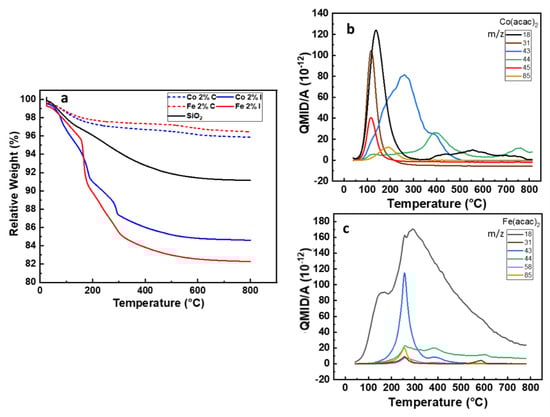
Figure 1.
(a) TGA under airflow of the SiO2 before and after impregnation and calcination with Fe(acac)3 and Co(acac)2, (b,c) QMID (quasi multiple ion detection) ion current curves under argon for Co 2%I and Fe 2%I, respectively.
The desorption obtained on SiO2 substrate reveals a complete desorption of physiosorbed water at 150 °C, followed by a broad weight loss up to 180 °C, due to the dihydroxylation process. At higher temperature (>180 °C) an additional 4% weight loss is observed. It can be attributed to the desorption of moisture and water molecules trapped in the SiO2 mesoporous structure generated by the agglomeration of primary particles. Between 200 to 300 °C the weight loss is assigned to the degradation of CTAB [22].
From 25 to 450 °C the Co 2%I and Fe 2%I samples lost 14% and 17% of their total weight, respectively. This corresponds to the quasi totality of the weight loss for both samples and it can be related to the loss of water (air moisture, at ~150 °C), ethanol (from wet impregnation, from 100 to 250 °C), acetylacetonate (metal precursor, from 200 to 250 °C) and acetone and CO2, formed during the heating (from 255 to 400 °C) [39]. The release temperature for these molecules will be described in MS experiments further in this paper. Beyond 450 °C, a decrease of ~1%wt is recorded for Fe 2%I and Co 2%I. This value is comparable to the loss found on Silica 200 MP (Table 1), giving already first indication of the efficiency of the calcination process over samples after wet impregnation.

Table 1.
Samples weight loss in function of catalyst content.
This behaviour is in line with the TGA profiles of the respective calcinated samples which show a weigh loss of around 1 to 2% at 180 °C, principally due to absorbed water and atmospheric moisture. In fact, the weight loss from 180 to 450 °C is not more than 1%. Up to 800 °C, both samples loose less than 1% in weight. Similar behaviour was shown by samples containing 5% of catalyst (Figure S2), with a mass loss of around 1% observed after 450 °C. Although Kenvin et al. observed that the decomposition kinetic is influenced by the loading of Cu(acac)2 [31], the calcination process proved to be also effective for samples containing 5% molar of Co and Fe.
We further investigate the thermal decomposition behaviour of the samples by coupling TGA under argon with a mass spectrometer (TGA-MS) in order to obtain a molecular fingerprint of the released species as a function of the temperature. From the mass spectroscopy results for Co2%I (Figure 1b) the release of water (m/z 18) and ethanol (m/z 31) have a maximum intensity at 107 °C and 130 °C, respectively, while for acetylacetonate (m/z 85) and acetone (m/z 43) the release rate reaches its maximum respectively at 194 °C and 269 °C. Finally, CO2 (m/z 44) release peak is at 390 °C. Between 300 and 550 °C some other traces of organics were released which could not be identified in more detail. For Fe2%I, the mass spectroscopy results are plotted in Figure 1c, there is an important release of H2O (m/z 18) with reaching a maximum rate at 270 °C. Acetone (m/z 58) and relative fragments (m/z 43) are released in the temperature range between 300 and 500 °C with peaks at 257 °C and 584 °C. Ethanol (m/z 31), CO2 (m/z 44) and acetylacetonate (m/z 85) released with relative maximum rate at 255 °C, 255 °C and 387 °C, respectively. The higher thermal stability of Fe(acac)3 over Co(acac)2 as well as the release of acetone and CO2 are in accordance with the work published by Tsyganova [39] and Hoene [40].
Although Fe(acac)3 presents a higher thermal stability in comparison to Co(acac)2, the acetylacetonate molecule is completely removed from the silica surface in a temperature range from 150 to 400 °C in either cases. At temperatures above 500 °C, an undesirable agglomeration of Fe2O3 nanoparticles over SiO2 substrates was observed by Bukhtiyarova et al. [41], reducing the catalytic activity for oxidation of H2S. In the case of CNT growth, the nanoparticle agglomeration at that temperature would cause a broader CNT diameter dispersion. Therefore, a calcination process with a plateau of 3 h at 450 °C can remove the organic species while minimizing particle coalescence issues, commonly reported for supported metal catalysts [42,43].
2.2. Calcination Optimisation
It has been reported previously by Jourdain et al. [44] that the calcination temperature is also related to the catalyst phase formation. The efficiency of transition metal catalysts for hydrocarbon dissociation variates according to the phase of the nanocatalyst. According to Jourdain et al. [44], the catalytic activity of metal carbides and metal oxides is lower when compared to their corresponding metal, but still not negligible. On the other hand, Co and Fe silicates present a poor catalytic ability [45,46,47,48,49]. To avoid the formation of metal silicates, the calcination process must be specifically designed considering substrate and catalyst interaction. The work of Kababji et al. [50] demonstrates that at 550 °C the generation of silicates form Co sintering and silica migration is promoted. To better characterise the metal species (phase and chemical state) and to validate the cobalt and iron oxides reduction with the annealing under hydrogen, X-ray diffraction (XRD) and X-ray photoelectron spectroscopy (XPS) analyses were performed.
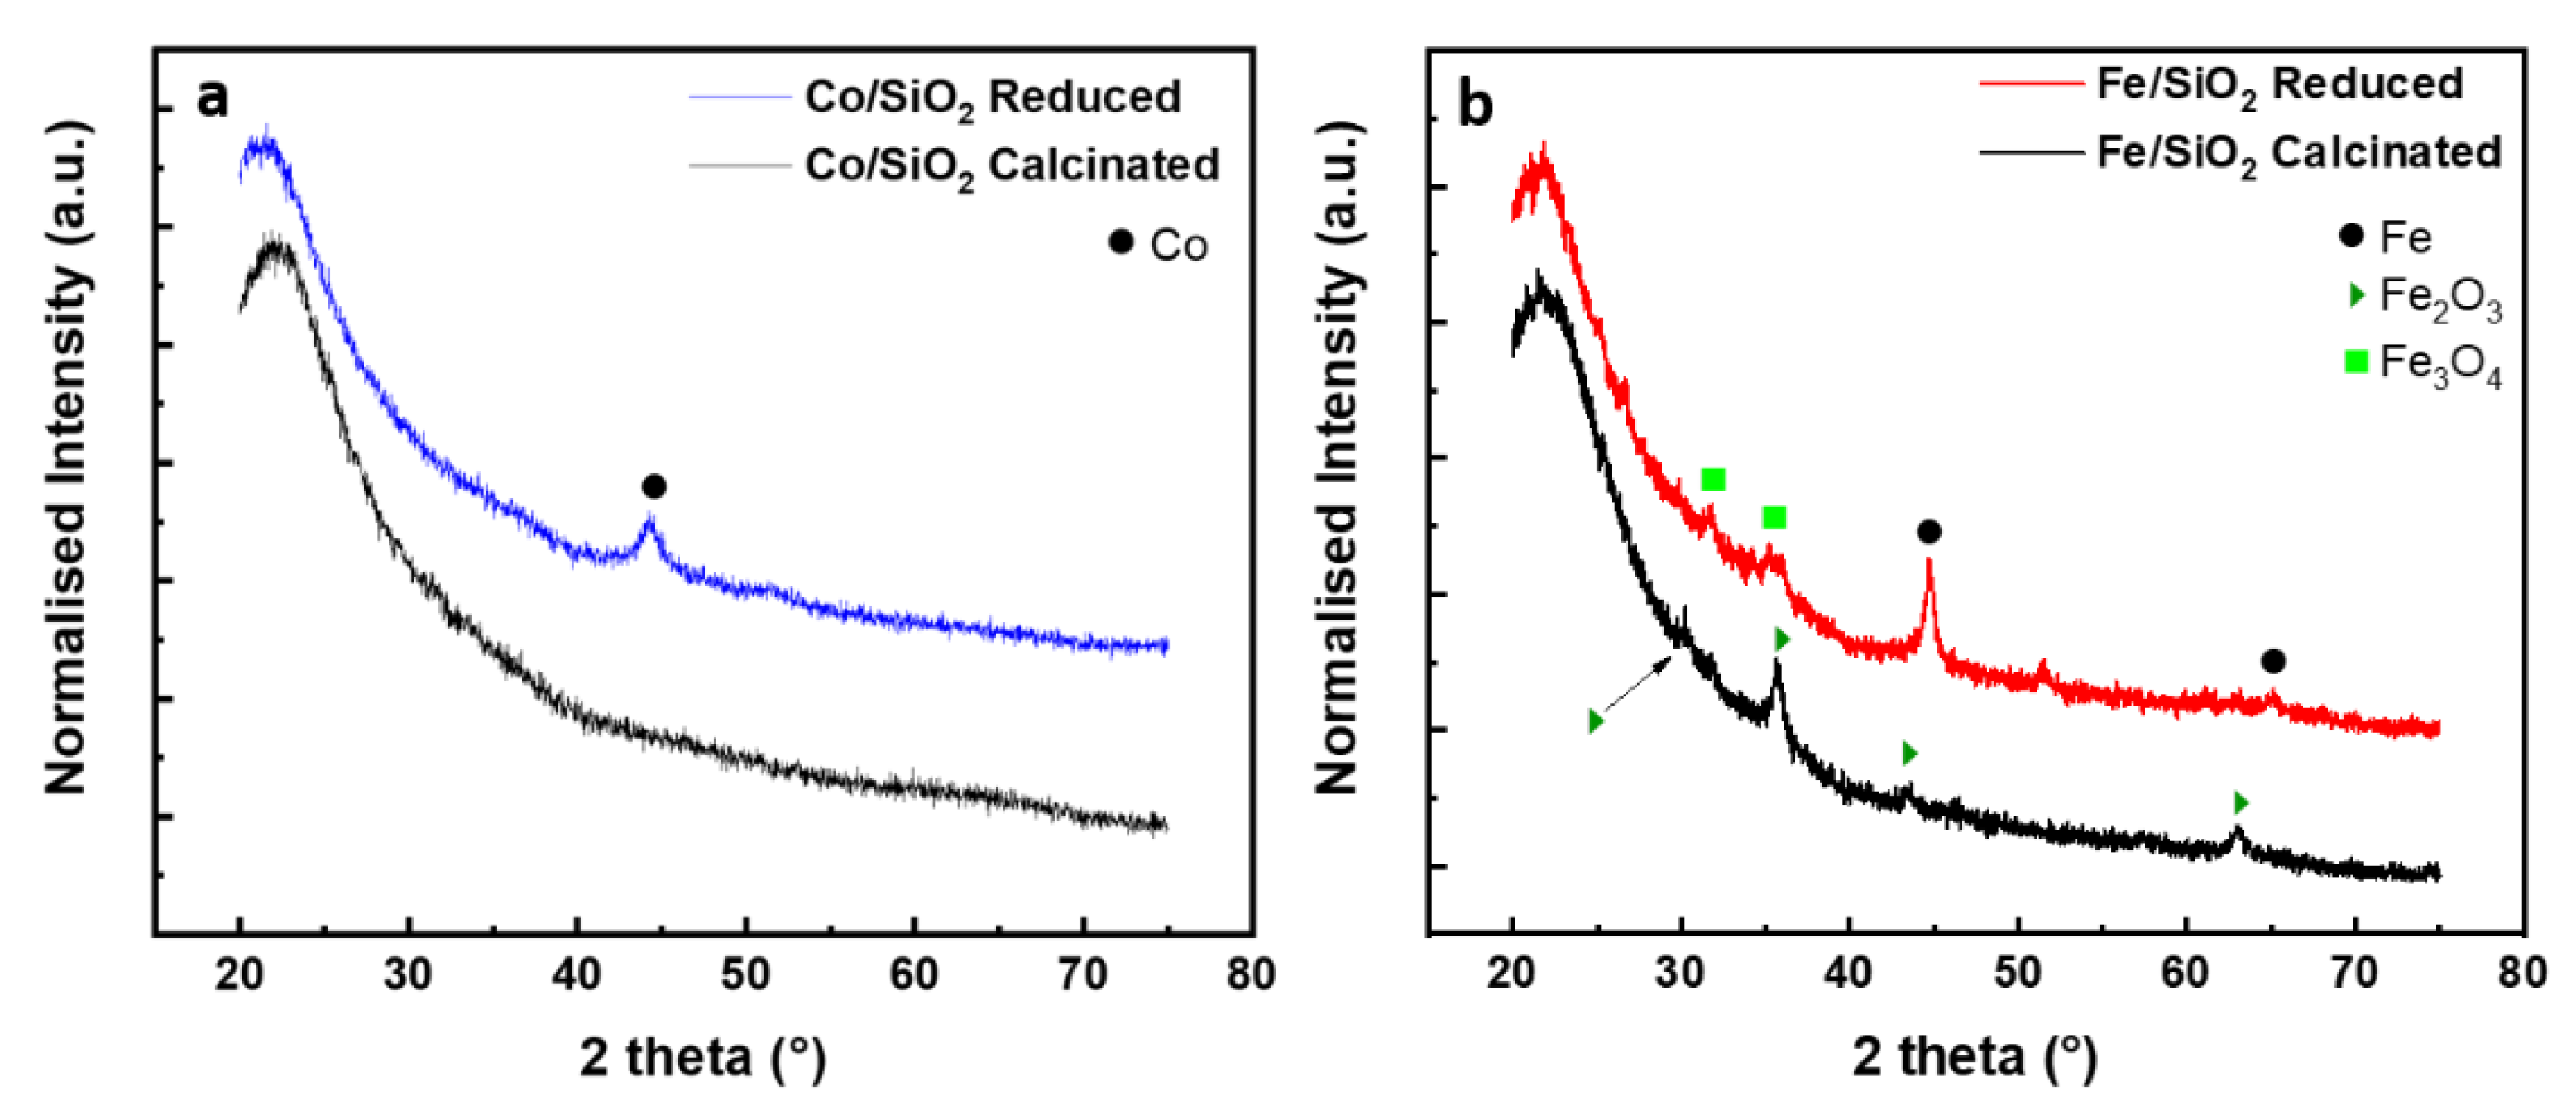
The crystalline phases on SiO2-supported Fe and Co samples were analysed by XRD after calcination and reduction treatment. Samples containing 5% molar concentration of metal were preferentially used in order to increase the collection signal. For all the samples the diffractograms show a broad peak at 22.3° (2θ), which is a typical feature of amorphous SiO2 (Figure 2). From the diffraction pattern of Co/SiO2 after calcination (Figure 2a) no characteristic peaks of Co were detected. This is ascribed to the Co particle size/low concentration on the surface of silica nanoparticles [51]. After reduction, a diffraction line at 44.3° appears, which is ascribed to the most intense reflection of metallic cobalt FCC structure (JCPDS 04-014-0167) indexed to the crystal (111) plane. For the Fe/SiO2 sample after calcination, reflections at 30.1°, 35.6°, 43.1° and 62.9° (2θ) were observed. These reflections coincide with diffraction peaks of the (220), (311), (400) and (440) crystal planes of the face-centred cubic (FCC) phase of γ-Fe2O3. After hydrogen reduction, diffraction peaks at 44.6° and 65.0° indexed to (110) and (200) of the Fe0 cubic phase (JCPDS 01-085-8654) are obtained. In addition, a weak peak corresponding to Fe3O4, located at 31.5 and 35.6° could be identified.
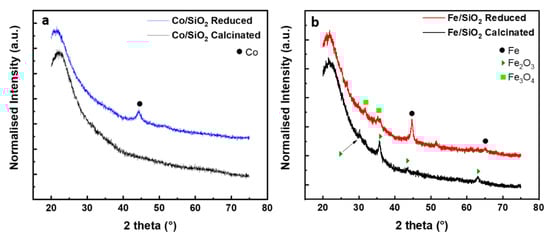
Figure 2.
XRD spectra of (a) SiO2/Co after reduction/calcination and (b) SiO2/Fe after reduction/calcination.
We estimate the average crystallite domains by using the Scherrer (Equation (1)):
where D is the average crystallite size, the factor 0.89 is characteristic of spherical objects, λ is the X-ray wavelength, γ and θ are the full width at half-maximum and the diffraction angle of an observed peak, respectively. The crystallite domain size for the crystal (110) plane of Fe0 was determined to be about 15 nm. Considering the crystallographic plane (111) of metallic cobalt the primary crystallite size is of about 6 nm.
For what concern the evaluation of the efficiency of the reduction process, it is worth considering that the samples reduced by hydrogen were transferred into the XRD measurement glovebox, however, they were exposed to air while transferring from the CCVD reactor to the sealed sample holder. Indeed, the Fe/SiO2 sample still presents Fe2O3 phase after reduction which could be attributed to the short air exposure time together with the incomplete reduction of the iron oxides species. This behaviour was also observed by Palasantzas et al. [52] where, in ambient air, Co and Fe nanoparticles tend to form an oxide shell. The stability of metallic cobalt at room temperature probably helps preventing the re-oxidation processes, even considering the high surface to bulk ratio of catalyst nanoparticles. The reflections at 2θ 36.8 and 36.6°, related to Co3O4 and Co2SiO4, respectively, were not detected (Figure 2a), indicating the conversion of the oxide to a metallic phase during the reduction step, without forming any inactive cobalt silicate catalyst.
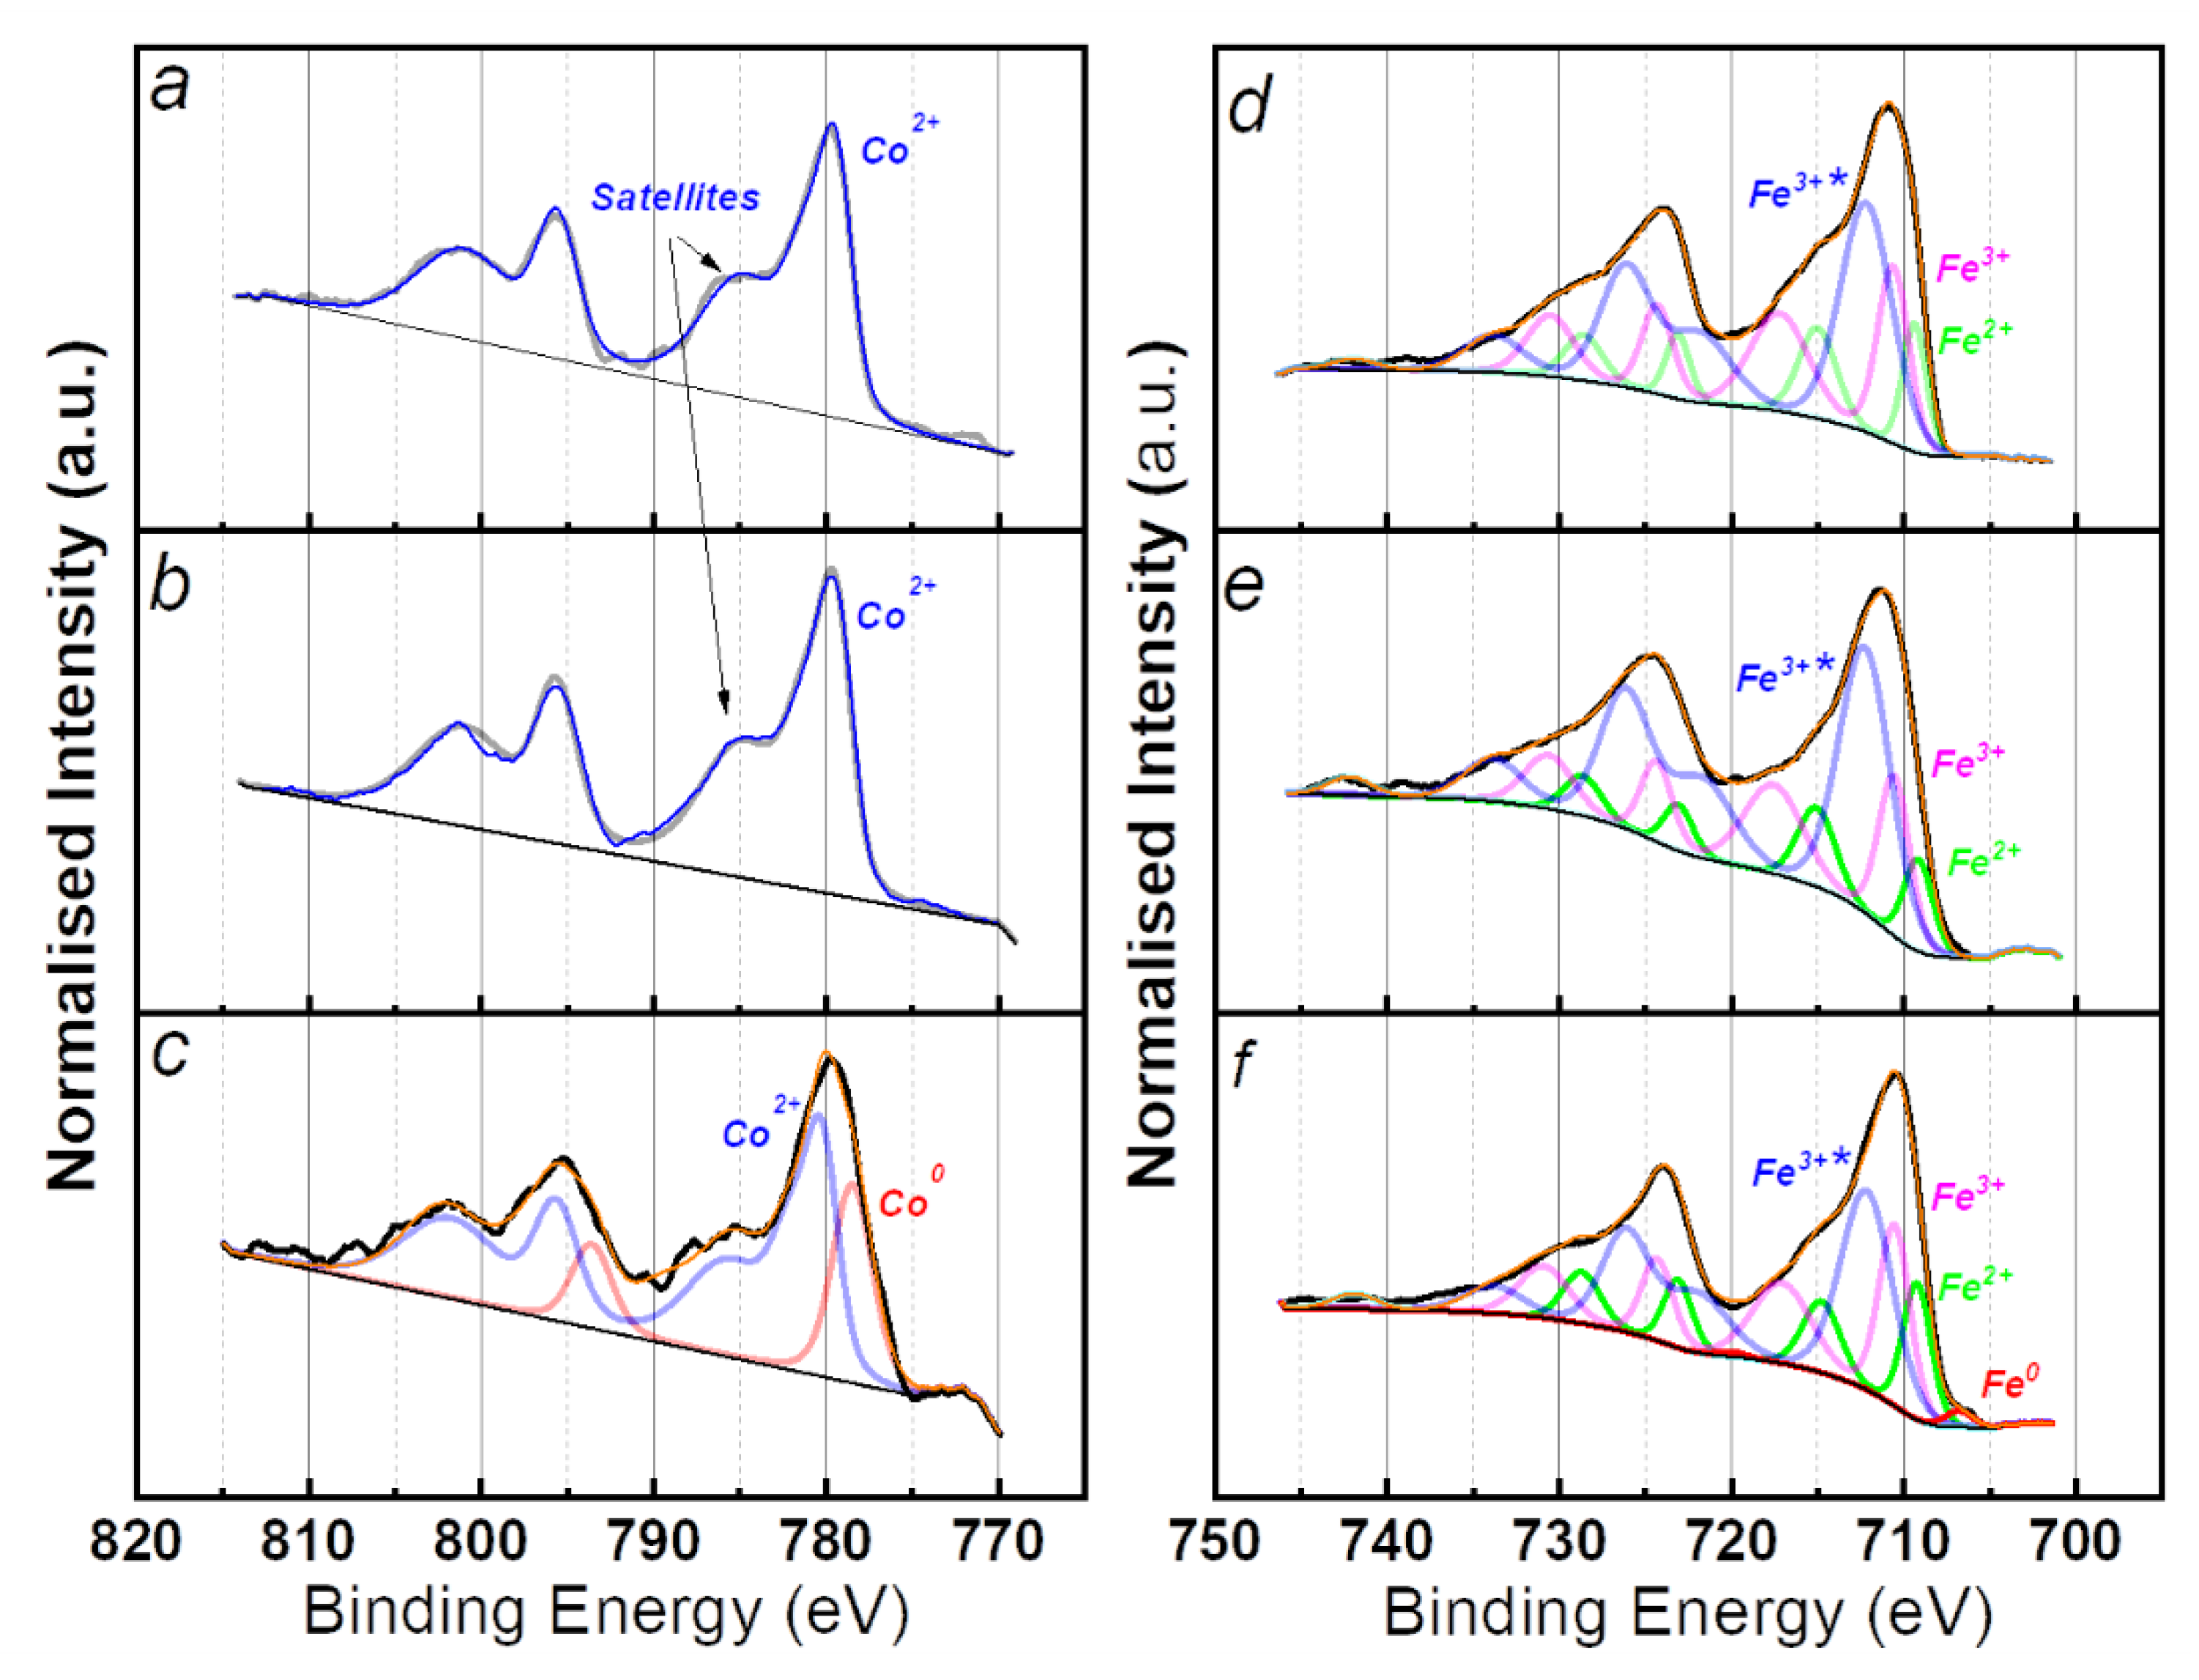
XPS analyses have been carried out to better investigate the chemical state of the samples after impregnation, calcination and reduction step containing 5% molar concentration of metal. The various Fe and Co chemical states have complex and non-symmetrical line shapes that have been fitted with multiples [53]. Only the final line shapes are presented in the XPS spectra (Figure 3). Impregnated and calcinated samples are dominated by Co2+ characteristic component with main peak located at 779.6 eV. The shake-up satellites feature located at 6 eV higher binding energy to the main peak suggest that CoO species (Co2+) are present on the surface [54]. In the Co 2p spectra of the reduced sample, the component at 778.6 eV is ascribed to metallic cobalt and represents 25% of this element, while the component at 780.4 eV (Co2+) is attributable to CoO.
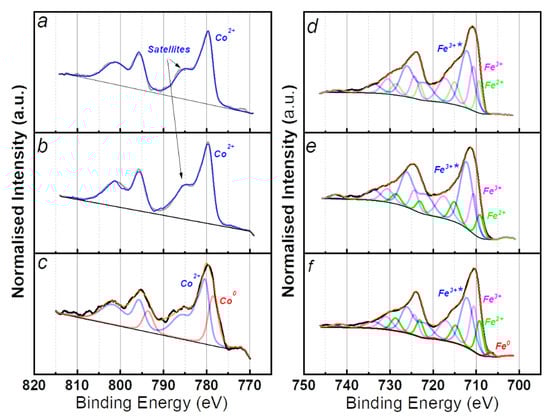
Figure 3.
XPS spectra of Co (left) and Fe (right) catalysts after: (a,d) impregnation; (b,e) calcination; (c,f) reduction.
For all three Fe-supported SiO2 samples the Fe 2p3/2 main component is located around 712 eV, corresponding to oxidised species in any case. For the impregnated and calcinated samples, three chemical states have been identified: the peak at 710.6 eV is ascribable to the Fe3+ of the Fe2O3 [55], while the peak at 709.3 is indicative of the presence of Fe2+ which presumably arises from FeO [56] and Fe-O-Si species [57]. The components located at 712.3 eV can be described in literature as FeOOH [56], Fe(acac)3 or Fe atoms in Fe2O3-SiO2 interfaces [57]. For quantifications they will be considered as Fe3+* species. For the reduced sample, the additional component at 706.7 eV indicates the presence of metallic iron [58]. By estimating the degree of reduction from the ratio of the metallic peak area to the total area of the Fe 2p region it resulted that only 4% is Fe0. Considering the XRD results in Figure 2b, and the lack of crystalline oxide, it is rational to assume that iron oxides are mostly located at the surface of the nanocatalysts. The air exposure during the transfer to the glovebox after reduction step is to be considered as the main cause of oxidation.
In the Table 2 are reported the ratios of Co 2p and Fe 2p to Si 2p, obtained from the peak area measurements after each step of the catalyst fabrication. Here, the content of Fe appears to remain quasi constant during the process steps. Instead, the Co content on the silica support registered a 4.5-fold decrease after reduction step. According to the formula of Kerkhof and Moulijn [59], this decrease can be a consequence of a higher metal dispersion on the silica support. The decrease in the ratio after reduction at a temperature higher than 600 °C could be initiated by the migration of metal atoms inside the support [60] or the encapsulation of the metal by silica atoms coming from the support [61]. On the other hand, for both Co- and Fe-supported catalysts, the metal content resulted in a slight increase of about 10% after calcination. This is a clear indicator of the efficient chemisorption obtained through wet impregnation. The oxidation state quantification of Co and Fe samples after impregnation, calcination and reduction is displayed in Table 3.
Table 2.
Co and Fe content and Me2p/Si2p ratio.
Table 3.
Degree of metal reduction at different process stepfigure.
Besides the phase composition, other characteristics as catalyst morphology and size are extremely important to the final catalytic efficiency in different applications [62,63]. To evaluate the effect of metal content on the final morphology of the of nanoislands synthesised through wet impregnation, 2 and 5% molar of Fe and Co were deposited over silica nanoparticles. The catalyst morphological and size modification were evaluated by transmission electron microscopy (TEM) and scanning transmission electron microscopy (STEM) after the reduction process.
2.3. Catalyst Morphology
The TEM/STEM micrographs of the samples after reduction are shown in Figure 4.
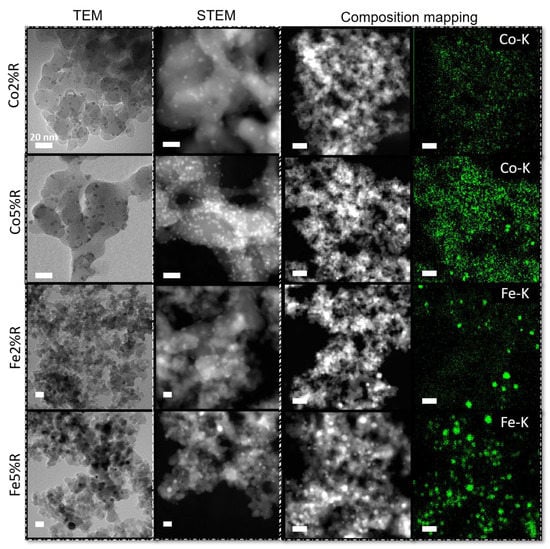
Figure 4.
TEM/STEM micrographs and composition mapping from Co and Fe catalyst (2% and 5%) on SiO2 surface after reduction. Inset scale bar: 20 nm.
After the reduction step (Figure 4) at higher temperature (700 °C) nanoparticles with mean size of ~4.5 nm (± 1.5 nm) was observed for 2 and 5% Co/SiO2. A different behaviour is noticed for Fe/SiO2 particles. At lower concentration, the mean particle diameter measured was ~12 nm (± 3.5 nm). With the increase of iron concentration, not only the particles size (~16 nm) was affected but also the samples showed a broader standard deviation (± 5.3 nm). The results observed by TEM are close to the average crystallite domains calculated by the Scherrer equation, 6 nm for metallic Co and 15 nm for metallic Fe at 5% metal concentration. The STEM composition mapping (Figure 4) shows the dispersion of Co and Fe over the silica at 2 and 5% metal concentration. For both cases, metal catalysts are well spread over the substrate, and it is possible to notice a clear increase in the particle density with an increase in the metal loading. However, Fe/SiO2 samples shows a broader size dispersion when compared to Co/SiO2 samples, in agreement with the particles size measurements.
The different results presented between Co and Fe-based samples could be related to the metal-support interaction (MSI), where weak MSI could lead to the formation of bigger particles with the increase of metal loading as can be seen for Fe-based samples. On the other hand, silica nanoparticles functionalised with Co presents a similar average particles size even with the increase in metal content. Van Deelen et al. [64] observed a stable behaviour of Co nanoparticles (6 and 9 nm diameter) over SiO2 after reduction, while Mosallanejad et al. [65] reported a significantly broader particle size distribution of iron nanoparticles on silica support in comparison to alumina.
The formation of particles after reduction agrees with the size of catalysts applied for the growth of carbon nanotubes. According to Lee et al. [66], CNTs can be formed over Fe nanoparticles with diameters up to 400 nm, where larger is the particle diameter, lower is the CNT growth rate while Co particles up to 40 nm were active for the CNT growth as described by Hoyos-Palacio et al. [35].
2.4. CNT Growth
The scanning electron microscopy (SEM) micrographs of all four samples are shown in Figure 5. CNTs were successfully grown over silica substrate using the different metals (Co and Fe) and concentrations (loading from 2 to 5%).
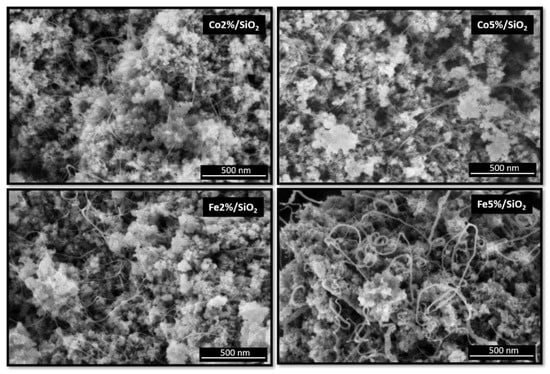
Figure 5.
SEM micrographs from Co and Fe catalyst (2 and 5%) on SiO2 surface after CNT growth.
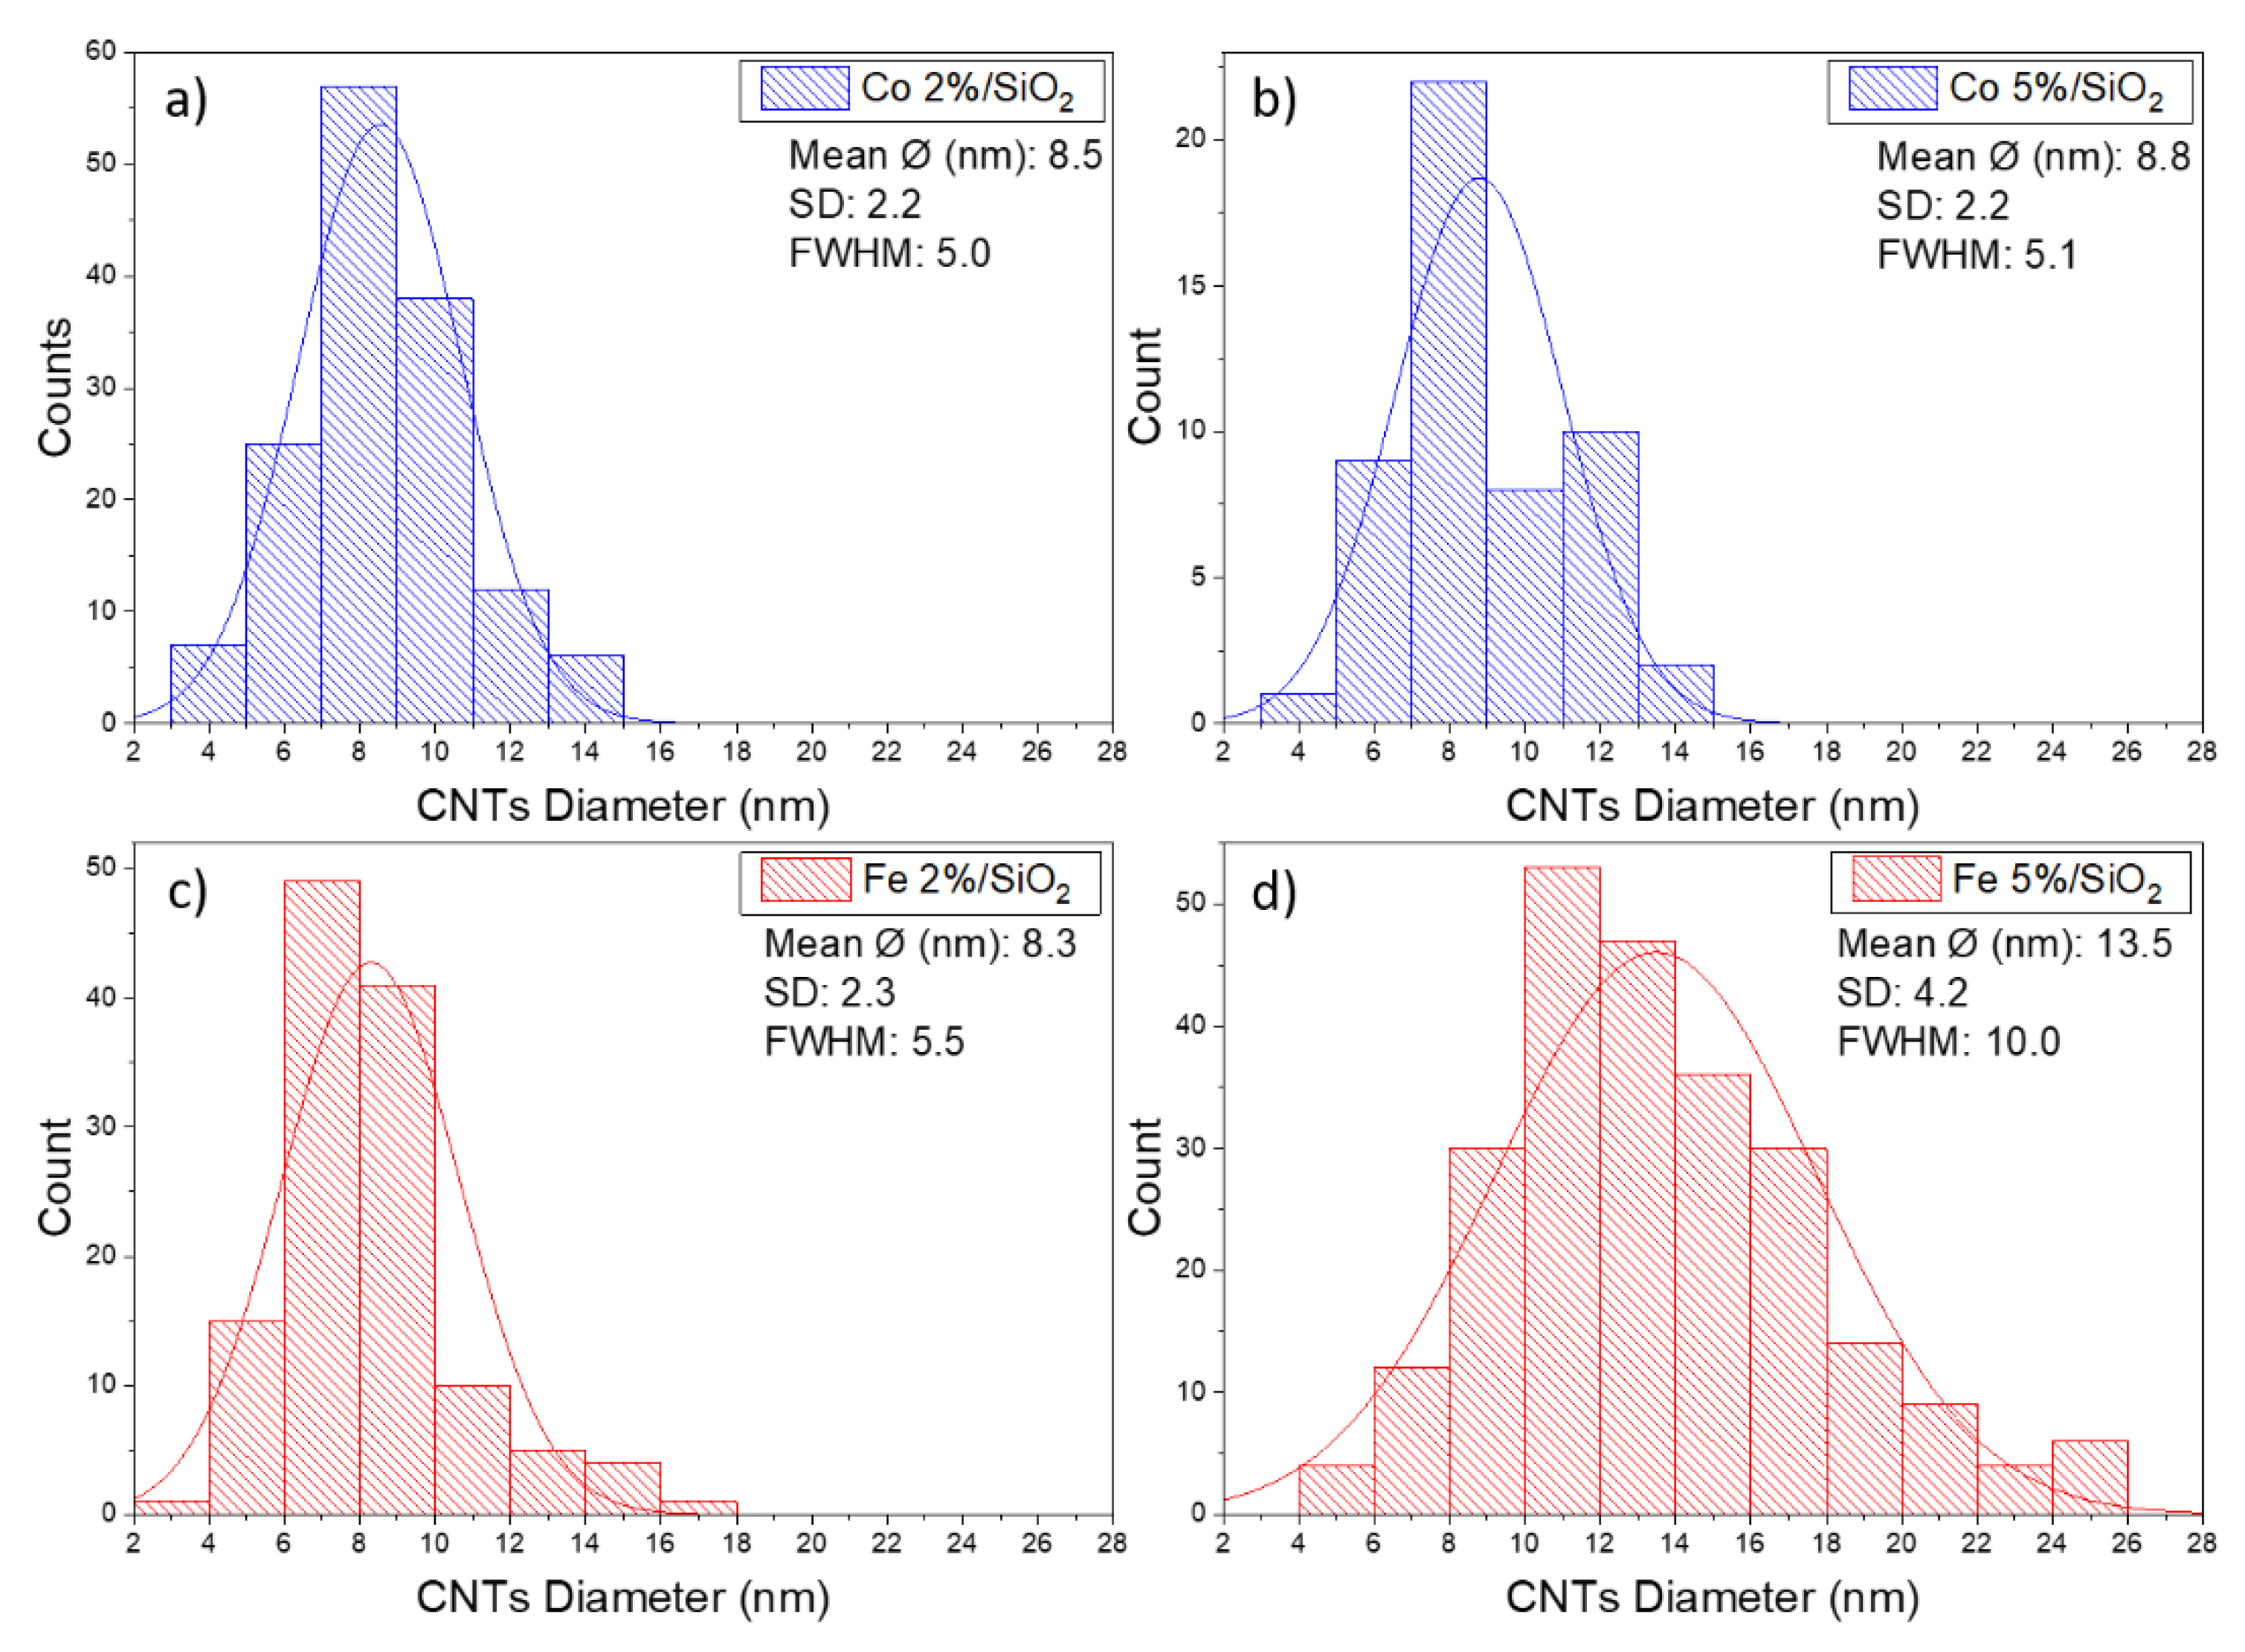
The CNTs grown over cobalt catalysts present similar morphology. An average diameter size of around 8 nm was measured for samples containing 2 and 5% of Co. This behaviour was not observed on substrates covered by Fe catalysts. An increase in CNT diameter from 8 to 13 nm was observed when Fe content increases from 2 to 5%. Fe5%/SiO2 samples also presented a broader size CNT size distribution (FWHM ~10 nm) in comparison to the other three samples (FWHM ~5 nm) (Figure 6). The CNT length was estimated to be longer than 500 nm regarding the scale bar from the SEM micrographs.
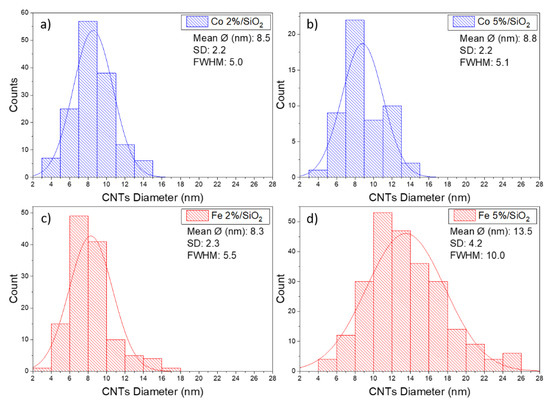
Figure 6.
Distribution histograms and corresponding average CNT diameter size for: (a) Co 2%, (b) Co 5%, (c) Fe 2% and (d) Fe 5%.
The correlation between the metal catalyst particles size and the CNT diameter to the best of our knowledge is not clearly described in the literature. Moodley et al. [67] demonstrated an inconsistency in particles size and CNT diameter measurements, possibly related to a particle re-arrangement on silica substrate prior to CNT growth. Following the same tendency, Nasibulin et al. [68] described the growth of CNTs 1.6 times smaller than the diameter of metal catalyst particles. On the other hand, Dai et al. [69] presented a model where both single and multiwall CNT diameters are closely related to the size of the catalytic particles. According to experiments presented in this article, the diameter of CNT is bigger than the size of the catalyst for samples containing Co and smaller for samples covered by Fe.
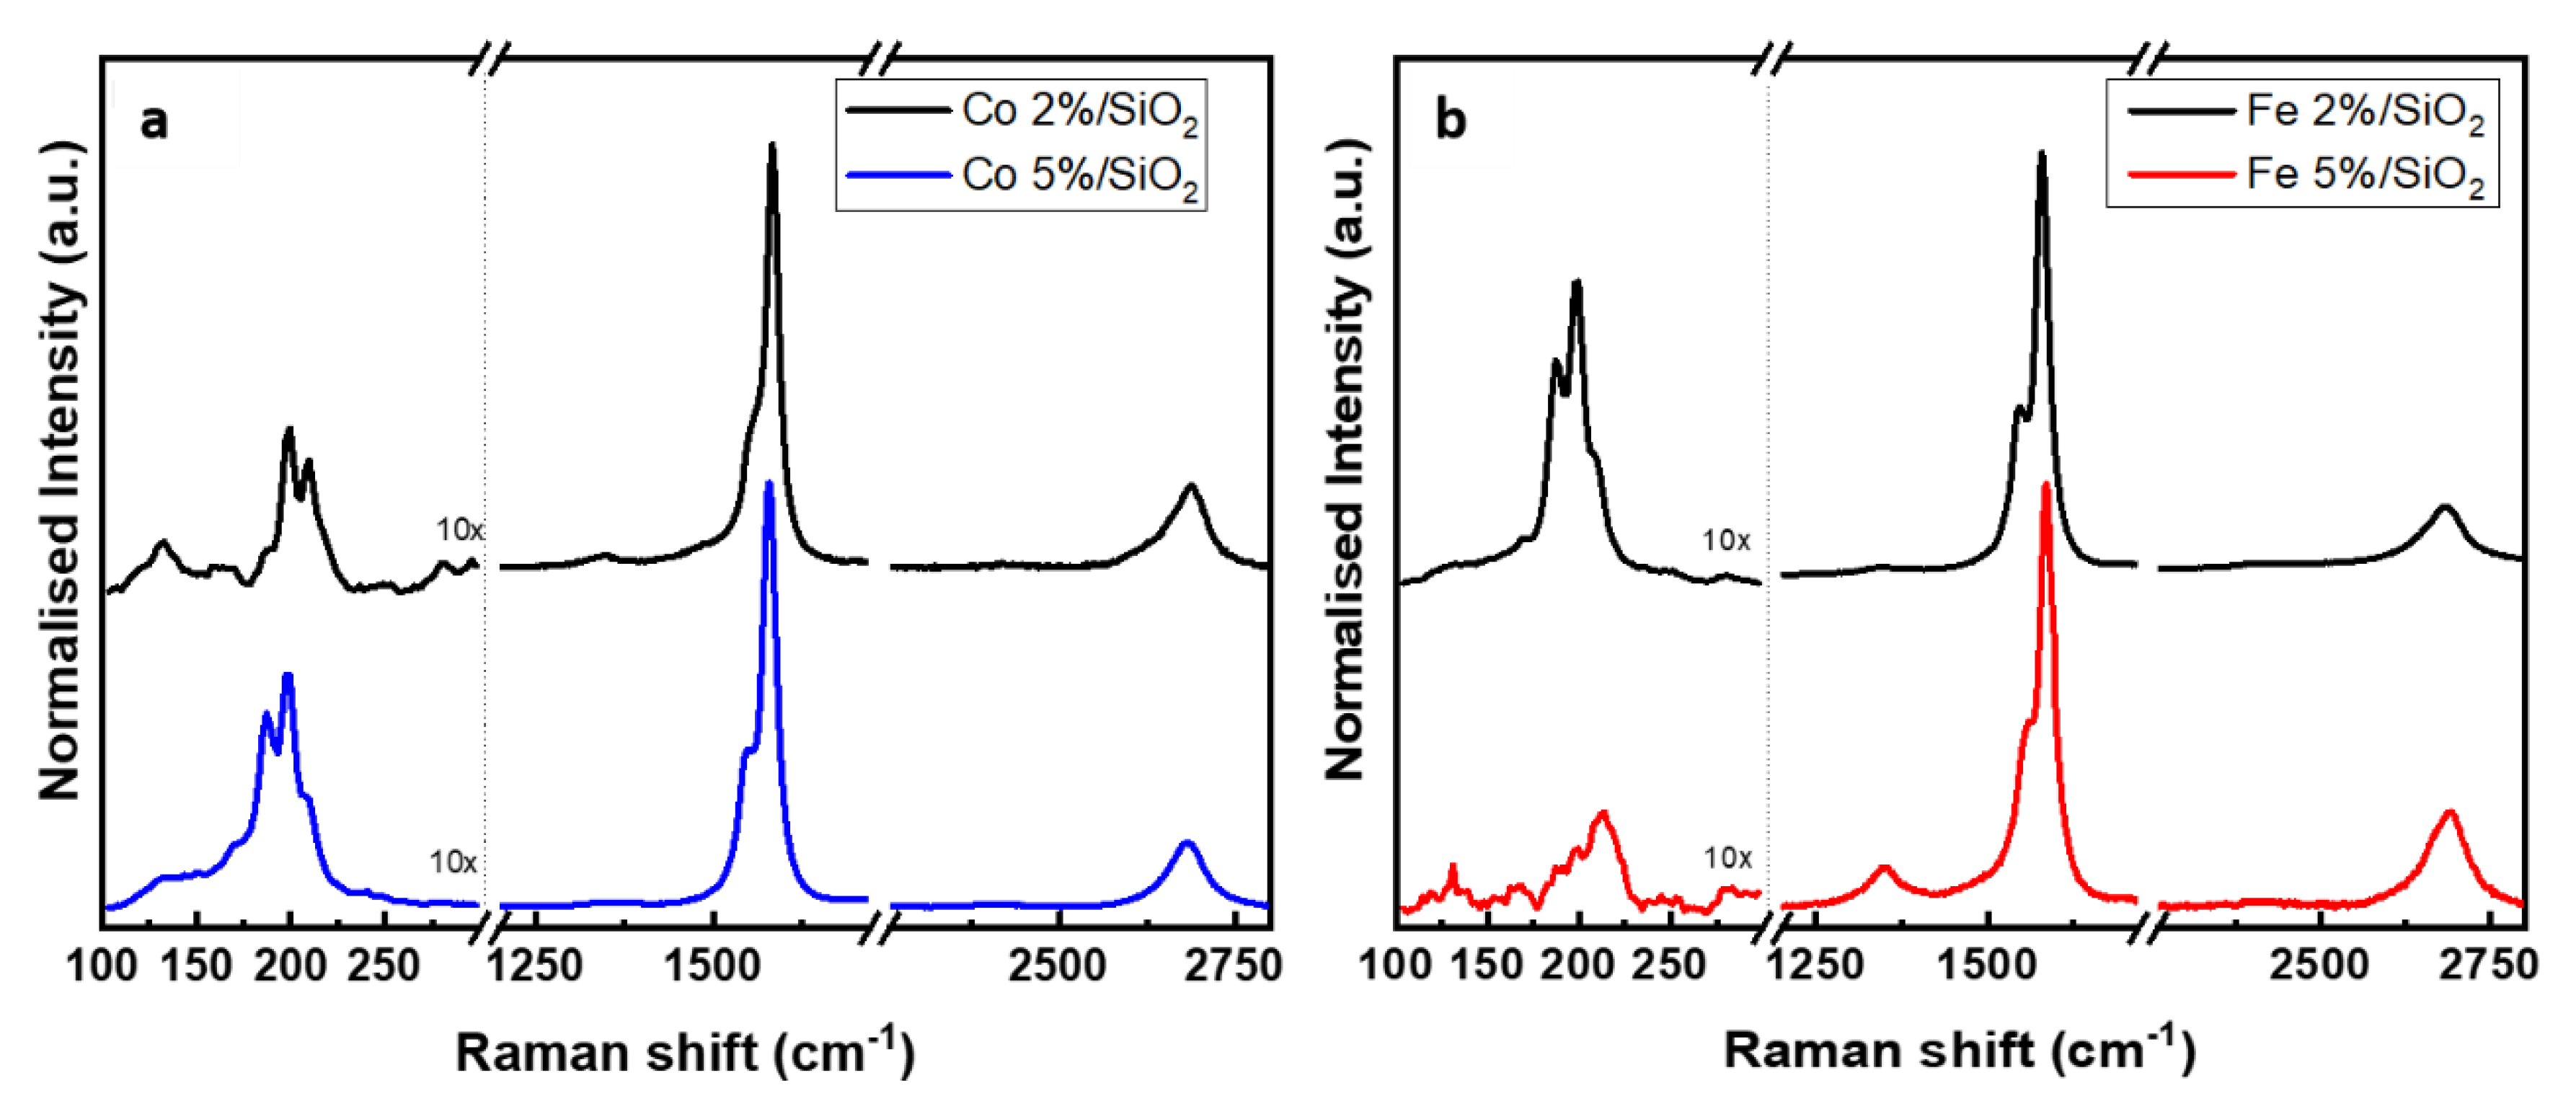
The quality of the carbon nanotubes was investigated by Raman spectroscopy. The CNT displays typical sp2 first-order features at around 1580 cm−1 (G band) and at around 1350 cm−1 (D band) [70]. The first is related to a highly ordered carbon species (graphite, CNT) while the second is assigned to disordered carbon [71]. Figure 7 shows the Raman spectra of carbon deposited from Fe and Co catalyst-supported SiO2 (normalised to the G-band) at two different concentrations. At a lower concentration of metal catalyst (2%), the characteristic fingerprint of single walled CNTs (RBM peak) was detected on Fe- and Co-based samples at 198 and 199 cm−1, respectively. The G band is also present on both samples, at 1579 cm−1 for CNT grown from Fe catalyst and 1583 cm−1 for Co. The Co 5%/SiO2 presented a spectrum similar to the previous samples with RBM and G peaks at 198 cm−1 and 1579 cm−1. Figure 7b shows the carbon structure grown out of the silica substrate containing 5% molar of Fe. The presence of D (1349 cm−1) and G (1586 cm−1) bands on this sample suggests the presence of multi-walled CNTs. Furthermore, SWCNTs were also present on this sample, indicated by a low intensity peak at 212 cm−1. A second-order peak (2D ~2680 cm−1) corresponding to the two-phonon scattering [72] is present in all of the samples. The crystallinity of the CNT structure can be estimate by the ratio of the intensities of the D and G bands [73] (Table 4).
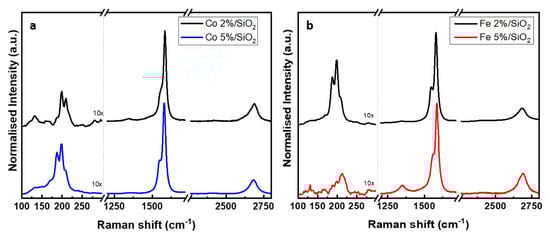
Figure 7.
Raman spectra of CNT bundles grown using (a) Co and (b) Fe catalyst on SiO2 surface.
Table 4.
D band to G band ratios for CNT bundles grown over Fe- and Co-based silica substrates.
The low ID/IG observed in Table 4 suggests a very small concentration of structural defects and/or amorphous carbon [74]. Samples Co 2% and Fe 2% presented slightly close ID/IG values indicating a similar crystalline structure. On the other hand, the Co 5% presented an ID/IG ratio 11% lower when compared to Fe sample at the same concentration. This variation may be justified by the presence of mostly MWCNT instead of SWCNT in sample Fe 5%. In comparison to single wall carbon nanotubes, the multi-wall structure typically shows a larger ID/IG ratio as a result of a more intense D band [74,75].
The radial breathing mode (RBM peak), commonly found at low frequencies (100–400 cm−1), can be used to estimate the SWCNT diameter once the RBM frequency is inversely proportional to the diameter of the tube. The relation between RBM and diameter is described by Equation (2):
where A is a constant with an approximated value of 234 cm−1 nm evaluated from ab initial calculations [76]. B is a constant of the order of 10 cm−1 which corrects the frequencies for intertube interactions in SWCNT bundles [77]. The equation (Equation (2)) is applied to the RBM shift shown in Table 5 to calculate the diameter of the SWCNT detected by Raman spectroscopy.
Table 5.
Calculation of nanotube diameter from RBM mode Raman shift.
The presence of very narrow SWCNT could be attributed to the influence of the silica support porosity during wet impregnation [78]. Many authors [79,80,81] described a direct relation of support porous size and the metal catalyst, where large pores lead to larger metal particles, while small pores form smaller crystallites. With a pore size of 1.0 nm (± 0.3 nm), the silica substrate could trap very small metal nanoislands resulting in SWCNTs with similar size.
2.5. Sum-Up Discussion
Forming metallic nanocatalyst on silica nanoparticles surface requires steps to tune the desired morphology and chemical composition according to the targeted application. At the surface, several oxidation/reduction reactions follow the process in order to promote active catalysts for the growth of CNTs. During the wet impregnation, the chemisorption of organometallic molecules on the surface of silica nanoparticles occurs in two steps: decomposition of unstable metal acetylacetonates (M = Fe III, Co II) and bonding to the surface by ligand exchange mechanism [31].
After the adsorption on the silica, a first thermal treatment under air is needed to remove undesired (acac) molecules still attached to the metal and to promote oxide particles. TGA-MS demonstrated the samples mass loss in function of temperature. Water, ethanol and acetylacetonates were completely removed at temperature below 450 °C on samples containing 2 and 5% of metal molar concentration, confirming that a calcination process at this temperature is effective for the metal oxide catalyst formation and avoiding excessive coalescence (to large particles) and/or formation of silicates (inactive phase), usually happening at temperatures over 550 °C. XRD and XPS analysis confirmed the presence of CoO and Fe2O3 nanoparticles over the samples. In the process described in this paper, the oxide particles are considered a transition phase once metallic structure are targeted due to higher catalytic activity. After the annealing at 700 °C for 1 h, the oxide phase was successfully reduced to Co0 and Fe0 following the mechanisms described by Lin et al. [82,83].
After the growth of CNTs (Figure 5), we show that it is possible to tune the carbon structure by changing the Fe content over the substrate. For Fe-based samples, the CNTs presented a single-wall structure at 2% of Fe concentration, while multi-wall nanotubes were detected when the concentration of the same metal was raised to 5%. The same behaviour was not observed for Co-based samples, where similar CNT structure and size were grown at different Co contents. A possible reason for this disparity is the relation between metal and substrate. Co presents a stronger MSI with silica substrate in comparison to Fe, resulting in a smaller atomic displacement under heating. This hypothesis is in agreement to Figure 4 and Figure 6, where the particle and CNT size distribution gets larger with the increase in Fe content, while the same trend is not observed from Co 2% to Co 5%.
3. Materials and Methods
3.1. Catalyst Preparation
The supported catalysts were prepared by a wet chemisorption method [84] of Fe(acac)3 and Co(acac)2 (Sigma Aldrich, St. Louis, MO, USA), (>99%) onto precipitated amorphous silica (Solvay, Zeosil Premium 200 MP, Paulínea, SP, Brazil) in ethanol absolute (Sigma-Aldrich, St. Louis, MO, USA). The chemisorption was carried in a 500 mL beaker, by dispersing 20 g of silica particles (primary particle 10 ± 2 nm) in 185 mL of ethanol under stirring. The metal precursor was dissolved in 15 mL of ethanol and then injected to the silica dispersion. The impregnation was carried out with different metal loading, at 2 and at 5%wt of the silica support. The obtained solution was then added to the silica dispersion and kept under constant steering at 30 °C for 48 h retarding solvent evaporation using a Liebig condenser. The latter was then removed, and the temperature of the solution was increased to 60 °C for an additional 4 h to evaporate the solvent. The chemisorption step was followed by air treatment at 450 °C to remove the acac-ligands and enhance the adhesion of the metal to the substrate. In the text, the samples are identified by the name of the metal catalyst (Co or Fe), the metal precursor loading to the silica support during wet impregnation (2 or 5%) concluding with the initial processing step: impregnation (I), calcination (C) or reduction (R) (i.e., Co 2%I).
3.2. CNT Growth
For the CNT growth, the obtained silica-supported catalyst was processed in a AS-Master RTCVD reactor (Annealsys, Montpellier, France) by CCVD method [85]. The process was carried out at 5 mbar and a reduction temperature of 700 °C was reached by heating ramp at 2 °C/sec. The metal catalyst was then reduced under H2/N2 (gas flow 45/300 sccm), at 700 °C for 1 h. After reduction, the reactor was purged by N2, while its temperature was eventually further raised for a CNT growth at 700 °C. Acetylene was designated as carbon source (C2H2/N2 gas flow 60/300 sccm), with a growth time of 20 min. The thermal profile of CNT growth is illustrated in Figure S1 (Supplementary Materials).
3.3. Morphology Characterisation
The overall morphology of the supported catalyst as well as the CNTs were characterised using a FEI Helios Nanolab 650 Focused Ion Beam Secondary Electron Microscope (FIB-SEM, FEI, Hillsboro, OR, USA) using a 2 kV acceleration voltage. Transmission electron microscopy (TEM) and scanning transmission electron microscopy (SEM) investigations were carried out using a JEM-ARM 200 F Cold FEG TEM/STEM (Jeol, Akishima, Japan) operating at 200 kV and equipped with a spherical aberration (Cs) probe and image correctors (point resolution 0.12 nm in TEM mode and 0.078 nm in STEM mode). The estimated size of metal particles and CNTs were carried out using Image J software (version 1.53i, National Institutes of Health, Bethesdam, MD, USA) [86].
3.4. Structure and Composition of the Catalyst
After the impregnation, calcination and reduction step, the samples of 2 and 5% of Fe and Co content were analysed by X-ray photoelectron spectroscopy (Axis Ultra DLD, Kratos, Manchester, UK). The catalyst samples, which were pre-reduced in flowing hydrogen at 700 °C for 1 h, were transferred into the measurement chamber with a short period (2 min) of air exposure. The measurements were carried out using a monochromated Al Kα X-ray source and an analyser energy resolution of 0.6 eV. The take-off angle was 0° with respect to the surface normal and the photoelectrons were collected over a 700 µm × 300 µm area.
The binding energy scale was fixed by using the binding energy of 284.6 eV for the C 1 s peak. The degree of reduction of the metals was estimated from the ratio of the metallic peak area to the total peak area of the Fe 2p and Co 2p regions. Overlapping chemical states in the XP-spectra were fitted with multiplets of symmetrical Gaussian–Lorentzian (80/20) peaks after removal of a Shirley or linear type background. The calculations were made with the Casa XPS-software (version 2.3.22, Casa Software Ltd., Teignmouth, UK) by using the peak fitting routines and the relative sensitivity factors supplied by the manufacturer.
The main uncertainties in the estimation of the degree of reduction (i.e., the oxide-metal ratio) come from the background shape [87], the particles size (the XPS analysis depth being only few nanometres, the core of large particles is not probed) [88] and the slight overlap of the Co L3M2,3M4,5 Auger transition with the low binding energy side of the Co 2p peak when working with an Al Kα radiation [89]. However, the method remains robust to compare the influence of the various samples’ preparation methods or treatments.
The crystal structure of the supported catalyst was studied by X-ray diffraction (XRD). X-ray scattering patterns were collected using a X’Pert Pro diffractometer (Malvern Panalitycal, Malvern, UK) from 15 to 75° with the 2θ step size of 0.026° and a counting time of 300 s using a PIXcel3D detector in 1D mode. The Cu-anode was operated at 45 kV and 40 mA. The samples were irradiated using a Programmable Divergence Slit fixed to 0.25°. Identification of the reflections was done with reference data from the JCPDS reference library, using the manufacturer’s Highscore Plus software (version 4.9, Malvern Panalitycal, Malvern, UK). Calcined and reduced samples for both supported Fe and Co catalysts were studied. The samples were transferred to the measurement chamber through air.
The thermal decomposition of the supported catalyst was evaluated by combining thermogravimetric analysis (TGA) and mass spectroscopy (MS) by using a NETZSCH STA 449 F3 Jupiter thermogravimetric analyser (NETZSCH-Gerätebau GmbH, Selb, Germany) coupled to a 403 Aëolos Quadro mass spectrometer (NETZSCH-Gerätebau GmbH, Selb, Germany).
The analysis was carried out under both airflow and argon to respectively evaluate the mass loss under oxidative conditions and discriminate the released species up to 800 °C. For both analysis after a first isothermal segment at 25 °C for 20 min the samples were heated to 800 °C at a rate of 10 °C/min under 50 mL/min Ar or of 20 mL/min airflow with 40 mL/min N2.
The Raman spectra of carbon nanotubes deposited on metallic supported silica were collected using a Raman Renishaw inVia spectrometer (Renishaw, Wotton-under-Edge, UK) For each sample, the spectra were recorded over random spots keeping an exposure time of 10 s over five accumulations. A 442-nm (2.8 eV) laser wavelength was used to excite the samples.
4. Conclusions
Supported Co and Fe catalysts were prepared by wet impregnation of silica nanoparticles using metal acetylacetonate as a precursor. The catalytic activity of the nanoparticles was evaluated through the growth of carbon nanotubes by CCVD. XRD analysis indicated the presence of bulk metallic Co and Fe after reduction at 700 °C (1 h) under H2, while after calcination (450 °C for 3 h) only Fe-based samples presented a detectable crystalline oxide phase (Fe2O3). The surface analysis (XPS) revealed an oxidised state Fe2+ and Fe3+ (FeO and Fe2O3, respectively) and Co2+ (CoO) after calcination. XPS also detected 4% of metallic Fe and 25% of metallic Co after reduction. The remaining oxide phase can be associated to the catalyst reoxidation due to air exposure. The influence of the metal load during wet impregnation synthesis on the CNT morphology and structure was also studied. At lower concentration (2%), Fe and Co catalysts promoted SWCNTs with average diameter of 8 nm. At higher precursor concentration (5%), the migration of iron atoms forms larger particles with a broader diameter distribution, promoting the formation of MWCNTs with larger diameter (~13 nm). This effect was not observed on the sample Co5%/SiO2. Very narrow SWCNTs (1–2 nm) were detected by Raman in both metal type and concentration.
Supplementary Materials
The following are available online at https://www.mdpi.com/article/10.3390/catal11080986/s1, Figure S1: The thermal profile of CNT growth by CCVD, Table S1: List of desorbed species from TGA-MS, Figure S2: TGA under air flow of SiO2 covered by Co and Fe at 2% and 5% molar concentration after calcination process.
Author Contributions
Conceptualisation, T.d.C., A.M. and D.A.; methodology, T.d.C. and A.M.; formal analysis, T.d.C. and A.M.; investigation, T.d.C., A.M., J.G. and Y.F.; writing—original draft, T.d.C. and A.M.; writing—review and editing, J.G., Y.F., B.D., D.L. and D.A.; supervision, D.L. and D.A. All authors have read and agreed to the published version of the manuscript.
Funding
The investigation in this topic were supported by the National Research Fund (FNR) through an Industrial Partnership Block Grant (IPBG16/11514551/Tiremat-Tech), which is greatly acknowledged.
Data Availability Statement
Not applicable.
Acknowledgments
The authors are grateful to K. Menguelti for the support on the RTCVD processes and R. Vaudemont and B Marcolini for carrying out the TGA analysis.
Conflicts of Interest
The authors declare no conflict of interest.
References
- Munnik, P.; de Jongh, P.E.; de Jong, K.P. Recent Developments in the Synthesis of Supported Catalysts. Chem. Rev. 2015, 115, 6687–6718. [Google Scholar] [CrossRef]
- Kanda, Y.; Uemichi, Y.; Kobayashi, T.; Andalaluna, L.; Sugioka, M. Catalytic performance of noble metals supported on Al2O3-modified MCM-41 for thiophene hydrodesulfurization. Stud. Surf. Sci. Catal. 2005, 156, 747–754. [Google Scholar] [CrossRef]
- Ruano Sánchez, D.; Azenha, C.; Mateos-Pedrero, C.; Mendes, A.; Pérez-Dieste, V.; Concepcion, P.; Pabón, B.M. Influence of the ZrO2 Crystalline Phases on the Nature of Active Sites in PdCu/ZrO2 Catalysts for the Methanol Steam Reforming Reaction-An In Situ Spectroscopic Study. Catalysts 2020, 10, 1005. [Google Scholar] [CrossRef]
- Kartusch, C.; Bokhoven, J. Hydrogenation over gold catalysts: The interaction of gold with hydrogen. Gold Bull. 2009, 42, 343–348. [Google Scholar] [CrossRef] [Green Version]
- Dannetun, H.; Lundström, I.; Petersson, L.G. Dehydrogenation of acetylene and ethylene studied on clean and oxygen covered palladium surfaces. Surf. Sci. 1986, 173, 148–159. [Google Scholar] [CrossRef]
- Jin-Xun, L.; Wang, P.; Xu, W.; Hensen, E. Particle Size and Crystal Phase Effects in Fischer-Tropsch Catalysts. Engineering 2017, 3, 467–476. [Google Scholar] [CrossRef]
- Battulga, B.-U.; Bold, T.; Byambajav, E. Effect of Fe and Co promoters on CO methanation activity of nickel catalyst prepared by impregnation–co-precipitation method. Int. J. Chem. React. Eng. 2020, 8, 20200076. [Google Scholar] [CrossRef]
- Shtyka, O.; Ciesielski, R.; Kitsyuk, E.; Savitsky, A.; Maniecki, T. The influence of the size of metal particles on the catalytic activity of Ni and Cu-supported catalysts in methanol reforming reaction. React. Kinet. Mech. Catal. 2019, 129, 219–233. [Google Scholar] [CrossRef] [Green Version]
- Hernández Mejía, C.; van Deelen, T.; De Jong, K. Control of metal-support interactions in heterogeneous catalysts to enhance activity and selectivity. Nat. Catal. 2019, 2, 955–970. [Google Scholar] [CrossRef]
- Wang, X.-D.; Vinodgopal, K.; Dai, G. Synthesis of Carbon Nanotubes by Catalytic Chemical Vapor Deposition. In Perspective of Carbon Nanotubes; IntechOpen: London, UK, 2019. [Google Scholar]
- Fischer, J.E.; Johnson, A.T. Electronic properties of carbon nanotubes. Curr. Opin. Solid State Mater. Sci. 1999, 4, 28–33. [Google Scholar] [CrossRef]
- Yu, M.-F.; Lourie, O.; Dyer, M.; Moloni, K.; Kelly, T.; Ruoff, R. Strength and Breaking Mechanism of Multiwall Carbon Nanotubes under Tensile Load. Science 2000, 287, 637–640. [Google Scholar] [CrossRef] [PubMed] [Green Version]
- Kulik, A.; Kis, A.; Lukic, B.; Lee, K.; Forró, L. Mechanical Properties of Carbon Nanotubes. In Fundamentals of Friction and Wear; Springer: Berlin/Heidelberg, Germany, 2007; pp. 583–600. [Google Scholar]
- Serp, P.; Castillejos, E. Catalysis in Carbon Nanotubes. ChemCatChem 2010, 2, 41–47. [Google Scholar] [CrossRef]
- Zhang, R.; Zhang, Y.; Wei, F. Synthesis and Properties of Ultralong Carbon Nanotubes. In Nanotube Superfiber Materials; Schulz, M.J., Shanov, V.N., Yin, Z., Eds.; William Andrew Publishing: Boston, MA, USA, 2014; pp. 87–136. [Google Scholar]
- Banhart, F. Interactions between metals and carbon nanotubes: At the interface between old and new materials. Nanoscale 2009, 1, 201–213. [Google Scholar] [CrossRef] [PubMed]
- Kumar, M.; Ando, Y. Carbon Nanotube Synthesis and Growth Mechanism. Nanotechnol. Percept. 2010, 6, 7–28. [Google Scholar] [CrossRef]
- Andrews, R.; Jacques, D.; Rao, A.M.; Derbyshire, F.; Qian, D.; Fan, X.; Dickey, E.C.; Chen, J. Continuous production of aligned carbon nanotubes: A step closer to commercial realization. Chem. Phys. Lett. 1999, 303, 467–474. [Google Scholar] [CrossRef]
- Mayya, K.; Lee, S.; Yeo, I.-S.; Chung, U.I.; Moon, J.T. Diameter controlled synthesis of carbon nanotubes by CVD using steric-stabilized nanoparticle catalysts. TechConnect Briefs 2006, 1, 98–101. [Google Scholar]
- Kumar, M.; Ando, Y. Controlling the diameter distribution of carbon nanotubes grown from camphor on a zeolite support. Carbon 2005, 43, 533–540. [Google Scholar] [CrossRef]
- Hata, K.; Futaba, D.; Mizuno, K.; Namai, T.; Yumura, M.; Iijima, S. Water-Assisted Highly Efficient Synthesis of Impurity-Free Single-Walled Carbon Nanotubes. Science 2004, 306, 1362–1364. [Google Scholar] [CrossRef] [Green Version]
- Zhuravlev, L.T. The surface chemistry of amorphous silica. Zhuravlev model. Colloids Surf. 2000, 173, 1–38. [Google Scholar] [CrossRef] [Green Version]
- Shinde, P.; Suryawanshi, P.; Patil, K.; Belekar, V.; Sankpal, S.; Delekar, S.; Jadhav, S. A Brief Overview of Recent Progress in Porous Silica as Catalyst Supports. J. Compos. Sci. 2021, 5, 75. [Google Scholar] [CrossRef]
- Gawande, M.B.; Monga, Y.; Zboril, R.; Sharma, R.K. Silica-decorated magnetic nanocomposites for catalytic applications. Coord. Chem. Rev. 2015, 288, 118–143. [Google Scholar] [CrossRef]
- Qian, K.; Fang, J.; Huang, W.; He, B.; Jiang, Z.; Ma, Y.; Wei, S. Understanding the deposition–precipitation process for the preparation of supported Au catalysts. J. Mol. Catal. A Chem. 2010, 320, 97–105. [Google Scholar] [CrossRef]
- Kaprielova, K.; Ovchinnikov, I.; Yakovina, O.; Lisitsyn, S. Synthesis of Pt/C Catalysts through Reductive Deposition: Ways of Tuning Catalytic Properties. ChemCatChem 2013, 5, 1–11. [Google Scholar] [CrossRef]
- Jia, C.-J.; Schüth, F. Colloidal metal nanoparticles as a component of designed catalyst. Phys. Chem. Chem. Phys. 2011, 13, 2457–2487. [Google Scholar] [CrossRef] [PubMed]
- Alcalá, M.D.; Real, C. Synthesis based on the wet impregnation method and characterization of iron and iron oxide-silica nanocomposites. Solid State Ion. 2006, 177, 955–960. [Google Scholar] [CrossRef]
- Rosynek, M.P.; Polansky, C.A. Effect of cobalt source on the reduction properties of silica-supported cobalt catalysts. Appl. Catal. 1991, 73, 97–112. [Google Scholar] [CrossRef]
- Mehrabadi, B.A.T.; Eskandari, S.; Khan, U.; White, R.; Regalbuto, J. A Review of Preparation Methods for Supported Metal Catalysts. In Advances in Catalysis; Elsevier: Amsterdam, The Netherlands, 2017; Volume 61, pp. 1–35. [Google Scholar]
- Kenvin, J.C.; White, M.G.; Mitchell, M.B. Preparation and characterization of supported mononuclear metal complexes as model catalysts. Langmuir 1991, 7, 1198–1205. [Google Scholar] [CrossRef]
- Zhang, Y.; Li, Y.; Kim, W.; Wang, D.; Dai, H. Imaging as-grown single-walled carbon nanotubes originated from isolated catalytic nanoparticles. Appl. Phys. A 2002, 74, 325–328. [Google Scholar] [CrossRef]
- Ando, Y.; Zhao, X.; Sugai, T.; Kumar, M. Growing carbon nanotubes. Mater. Today Phys. 2004, 7, 22–29. [Google Scholar] [CrossRef]
- Cheung, C.L.; Kurtz, A.; Park, H.; Lieber, C.M. Diameter-Controlled Synthesis of Carbon Nanotubes. J. Phys. Chem. B 2002, 106, 2429–2433. [Google Scholar] [CrossRef]
- Hoyos-Palacio, L.; Garcia, A.; Pérez-Robles, J.F.; González, J.; Martínez, V. Catalytic effect of Fe, Ni, Co and Mo on the CNTs production. In IOP Conference Series: Materials Science and Engineering, Santander, Colombia, 8 October 2011; IOP Publishing: Bristol, UK, 2014; p. 012005. [Google Scholar]
- Dupuis, A.-C. The Catalyst in the CCVD of Carbon Nanotubes. Prog. Mater. Sci. 2005, 50, 929–961. [Google Scholar] [CrossRef]
- Lein, M.; Kelly, C. Choosing the right precursor for thermal decomposition solution-phase synthesis of iron nanoparticles: Tunable dissociation energies of ferrocene derivatives. Phys. Chem. Chem. Phys. 2016, 18. [Google Scholar] [CrossRef]
- Robens, E. Adsorption and Its Applications in Industry and Environmental Protection; Elsevier: Amsterdam, The Netherlands, 1999; Volume 120, pp. 3–1067. [Google Scholar]
- Tsyganova, E.I.; Dyagileva, L.M. The reactivity of metal β-diketonates in the thermal decomposition reaction. Russ. Chem. Rev 1996, 65, 315–328. [Google Scholar] [CrossRef]
- Hoene, J.V.; Charles, R.G.; Hickam, W.M. Thermal Decomposition of Metal Acetylacetonates: Mass Spectrometer Studies. J. Phys. Chem. 1958, 62, 1098–1101. [Google Scholar] [CrossRef]
- Bukhtiyarova, G.; Deliy, I.; Sakaeva, N.; Kaichev, V.; Plyasova, L.; Bukhtiyarov, V. Effect of the calcination temperature on the properties of Fe2O3/SiO2 catalysts for oxidation of hydrogen sulfide. React. Kinet. Catal. Lett. 2007, 92, 89–97. [Google Scholar] [CrossRef]
- Akbarzadeh, O.; Mohd Zabidi, N.; Wahab, Y.; Hamizi, N.; Chowdhury, Z.; Merican, Z.; Marlinda, A.R.; Akhter, S.; Shalauddin, M.; Johan, M. Effects of Cobalt Loading, Particle Size, and Calcination Condition on Co/CNT Catalyst Performance in Fischer-Tropsch Reactions. Symmetry 2018, 11, 7. [Google Scholar] [CrossRef] [Green Version]
- Das, S.; Ashok, J.; Du, Y.; Hidajat, K.; Kawi, S. Highly dispersed nickel catalysts via a facile pyrolysis generated protective carbon layer. Chem. Commun. 2019, 55, 6074. [Google Scholar] [CrossRef] [Green Version]
- Jourdain, V.; Bichara, C. Current understanding of the growth of carbon nanotubes in catalytic chemical vapour deposition. Carbon 2013, 58, 2–39. [Google Scholar] [CrossRef] [Green Version]
- Puskas, I.; Fleisch, T.H.; Full, P.R.; Kaduk, J.A.; Marshall, C.L.; Meyers, B.L. Novel aspects of the physical chemistry of Co/SiO2 Fischer–Tropsch catalyst preparations: The chemistry of cobalt silicate formation during catalyst preparation or hydrogenation. Appl. Catal. A Gen. 2006, 311, 146–154. [Google Scholar] [CrossRef]
- Murakami, T.; Hasebe, Y.; Kisoda, K.; Nishio, K.; Isshiki, T.; Harima, H. Effective catalyst on SiO2 in ethanol CVD for growth of single-walled carbon nanotubes. Diam. Relat. Mater. 2008, 17, 1467–1470. [Google Scholar] [CrossRef]
- Lim, S.; Ciuparu, D.; Chen, Y.; Pfefferle, L.; Haller, G.L. Effect of Co-MCM-41 Conversion to Cobalt Silicate for Catalytic Growth of Single Wall Carbon Nanotubes. J. Phys. Chem. B 2004, 108, 20095–20101. [Google Scholar] [CrossRef]
- de los Arcos, T.; Vonau, F.; Garnier, M.; Thommen, V.; Boyen, H.G.; Oelhafen, P.; Dueggelin, M.; Mathys, D.; Guggenheim, R. Influence of iron-silicon interaction on the growth of carbon nanotubes produced by chemical vapor deposition. Appl. Phys. Lett. 2002, 80, 2383–2385. [Google Scholar] [CrossRef]
- Jung, Y.; Wei, B.; Vajtai, R.; Ajayan, P.; Homma, Y.; Prabhakaran, K.; Ogino, T. Mechanism of Selective Growth of Carbon Nanotubes on SiO2/Si Patterns. Nano Lett. 2003, 3, 561–564. [Google Scholar] [CrossRef]
- Kababji, A.; Joseph, B.; Wolan, J. Silica-Supported Cobalt Catalysts for Fischer–Tropsch Synthesis: Effects of Calcination Temperature and Support Surface Area on Cobalt Silicate Formation. Catal. Lett. 2009, 130, 72–78. [Google Scholar] [CrossRef]
- Zhang, Q.; Chen, C.; Wang, M.; Cai, J.; Xu, J.; Xia, C. Facile preparation of highly-dispersed cobalt-silicon mixed oxide nanosphere and its catalytic application in cyclohexane selective oxidation. Nanoscale Res. Lett. 2011, 6, 586. [Google Scholar] [CrossRef] [PubMed] [Green Version]
- Palasantzas, G.; Vystavel, T.; Koch, S.A.; Hosson, J.D. Coalescence aspects of cobalt nanoparticles during in situ high-temperature annealing. J. Appl. Phys. 2006, 99, 024307. [Google Scholar] [CrossRef] [Green Version]
- Biesinger, M.C.; Payne, B.P.; Grosvenor, A.P.; Lau, L.W.M.; Gerson, A.R.; Smart, R.S.C. Resolving surface chemical states in XPS analysis of first row transition metals, oxides and hydroxides: Cr, Mn, Fe, Co and Ni. Appl. Surf. Sci. 2011, 257, 2717–2730. [Google Scholar] [CrossRef]
- Brundle, C.R.; Chuang, T.J.; Rice, D.W. X-ray photoemission study of the interaction of oxygen and air with clean cobalt surfaces. Surf. Sci. 1976, 60, 286–300. [Google Scholar] [CrossRef]
- Obaidullah, M.; Bahadur, N.; Furusawa, T.; Sato, M.; Sakuma, H.; Suzuki, N. Microwave assisted rapid synthesis of Fe2O3@SiO2 core-shell nanocomposite for the persistence of magnetic property at high temperature. Colloids Surf. 2019, 572. [Google Scholar] [CrossRef]
- Lin, T.-C.; Seshadri, G.; Kelber, J.A. A consistent method for quantitative XPS peak analysis of thin oxide films on clean polycrystalline iron surfaces. Appl. Surf. Sci. 1997, 119, 83–92. [Google Scholar] [CrossRef]
- Bogatyrev, V.M.; Gun’ko, V.M.; Galaburda, M.V.; Borysenko, M.V.; Pokrovskiy, V.A.; Oranska, O.I.; Polshin, E.V.; Korduban, O.M.; Leboda, R.; Skubiszewska-Zięba, J. Synthesis and characterization of Fe2O3/SiO2 nanocomposites. J. Colloid Interface Sci. 2009, 338, 376–388. [Google Scholar] [CrossRef]
- Kuivila, C.S.; Butt, J.B.; Stair, P.C. Characterization of surface species on iron synthesis catalysts by X-ray photoelectron spectroscopy. Appl. Surf. Sci. 1988, 32, 99–121. [Google Scholar] [CrossRef]
- Kerkhof, F.P.J.M.; Moulijn, J.A. Quantitative analysis of XPS intensities for supported catalysts. J. Phys. Chem. 1979, 83, 1612–1619. [Google Scholar] [CrossRef]
- Parvulescu, V. Catalytic Behavior of Metal Active Sites from Modified Mesoporous Silicas in Oxidation of Organic Compounds. In Redox; IntechOpen, Ed.: London, UK, 2019. [Google Scholar]
- Wolf, M.; Gibson, E.K.; Olivier, E.J.; Neethling, J.H.; Catlow, C.R.A.; Fischer, N.; Claeys, M. In-depth characterisation of metal-support compounds in spent Co/SiO2 Fischer-Tropsch model catalysts. Catal. Today 2020, 342, 71–78. [Google Scholar] [CrossRef] [Green Version]
- Li, Y.; Wen, J.; Ali, A.M.; Duan, M.; Zhu, W.; Zhang, H.; Chen, C.; Li, Y. Size Structure—Catalytic Performance Correlation of Supported Ni/MCF-17 Catalysts for COx-free Hydrogen Production. Chem. Commun. 2018, 54. [Google Scholar] [CrossRef]
- Xu, Z.; Ding, F. Catalyst particle size dependent carbon nanotube cloning. Carbon 2021, 175, 69–76. [Google Scholar] [CrossRef]
- Van Deelen, T.; Nijhuis, J.; Krans, N.; Zečević, J.; De Jong, K. Preparation of Cobalt Nanocrystals Supported on Metal Oxides to Study Particle Growth in Fischer-Tropsch Catalysts. ACS Catal. 2018, 8, 10581–10589. [Google Scholar] [CrossRef] [Green Version]
- Mosallanejad, S.; Dlugogorski, B.; Kennedy, E.; Stockenhuber, M. On the Chemistry of Iron Oxide Supported on γ-Alumina and Silica Catalysts. ACS Omega 2018, 3, 5362–5374. [Google Scholar] [CrossRef]
- Lee, C.J.; Lyu, S.C.; Cho, Y.R.; Lee, J.H.; Cho, K.I. Diameter-controlled growth of carbon nanotubes using thermal chemical vapor deposition. Chem. Phys. Lett. 2001, 341, 245–249. [Google Scholar] [CrossRef]
- Moodley, P.; Loos, J.; Niemantsverdriet, H.; Thüne, P.C. Is there a correlation between catalyst particle size and CNT diameter? Carbon 2009, 47, 2002–2013. [Google Scholar] [CrossRef]
- Nasibulin, A.; Pikhitsa, P.; Jiang, H.; Kauppinen, E. Correlation between catalyst particle and single-walled carbon nanotube diameters. Carbon 2005, 43, 2251–2257. [Google Scholar] [CrossRef]
- Dai, H.; Rinzler, A.G.; Nikolaev, P.; Thess, A.; Colbert, D.T.; Smalley, R.E. Single-wall nanotubes produced by metal-catalyzed disproportionation of carbon monoxide. Chem. Phys. Lett. 1996, 260, 471–475. [Google Scholar] [CrossRef]
- Costa, S.; Borowiak-Palen, E.; Kruszynska, M.; Bachmatiuk, A.; Kalenczuk, R. Characterization of carbon nanotubes by Raman spectroscopy. Mater. Sci. Pol. 2008, 26, 433–441. [Google Scholar]
- Liu, L.; Kong, L.B.; Yin, W.; Chen, Y.; Matitsine, S. Microwave Dielectric Properties of Carbon Nanotube Composites. In Carbon Nanotubes; Marulanda, J.M., Ed.; Intechopen: London, UK, 2010. [Google Scholar]
- Kuznetsov, V.; Bokova-Sirosh, S.; Moseenkov, S.I.; Ishchenko, A.; Krasnikov, D.; Kazakova, M.; Romanenko, A.; Tkachev, E. Raman spectra for characterization of defective CVD multi-walled carbon nanotubes. Phys. Status Solidi B Basic Res. 2014, 251. [Google Scholar] [CrossRef]
- Dillon, A.C.; Yudasaka, M.; Dresselhaus, M. Employing Raman Spectroscopy to Qualitatively Evaluate the Purity of Carbon Single-Wall Nanotube Materials. J. Nanosci. Nanotechnol. 2004, 4, 691–703. [Google Scholar] [CrossRef]
- Osswald, S.; Gogotsi, Y. In Situ Raman Spectroscopy of Oxidation of Carbon Nanomaterials. In Raman Spectroscopy for Nanomaterials Characterization; Kumar, C.S.S.R., Ed.; Springer: Berlin/Heidelberg, Germany, 2012; pp. 291–351. [Google Scholar]
- Collins, P. Defects and Disorder in Carbon Nanotubes. In The Oxford Handbook of Nanoscience and Technology; Oxford University Press: Oxford, UK, 2010; Volume 2. [Google Scholar]
- Kürti, J.; Kresse, G.; Kuzmany, H. First-principles calculations of the radial breathing mode of single-wall carbon nanotubes. Phys. Rev. 1998, 58, R8869–R8872. [Google Scholar] [CrossRef]
- Kuzmany, H.; Plank, W.; Hulman, M.; Kramberger, C.; Grüneis, A.; Pichler, T.; Peterlik, H.; Kataura, H.; Achiba, Y. Determination of SWCNT diameters from the Raman response of the radial breathing mode. Condens 2001, 22, 307–320. [Google Scholar] [CrossRef]
- Song, D.; Li, J. Effect of catalyst pore size on the catalytic performance of silica supported cobalt Fischer-Tropsch catalysts. J. Mol. Catal. A Chem. 2006, 247, 206–212. [Google Scholar] [CrossRef]
- Liu, Y.; Kegong, F.; Chen, J.; Sun, Y. Effect of pore size on the performance of mesoporous zirconia-supported cobalt Fischer? Tropsch catalysts. Green Chem. 2007, 9. [Google Scholar] [CrossRef]
- Ghampson, I.T.; Newman, C.; Kong, L.; Pier, E.; Hurley, K.D.; Pollock, R.A.; Walsh, B.R.; Goundie, B.; Wright, J.; Wheeler, M.C.; et al. Effects of pore diameter on particle size, phase, and turnover frequency in mesoporous silica supported cobalt Fischer–Tropsch catalysts. Appl. Catal. A Gen. 2010, 388, 57–67. [Google Scholar] [CrossRef]
- Vm, S.; Mohamed, A.R.; Abdullah, A.Z.; Chai, S.-P. Role of Reaction and Factors of Carbon Nanotubes Growth in Chemical Vapour Decomposition Process Using Methane—A Highlight. J. Nanomater. 2010, 2010, 395191. [Google Scholar] [CrossRef]
- Lin, H.-Y.; Chen, Y.-W. The mechanism of reduction of cobalt by hydrogen. Mater. Chem. Phys. 2004, 85, 171–175. [Google Scholar] [CrossRef]
- Lin, H.-Y.; Chen, Y.-W.; Li, C. The mechanism of reduction of iron oxide by hydrogen. Thermochim. Acta 2003, 400, 61–67. [Google Scholar] [CrossRef]
- Haber, J.; Block, J.H.; Delmon, B. Manual of methods and procedures for catalyst characterization (Technical Report). Pure Appl. Chem. 1995, 67, 1257–1306. [Google Scholar] [CrossRef] [Green Version]
- Shah, K.A.; Tali, B.A. Synthesis of carbon nanotubes by catalytic chemical vapour deposition: A review on carbon sources, catalysts and substrates. Mater. Sci. Semicond. Process. 2016, 41, 67–82. [Google Scholar] [CrossRef]
- Schneider, C.; Rasband, W.; Eliceiri, K. NIH Image to ImageJ: 25 years of image analysis. Nat. Methods 2012, 9, 671–675. [Google Scholar] [CrossRef] [PubMed]
- Niemelä, M.K.; Backman, L.; Krause, A.O.I.; Vaara, T. The activity of the CoSiO2 catalyst in relation to pretreatment. Appl. Catal. A Gen. 1997, 156, 319–334. [Google Scholar] [CrossRef]
- Chin, R.L.; Hercules, D.M. Surface spectroscopic characterization of cobalt-alumina catalysts. J. Phys. Chem. 1982, 86, 360–367. [Google Scholar] [CrossRef]
- Farr, N.G.; Griesser, H.J. XPS excitation dependence of measured cobalt 2p32 peak intensity due to auger peak interference. J. Electron. Spectrosc. Relat. Phenom. 1989, 49, 293–302. [Google Scholar] [CrossRef]


Publisher’s Note: MDPI stays neutral with regard to jurisdictional claims in published maps and institutional affiliations. |
© 2021 by the authors. Licensee MDPI, Basel, Switzerland. This article is an open access article distributed under the terms and conditions of the Creative Commons Attribution (CC BY) license (https://creativecommons.org/licenses/by/4.0/).