Abstract
The reburning process in a furnace, a key way to reduce NOx emissions, is a heterogeneous reaction during coal combustion, in which the heterogeneous adsorption is dominant. Zhundong coal with a high content of alkali metal can enhance the reburning process. In this paper, the influence of sodium and a defect on NO heterogeneous adsorption was studied by the density functional theory, and the thermodynamic characteristic was also analyzed. The results indicate that the binding energy for NO adsorption on the pristine graphene surface (graphene-NO), Na-decorated pristine graphene surface (graphene-Na-NO), defect graphene surface (gsv-NO) and Na-decorated defect graphene (gsv-Na-NO) is −5.86, −137.12, −48.94 and −74.85 kJ/mol, respectively, and that the heterogeneous adsorption is an exothermic reaction. Furthermore, except for covalent bonds of C and N, C and O for gsv-NO, other interactions are a closed-shell one, based on the analysis of AIM, ELF and IGM. The area of electron localization for NO is graphene-Na-NO > gsv-Na-NO > gsv-NO > graphene-NO. The dispersion interaction is the main interaction force between NO and the pristine graphene surface. The δg index for the atom pairs about N–C and O–C on the pristine graphene surface is also the smallest. The density of spikes at graphene-Na-NO is bigger than that at gsv-Na-NO. Moreover, the thermodynamics characteristic showed that the reaction equilibrium constant of graphene-NO is less than those on the other surfaces under the same temperature. Thus, NO on the pristine graphene surface is the most difficult to adsorb, but the presence of sodium and a defect structure can promote its adsorption.
1. Introduction
NOx, a common pollutant in the chemical and energy industry, can cause environmental problems such as acid rain and haze. In the energy industry, NOx commonly existing in the form of NO is mainly caused by the combustion of fossil fuels such as coal. The staged combustion technique as an effective clean combustion process has been widely used for low-NOx combustion technology. During staged combustion, the reburning process in the furnace is one of the key means to reduce NOx emissions, and the graphitized coke is formed in the reburning zone [1,2]. Coal is the main primary energy in China, and Zhundong coalfield located in Xinjiang is a huge open-pit coal mine with a storage capacity of hundreds of billions of tons, according to new discovery. The estimated reserves of 390 billion tons make it China’s largest fully packed coal field [3,4,5,6], which has abundant alkali metals that can promote the removal of NOx, such as sodium and potassium, which can promote the removal of NOx. Thus, Zhundong coal has a de-NOx effect [7,8,9].
Compared with other coals, Zhundong coal has a high alkali metal content, especially sodium. At present, scholars have mainly studied the law of release and transfer for sodium during coal pyrolysis, combustion or gasification. Chen et al. [10] investigated the conversion mechanism of sodium during coal pyrolysis and char combustion. The results revealed that sodium can release a lot of burning chars, but HCl-soluble Na may mainly occur during coal pyrolysis. Guo et al. [11] found that sodium in NaAlSiO4, NaAlSi2O6 and Na2SO4 mainly exists in bottom chars and sodium in NaCl and NaAlSiO4 may be in fly ash during the gasification of Zhundong coal. Furthermore, according to Li et al. [12], sodium is mainly volatilized in the form of NaCl (g) under the range of 600 to 800 °C burning Zhundong coal. Jiang et al. [13] revealed that sodium could be fixed in the coal ash, which could be fixed by the reaction if NaCl with other minerals, and that sodium may act as a catalyst during the pyrolysis and gasification of coal. Li et al. [14] demonstrated that high-sodium coal can reduce the release of N2O based on the experiments. Wang et al. [15] also found that the content of sodium can affect the product types during coal catalytic pyrolysis. According to Wei et al. [16], different forms of sodium can affect nitrogen transformation. The amount of HCN with NaCl additive can be higher than that with CH3COONa additive. However, the content of char-N with NaCl additive may be lower than that with CH3COONa additive. Piewak et al. [17] also investigated the effect of sodium as a catalyst on the steam gasification reactions of coal. The results revealed that the reactivity with 3 wt% of sodium additive is the highest, regardless of reaction temperature. So, exploring the catalytic mechanism of sodium on carbon is important for the clean utilization of Zhundong coal.
Density functional theory (DFT) can reveal the catalytic conversion mechanism of substances at the atomic and electronic level [18,19,20,21,22,23]. Wang et al. [18] studied the best adsorption sites and structures between CO, N2O and NH3 gases and (Cu, N)/TiO2(001) surface by DFT calculation. Zhang et al. [19] found that the ability to remove mercury is Zn < Cu < Ni by the DFT calculation. Zhang et al. [20] demonstrated that H2O molecules as the catalysis can promote the formation of H2 and OH radicals using a DFT study. According to Liu et al. [21], the intensity of Lewis acid sites for the hydrogen migration can increase during NH3 adsorption. In addition, a graphene model is normally used to simulate the carbon surface [24,25,26]. Zhao et al. [27] studied the catalytic role of Na on CO2 in graphite. The results revealed that Na may accelerate the fracture of the C–O bond during CO2 desorption. Zahra [28] also compared the adsorption characteristics of H2S on metal-doped graphene. However, the study about NO heterogeneous adsorption by the modification of Na on carbon may not be reported. Thus, NO heterogeneous adsorption on graphene can be conducted by DFT.
Since NO is an important pollutant, Zhundong coal can be used in the staged combustion technique due to its high alkali metal contents. Thus, NO heterogeneous adsorption by the modification of Na on carbon during Zhundong coal reburning was calculated by density functional theory in this paper. Additionally, the structures, interactions and thermodynamics characteristics can also be analyzed. Meanwhile, the actual carbon surface has surface defects. The point-defect on the graphene surface can therefore be considered.
2. Model and Computational Details
2.1. Graphene Surface Model
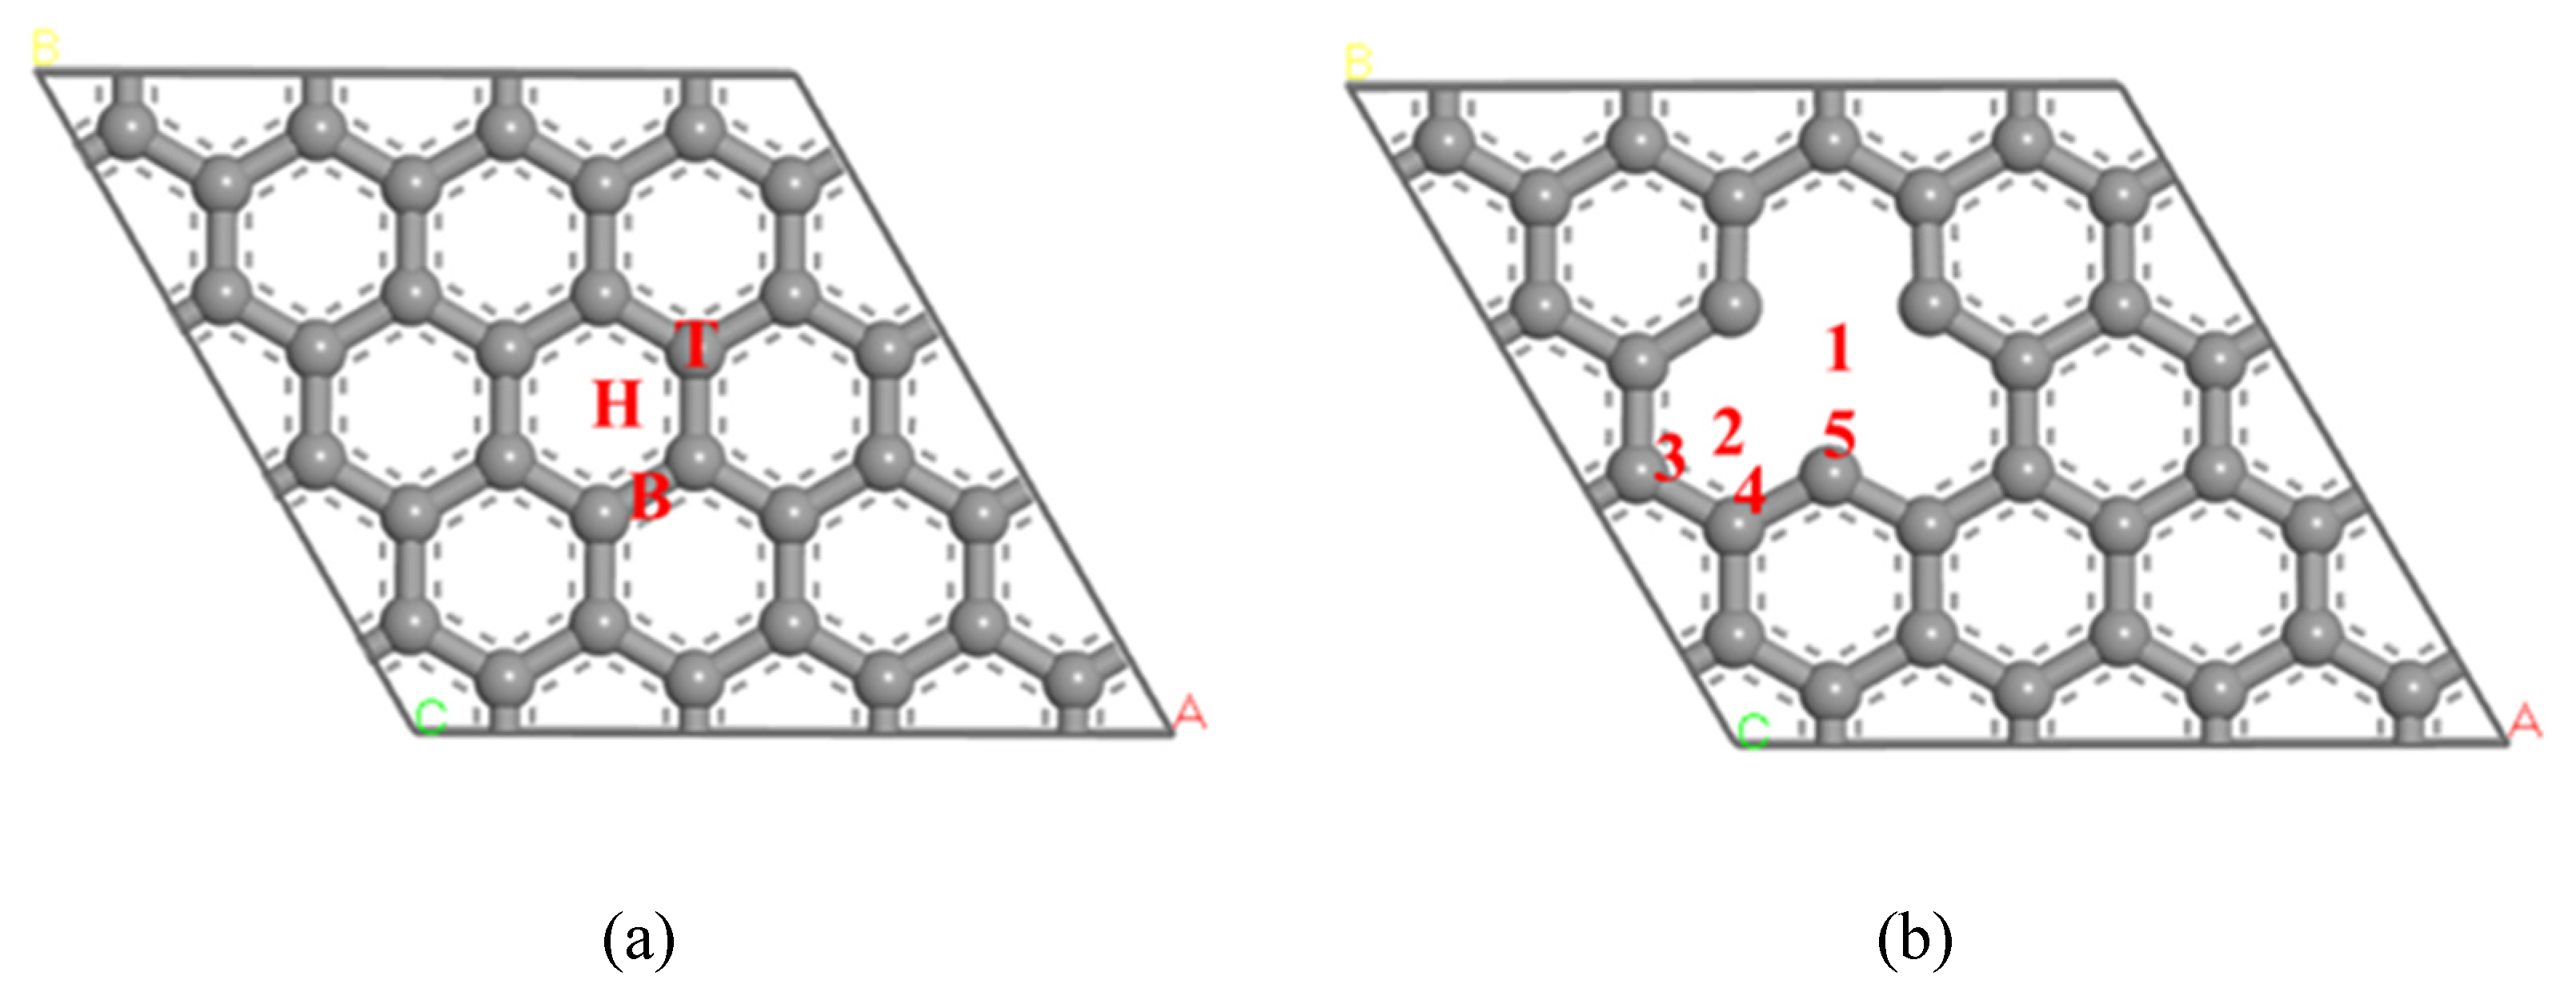
The model of 4 × 4 supercells was adopted with the size of 9.840 Å × 9.840 Å, and the thickness of the vacuum layer set to 22 Å. The exclusion of the interaction between adjacent C atomic layers was caused by the period boundary condition (PBC). According to the type of C atom on pure graphene, three adsorption sites of hollow site (H), top site (T) and bridge site (B) were set. The defect graphene surface model may be realized by deleting one C atom on the surface of pure graphene. Based on the types of the defect graphene surface, five adsorption sites (site 1, site 2, site 3, site 4 and site 5) were divided. The structures of pristine graphene and defect graphene are shown in Figure 1. Four configurations of NO molecule absorption on the pristine graphene (graphene-NO), Na-decorated pristine graphene (graphene-Na-NO), defect graphene (gsv-NO), and Na-decorated defect graphene (gsv-Na-NO) were investigated.
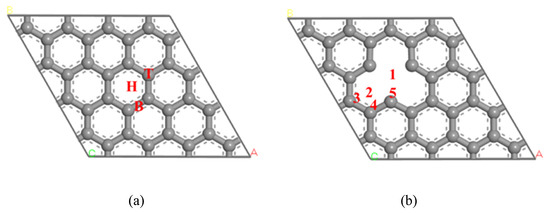
Figure 1.
The structure graphene: (a) pristine graphene; (b) defect graphene.
2.2. Calculation Method
All DFT calculations with the periodic boundary were performed by applying Vienna Ab Initio Simulation Package (VASP) code [29]. The spin unrestricted was also adopted for the calculation of the geometry optimization and properties. Additionally, the General Gradient Approximation (GGA) method with Perdew–Burke–Ernzerhof (PBE) functional for exchange and correlation interactions was calculated [30]. With the energy cutoff of the plane wave set to 500 eV, the D3(BJ) method was used to perform the dispersion correction, to describe the weak interaction. The 3 × 3 × 1 Monkhorst-Pack k-point meshes were adopted in the brillouin zone integration of the surface. The convergence criterion of SCF was 1.0 × 10⁻⁵ eV, in addition to the value of 0.02 eV/Å for the convergence tolerance of the maximum force. During the structural optimization, to reflect the reconstruction of the char surface, the cell was also optimized with the z lattice direction fixed. In addition, the wave function files of the optimized structures were generated by the ORCA program at the B3LYP-D3(BJ)/def2-TZVP level [31]. To avoid the influence of boundary in the char cluster model, we expended the original optimized structures, as shown in Figure S1, and analyzed the wave function using the Multiwfn code [32]. The thermodynamic properties of the adsorption process were obtained by the frequency calculation of the adsorbate with adsorption substrate fixed. In addition, the thermodynamic data at different temperatures were obtained by VASPKIT.
3. Results and Discussion
3.1. The Analysis of Binding Configuration and Binding Energy
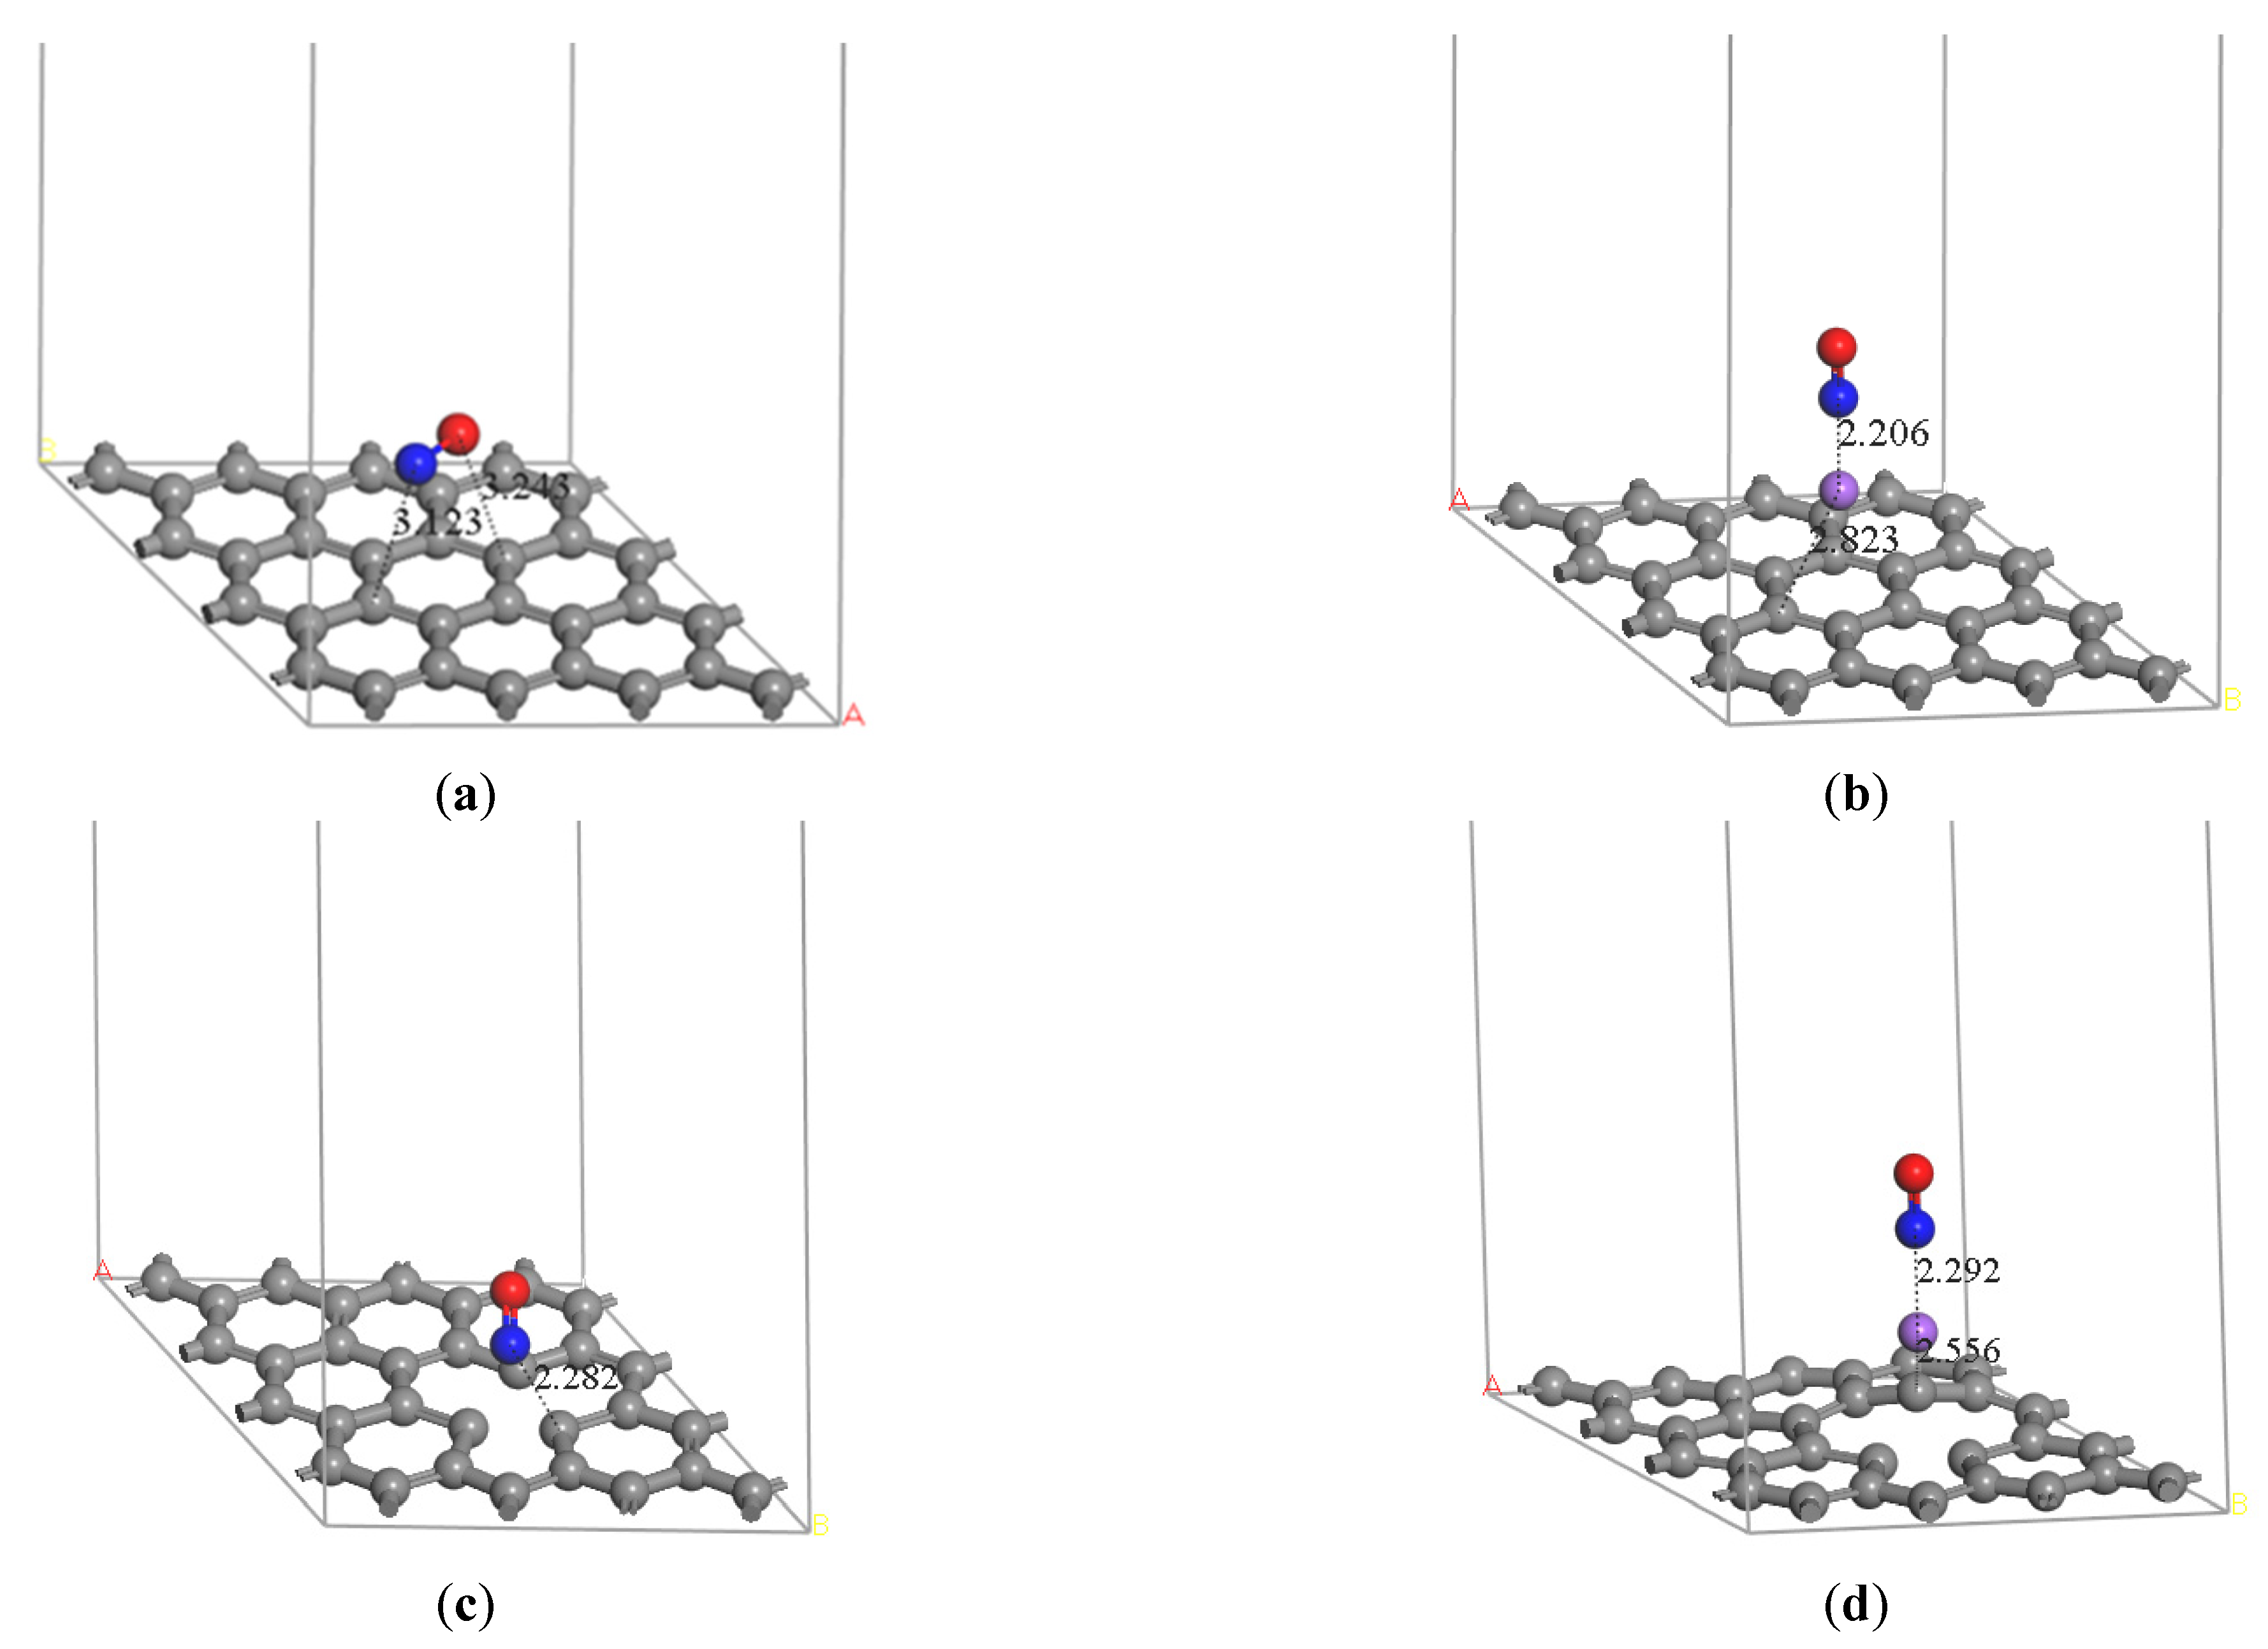
Zhundong coal can be used in the staged combustion technique due to its high alkali metal content. Thus, the heterogeneous adsorption of NO, an important pollutant, on carbon by sodium modification during Zhundong coal reburning is considered. The optimized structures of NO molecule adsorption on pristine graphene and Na-decorated pristine graphene, which are located on hollow site, are found in Figure 2a,b. The distance of N and C is 3.123 Å on the pristine graphene, and the distance of N and Na is 2.206 Å on Na-decorated pristine graphene. Considering the existence of a defect structure on the actual crystal, the optimized structures of NO molecule absorption on defect graphene and Na-decorated defect graphene are also shown in Figure 2. The distance between N and its adjacent C is 2.282 Å on the defect graphene, and the most stable position is vacant site in Figure 2c. The distance between N and Na for Na-decorated defect graphene in Figure 2d is 2.292Å, and the distance between Na and its adjacent C is 2.556 Å. Furthermore, NO on top of Na has the most optimized structure. The distance between the N atom and the pristine graphite surface is longer than that between the N atom and the defect graphite surface. NO is more easily adsorbed on the defective graphene surface. Moreover, the distance between the N atom and Na atom on the Na-decorated pristine graphene surface is shorter than that on the Na-decorated defect graphene surface. The distance between Na and the pristine graphite surface may be shorter than that between Na and the defect graphite surface. The results show that sodium is more stable on the defect graphene surface.
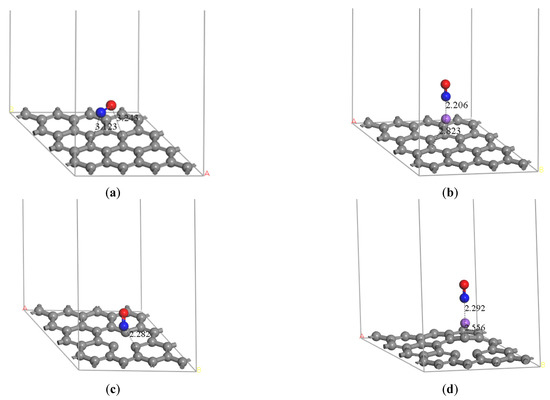
Figure 2.
Optimized structure of (a) graphene-NO, (b) graphene-Na-NO, (c) gsv-NO, and (d) gsv-Na-NO. (The gray solid spheres indicate that the graphene surface and the purple, red, and blue spheres represent sodium, oxygen and nitrogen atoms, respectively).
The binding energy for the NO molecule absorption on graphene surface can be calculated by the expression (1).
Ead = ENO+grapheme − ENO − Egraphene
Here, ENO+graphene, ENO, and Egraphene represent the energy (kJ/mol) of the total surface, NO, and graphene surface, respectively. A positive value of the adsorption energy (Ead) denotes an endothermic process, while a negative value corresponds to an exothermic one [31].
By calculation, the values of the binding energy for NO adsorption on pristine graphite surface, Na-decorated pristine graphene surface, defect graphene surface and Na-decorated defect graphene are −5.86, −137.12, −48.94 and −74.85 kJ/mol, respectively, indicating the reaction is exothermic. According to previous research, the range of the adsorption energy of the NO on the pristine graphite system is from −2.93 to −17.94 kJ/mol [33,34]. Compared with the pristine graphene surface, NO can be more easily adsorbed on the Na-decorated graphene surface and defect graphene surface. This also indicates that the presence of sodium and a defect structure can promote the adsorption of NO. NO interacts more easily with defect graphene. The defects can greatly enhance the NO adsorption capacity. However, sodium on the Na-decorated defect graphene surface is easy to stabilize on the surface of defect graphene and partly replaces the role of the carbon atom. Thus, sodium can increase the adsorption of NO on the pristine graphene surface, but it will saturate the defect surface and reduce the capacity of absorbing NO.
3.2. Atoms-in-Molecules Topology Analysis
The atoms-in-molecules (AIM) theory was also used to further analyze the adsorption process though researching the intermolecular interaction. Figure 3 shows the AIM topology maps of critical points (CPs) and bond paths, in which purple, orange, yellow, and green points represent the (3, −3), (3, −1), (3, +1), and (3, +3) CPs, respectively, with orange lines regarded as bond paths. The difference is caused by the sign of the three eigenvalues of the Hessian matrix of this function at the critical point. The second number in brackets is the number of positive eigenvalues minus the number of negative eigenvalues [35]. Figure 3 shows the CPs and bond paths between NO and surface, which indicates the existence of intermolecular interactions.
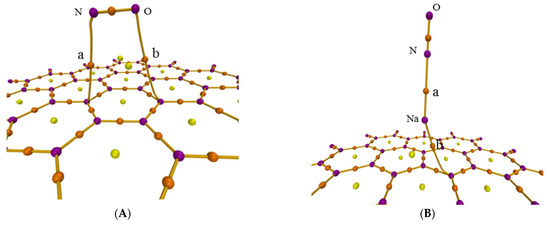
Figure 3.
AIM topology map of the adsorption configurations for (A) graphene-NO, (B) graphene-Na-NO, and (C) gsv-NO, (D) gsv-Na-NO.
There must be a (3, −1) CP of an electron density for the interaction between atoms, which is called bond critical point (BCP), the most representative point under the interatomic interaction. Thus, it can be used to investigate the characteristics of corresponding chemical bonds, strength and nature. The real space function of BCP in the AIM theory is found in Table 1. For similar interactions, the greater the values of electron density (ρ) and potential energy density (V) are, the greater the strength of the chemical bond. The ρ and V of C and N, C and O for NO adsorption on the pristine graphene surface are smaller than those on the defect graphene surface. Thus, NO is easier to form chemical bonds on the defect graphene surface. Furthermore, the ρ and V of N and Na for NO adsorption on the Na-decorated pristine graphene surface are bigger than those on the Na-decorated defect graphene surface. However, ρ and V of C and Na for NO adsorption on the Na-decorated pristine graphene surface are smaller than those on the Na-decorated defect graphene surface. So, Na can more easily form chemical bonds on defect graphene surface, but it saturates the defect surface and reduces the adsorption capacity of NO. Furthermore, the values of the Laplacian of electron density () in Table 1 are more than 0, indicating non-covalent interaction. The values of |V|/G and H/ρ can also be used to determine the form of the interaction between the fragments in the adsorption system. The closed-shell interaction is pure due to the ratio |V|/G < 1 and H > 0 [36]. The covalent bond is the main chemical bond according to the ratio 1 < |V|/G < 2 and H < 0 [37]. Thus, except for covalent bonds of C and N, C and O for NO adsorption on the defect graphene surface, other interactions are pure closed-shell ones in Table 1. H/ρ represents the energy density of the unit electron at the BCP position. This function at the BCP position is called bond degree (BD). The interaction is stronger with the increase in the value of BD under non-covalent interactions (H > 0). BD between Na and N under Na modification is more than that without Na modification. This also shows that sodium promotes the adsorption of NO on the graphene surface.

Table 1.
Values of real space function in the AIM theory.
3.3. Electron Localization Function Analysis
Electron localization function (ELF) is an important real space function for studying the electronic structure of adsorption systems [38]. It reflects the localized state of electrons. The isosurface map of ELF analysis is shown in Figure 4, where it is found that the N atom and O atom have a high localization of electrons on the pristine graphite, and NO and the pristine graphene surfaces have a poor localization of electrons. So, two centers are formed for NO adsorption on the pristine graphite surface. However, NO is close to the defect graphite surface and two obvious centers for the electron localization are not found. Compared with the pure graphene surface, NO is easier to combine with the defective graphene surface. In addition, Na and the defect graphite surface have high electron localization, indicating a strong bond between sodium and the defective graphene. Furthermore, the electronic local area of NO for the Na-decorated pristine graphene surface is significantly larger than that for the Na-decorated defect graphene surface. This shows that NO is easier to bind to the sodium-modified pristine graphene surface. Moreover, compared with the electronic local area of NO without the Na-decorated graphene surface, the electronic local area of NO on the Na-decorated graphene surface is also large. Therefore, NO can be more easily adsorbed on the graphite surface with sodium modification.
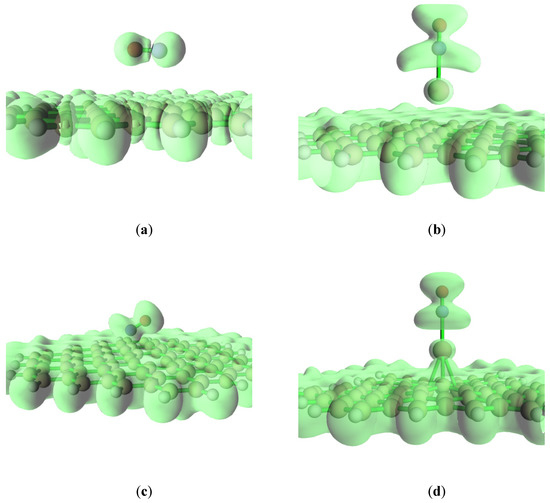
Figure 4.
The isosurface map of ELF analysis at (a) graphene-NO, (b) graphene-Na-NO, (c) gsv-NO, and (d) gsv-Na-NO.
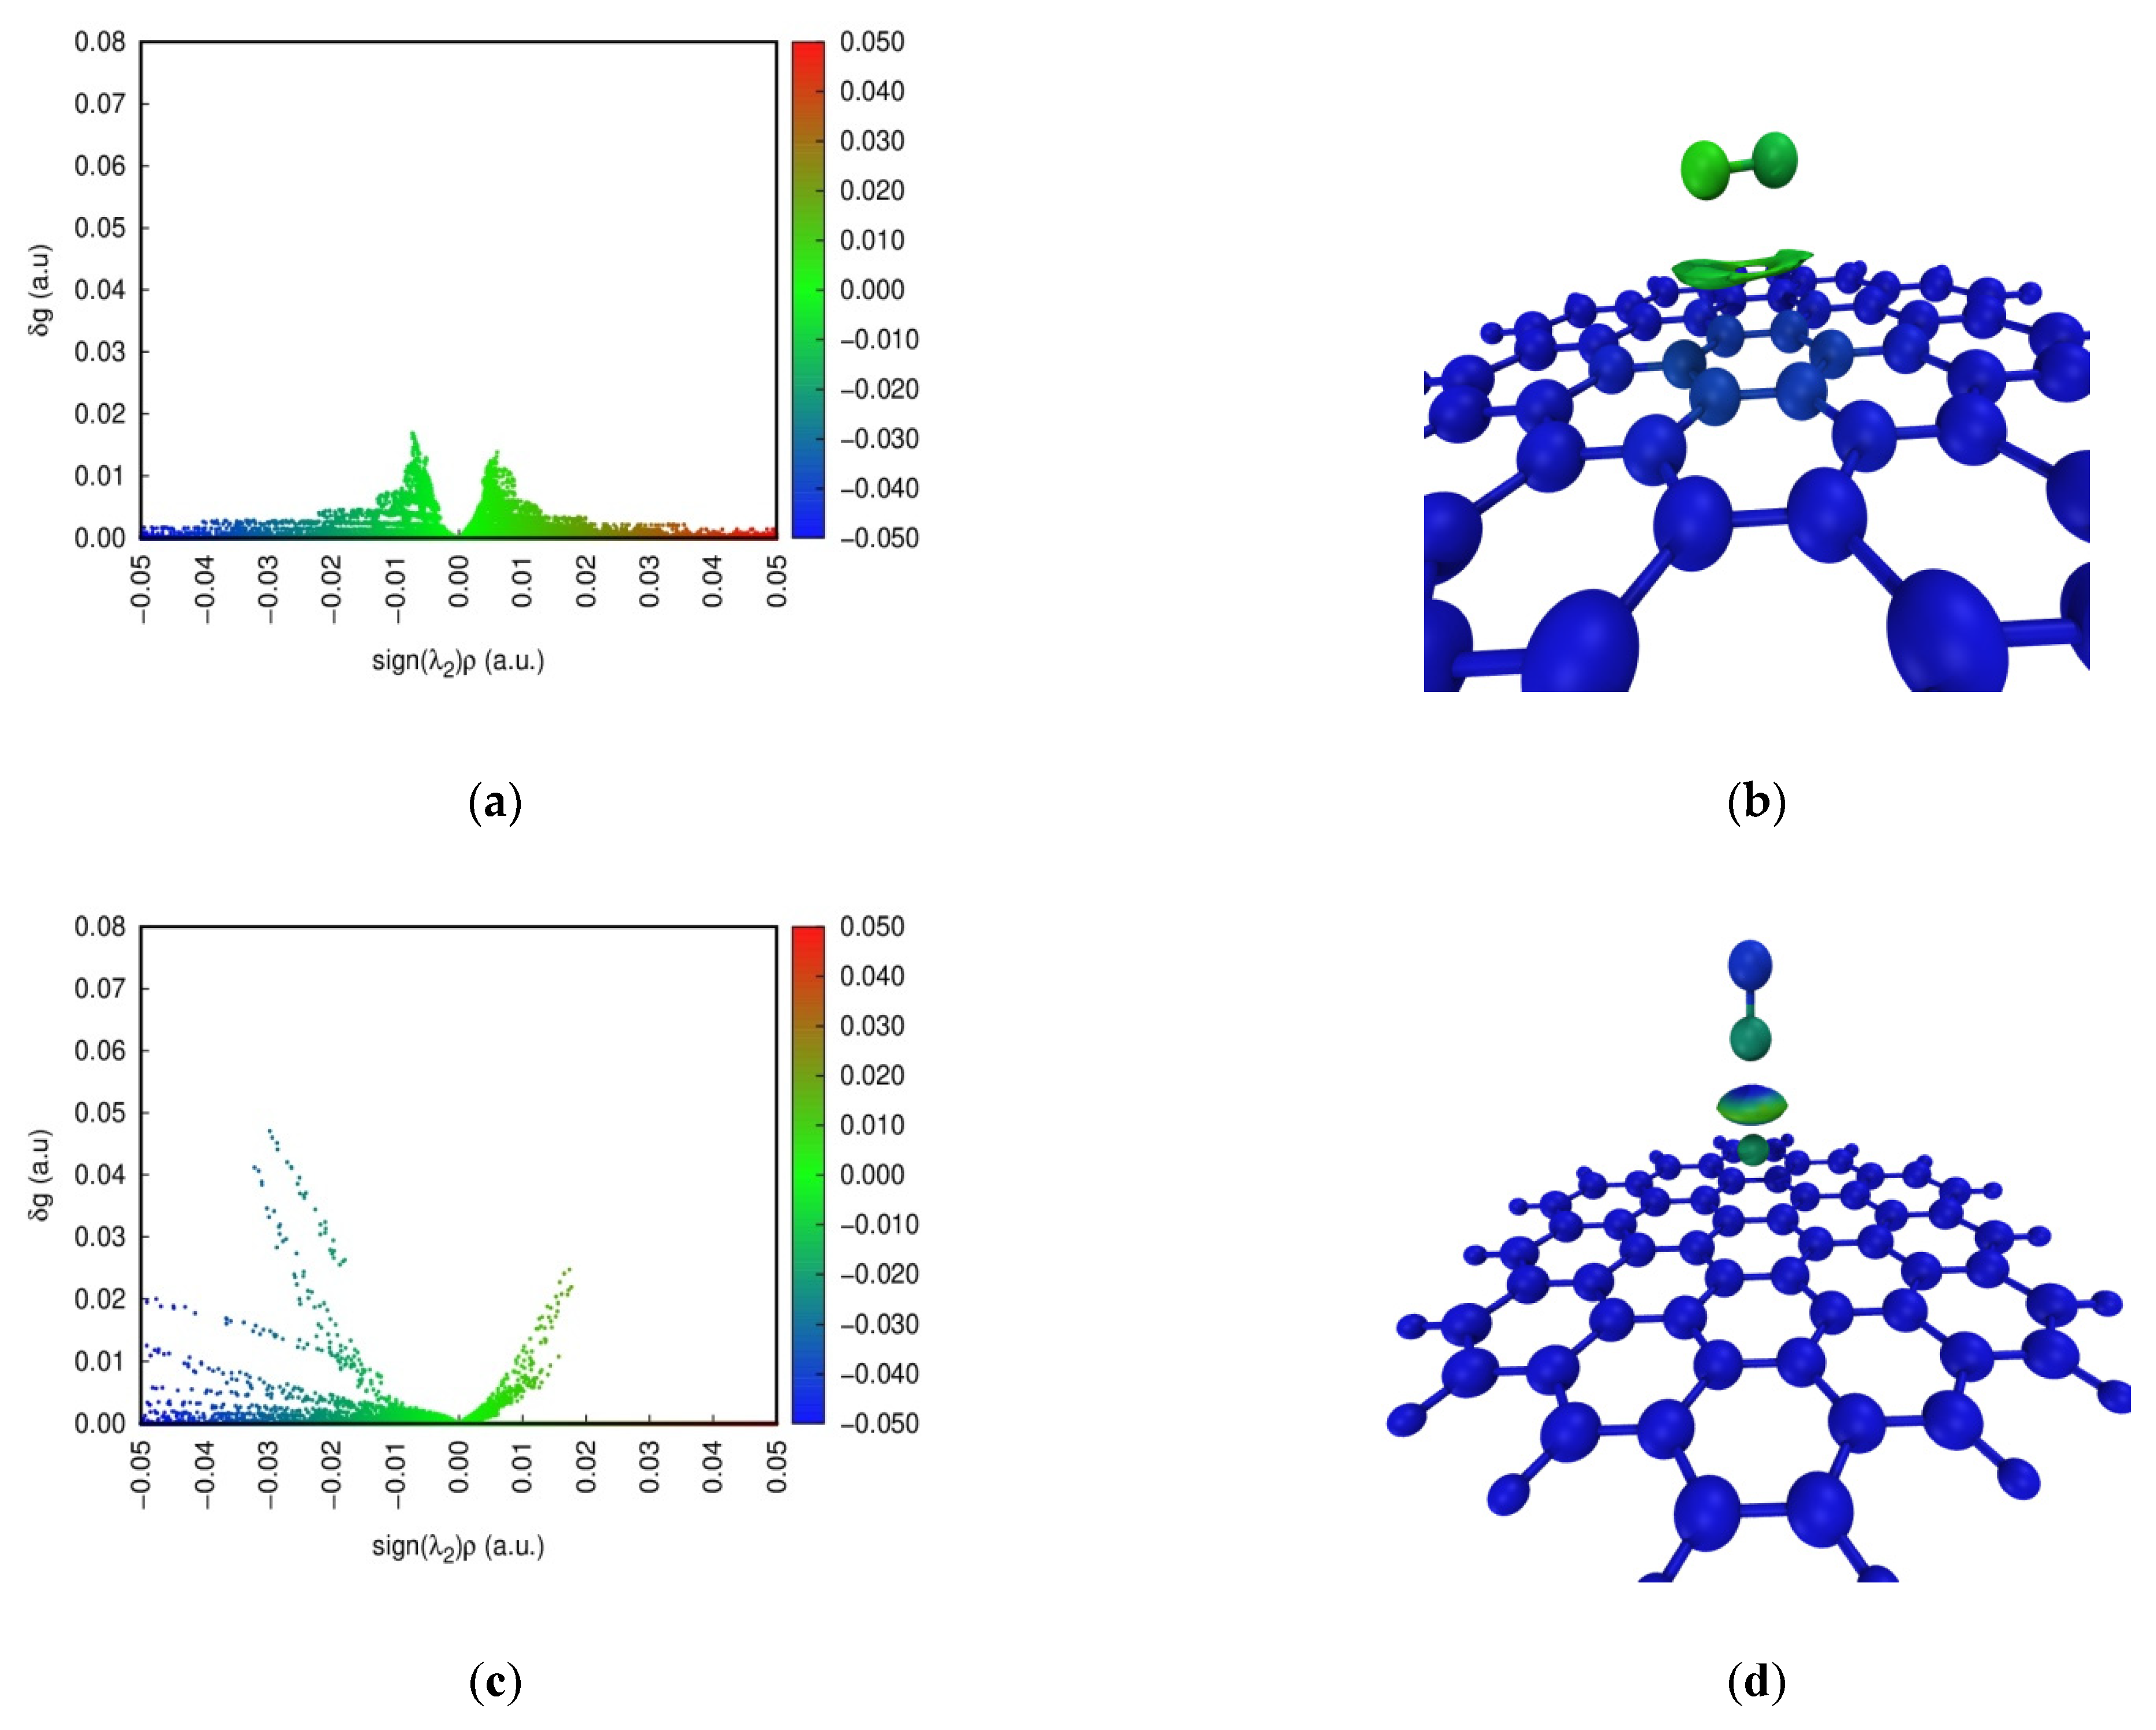
3.4. Independent Gradient Model Analysis
The Independent Gradient Model (IGM) is commonly developed to study weak interactions [39]. Color-scatter maps and isosurface maps of IGM analysis at four configurations are found in Figure 5. In the scatter diagram, sign(λ2)ρ represents the multiplication of sign(λ2) and ρ on a horizontal scale. sign(λ2) and ρ are the eigenvalue symbol of the Hessian matrix of the electron density and the electron density defined in the AIM theory, respectively. The blue, green and red parts indicate a strong interaction, a weak interaction, and repulsion in the scatter maps, respectively. The spike of NO adsorption on the pristine graphene surface can occur around 0 on a horizontal scale. This shows that dispersion is the dominant contributing term for the interaction energy, and the weak interaction is relatively small between NO and the pristine graphene surface. Furthermore, red dots for NO adsorption on the defect graphene surface appear, indicating the existence of Pauli repulsion [40]. However, blue dots for NO adsorption on the defect graphene surface can also occur at sign(λ2)ρ < 0. The larger attraction offsets the Pauli repulsion. So, the defect structure can promote the adsorption of NO. In addition, the strong interaction may be found under the sodium-modified graphene surface. The density of spikes at Na-decorated pristine graphene is bigger than that at Na-decorated defect graphene. This proves that sodium can promote the saturation of the defect graphene surface, which is consistent with the results of ELF.

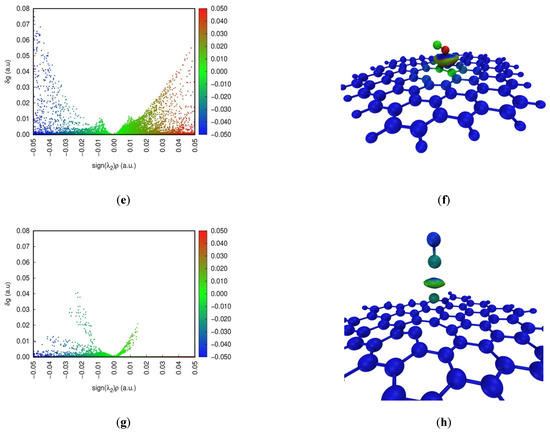
Figure 5.
Color-scatter maps and isosurface maps of IGM analysis at (a,b) graphene-NO, (c,d) graphene-Na-NO, (e,f) gsv-NO, and (g,h) gsv-Na-NO.
In addition, the weak interaction region in the adsorption system is shown by the value of δg in the isosurface diagram. The contribution of each atom to δg is also marked by color scales of blue, green and red in Figure 5, and the main contributions as the δg index are listed in Table 2. The blue, green and red parts indicate a strong interaction, a weak interaction, and repulsion, respectively. However, the blue color represents the atom with a low contribution to δg, indicating less contribution to the weak interactions. The red color for the atom represents a higher contribution to the weak interactions. The color of the isosurface maps for NO adsorption on the pristine graphene surface (Figure 5b) is only green, indicating that it is the weak interaction. However, NO adsorption on the Na-decorated graphene surface (Figure 5d,h) in the isosurface maps can be marked by colors of blue and green, indicating the presence of the strong interactions. In addition, the color of the isosurface maps for NO adsorption on the defect graphene surface (Figure 5f) includes blue, green and a little red. A small amount of red represents the occurrence of the repulsive interactions, but the larger attraction offsets the repulsion. This shows that the existence of a defect structure and sodium can increase the adsorption of NO on the graphene surface, and this is consistent with the above results. The color of the N atom is red in Figure 5f, and the δg index of the N atom is 1.54 in Table 2. So, it has a higher contribution to the weak interactions on the defect graphite surface. The value of the δg index for the N atom and Na on four configurations is bigger, but the difference of the values of the δg index between N and O for NO adsorption on the pristine graphene surface is the smallest. Furthermore, the values of the δg index for the atom pairs about N–C and O–C on the pristine graphene surface are also the smallest. Thus, NO is the most difficult to adsorb on the pristine graphene surface, and the presence of sodium and defect structures can promote the adsorption of NO.
Table 2.
The δg index of atoms and atom pairs.
3.5. The Analysis of Thermodynamics Characteristic
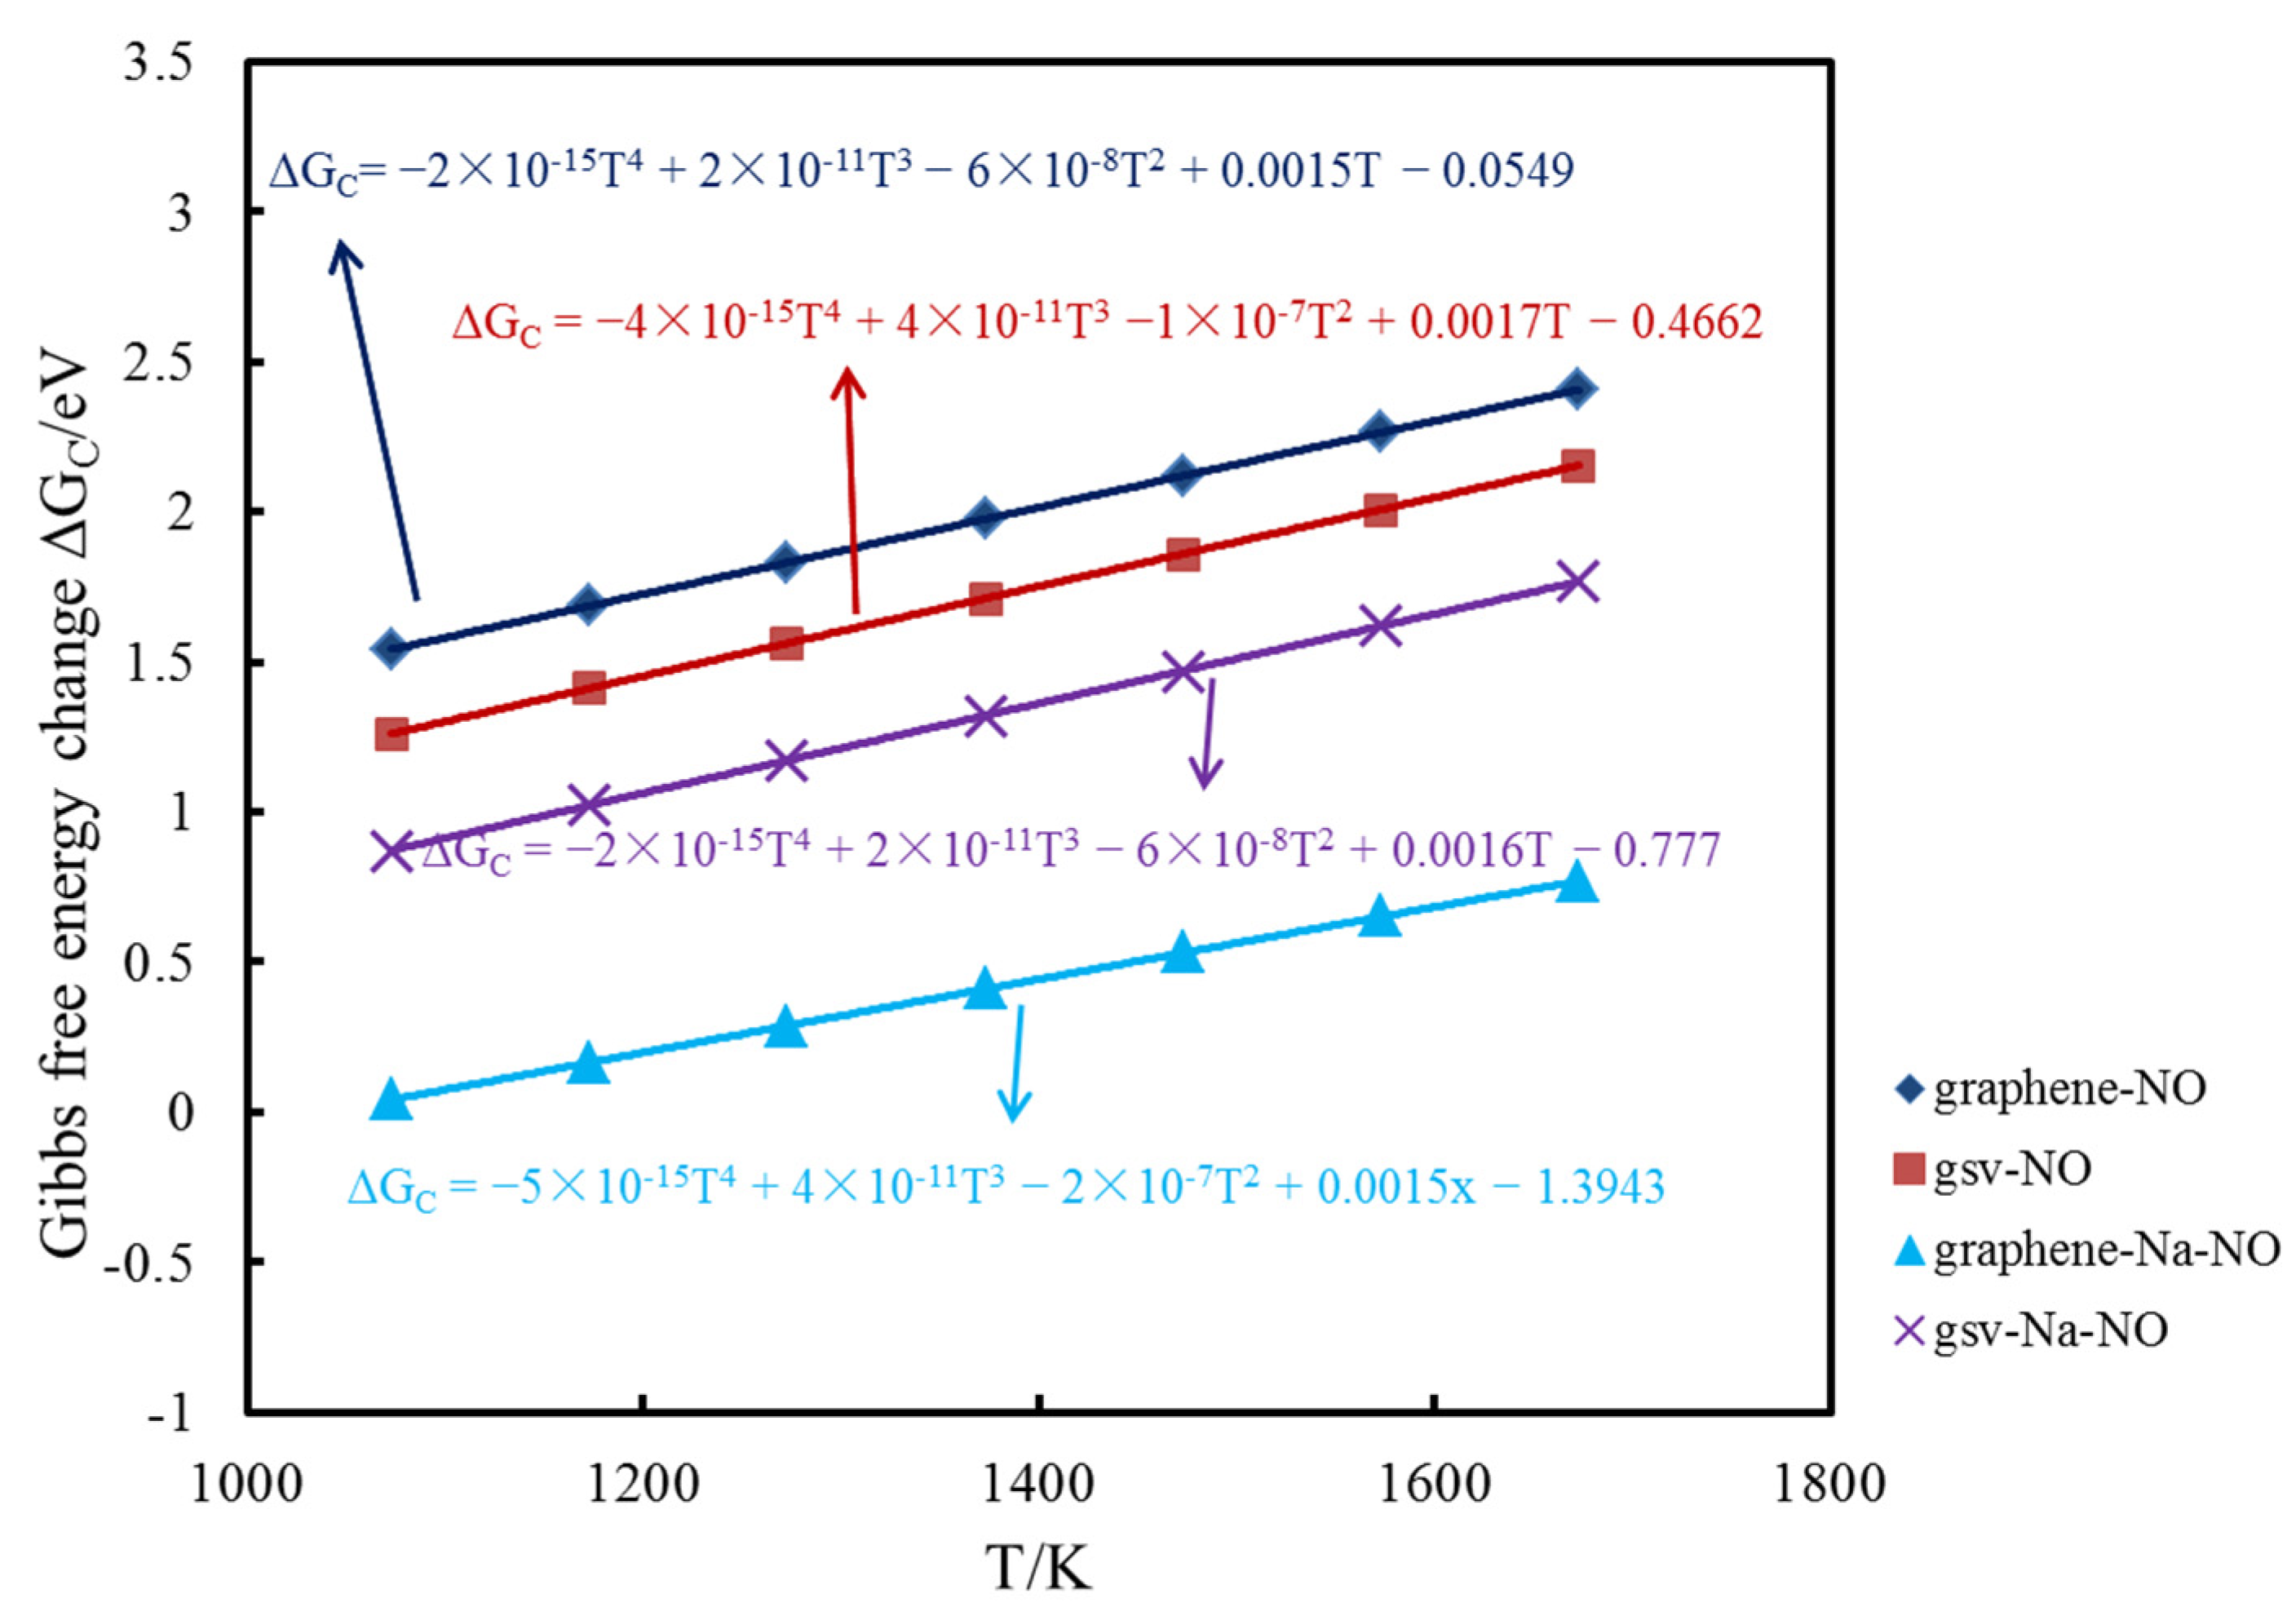
To reflect the influence of temperature, the Gibbs free energy changes of NO adsorption on the pristine, Na-decorated pristine graphene surface, defect graphene surface and Na-decorated defect graphene surface at 1073, 1173, 1273, 1373, 1473, 1573 and 1673 K were also calculated. Furthermore, the function relationship between the change of Gibbs free energy and temperature is fitted by quadratic function. The formulas of the change of Gibbs free energy under different temperatures are found in Figure 6. Gibbs free energy change is commonly used to determine the direction of the reaction. The values for the change of the Gibbs free energy of NO adsorption on different graphene surfaces at seven temperatures are positive. In addition, the value of Gibbs free energy change for each adsorption reaction increases with the increase in temperature, indicating that the adsorption capacity decreases. The value of Gibbs free energy change for NO adsorption on the Na-decorated pristine graphene surface is the lowest, followed by NO adsorption on the Na-decorated defect graphene surface. Furthermore, the value of Gibbs free energy change for NO adsorption on the pristine graphene surface is the highest at the same temperature. Thus, the existence of sodium and a defect structure can promote the adsorption of NO on the graphene surface under different temperatures.

Figure 6.
The formulas of Gibbs free energy change under different temperatures.
According to Gibbs free energy change, the chemical equilibrium constant of each reaction under different temperatures can be calculated. This value represents the ratio of the concentration of the product and the concentration of the reactant under the equilibrium. The calculation formula is as follows.
Here, Keq is the chemical equilibrium constant. represents the change of Gibbs free energy, J/mol. Additionally, R is the ideal gas constant, which is 8.314 J/(mol·K). T is the temperature, K.
The reaction equilibrium constants at 1073, 1173, 1273, 1373, 1473, 1573 and 1673 K are shown in Table 3. The results show that the chemical equilibrium constant of NO adsorption on the Na-decorated pristine graphene surface, defect graphene surface and Na-decorated defect graphene surface may decrease with the increase in the temperature. The equilibrium moves to the reverse direction with the increase in the temperature, indicating that the adsorption is an exothermic reaction, which is consistent with the binding energy. The reaction equilibrium constant of NO adsorption on the pristine graphene surface changes little with the increase in the temperature. Moreover, the reaction equilibrium constant of NO adsorption on the pristine graphene surface is the smallest compared to those on the other surfaces under the same temperature. This indicates that NO is the most difficult to adsorb on the pristine graphene surface. Furthermore, the reaction equilibrium constants for NO adsorption on the defect graphene surface are bigger than that on the pristine graphite surface at the same temperature. In addition, the reaction equilibrium constants with sodium modification are larger than that without sodium modification at the same temperature. Therefore, defect structure and sodium can promote the adsorption of NO on the graphene surface.
Table 3.
Reaction equilibrium constant of every reaction.
4. Conclusions
In this paper, by introducing the 4 × 4 graphene surface model to simulate the carbon surface, such as char surface, the heterogeneous adsorption of NO with sodium as a catalyst was theoretically studied by density functional theory. Meanwhile, the structures, interactions and thermodynamics characteristics were also analyzed. The results are shown below.
The values of the binding energy for NO adsorption on the pristine graphene surface, Na-decorated pristine graphene surface, defect graphene surface and Na-decorated defect graphene are −5.86, −137.12, −48.94 and −74.85 kJ/mol, respectively.
According to the AIM analysis, except for covalent bonds of C and N, C and O for NO adsorption on the defect graphene surface, other bonds (N and C, N and Na, Na and C) are a closed-shell interaction. Furthermore, the ELF analysis shows that Na and the defect graphite surface have high electron localization. The electronic local area of NO is graphite-Na-NO > gsv-Na-NO > gsv-NO > graphite-NO. The IGM analysis also proves the results. Dispersion is the main interaction force between NO and the pristine graphene surface. The values of the δg index for the atom pairs about N–C and O–C on the pristine graphene surface are also the smallest. The density of spikes at Na-decorated pristine graphene is bigger than that at Na-decorated defect graphene.
Moreover, the thermodynamics characteristic shows that the value of the Gibbs free energy change of each adsorption reaction increases with the increase in temperature. Furthermore, the value of Gibbs free energy change for NO adsorption on the Na-decorated pristine graphene surface is the lowest, and that on the pristine graphene surface is the highest. The reaction is exothermic according to the analysis of the reaction equilibrium constant. Thus, NO is the most difficult to adsorb on the pristine graphene surface, and the presence of sodium and a defect structure can promote the adsorption of NO. This provides theoretical guidance for actual operating conditions and the clean utilization of Zhundong coal.
Supplementary Materials
The following are available online at https://www.mdpi.com/article/10.3390/catal11091046/s1, Figure S1: The optimized structures at (a) graphene-NO, (b) graphene-Na-NO, (c) gsv-NO, (d) gsv-Na-NO.
Author Contributions
Conceptualization, X.K., Y.W. and F.H.; methodology, X.K., J.J., Y.W., Y.L. and F.H.; validation, Y.W., Y.L. and F.H.; formal analysis, X.K., J.J., Y.W. and Y.L.; data curation, X.K., J.J. and F.H.; writing—original draft preparation, X.K.; writing—review and editing, X.K. and Y.L.; supervision, J.J. All authors have read and agreed to the published version of the manuscript.
Funding
This research was funded by Natural Science Foundation of China, grant number 51976129 and 22008190. Furthermore, this research was also funded by Natural Science Foundation of Shandong, China Postdoctoral Science Foundation and Natural Science Foundation of Shaanxi Province, grant number ZR2020QE200, 2019TQ0248, 2019M663735 and 2020JQ-038.
Data Availability Statement
Data is contained within the article or supplementary material.
Acknowledgments
Thank you very much for the Supercomputing Center of University of Shanghai for Science and Technology.
Conflicts of Interest
The authors declare no conflict of interest.
References
- Liu, L.; Jin, J.; Lin, Y.; Hou, F.; Li, S. The effect of calcium on nitric oxide heterogeneous adsorption on carbon: A first-principles study. Energy 2016, 106, 212–220. [Google Scholar] [CrossRef]
- Fan, W.; Chen, J.; Feng, Z.; Wu, X.; Liu, S. Effects of reburning fuel characteristics on NOx emission during pulverizedcoal combustion and comparison with air-staged combustion. Fuel 2020, 265, 117007. [Google Scholar] [CrossRef]
- Wang, Y.; Jin, J.; Kou, X.; Fengxiao, H. Understanding the mechanism for the formation of initial deposition burning Zhundong coal: DFT calculation and experimental study. Fuel 2020, 269, 117045. [Google Scholar]
- Zhang, H.; Xian, S.; Fan, Y.; Dong, P.; Zhu, Z. A perspective on sodium-induced agglomeration of Zhundong coal gasification: Experiments and calculations. J. Energy Inst. 2021, 94, 39–48. [Google Scholar] [CrossRef]
- Kang, Z.; Ding, X. Numerical analysis on combustion process and sodium transformation behavior in a 660 MW supercritical face-fired boiler purely burning high sodium content Zhundong coal. J. Energy Inst. 2020, 93, 450–462. [Google Scholar] [CrossRef]
- Wang, Y.; Jin, J.; Liu, D.; Yang, H.; Kou, X. Understanding ash deposition for Zhundong coal combustion in 330 MW utility boiler: Focusing on surface temperature effects. Fuel 2018, 216, 697–706. [Google Scholar] [CrossRef]
- Wang, Y.; Jin, J.; Liu, D.; Yang, H.; Li, S. Understanding ash deposition for the combustion of Zhundong coal: Focusing on different additives effects. Energy Fuels 2018, 32, 7103–7111. [Google Scholar] [CrossRef]
- Lv, Y.; Niu, Y.; Li, S.; Lei, Y.; Li, P. Effects of leaching and additives on the formation of deposits on the heating surface during high-Na/Ca Zhundong coal combustion. J. Energy Inst. 2020, 94, 319–328. [Google Scholar]
- Hong, D.; Si, T.; Guo, X. Insight into the calcium carboxylate release behavior during Zhundong coal pyrolysis and combustion—ScienceDirect. Proc. Combust. Inst. 2021, 38, 4023–4032. [Google Scholar] [CrossRef]
- Chen, Y.; Luo, Z.; Fang, M.; Wang, Q. Migration and transformation of sodium during staged coal combustion of Zhundong coal and influence of carbon coating. Fuel Process. Technol. 2020, 203, 106382. [Google Scholar] [CrossRef]
- Guo, X.; Zhang, H.; Zhu, Z. The effect of O2/C ratio on gasification performance and sodium transformation of Zhundong coal. Fuel Process. Technol. 2019, 193, 31–38. [Google Scholar] [CrossRef]
- Li, G.; Yan, Y.; Jin, X.; Liu, Y.; Che, D. Release and transformation of sodium during combustion of Zhundong coals. J. Energy Inst. 2016, 89, 48–56. [Google Scholar] [CrossRef]
- Jiang, F.; Zhang, S.; Huang, X.; Wang, C.; Li, H.; Zhang, Y. Sodium vapor capture by coal ash during sodium-rich coal combustion. Appl. Therm. Eng. 2019, 161, 114127. [Google Scholar] [CrossRef]
- Li, W.; Liu, D.; Li, S.; Kong, R.; Ding, H. The role of alkali metal in N2O and NO emission during high-sodium Zhundong coals oxy-fuel circulating fluidized bed combustion. Fuel 2020, 279, 118443. [Google Scholar] [CrossRef]
- Wang, D.; Wang, D.; Yu, J.; Chen, Z.; Li, Y.; Gao, S. Role of alkali sodium on the catalytic performance of red mud during coal pyrolysis. Fuel Process. Technol. 2019, 186, 81–87. [Google Scholar] [CrossRef]
- Wei, L.; Cui, B.; Guo, L.; Sun, Y. Effect of sodium on three-phase nitrogen transformation during coal pyrolysis: A qualitative and semi-quantitative investigation. Fuel Process. Technol. 2020, 213, 106638. [Google Scholar] [CrossRef]
- Piewak, K.; Czerski, G.; Porada, S. Effect of K, Na and Ca-based catalysts on the steam gasification reactions of coal. Part I: Type and amount of one-component catalysts. Chem. Eng. Sci. 2021, 229, 116024. [Google Scholar]
- Wang, X.; Yang, X.; Li, X.; Xue, X. DFT investigation of the adsorption of CO, N2O and NH3 Gases On (Cu, N)/TiO2(001). Acta Sci. Natralium Univ. Sunyatseni 2015, 54, 87–92. [Google Scholar]
- Zhang, Y.; Zhao, Y.; Yang, Y.; Liu, P.; Liu, J.; Zhang, J. DFT study on Hg0 adsorption over graphene oxide decorated by transition metals (Zn, Cu and Ni). Appl. Surf. Sci. 2020, 525, 146519. [Google Scholar] [CrossRef]
- Zhang, J.; Weng, X.; Han, Y.; Li, W.; Cheng, J.; Gan, Z.; Gu, J. The effect of supercritical water on coal pyrolysis and hydrogen production: A combined ReaxFF and DFT study. Fuel 2013, 108, 682–690. [Google Scholar] [CrossRef]
- Liu, H.; You, C.; Wang, H. Time-resolved in-situ IR and DFT study: NH3 adsorption and redox cycle of acid site on vanadium-based catalysts for NO abatement via selective catalytic reduction. Chem. Eng. J. 2020, 282, 122756. [Google Scholar] [CrossRef]
- Liu, T.; Yang, R.; Zhang, G.; Wu, W.; Yang, Z.; Lin, R.; Wang, X.; Jiang, Y. Mechanism of Selective Catalytic Reduction of NOx with NH3 over CeO2-TiO2: Insight from In-situ DRIFTS and DFT calculations. Appl. Surf. Sci. 2021, 568, 150764. [Google Scholar] [CrossRef]
- Geng, H.; Li, L.; Li, G.; Wei, Y.; Fan, H.; Jin, L.; Hu, H. Pyrolysis behaviors of coal-related model compounds catalyzed by pyrite. Fuel 2020, 262, 116526. [Google Scholar] [CrossRef]
- Nachimuthu, S.; Lai, P.; Jiang, J. Efficient hydrogen storage in boron doped graphene decorated by transition metals e a first-principles study. Carbon 2014, 73, 132–140. [Google Scholar] [CrossRef]
- Suman, H.; Srivastava, R.; Shrivastava, S.; Srivastava, A.; Jacob, A.P.; Malvi, C.S. DFT analysis of H2S adsorbed zigzag and armchair graphene nanoribbons. Chem. Phys. Lett. 2020, 745, 137280. [Google Scholar] [CrossRef]
- Valencia, H.; Gil, A.; Frapper, G. Trends in the hydrogen activation and storage by adsorbed 3D transition metal atoms onto graphene and nanotube surfaces: A DFT study and molecular orbital analysis. J. Phys. Chem. C 2015, 119, 5506–5522. [Google Scholar] [CrossRef]
- Zhao, D.; Liu, H.; Sun, C.; Xu, L.; Cao, Q. DFT study of the catalytic effect of Na on the gasification of carbon–CO2. Combust. Flame 2018, 197, 471–486. [Google Scholar] [CrossRef]
- Zahra, K. Evaluation of H2S sensing characteristics of metals-doped graphene and metals-decorated graphene: Insights from DFT study. Phys. E Low Dimens. Syst. Nanostruct. 2018, 99, 261–268. [Google Scholar]
- Kresse, G.; Furthmüller, J. Efficient iterative schemes for ab initio total-energy calculations using a plane-wave basis set. Phys. Rev. B Condens. Matter 1996, 54, 11169. [Google Scholar] [CrossRef]
- Hou, F.; Jin, J.; Liu, D.; Kou, X.; Yang, H.; Wang, Y. Understanding CO heterogeneous adsorption on the reduced CaSO4(010) surface for chemical-looping combustion: A first-principles study. Ind. Eng. Chem. Res. 2020, 59, 20022–20032. [Google Scholar] [CrossRef]
- Neese, F. Software update: The ORCA program system, version 4.0. Wiley Interdiscip. Rev. Comput. Mol. Sci. 2018, 8, 1327. [Google Scholar] [CrossRef]
- Tian, L.; Chen, F. Multiwfn: A multifunctional wavefunction analyzer. J. Comput. Chem. 2012, 33, 580–592. [Google Scholar]
- Leenaerts, O.; Partoens, B.; Peeters, F. Adsorption of H2O, NH3, CO, NO2, and NO on graphene: A first-principles study. Phys. Rev. B 2008, 77, 125416–125420. [Google Scholar] [CrossRef] [Green Version]
- Brown, C.; Hall, P.G. Physical adsorption of nitric oxide on graphite and silica and adsorption of gases on nitric oxide preadsorbed on carbon. J. Colloid Interface Sci. 1973, 42, 334–341. [Google Scholar] [CrossRef]
- Liu, L.; Jin, J.; Hou, F.; Li, S.; Lee, C.H. Catalytic effects of calcium and potassium on a curved char surface in fuel reburning: A first-principles study on the adsorption of nitric oxide on single-wall carbon nanotubes with metal decoration. Energy 2017, 125, 459–469. [Google Scholar] [CrossRef]
- Espinosa, E.; Alkorta, I.; Elguero, J.; Molins, E. From weak to strong interactions: A comprehensive analysis of the topological and energetic properties of the electron density distribution involving X–HF–Y systems. J. Chem. Phys. 2002, 117, 5529–5542. [Google Scholar] [CrossRef]
- Jenkins, S.; Morrison, I. The chemical character of the intermolecular bonds of seven phases of ice as revealed by ab initio calculation of electron densities. Chem. Phys. Lett. 2000, 317, 97–102. [Google Scholar] [CrossRef]
- Johnson, E.R.; Keinan, S.; Mori-Sanchez, P.; Contreras-García, J.; Cohen, A.J.; Yang, W. Revealing noncovalent interactions. J. Am. Chem. Soc. 2010, 132, 6498. [Google Scholar] [CrossRef] [Green Version]
- Ponce-Vargas, M.; Klein, J.; Hénon, E. Novel approach to accurately predict bond strength and ligand lability in platinum-based anticancer drugs. Dalton Trans. 2020, 49, 12632–12642. [Google Scholar] [CrossRef]
- Rackers, J.A.; Ponder, J.W. Classical Pauli repulsion: An anisotropic, atomic multipole model. J. Chem. Phys. 2019, 150, 084104. [Google Scholar] [CrossRef]


Publisher’s Note: MDPI stays neutral with regard to jurisdictional claims in published maps and institutional affiliations. |
© 2021 by the authors. Licensee MDPI, Basel, Switzerland. This article is an open access article distributed under the terms and conditions of the Creative Commons Attribution (CC BY) license (https://creativecommons.org/licenses/by/4.0/).