Article

Effect of Pd and Ir as Promoters in the Activity of Ni/CeZrO2 Catalyst for the Reverse Water-Gas Shift Reaction

by
Lucy Idowu Ajakaiye Jensen
*,
Sara Blomberg
and
Christian Hulteberg
Department of Chemical Engineering, Lund University, P.O. Box 124, 221 00 Lund, Sweden
*
Author to whom correspondence should be addressed.
Catalysts 2021, 11(9), 1076; https://doi.org/10.3390/catal11091076
Submission received: 30 July 2021 / Revised: 2 September 2021 / Accepted: 2 September 2021 / Published: 7 September 2021

Abstract

:
Catalytic conversion of CO2 to CO using reverse water gas shift (RWGS) reaction is a key intermediate step for many CO2 utilization processes. RWGS followed by well-known synthesis gas conversion may emerge as a potential approach to convert CO2 to valuable chemicals and fuels. Nickel (Ni) based catalysts with ceria-zirconia (Ce-Zr) support can be used to tune the metal-support interactions, resulting in a potentially enhanced CO2 hydrogenation rate and elongation of the catalyst lifespan. The thermodynamics of RWGS reaction is favored at high temperature for CO2 conversion. In this paper the effect of Palladium (Pd) and Iridium (Ir) as promoters in the activity of 10 wt%Ni 2 wt%Pd 0.1wt%Ir/CeZrO2 catalyst for the reverse water gas shift reaction was investigated. RWGS was studied for different feed (CO2:H2) ratios. The new active interface between Ni, Pd and Ir particles is proposed to be an important factor in enhancing catalytic activity. 10 wt%Ni 2 wt%Pd 0.1 wt%Ir/CeZrO2 catalyst showed a better activity with CO2 conversion of 52.4% and a CO selectivity of 98% for H2:CO2 (1:1) compared to the activity of 10%Ni/CeZrO2 with CO2 conversion of 49.9% and a CO selectivity of 93%. The catalytic activity for different feed ratios using 10 wt%Ni 2 wt%Pd 0.1 wt%Ir/CeZrO2 were also studied. The use of palladium and iridium boosts the stability and life span of the Ni-based catalysts. This indicates that the catalyst could be used potentially to design RWGS reactors for CO2 utilization units.

1. Introduction

Climate change and global warming are environmental issues caused by the most widely known greenhouse gas carbon dioxide (CO2). An important goal for the earth’s sustainability is reducing the emission of CO2 [1]. Utilization of CO2 can be a promising way to decrease global warming threats, but it requires energy to transform CO2 as a cheap, non-toxic source for the production of biofuels. A feasible solution for CO2 conversion that has been proposed is the Fischer-Tropsch (F-T) process [2]. Syngas (H2/CO) obtained from reverse water gas shift (RWGS) reaction with H2 as main raw material is converted into valuable fuels [3,4].
Synthesis gas production by using the stoichiometric RWGS reaction with the aim of CO2 efficiency is a key intermediate step for many CO2 utilization processes. RWGS which converts H2 and CO2 to renewable energy sources, has been proposed in equation [1,5].
CO2 is a kinetically and thermodynamically stable molecule, thus CO2 conversion
CO2 + H2 ↔ CO + H2O   ∆H°298 = 41.2 kJ/mol
reactions are endothermic and need efficient catalyst to avoid side reactions such as methanation and carbon formation [6]. The maximal conversion, selectivity and the reversibility of the RWGS reaction is typically governed by thermodynamic equilibrium. Reaction temperature is one of the factors that influences the conversion of CO2 to CO [5]. Even though a higher level of conversion due to the endothermic reaction are effectively obtained at higher temperature reactions, a less energy consuming process at lower temperatures will be preferred. This is because the cascade utilization of thermal energy is more difficult with RWGS reaction operating at high temperature [1].
In several RWSG publications recently, transition metal such as Ni has gained the reputation for high activity, economic viability and higher availability compared to noble metals such as Rh, Ru, Pt, Re and Pd [7]. Noble metals have also been studied and are typically found to be much more resistant to carbon deposition than Ni catalysts, but are generally uneconomical [8,9,10], especially with the resent surges in precious metal cost. The main challenge that prevents the industrial process from being used is that supported Ni catalysts deactivated easily due to carbon deposition and/or metal sintering [11]. Thus, Ni based catalysts using promoters such as transition metals are under investigation, in order to improve both their activity and their selectivity with the objective of avoiding or, at least hindering coke formation thereby improving the catalyst stability [12,13,14]. Recent research work in RWGS shows that compared to other bimetallic Ni-based catalysts such as NiRh and NiPt, NiPd bimetallic catalyst exceed performance. This can be attributed to the stability of NiPd which helps improve the reducibility of NiO. These benefits increased metal distribution and chemisorption of H2 [15].
Over the years in the area of heterogeneous catalysis, it has been discovered that metal catalyst distributed over ion-conduction supports possess activities for several catalytic reactions which also includes RWGS reaction [5]. This is much higher than those dispersed on inert supports [16]. CeO2, ZrO2 and TiO2 supports that shows outstanding ionic or mixed ionic-electronic conductivity are gradually substituting the classical non-conducting supports (Al2O3 and SiO2) [17,18].
In this work, the effect of palladium and iridium as promoter in the activity and selectivity of 10 wt%Ni 2 wt%Pd 0.1 wt%Ir/CeZrO2 catalysts for the RWGS was investigated. The study aims to analyze the catalytic properties of Ni-Pd-Ir systems, focusing in particular on the promoting effects induced by the presence of Pd and Ir in the catalyst formulation. This is complemented by the characterization of the catalyst before reaction by H2-TPR to obtain possible changes occurring during the course of the reaction on the interaction with the reactant mixture.

2. Results and Discussion

2.1. XRD Analysis

The XRD pattern of 10 wt%Ni 2 wt%Pd 0.1 wt%Ir/CeZrO2 and 10 wt%Ni/CeZrO2 catalysts were presented in Figure 1. NiO peaks are present at 2θ = 37.3°, 43.3°, 62.9°, 75.4°, 79.4° [19]. These illustrated peaks corresponded to the NiO planes of (111), (200), (220) and (222). NiO peaks in solid-solutions with lesser intensity highlighted a good distribution of NiO crystallites in the catalyst [20]. The characteristic peaks of CeO2 are visible at 2θ = 48.5° and 57.5° show a cubic phase which correlate with crystals planes of (220) and (311) [21]. ZrO2 exhibited typical peaks of a tetragonal phase at 2θ = 29.5° and 34° corresponding to crystals with planes of (111) and (200) [22]. The diffraction peak of Pd (220) is observed at 68.5° [23]. The XRD peak comprises of a sequence of slim peaks stipulating non-homogeneity of the nanoparticles. This occurrence results to widening of XRD peaks as well as crystalline size [24].

2.2. BET-BJH Measurements

The specific surface area of fresh and spent 10 wt%Ni 2 wt%Pd 0.1 wt%Ir/CeZrO2 and 10 wt%Ni/CeZrO2 catalysts prepared in this work are presented in Table 1. Using ceria-zirconia as a permeable support enables Ni, Pd and Ir to be distributed over a broad surface area. The surface area (SBET) of fresh samples were approximately 95 and 100 m2/g while spent samples were 35 and 41 m2/g, respectively. The surface area for spent catalysts appeared lower compared to the fresh catalysts. For 10 wt%Ni 2 wt%Pd 0.1 wt%Ir/CeZrO2 catalyst, spent catalyst was less than the fresh catalyst by 63.2%, while spent 10 wt%Ni/CeZrO2 catalyst is lower than the fresh catalyst by 59%. The reduction in surface area of both spent catalysts can be an indication of the catalysts polluted by coke formation. BJH method was used to estimate the pore volume of both fresh and spent catalysts at 0.19, 0.20, 0.17 and 0.20 cm3/g, respectively, plus an average pore size of 78, 170 and 159 Å. This stipulates that the material possess a mesoporous nature. High specific surface area is one of the most important characteristics for catalytic reactions, and it is very important to keep high catalytic performance for the catalysts [25]. Bastan et al. [20], observed Ni/CeZrO2 sample exhibited larger surface area than Ni/CeO2 or Ni/ZrO2 samples. This could be a matter of the CeZrO2 support itself that determine how small and porous the initial crystals are formed.

2.3. H2-TPR

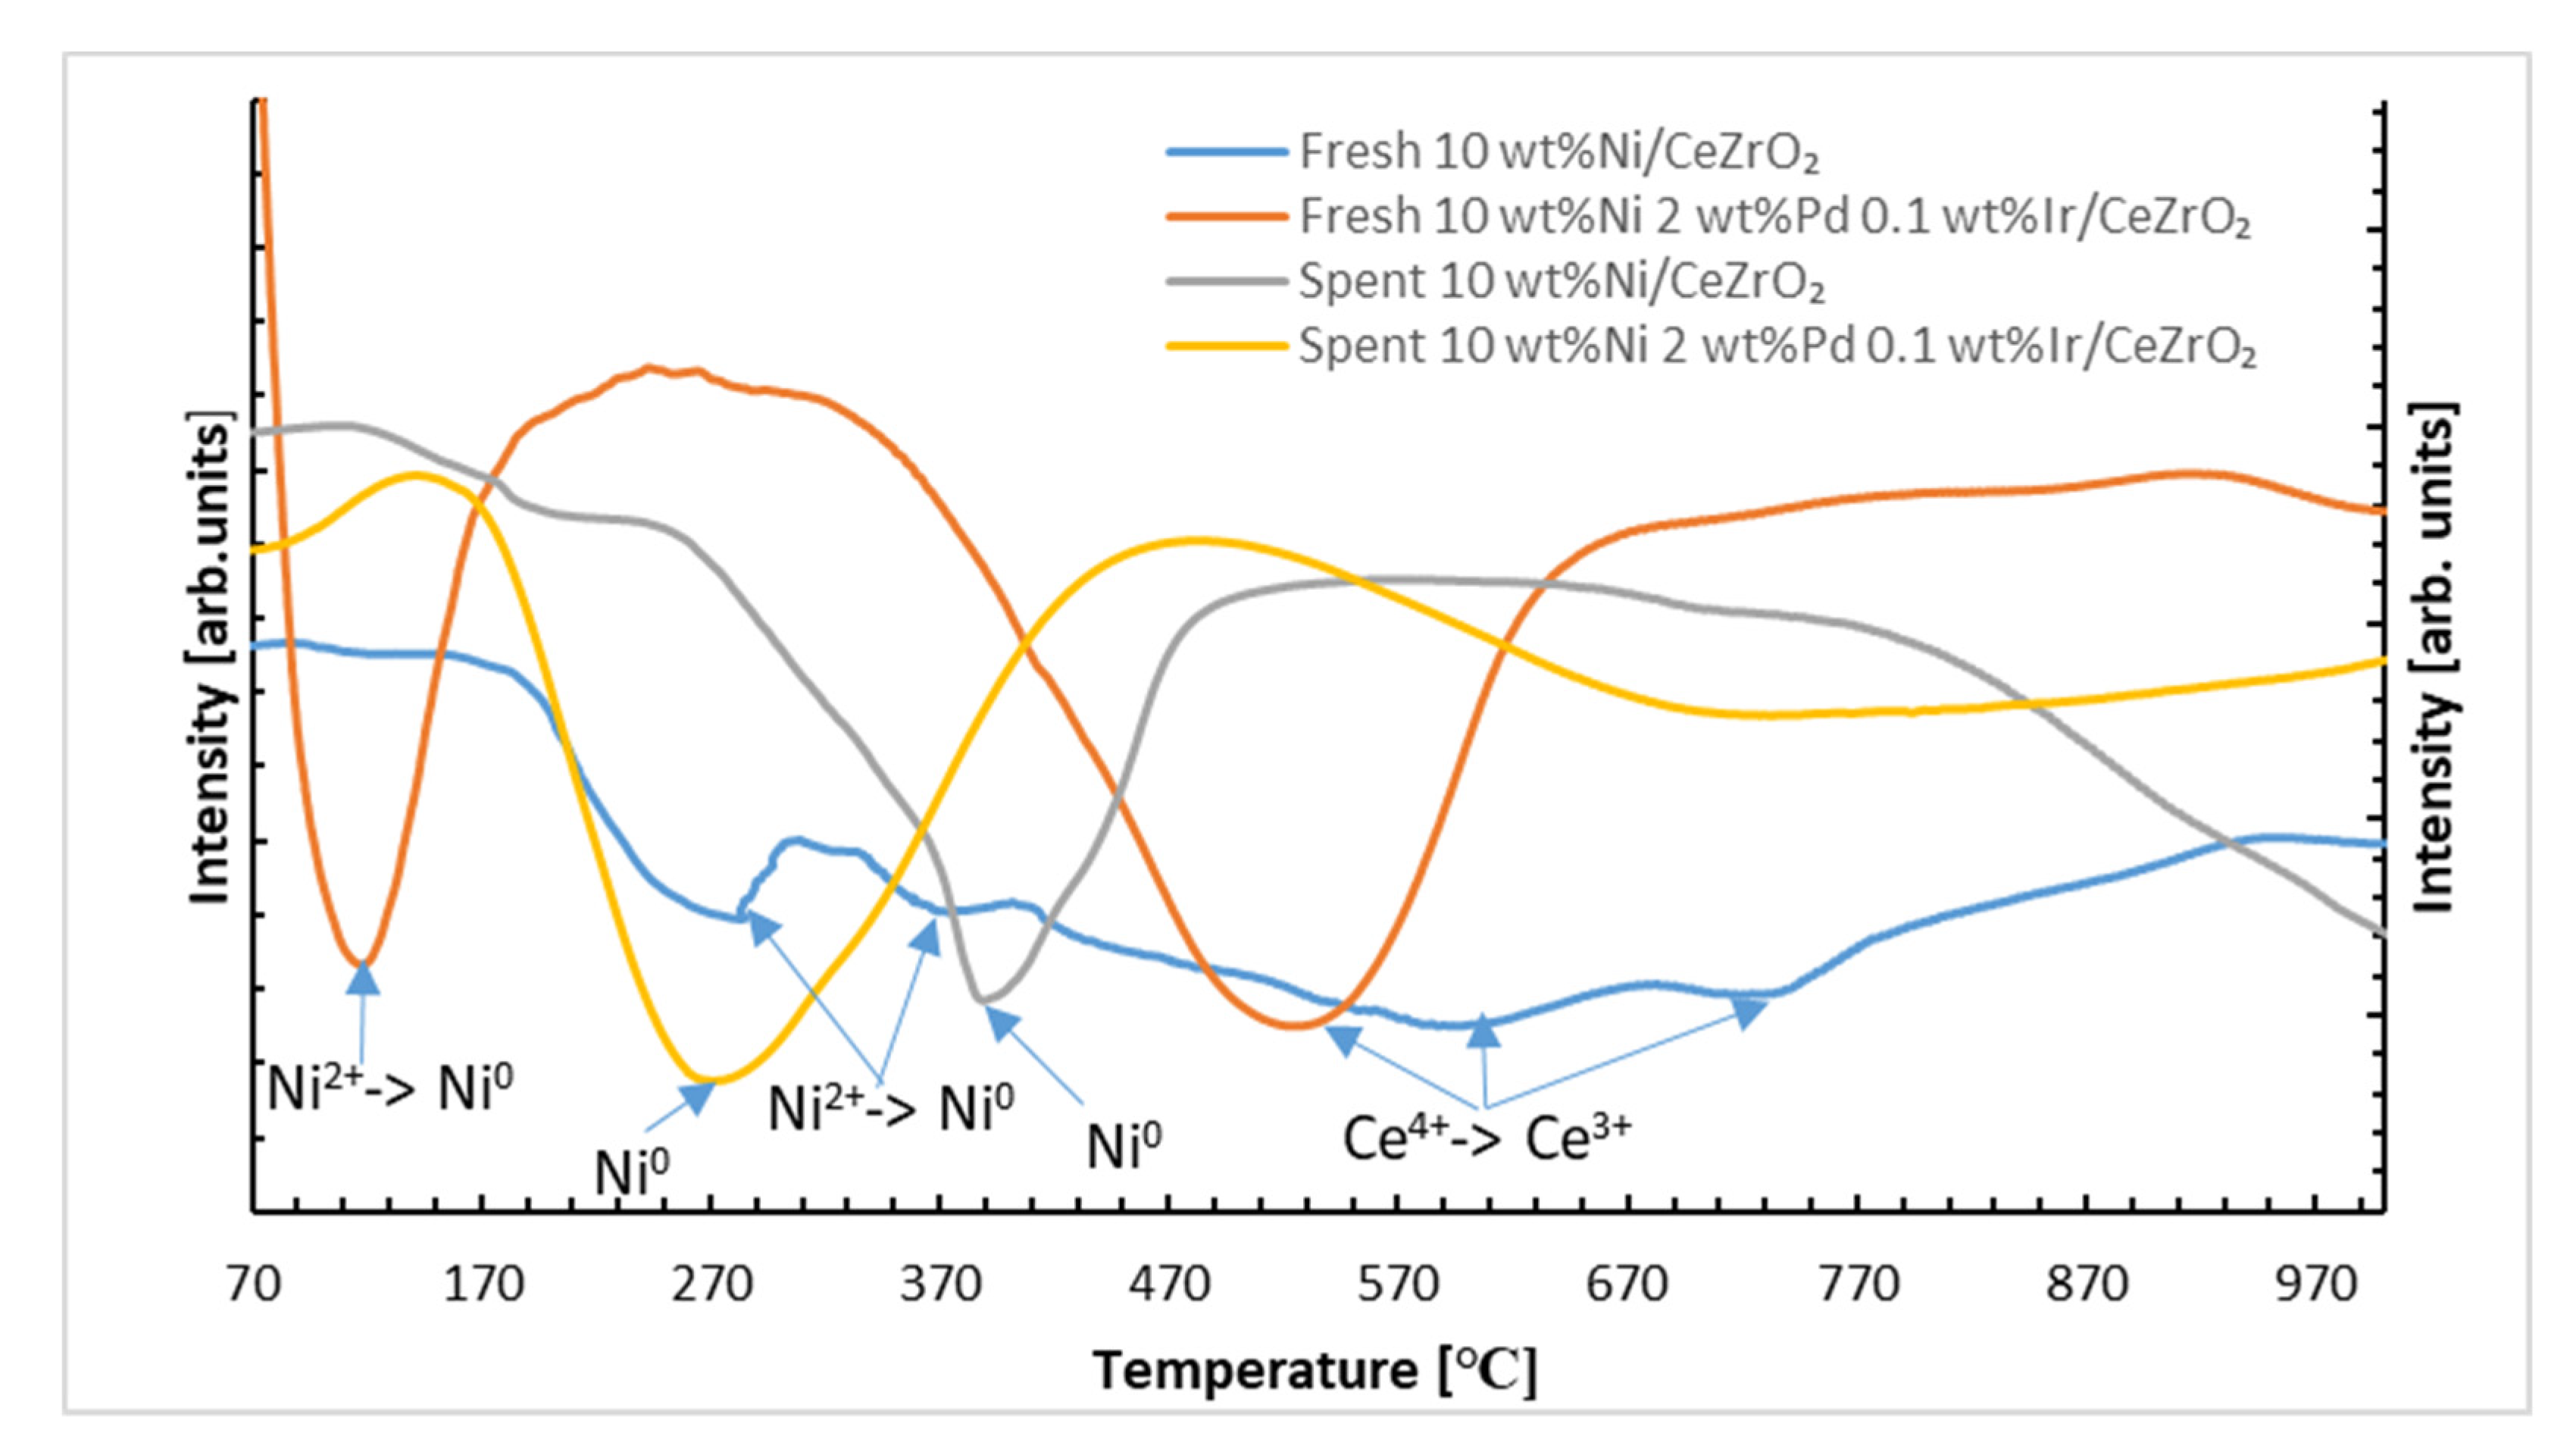
Results for the TPR profiles of fresh and spent 10 wt%Ni/CeZrO2 and 10 wt%Ni 2 wt%Pd 0.1 wt%Ir/CeZrO2 catalysts are provided in Figure 2. For the fresh 10 wt%Ni/CeZrO2 catalyst convoluted broad peaks were observed at 280 °C and 370 °C in which, the first and second peaks are related to the weak and strong bond of Ni2+ species to the support [20]. The peaks at 600 °C and 740 °C are related to the partial reduction of Ce4+ to Ce3+. The catalyst showed broader main reduction peaks at higher temperatures than that for the 10 wt%Ni 2wt%Pd 0.1 wt%Ir/CeZrO2. The wideness of the peak suggests a broad particle size distribution of Ce and, given that the reduction temperature is relatively high [20]. H2-TPR of spent catalyst after RWGS reaction was carried out to compare to the fresh catalyst before the reaction. A broad peak was observed at slightly higher temperature compared to fresh 10 wt%Ni/CeZrO2 at 390 °C which is related to Ni0. For the fresh 10 wt%Ni 2 wt%Pd 0.1 wt%Ir/CeZrO2 catalyst broad and clear peaks at 120 °C and 530 °C, respectively, were detected. The first peak corresponded to the reduction of Ni2+ to Ni0. The Ni peaks were shifted to a lower temperature at 120 °C compared to Ni peaks in 10 wt%Ni/CeZrO2, while the peak at 530 °C is related to the partial reduction of Ce4+ to Ce3+ was also shifted to a lower temperature [26]. Pd shifted the peak observed at 740 °C for 10 wt%Ni/CeZrO2 to lower temperature at 530 °C. The peak at 530 °C can be attributed to the reduction of the mixed oxides of CeO2 and ZrO2 since it is known that the reduction of ceria is facilitated by the presence of Zr. For spent 10 wt%Ni 2 wt%Pd 0.1 wt%Ir/CeZrO2, broad peak attributed to Ni0 is shifted to higher temperature at 270 °C. For both spent catalysts, a shift to higher temperatures were observed. Dantas et al. [27] showed in their study that the presence of noble metal such as Pd as promoter facilitate the reduction of Ni supported sample. Pd can easily adsorb hydrogen on its metallic state. Thus, metallic Pd is formed at lower temperature during the hydrogenation process than necessary for Ni reduction. Therefore, the hydrogen formed on the noble metal surface can move to nickel oxide surface, reducing it more easily. Pd promoter shifted the peaks observed for 10 wt%Ni 2 wt%Pd 0.1 wt%Ir/CeZrO2 to lower temperatures.

2.4. Catalyst Activity

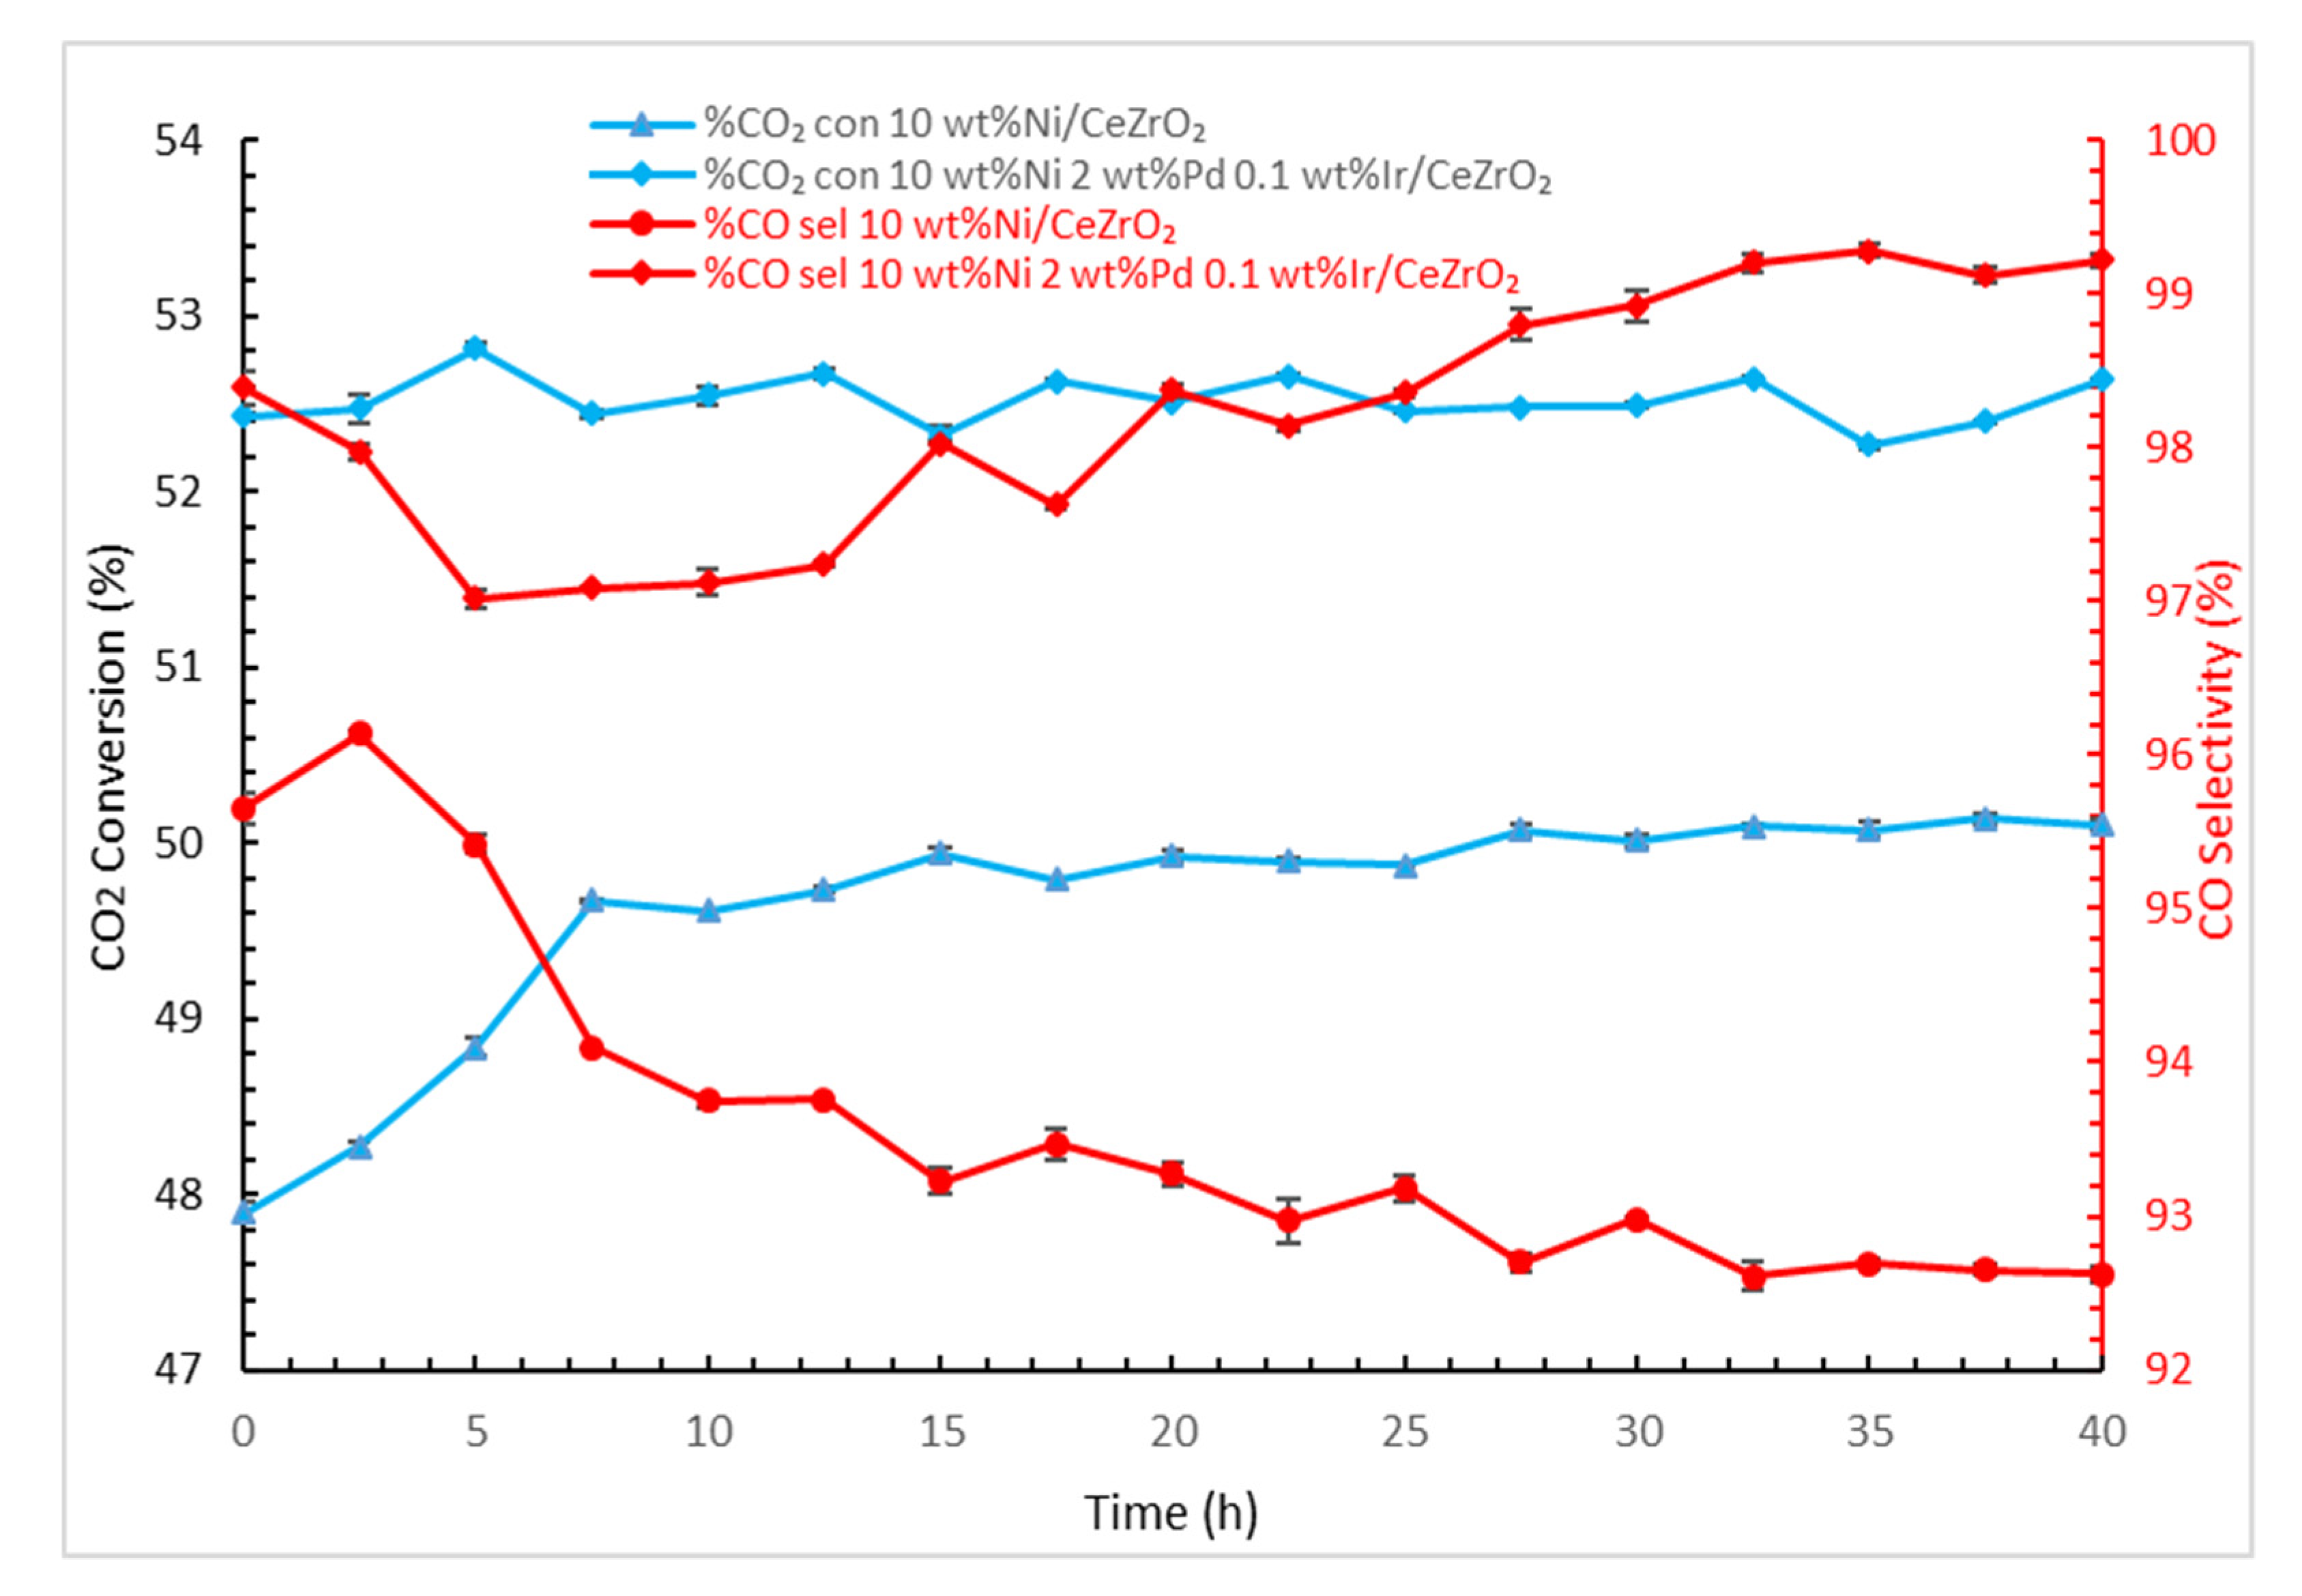
The stability of the 10 wt%Ni 2 wt%Pd 0.1 wt%Ir/CeZrO2 and 10%Ni/CeZrO2 catalysts were studied for 40 h at 750 °C is shown in Figure 3. 10 wt%Ni 2 wt%Pd 0.1 wt%Ir/CeZrO2 catalyst showed more stability in the CO2 conversion and CO selectivity than the 10 wt%Ni/CeZrO2 catalyst. We speculate that the decrease is due to carbon formation. It also showed a better activity with average CO2 conversion of 52.4% and a CO selectivity of 98.3% for H2:CO2 (1:1) compared to the activity of 10 wt%Ni/CeZrO2 with an average CO2 conversion of 49.8% and a CO selectivity of 93.3%.
Both catalysts showed CO2 conversion for 40 h reaction time without significant deactivation of the catalysts. To the best of our knowledge, it is very rare case that supported-Ni catalyst having more than 5% Ni shows such high activity and stability for 40 h under the condition of space velocity of 18,000 h−1 in RWGS reaction. The addition of promoters may have caused structural changes contributing to alter the activity and stability of the catalyst. Larsen and Chorkendorff [28] observed that the presence of Pd with Ni favors the formation of a metal alloy on the surface of the catalyst. This can be credited to the coaction between the Ni and Pd phase at the interface. The interaction between Ni and Pd at the interface leads to the corresponding H and CO atoms being chemisorbed. The more NiO sites been reduced by the adsorbed H atoms, the more metallic sites available for RWGS reaction [29].
Danta et al. [27] showed in their study high selectivity for CO indicating low carbon deposition on the surface of the catalyst. Their study supports that 10 wt%Ni 2 wt%Pd 0.1 wt%Ir/CeZrO2 is stable. This is also supported by the high surface area of the Ni-Pd-Ir with CeZrO2 support compared with Ni with Ce-ZrO2 alone. Bastan et al. [20] showed in their study of effect of support’s composite that 10 wt%Ni/CeZrO2 catalyst showed much better catalytic performance than 10 wt%Ni/CeO2 and 10 wt%Ni/ZrO2. 10 wt%Ni 2 wt%Pd 0.1 wt%Ir/CeZrO2 catalyst showed long life span. RWGS reaction was carried out up to 85 h without significant deactivation of the catalyst. It showed the promoters help elongate the life span of the catalyst.
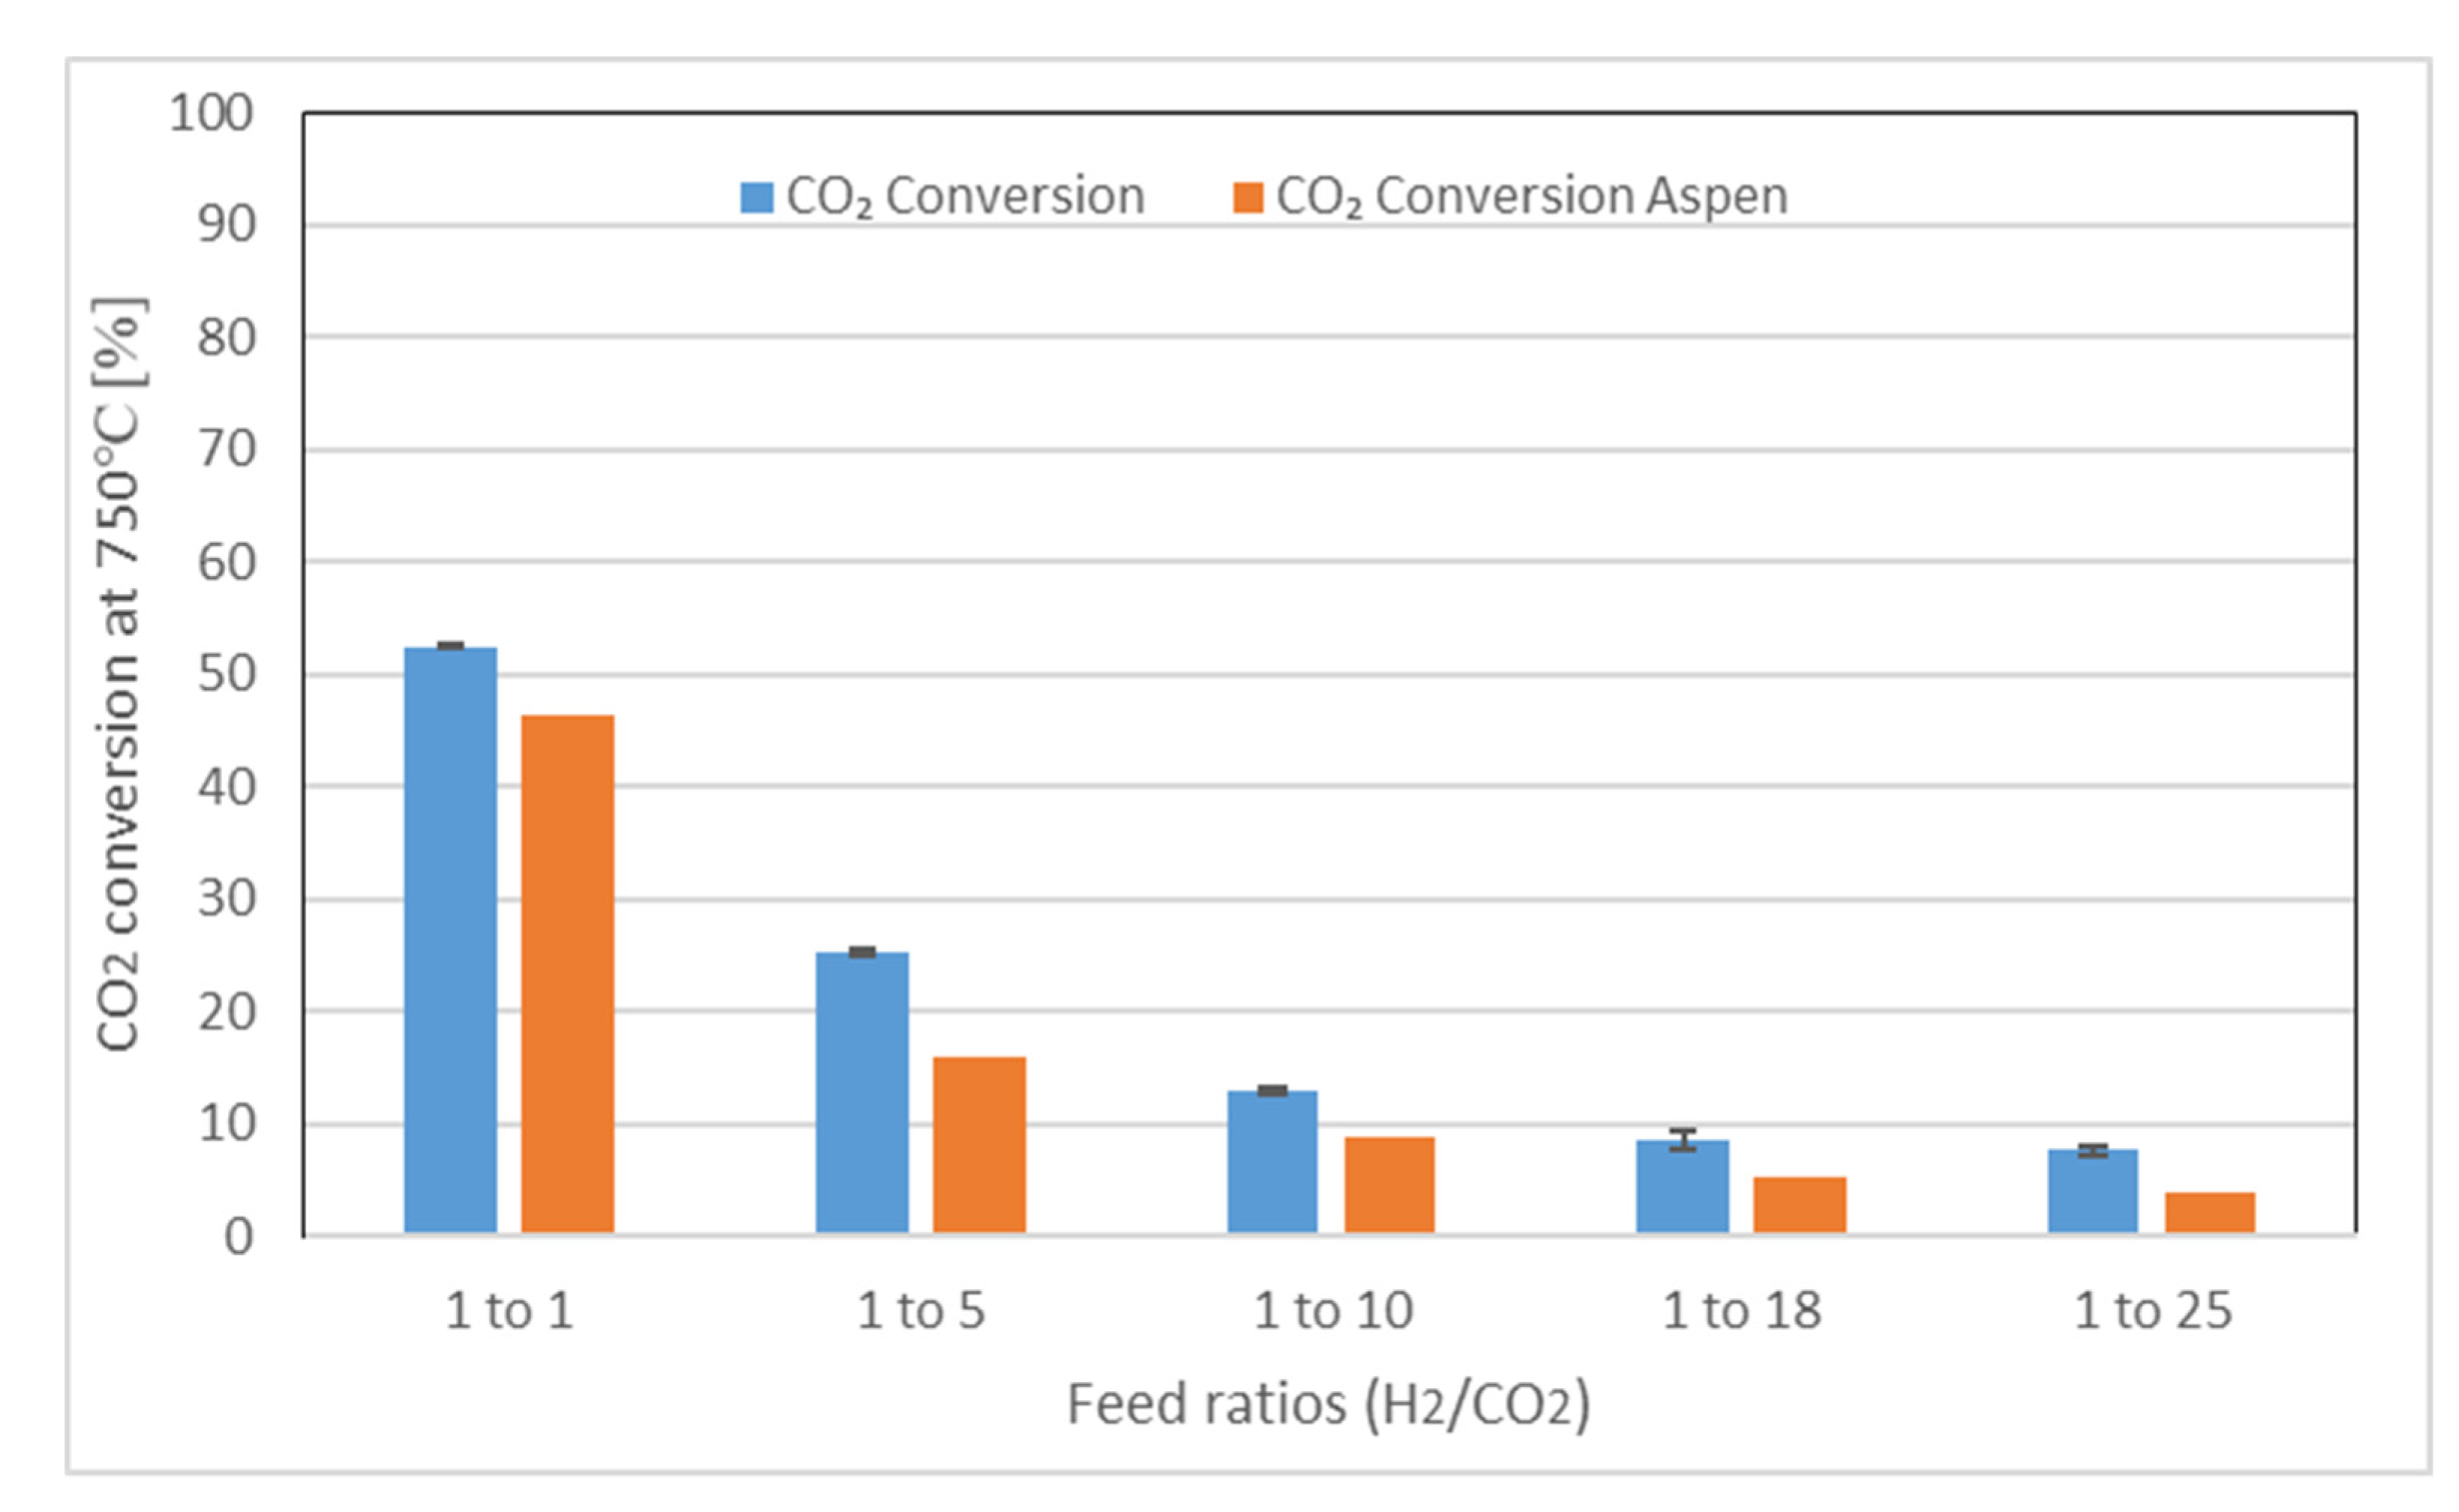
Figure 4 shows the data of catalytic activity for 10 wt%Ni 2 wt%Pd 0.1 wt%Ir/CeZrO2 at different feed ratios (H2/CO2), expressed as carbon dioxide conversion. Results obtained was at 750 °C and at 1 bar pressure. A decrease in CO2 conversion as the amount of CO2 in the feed ratio is increased is observed. Carbon dioxide conversion decreases from 52% (near to the thermodynamic equilibrium at the reaction conditions) for the hydrogen to carbon dioxide (1:1), to 7.6% for the feed ratio with H2/CO2 (1:25). This shows that at higher amount of CO2, more carbon formation occurs on the catalyst thereby reducing the CO2 conversion. This is supported by the theoretical results using Aspen plus software.
Investigation of condensation was carried out using the Mollier diagram before analysis due to the challenge of calculating the yield for H2O that might occur during the RWGS process. The results of the yields obtained for CO and H2O were 51% and 39%, respectively. H2O content obtained from the experiment was 0.018 kg/kg compared to the estimate from the Mollier diagram which was 0.015 kg/kg. Results from the calculation was used to compensate the yield of H2O. Table 2 shows the volume of gases at different ratios.
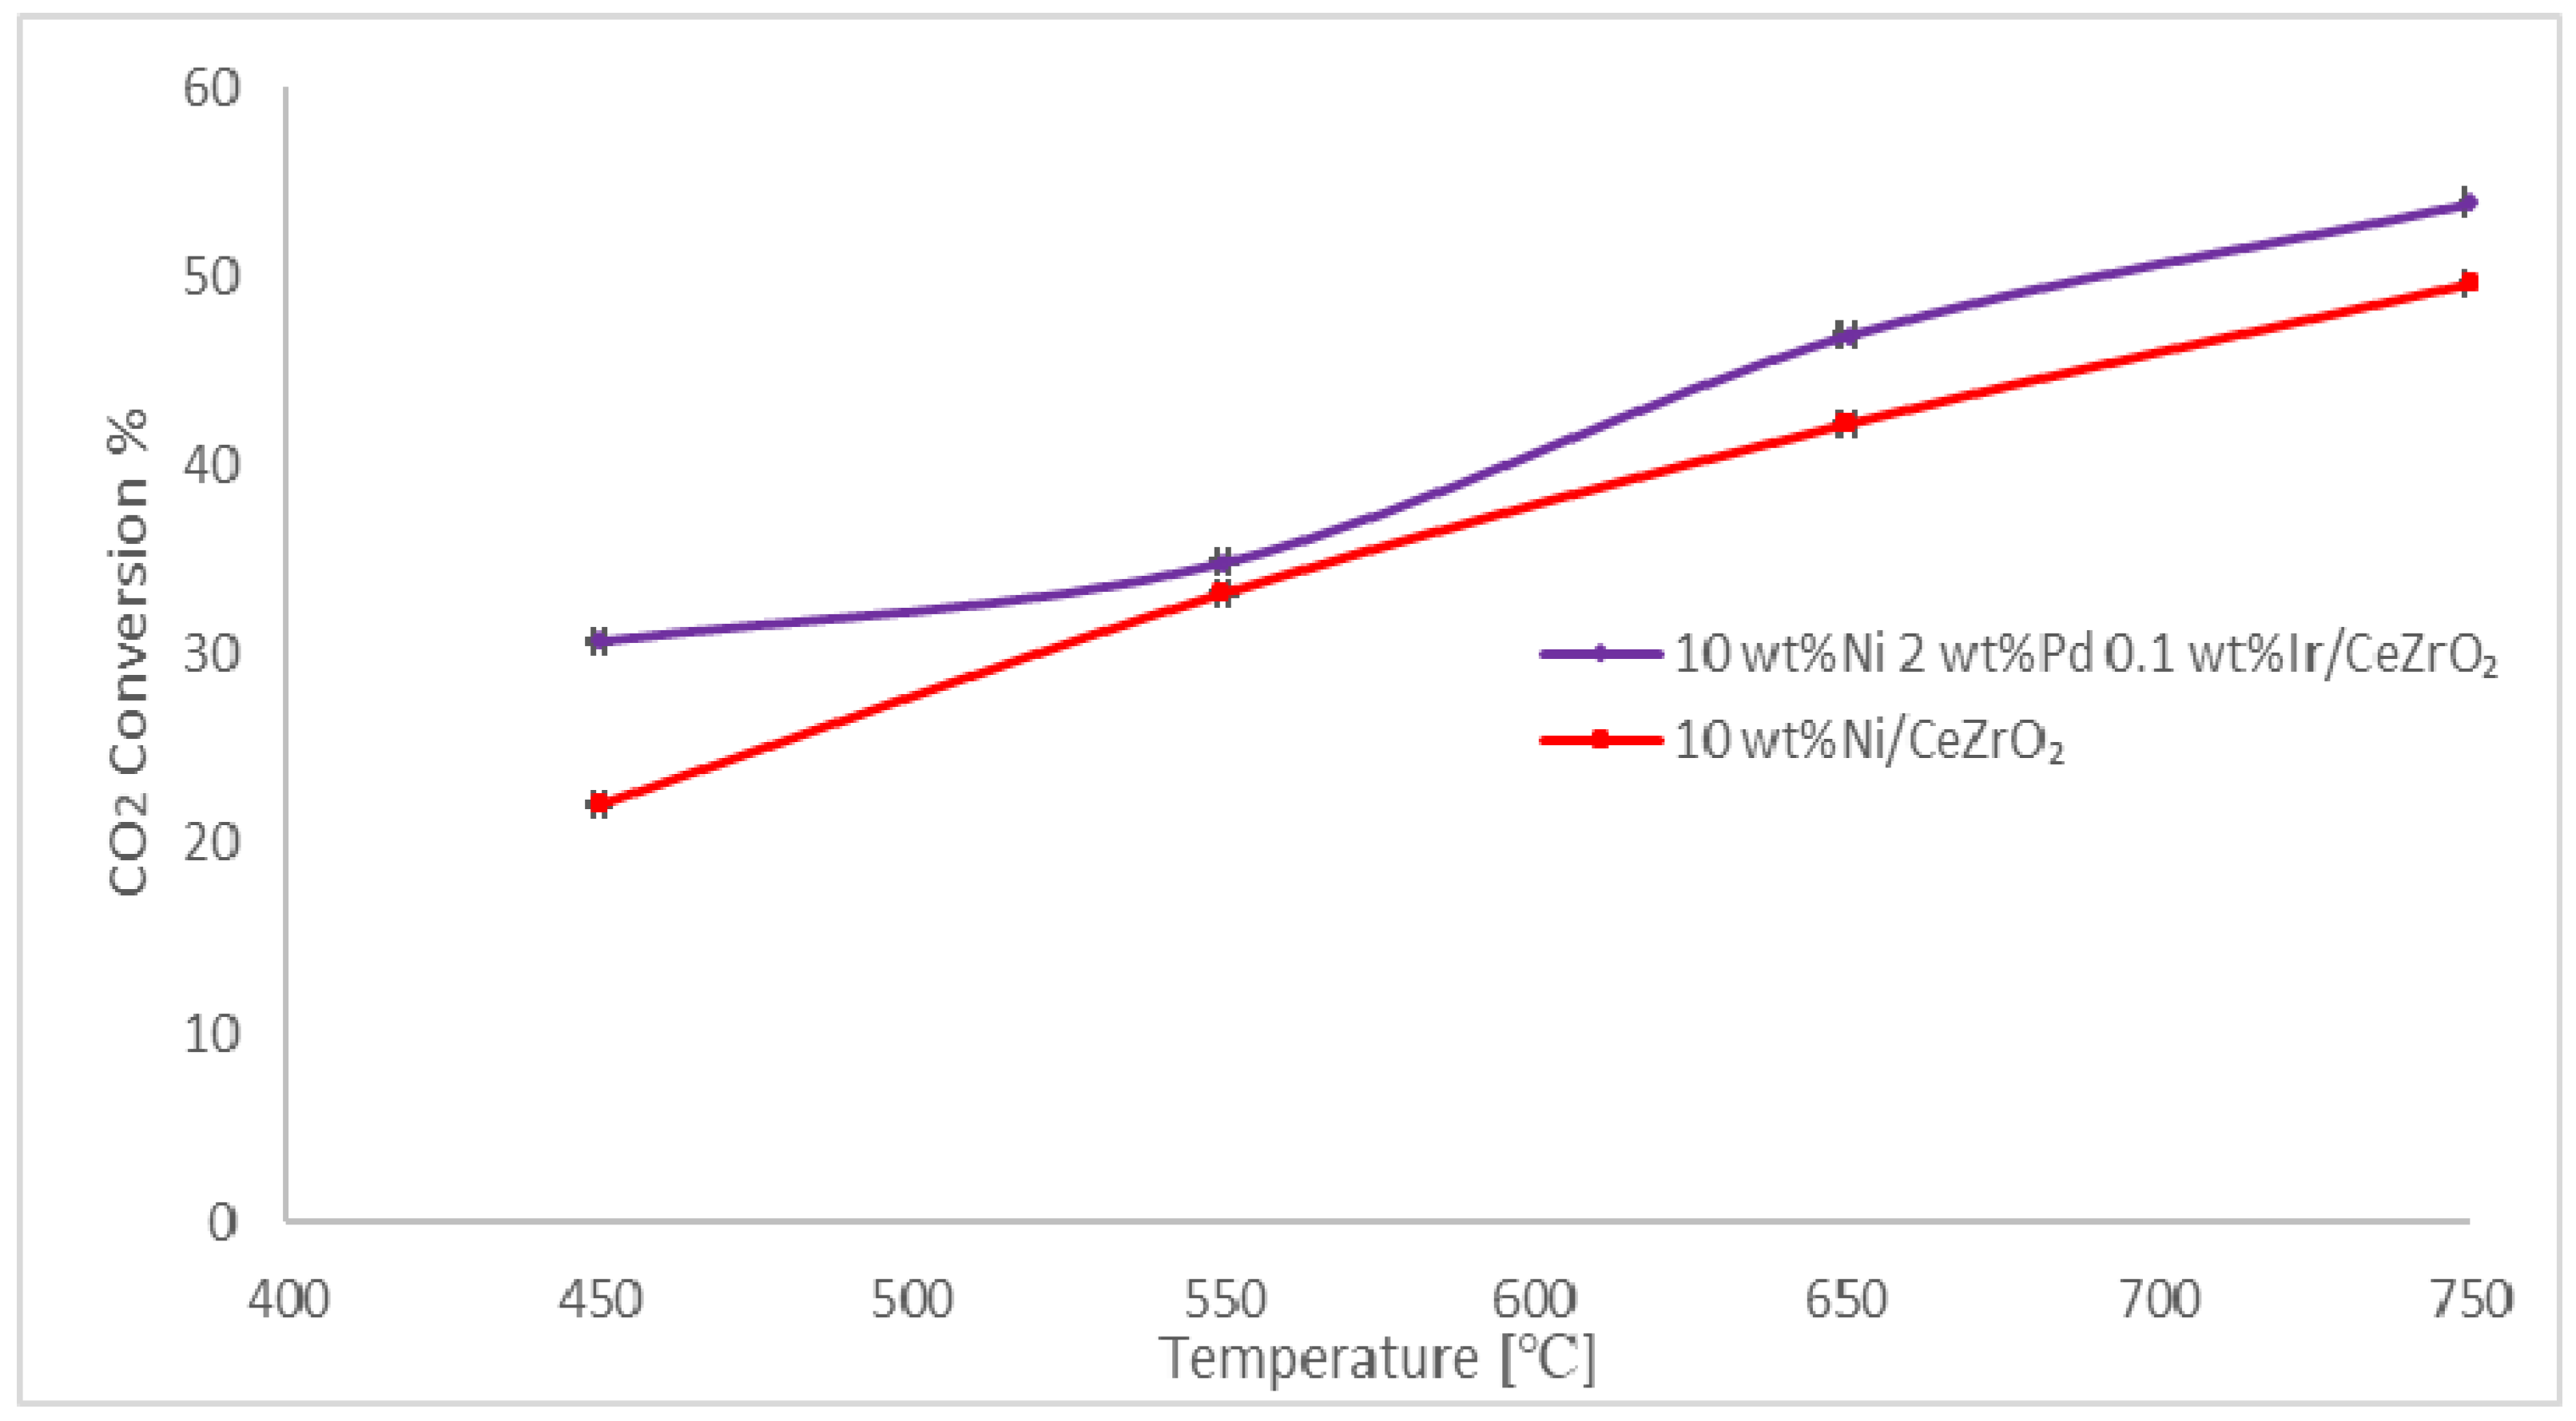
As shown in Figure 5, CO2 conversion for both 10 wt%Ni/CeZrO2 and 10 wt%Ni 2 wt%Pd 0.1 wt%Ir/CeZrO2 catalysts were carried out at different temperatures of 450 °C, 550 °C, 650 °C and 750 °C. The pressure at 1 bar and the feed ratio (H2/CO2) of 1:1 was constant. Quantification of both CO and CH4 formation shows that Sabatier and RWGS reaction were occurring simultaneously at different temperatures. More methane was formed at lower temperature of 450 °C and as the temperature increased to 750 °C, more carbon monoxide was formed. CO2 conversion increases from 22% at 450 °C to above 50% at 750 °C It shows a steady increase in the CO2 conversion as the temperature increases. At lower temperature Sabatier reactions takes place.

3. Materials and Methods

3.1. Catalyst Preparation

The catalysts were performed by first preparing granules of ceria-zirconia mixed oxide from a commercial material with a ceria-to-zirconia ratio of 1:1.4 (Solvay actalys 9447). The powdered ceria-zirconia was mixed with water and boehmite in a ratio of 1 to 2 to 0.2. The mixture was ground in a ball mill for 12 h before being dried in a hot air oven at 150 °C. The resulting cake was gently crushed and calcined at 700 °C for 4 h and the resulting material was crushed and sieved to 1–2 mm in particle size. The active phase was added subsequently using incipient wetness impregnation. Initially, the catalysts were impregnated with nickel nitrate solution and the resulting catalyst yielded 10 wt% Ni. The catalyst was dried at 90 °C and calcined at 500 °C for 4 h. A part of the catalyst was impregnated with a palladium nitrate and iridium acetate solution, resulting in a catalyst with 10 wt% Ni, 2 wt% Pd and 0.1 wt% Ir. The catalyst was dried at 90 °C and calcined at 500 °C for 4 h to render it in its final form.

3.2. RWGS Reaction

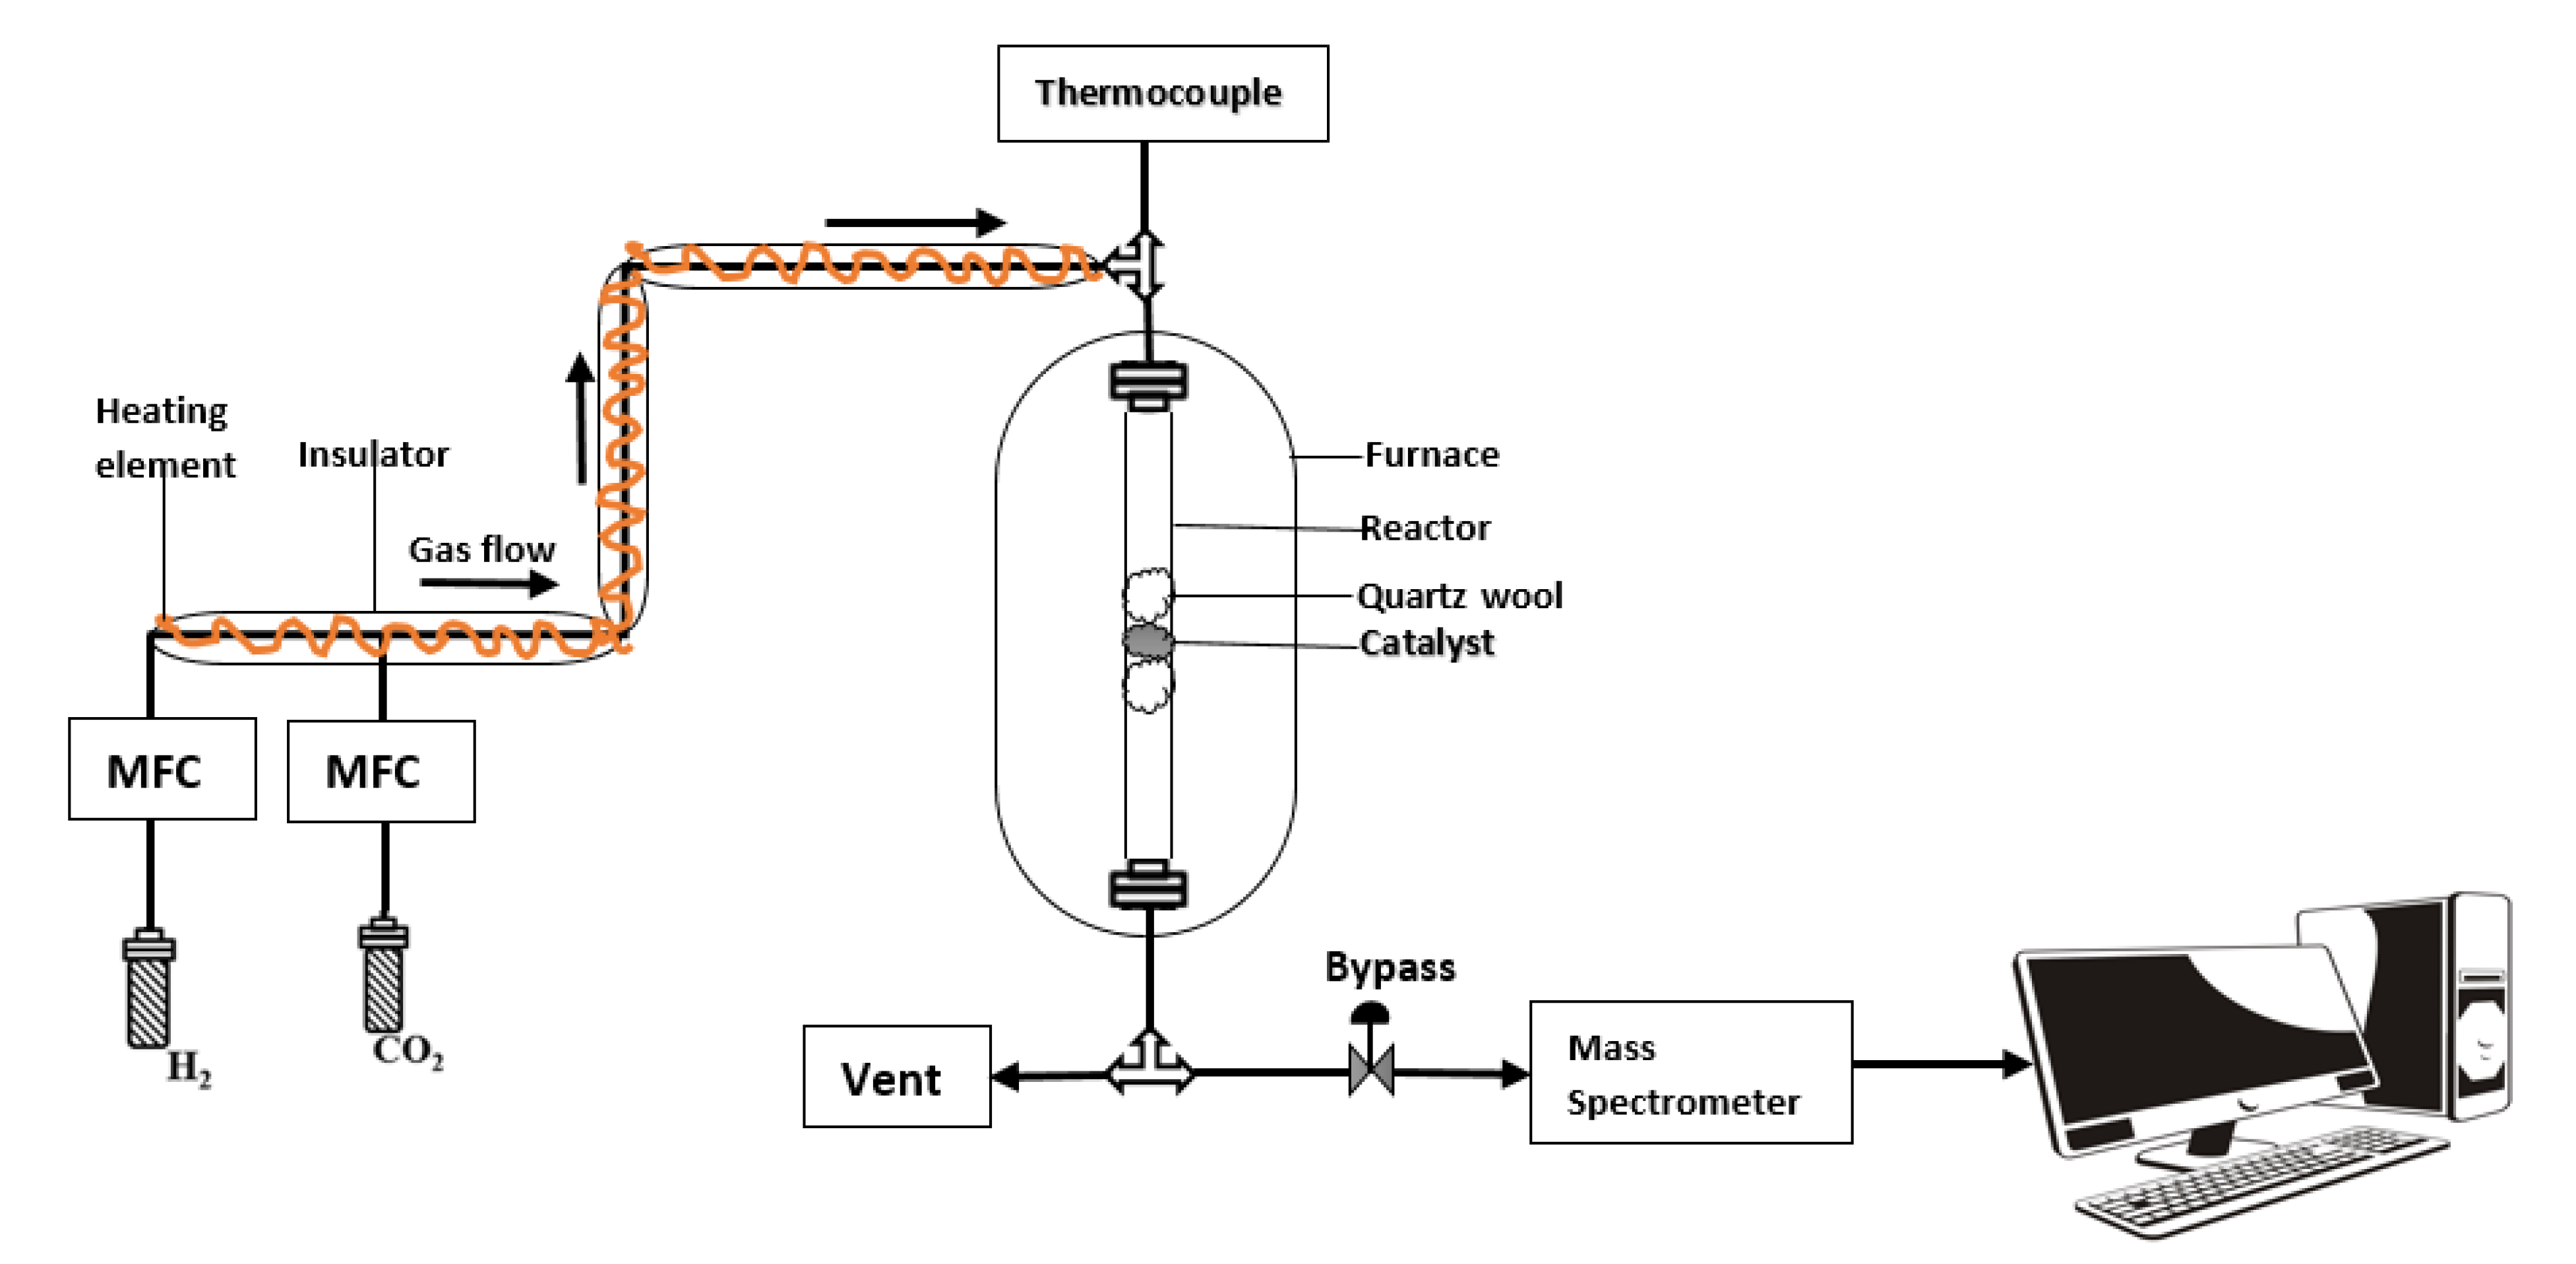
The hydrogenation of CO2 was carried out at 750 °C for 40 h at atmospheric pressure using 2 mL of catalyst. The gas mixture CO2:H2 (1:1, 25 mL/min, space velocity of 18,000 h−1). Catalytic RWGS reactions were conducted in a continuous flow steel reactor (14 mm internal diameter and 65 mm length. 2 mL of catalyst particles with a particle size of 1–2 mm of the 10 wt%Ni 2 wt%Pd 0.1 wt%Ir/CeZrO2 catalyst was mixed with 8 mL of α-alumina and loaded on quartz wool and positioned in the center of the vertically fixed-bed reactor. α-alumina was used as a diluting material. The reactor was placed inside a furnace and heated to 750 °C using a temperature controller. Individual Bronkhorst mass flow controllers were used to regulate 4% H2 in Ar and CO2 gas flows at 25 mL/min (Figure 6). The catalyst was reduced with 4% H2 in Ar (25 mL/min) at 750 °C for 40 min before the RWGS reaction. After reduction, a reagent gas mixture CO2:H2 (1:1, 25 mL/min, space velocity of 18,000 h−1) was flowed into the reactor with a total volume of 50 mL/min at the temperature of 750 °C and at atmospheric pressure. The reaction was carried out for 430 min at a stable temperature of 750 °C. CO2, H2, CO, CH4 and H2O concentrations were monitored using a quadrupole mass spectrometer (Hiden Analytical, 12886WR, Livonia, MI, USA) equipped with capillary temperature controller, single gauge, MSIU (RC) control unit, quadrupole filter, ionization detector and turbo pumps. The valve in the experimental setup was used to switch from inlet to outlet and vice versa. The tubes carrying CO2 and H2 were kept heated with heating elements to keep the gases from condensing before reaching the reactor. Insulators were used to prevent the heat from escaping. The temperatures of the reactor and heating elements were monitored with a K-type thermocouples. A schematic of the setup is shown in Figure 6.

3.3. Characterization Techniques

The following characterization techniques were used: Brumauer-Emmett-Teller (BET), X-ray diffraction (XRD), temperature programmed reduction (TPR-H2). The 10 wt%Ni 2 wt%Pd 0.1 wt%Ir/CeZrO2 catalyst was characterized in detail using Brumauer-Emmett-Teller (BET), X-ray diffraction (XRD) and temperature programmed reduction (TPR-H2).

3.3.1. X-ray Diffraction (XRD)

X-ray diffraction (XRD) of the catalysts were measured using a Stoe Stadi MP Diffractometer (STOE and Cie GmbH, Darmstadt, Germany). The system layout includes a CuKα radiation source with a Ge monochromator and a Mythen detector obtained from DECTRIS Ltd., Baden-Daettwil, Switzerland [30]. Identification of the catalysts were carried out in reflection mode. For the diffraction pattern documentation, a 2θ scan ranging between 5–90° including a 0.19° step size and a 60 s sampling time was used at each step.

3.3.2. BET Surface Areas and Pore Distributions

BET adsorption-desorption method using a Micromeritics 3 Flex instrument (Norcross, GA, USA) was used to determine the specific surface area and pore size of 10 wt%Ni 2 wt%Pd 0.1 wt%Ir/CeZrO2 catalyst. Barrett, Joyner and Halenda (BJH) method was used for the analysis of the pore volume [31]. Degassing of the sample was carried at 250 °C under high vacuum for 4 h before the analysis. Nitrogen gas was used as the analysis gas at liquid nitrogen temperatures to perform the quantification. Analysis of surface areas was carried out by suggested equations by Brunauer, Emmet and Teller (BET) [32].

3.3.3. H2-Temperature Program Reduction (H2-TPR)

A Micromeritics 3-flex system (Norcross, GA, USA) with setting at dynamic chemisorption was used to carry out H2-TPR. ~150 mg of the catalyst was weighed into a sample holder and setup in the machine. A volume of 10 mL/min of H2 gas (4% H2, Ar 96%) was flowed through the catalyst. Temperature of the catalyst was increased at a rate of 10 °C/min from 30 °C to 1000 °C. Thermal conductivity detector was used for detection.

3.4. Reaction Procedure and Product Analysis

Prior to reaction, fresh catalysts were reduced in a flow of 4% H2, Ar 96% (25 mL/min) for 40 min at 750 °C for both 10 wt%Ni/CeZrO2 and 10 wt%Ni 2 wt%Pd 0.1 wt%Ir/CeZrO2 catalysts. RWGS reaction was carried out for 40 h at 750 °C and at 1 bar pressure. CO2 conversion and CO selectivity were calculated for every 2.5 h. Percentage of CO2 Conversion, CO selectivity and yield were estimated using the following formulae:
%   Conversion = Xco 2   ( % ) = Fco 2 , in Fco 2 , out Fco 2 , in × 100   %  
%   Selectivity = S co   ( % ) = F co , out F co , in Fco 2 , in Fco 2 , out × 100   %
%   Yield = amount   of   product   produced × stoichiometric   factor amount   of   feed × 100   %  

3.5. Thermodynamic Calculation

In order to relate the experimental results to theoretical calculated values, thermodynamic calculation was performed using Aspen Plus V11 (Cambridge, MA, USA). Equilibrium was calculated using Gibbs reaction.

4. Conclusions

The conversion of carbon dioxide into carbon monoxide through reversed water gas shift (RWGS) process was demonstrated using 10 wt% Ni/CeZrO2 and 10 wt%Ni 2 wt%Pd 0.1 wt%Ir/CeZrO2 catalysts. To better understand the effect of Pd and Ir as promoters in Ni based catalysts, the physiochemical properties of the catalysts were investigated. These included XRD, BET-BJH and H2-TPR. The catalytic activity of both catalysts were compared. The study shows the catalyst activity of 10 wt%Ni 2 wt%Pd 0.1 wt%Ir/CeZrO2 catalyst had the highest catalytic activity together with the selectivity with regards to CO production. 52% of CO2 conversion and 98% of CO selectivity were obtained for this catalyst. Almost no deactivation was observed for the catalysts during the RWGS reaction as shown in this paper. The mentioned analyses above together with a stable performance of this catalyst over 40 h of reaction time demonstrates this. Addition of Pd and Ir into the Ni/CeZrO2 did have positive effect on catalytic activity for the RWGS reaction. Combining Ni and Pd have been known to have a higher activity for RWGS reaction [29]. This is due to the local synergy that exist in the bimetallic NiPd catalyst which shows increased CO2 hydrogenation [33]. These meant Pd and Ir introduced here as promoters possessed a desirable stability for the considered process. This catalyst is a very promising material for the RWGS for CO2 utilization.

Author Contributions

Conceptualization, C.H.; methodology, L.I.A.J.; software, L.I.A.J. and C.H.; validation, L.I.A.J., S.B. and C.H.; formal analysis, L.I.A.J.; investigation, L.I.A.J., S.B. and C.H.; resources, C.H.; data curation, L.I.A.J.; writing—original draft preparation, L.I.A.J.; writing—review and editing, L.I.A.J., S.B. and C.H.; visualization, C.H.; supervision, S.B. and C.H.; project administration, C.H.; funding acquisition, C.H. All authors have read and agreed to the published version of the manuscript.

Funding

This research was funded by Energimyndigheten (47452-1) and the APC was funded by Lund University.

Conflicts of Interest

The authors declare no conflict of interest.

References

  1. Oshima, K.; Shinagawa, T.; Nogami, Y.; Manabe, R.; Ogo, S.; Sekine, Y. Low temperature catalytic reverse water gas shift reaction assisted by an electric field. Catal. Today 2014, 232, 27–32. [Google Scholar] [CrossRef]
  2. Chen, C.S.; Cheng, W.H.; Lin, S.S. Study of iron-promoted Cu/SiO2 catalyst on high temperature reverse water gas shift reaction. Appl. Catal. A Gen. 2004, 257, 97–106. [Google Scholar] [CrossRef]
  3. Kim, D.H.; Han, S.W.; Yoon, H.S.; Kim, Y.D. Reverse water gas shift reaction catalyzed by Fe nanoparticles with high catalytic activity and stability. J. Ind. Eng. Chem. 2015, 23, 67–71. [Google Scholar] [CrossRef]
  4. Maitlis, P.M.; de Klerk, A. Greener Fischer-Tropsch Processes for Fuels and Feedstocks; John Wiley & Sons: Hoboken, NJ, USA, 2013. [Google Scholar]
  5. Kim, D.H.; Park, J.L.; Park, E.J.; Kim, Y.D.; Uhm, S. Dopant Effect of Barium Zirconate-Based Perovskite-Type Catalysts for the Intermediate-Temperature Reverse Water Gas Shift Reaction. ACS Catal. 2014, 4, 3117–3122. [Google Scholar] [CrossRef]
  6. Hu, B.; Guild, C.; Suib, S.L. Thermal, electrochemical, and photochemical conversion of CO2 to fuels and value-added products. J. CO2 Util. 2013, 1, 18–27. [Google Scholar] [CrossRef]
  7. Luhui, W.A.; Hui, L.I.; Yuan, L.I.; Ying, C.H.; Shuqing, Y.A. Influence of preparation method on performance of Ni-CeO2 catalysts for reverse water-gas shift reaction. J. Rare Earths 2013, 31, 559–564. [Google Scholar]
  8. Ito, M.; Tagawa, T.; Goto, S. Suppression of carbonaceous depositions on nickel catalyst for the carbon dioxide reforming of methane. Appl. Catal. A Gen. 1999, 177, 15–23. [Google Scholar] [CrossRef]
  9. Wang, S.; Lu, G.Q. Reforming of methane with carbon dioxide over Ni/Al2O3 catalysts: Effect of nickel precursor. Appl. Catal. A Gen. 1998, 169, 271–280. [Google Scholar] [CrossRef]
  10. Au, C.T.; Ng, C.F.; Liao, M.S. Methane dissociation and syngas formation on Ru, Os, Rh, Ir, Pd, Pt, Cu, Ag, and Au: A theoretical study. J. Catal. 1999, 185, 12–22. [Google Scholar] [CrossRef]
  11. Chang, J.S.; Park, S.E.; Chon, H. Catalytic activity and coke resistance in the carbon dioxide reforming of methane to synthesis gas over zeolite-supported Ni catalysts. Appl. Catal. A Gen. 1996, 145, 111–124. [Google Scholar] [CrossRef]
  12. Hou, Z.; Yokota, O.; Tanaka, T.; Yashima, T. Characterization of Ca-promoted Ni/A-Al2O3 catalyst for CH4 reforming with CO2. Appl. Catal. A Gen. 2003, 253, 381–387. [Google Scholar] [CrossRef]
  13. Juan-Juan, J.; Roman-Martinez, M.C.; Illan-Gomez, M.J. Effect of potassium content in the activity of K-promoted Ni/Al2O3 catalysts for the dry reforming of methane. Appl. Catal. A Gen. 2006, 301, 9–15. [Google Scholar] [CrossRef]
  14. Zhang, Z.L.; Verykios, X.E. Carbon dioxide reforming of methane to synthesis gas over supported Ni catalysts. Catal. Today 1994, 21, 589–595. [Google Scholar] [CrossRef]
  15. Mihet, M.; Lazar, M.D. Methanation of CO2 on Ni/γ-Al2O3: Influence of Pt, Pd or Rh promotion. Catal. Today 2018, 306, 294–299. [Google Scholar] [CrossRef]
  16. Ertl, G.; Knözinger, H.; Weitkamp, J. Handbook of Heterogeneous Catalysis; Wiley-VCH Verlag Gmbh & Co. KGaA: Weinheim, Germany, 2008; Volume 1–5, pp. 1–2497. [Google Scholar]
  17. Vernoux, P.; Lizarraga, L.; Tsampas, M.N.; Sapountzi, F.M.; De Lucas-Consuegra, A.; Valverde, J.L.; Souentie, S.; Vayenas, C.G.; Tsiplakides, D.; Balomenou, S.; et al. Ionically conducting ceramics as active catalyst supports. Chem. Rev. 2013, 113, 8192–8260. [Google Scholar] [CrossRef]
  18. Vayenas, C.G.; Koutsodontis, C.G. Non-Faradaic electrochemical activation of catalysis. J. Chem. Phys. 2008, 128, 182506. [Google Scholar] [CrossRef] [PubMed]
  19. Richardson, J.T.; Scates, R.; Twigg, M.V. X-ray diffraction study of nickel oxide reduction by hydrogen. Appl. Catal. A Gen. 2003, 246, 137–150. [Google Scholar] [CrossRef]
  20. Bastan, F.; Kazemeini, M.; Larimi, A.S. Aqueous-phase reforming of glycerol for production of alkanes over Ni/CexZr1-xO2 nano-catalyst: Effects of the support’s composition. Renew. Energy 2017, 108, 417–424. [Google Scholar] [CrossRef]
  21. Trovarelli, A.; Zamar, F.; Llorca, J.; De Leitenburg, C.; Dolcetti, G.; Kiss, J.T. Nanophase fluorite-structured CeO2–ZrO2Catalysts prepared by high-energy mechanical milling. J. Catal. 1997, 169, 490–502. [Google Scholar] [CrossRef]
  22. Roh, H.-S.; Potdar, H.; Jun, K.-W. Carbon dioxide reforming of methane over co-precipitated Ni–CeO2, Ni–ZrO2 and Ni–Ce–ZrO2 catalysts. Catal. Today 2004, 93, 39–44. [Google Scholar] [CrossRef]
  23. Sheikh, A.; Silva, E.L.; Moares, L.; Antonini, L.; Abellah, M.Y.; Malfatti, C. Pd-based catalysts for ethanol oxidation in alkaline electrolyte. Am. J. Min. Met. 2014, 2, 64–69. [Google Scholar]
  24. Asanova, T.I.; Asanov, I.P.; Kim, M.G.; Gerasimov, E.Y.; Zadesenets, A.V.; Plyusnin, P.E.; Korenev, S.V. On formation mechanism of Pd–Ir bimetallic nanoparticles through thermal decomposition of [Pd (NH 3) 4][IrCl 6]. J. Nanopart. Res. 2013, 15, 1–15. [Google Scholar] [CrossRef]
  25. Masui, T.; Fujiwara, K.; Peng, Y.; Sakata, T.; Machida, K.I.; Mori, H.; Adachi, G.Y. Characterization and catalytic properties of CeO2–ZrO2 ultrafine particles prepared by the microemulsion method. J. Alloys Compd. 1998, 269, 116–122. [Google Scholar] [CrossRef]
  26. Montoya, J.A.; Romero-Pascual, E.; Gimon, C.; Del Angel, P.; Monzon, A. Methane reforming with CO2 over Ni/ZrO2-CeO2 catalysts prepared by sol-gel. Catal. Today 2000, 63, 71–85. [Google Scholar] [CrossRef]
  27. Dantas, S.C.; Escritori, J.C.; Soares, R.R.; Hori, C.E. Effect of different promoters on Ni/CeZrO2 catalyst for autothermal reforming and partial oxidation of methane. Chem. Eng. J. 2010, 156, 380–387. [Google Scholar] [CrossRef]
  28. Larsen, J.H.; Chorkendorff, I. From fundamental studies of reactivity on single crystals to the design of catalysts. Surf. Sci. Rep. 1999, 35, 163–222. [Google Scholar] [CrossRef]
  29. Tsiotsias, A.I.; Charisiou, N.D.; Yentekakis, I.V.; Goula, M.A. Bimetallic Ni-Based Catalysts for CO2 Methanation: A Review. Nanomaterials 2021, 11, 28. [Google Scholar] [CrossRef]
  30. Blomberg, S.; Johansson, N.; Kokkonen, E.; Rissler, J.; Kollberg, L.; Preger, C.; Franzén, S.M.; Messing, M.E.; Hulteberg, C. Bimetallic Nanoparticles as a Model System for an Industrial NiMo Catalyst. Materials 2019, 12, 3727. [Google Scholar] [CrossRef] [Green Version]
  31. Brunauer, S.; Emmett, P.H.; Teller, E. Adsorption of gases in multimolecular layers. J. Am. Chem. Soc. 1938, 60, 309–319. [Google Scholar] [CrossRef]
  32. Barrett, E.P.; Joyner, L.G.; Halenda, P. The Determination of Pore Volume and Area Distributions in Porous Substances. 1. Computations from Nitrogen Isotherms. J. Am. Chem. Soc. 1951, 73, 373–380. [Google Scholar]
  33. Li, Y.; Zhang, H.; Zhang, L.; Zhang, H. Bimetallic NiPd/SBA-15 alloy as an effective catalyst for selective hydrogenation of CO2 to methane. Int. J. Hydrog. Energy 2019, 44, 13354–13363. [Google Scholar] [CrossRef]
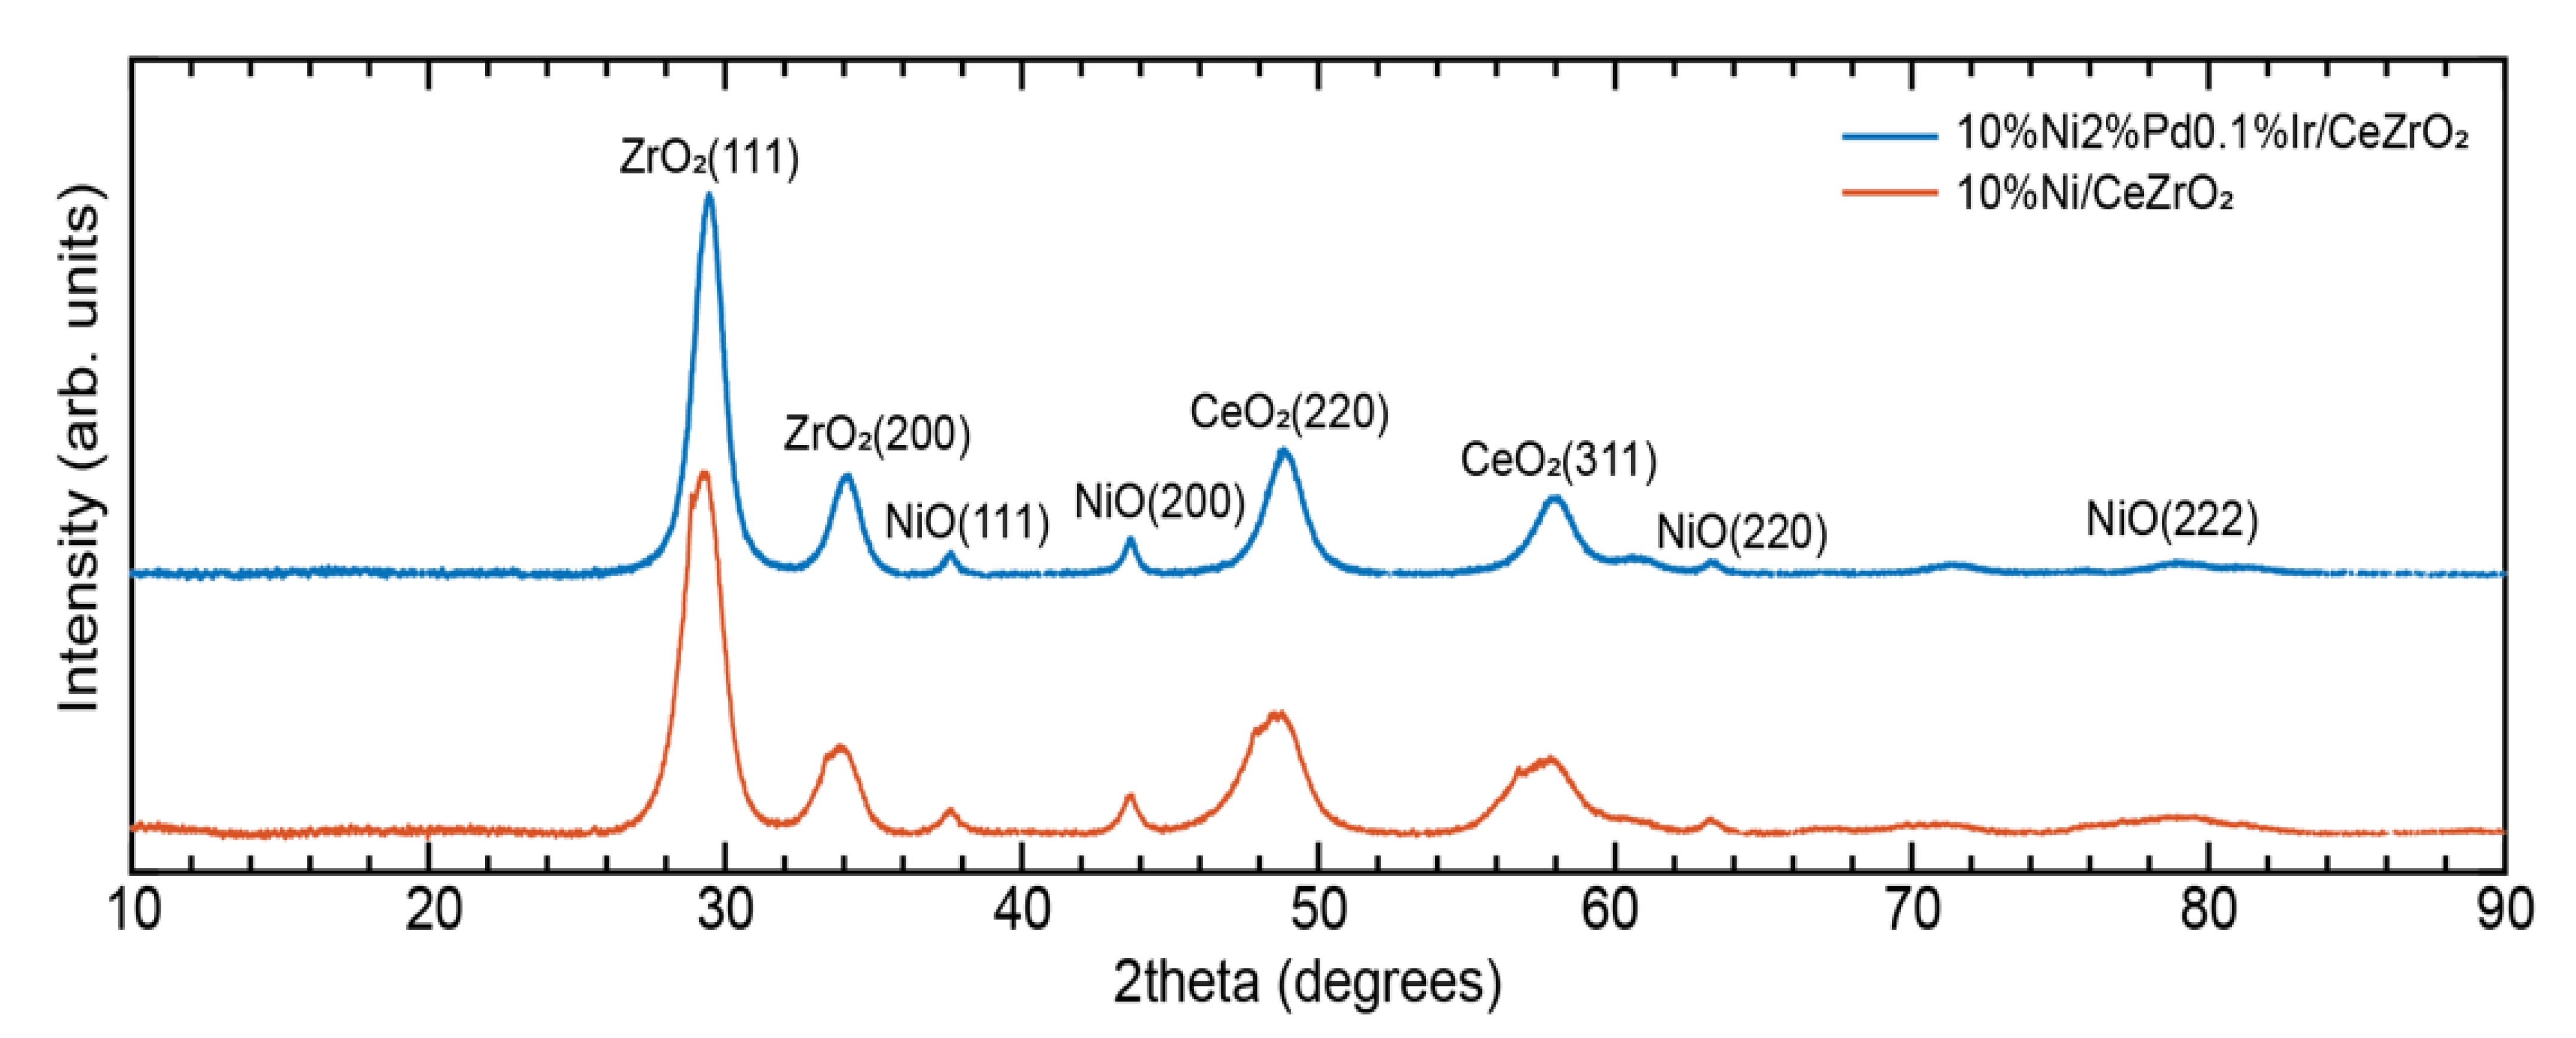
Figure 1. XRD pattern of 10 wt%Ni 2 wt%Pd 0.1 wt%Ir/CeZrO2 and 10 wt%Ni/CeZrO2 catalysts.
Catalysts 11 01076 g001
Figure 2. TPR-H2 of fresh and spent 10 wt%Ni 2 wt%Pd 0.1 wt%Ir/CeZrO2 and 10 wt%Ni/CeZrO2 catalysts.
Catalysts 11 01076 g002
Figure 3. CO2 conversion and CO selectivity of 10 wt%Ni 2 wt%Pd 0.1 wt%Ir/CeZrO2 and 10 wt%Ni/CeZrO2 catalysts at 750 °C and 1 bar pressure.
Catalysts 11 01076 g003
Figure 4. Catalyst activity measured as CO2 conversion at 750 °C at different feed ratios (H2:CO2).
Catalysts 11 01076 g004
Figure 5. CO2 conversion of 10 wt%Ni 2 wt%Pd 0.1 wt% Ir/CeZrO2 and 10 wt%Ni/CeZrO2 at different temperatures. Figure 5 shows the data of catalytic activity for both catalysts at different temperatures, expressed as carbon dioxide conversion. Results obtained was at feed ratio (H2/CO2) of 1:1 and at 1 bar pressure.
Catalysts 11 01076 g005
Figure 6. Diagram of RWGS reaction setup for catalytic activity test.
Catalysts 11 01076 g006
Table 1. BET-BJH results of fresh and spent 10 wt%Ni 2 wt%Pd 0.1 wt%Ir/CeZrO2 and 10 wt% Ni/CeZrO2 catalysts.
CatalystBETSurface Area (m2/g)
Pore Volume (cm3/gcat)Pore Size (Å)
Fresh 10 wt%Ni 2 wt%Pd 0.1 wt%Ir/CeZrO20.197895
Fresh 10 wt% Ni/CeZrO20.2078100
Spent 10 wt%Ni 2 wt%Pd 0.1 wt%Ir/CeZrO20.1717035
Spent 10 wt% Ni/CeZrO20.2015941
Table 2. Volumes of gases of different feeds ratios H2/CO2 for 10 wt%Ni 2 wt%Pd 0.1 wt%Ir/CeZrO2 catalyst at 750 °C and 1 bar pressure.
Feed H2/CO2 (v/v)Volume of H2 (mL/min)Volume of CO2(mL/min)
1/12525
1/520100
1/1017170
1/1812216
1/2512300
Publisher’s Note: MDPI stays neutral with regard to jurisdictional claims in published maps and institutional affiliations.