Article

On the Use of Dual Cell Density Monoliths

1
Departamento de Ingenieria Quimica y Ambiental, Universidad Tecnica Federico Santa Maria, Valparaíso 2390123, Chile
2
Department of Chemical and Materials Engineering, University of Alberta, Edmonton, AB T6G 2R3, Canada
*
Author to whom correspondence should be addressed.
Catalysts 2021, 11(9), 1075; https://doi.org/10.3390/catal11091075
Submission received: 26 July 2021 / Revised: 29 August 2021 / Accepted: 2 September 2021 / Published: 7 September 2021
(This article belongs to the Special Issue Multi-Scale Modeling of Structured Catalytic Reactors)

Abstract

:
Monolith-type substrates are extensively used in automotive catalytic converters and have gained popularity in several other industrial processes. Despite their advantages over traditional unstructured catalysts, such as large surface area and low pressure drop, novel monolith configurations have not been investigated in depth. In this paper, we use a detailed computational model at the reactor scale, which considers entrance length, turbulence dissipation and internal diffusion limitations, to investigate the impact of using a dual cell substrate on conversion efficiency, pressure drop, and flow distribution. The substrate is divided into two concentric regions, one at its core and one at its periphery, and a different cell density is given to each part. According to the results, a difference of 40% in apparent permeability is sufficient to lead to a large flow maldistribution, which impacts conversion efficiency and pressure drop. The two mentioned variables show a positive or negative correlation depending on what part of the substrate—core or ring—has the highest permeability. This and other results contribute relevant evidence for further monolith optimization.

1. Introduction

The catalytic converter forms the basis of the automotive exhaust gas after treatment systems (EGATS) used on most passenger vehicles in Europe, North America, and other regions to control emissions such as carbon monoxide, hydrocarbons, and oxides of nitrogen. Although the catalyst formulation varies depending on the mode of engine operation, the heart of the catalytic converter is the multichannel honeycomb monolith substrate, the walls of which are covered with the catalytic washcoat. The monolith substrate can be made from either metal or extruded cordierite; here, we limit the discussion to the more common cordierite versions [1]. Furthermore, we discuss the straight-through design, and not the type used in wall flow filters. This type of substrate has proven to be convenient in many industrial processes, such as carbon dioxide hydrogenation [2], monopropellant thrusters [3], and pharmaceutical synthesis [4]. For some years, there has been an interesting discussion about the role of structured catalyst supports in the next generation of optimized substrates, where 3D printing and computational models are used as ideal tools to explore innovative substrate configurations [5,6,7].
Clearly, the catalyst activity is of paramount importance, and plays a key role in conversion efficiency. However, the form of the substrate is equally important. There are essentially three physical quantities that among them allow a complete description of the resulting converter. These are the cell density, the wall thickness, and the washcoat loading. The cell density is the measure of the number of channels that are present per unit frontal area, typically reported in cells per square inch (CPSI). The first automotive converters typically had 400 CPSI, but in the past two decades or so, there has been interest in monoliths with higher cell densities of 600 or 900 CPSI. The nominal wall thickness is traditionally reported in thousands of an inch (mil) with the standard value being 6.5. Improved technology has allowed for thin (about 4.3 mil) and ultrathin (about 2.5 mil) walls. Monoliths with a higher cell density typically have thinner walls. The washcoat typically occupies about 12% by volume of the monolith [8]. The cell density and wall thickness dictate the channel size which, combined with the washcoat loading, govern the open frontal area (OFA), which is equal to the monolith porosity. Desirable properties of a catalytic converter include fast thermal response to give a short light-off time, which implies a low thermal mass. Thin wall monoliths generally have a lower bulk density, and hence, a lower thermal mass. Moreover, a low pressure drop is advantageous because it reduces fuel consumption. Pressure drop depends on both the OFA and the channel size, with larger channels giving a lower pressure drop. Further related to the channel size is the average washcoat thickness, as well as the external surface area of the washcoat that is exposed to the gas. These factors can both affect the conversion obtained.
The use of an inlet diffuser combined with external heat losses from the converter gives rise to nonuniform radial velocity and temperature profiles in the monolith. The flow distribution in monolith-type converters has been extensively studied over the past several decades, both experimentally and using computational modeling, with various geometries [9] and transient conditions [10]. Some studies have specifically looked at the effect of flow distribution on the light-off performance [11,12,13,14,15]. Other studies have modeled efforts to alter the flow distribution using flow tailoring devices [16,17]. As high-cell-density monoliths tend to have a lower thermal mass, their use has been proposed to reduce the light-off time (see for example [18,19]). When the cell density is changed, a number of other properties including the flow distribution are also affected, so it is necessary to include all of these effects in a model [20]. Another idea that has been proposed is to use composite monoliths composed of rings of various cell densities to improve the light-off performance [21]. The effect of such a design was briefly explored in [22], who showed that combining 400- and 900-CPSI cell density substrates reduced the light-off performance, compared to the use of a single cell density.
In view of the literature extant on the subject of the effect of flow distribution and cell density on the light-off performance, and recent commercial developments, this paper presents a computational study of the effects of using dual-cell-density structures in monolith catalytic converters. The effects of such structures on the velocity and temperature distributions, and subsequently, on the chemical conversion is demonstrated for a variety of dual-cell configurations.

2. Computational Model

This section describes the computational model implemented.

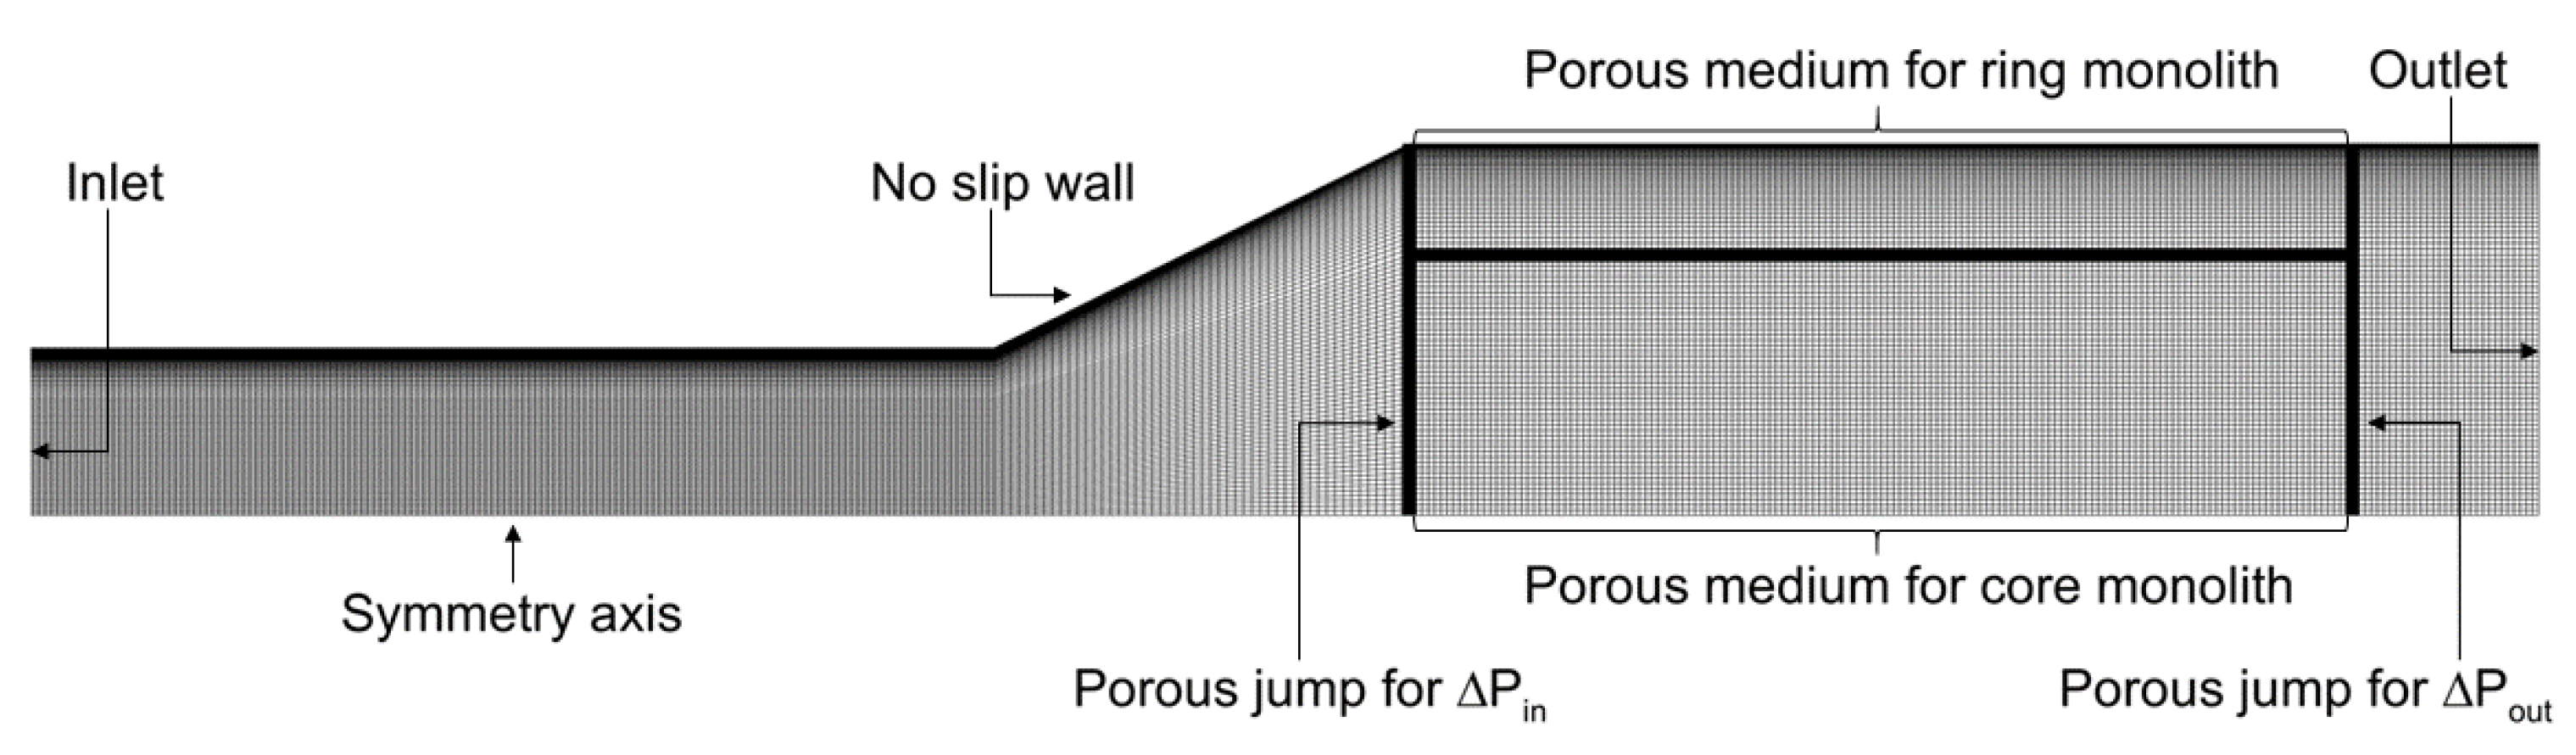
2.1. Description of the Domain

The domain tested was a catalytic converter, similar to those tested in experimental rigs [23]—that is, an inlet pipe, in this case, 1000 mm long and 27 mm in diameter, followed by a 67 mm-long diffuser connecting the pipe with a monolith 152 mm-long and 60 mm in diameter. The outlet cone was replaced by a straight pipe of the same diameter as the monolith and 30 mm-long, which has a marginal effect upwind of the domain and makes it easier to register the radial profiles of the variables of interest at the outlet of the substrate. The monolith was assumed to have square cross-section channels and be made of cordierite with a cordierite porosity of 30%. The idea was to compare homogeneous- and heterogeneous-cell-density monoliths; hence, the zone of the substrate was divided into two concentric regions: one at the center, referred to as the “core”; the other at the periphery, referred to as the “ring”. Figure 1 shows such a domain, where one half of the transverse area was given to the core and the other to the ring.
Two extensively used monolith sizes were taken as reference. The first size was a 400/6.5 monolith—that is, a monolith with 400 channels per square inch and a wall thickness of 6.5 mil. The second size was 900/2.5. The four combinations listed below were tested:
i.
400c/400r
ii.
400c/900r
iii.
900c/900r
iv.
900c/400r
In the list, the subscript “c” means core and “r” means ring. So, case (ii) 400c/900r had a 400/6.5 monolith in the center and a 900/2.5 monolith in the periphery. In all of the cases, the volume of washcoat was considered to be 12% of the total substrate volume and the channels were assumed to become approximately circular after being washcoated.

2.2. Flow Model

A computational model based on the finite volumes approach was used. The flow through the domain was assumed to be turbulent and was modeled using the Reynolds-Averaged Navier–Stokes (RANS) approach, with the two-equation SST k- ω model [24]. The continuity and momentum conservation equations for a steady state and without gravitational effects are
( ρ u i ) x i = 0
( ρ u i u j ) x j = p x i + x j μ u i x j + u j x i 2 3 u i x i δ i j τ i j x j + S u i
The closure is provided by the Boussinesq “eddy viscosity” approximation in Equation (3) as follows:
τ i j = u i u j ¯ = μ t u i x j + u j x i 2 3 u i x i δ i j
The turbulence viscosity ( μ t ) is modeled as follows:
μ t = ρ k ω 1 M a x 1 α * , S F 2 a 1 ω
The transport equations for the turbulence kinetic energy (k) and the specific turbulence dissipation rate ( ω ) are modeled by the SST model as follows:
( ρ k u i ) x j = μ + μ t σ k k x j + μ t S 2 ρ β * k ω + S k s i n k + S k g e n
( ρ ω u i ) x j = μ + μ t σ ω ω x j + α ω α * ρ μ t S 2 ρ β * ω 2 + 2 ( 1 F 1 ) ρ 1 ω σ ω 2 k x j ω x j + S ω s i n k + S ω g e n
The values of the constants and blending functions, Equations (4) to (6), can be found in [24,25]. The term S u i in Equation (2) had a nonzero value only inside the porous medium and was used to account for the extra head loss due to flow passing through the monolith. This part of the domain contained the core and peripheral monoliths and was modeled using the continuum approach. The apparent permeability was computed with Darcy’s Law, in the form of the momentum sink term ( S u i ):
S u i = μ α i u i
The apparent permeability ( α i ) was considered to be anisotropic, with the radial component being three orders of magnitude lower than the axial one. That allowed flow only in the axial direction inside of the substrate, as expected in a flow-through monolith. To consider the inlet and outlet effects, entrance length, and fully developed region, a multizone permeability approach was used [26]. This model has also been tested in wall-flow monoliths [27]. The value of the axial permeability ( α a x i a l ) is obtained from Equation (8).
α a x i a l = 2 ϕ D H 2 f ( 1 / Gz ) = 1 2 ϕ D H 2 Re c 1 ( 1 / Gz ) n + 64 n ( 1 / n )
In Equation (8), we considered c 1 = 2.5855 and n = 2.1154, which were taken from [28]. The inverse of Graetz number ( 1 / Gz) was used as a dimensionless distance and was defined as 1 / Gz = ( x x 0 ) / D RePr, where x 0 was the axial coordinate marking the entrance of the substrate. Two porous jumps, that is, two sudden decreases in pressure, modeled the extra losses because of the flow entering and leaving the substrates. One was placed at the front ( Δ p i ) and one at the rear ( Δ p o ) face of the catalytic zone. The magnitude of the losses were computed using Equations (9) and (10). It should be emphasized that those porous jumps depend on the geometrical features of the substrate; hence, they were computed separately for the core and ring substrate when using a heterogeneous cell density.
Δ p i = ( f 1 | inlet ) μ u c + ( f 2 | inlet ) 1 2 ρ u c 2
Δ p o = ( f 2 | outlet ) 1 2 ρ u c 2
The terms f 1 and f 2 were calculated by two polynomials obtained from [26], using the channel velocity ( u c ) and ϕ m . The additional loss due to the flow entering at an angle to the substrate was accounted for using the methodology proposed in [29].

2.3. Treatment of the Turbulence

According to previous works [30,31], the upstream turbulence decays smoothly once the flow enters the monolith channels. To account for that phenomenon, the two sink terms S k s i n k and S ω s i n k in Equations (5) and (6) were implemented in the catalytic zone. The two sink terms were computed as in Equations (11) and (12). Values of B ω = 3/4, C ω = 6 were taken from [32]. Δ c v is the characteristic length of the control volumes.
S k s i n k = μ + μ t α i k
S ω s i n k = μ α i ω C ω μ / ρ β ω Δ c v 2 / 4
Once the turbulence dissipates completely inside the monolith channels, the flow regime becomes laminar unsteady. In the operating conditions considered in this paper, such a regime produces a pressure drop almost identical to that of steady flow [33]—that is, additional corrections to the pressure drop were not necessary. Turbulence generation after the monoliths was not considered in this work. According to the literature, the flow may become unsteady and even generate turbulence kinetic energy when Re w = L w ρ u / μ is higher than 100 [34]. In that calculation, L w is the thickness of the corners between channels and can be estimated as 2 (cell size- D H ). For the conditions of this paper, Re w ranged approximately from 20 to 60; hence, it was not necessary to account for an additional generation of k at the exit of the monolith. Interested readers are referred to [31,35] for additional information on the topic.

2.4. Species Transport and Reactions Model

The transport equation for each chemical species is
( ρ u i w l ) x j = x j μ t Sc t + ρ D l , eff w l x i G l
The parameter D l , eff in Equation (13) is the effective diffusivity coefficient of species “l”. To be consistent with the flow inside a straight-channel monolith, this parameter was set as zero in the radial direction inside the substrate—that is, allowing no mass transfer between contiguous channels. The term G l is the rate of conversion of the species l in the catalytic oxidation of CO, which is CO + 1 2 O 2 CO 2 . The expression reported by Voltz et al. [36] was used for the rate of conversion of CO, O 2 , and CO 2 . This reaction rate was presented in terms of the washcoat external surface; however, in this work, it was manipulated to be applicable to the equivalent substrate volume, as in Equation (14).
G CO m = 1 2 G O 2 m = G C O 2 m = η m S V m f w m ϕ m A w exp E w R T Y CO Y O 2 1 + A A exp E A R T Y CO 2
In Equation (14), subscript “m” indicates the cell density of the monolith, since the effective rate differed for the 400/6.5 and 900/2.5 monoliths. Y i is the mole fraction of the “i” component. η m is the local effectiveness factor, which accounts for the internal diffusion limitations. S V m , ϕ m , and f w m are the external surface to volume ratio, void fraction, and washcoat volume over free volume ratio of the m monolith after washcoating, respectively. These factors allowed us to compute the effective rate expressed in terms of the equivalent volume of substrate. Their numerical values are listed in Table 1. The other parameters are A w = 4.14 × 10¹¹ mol/m 2 s, E w = 104,756 J/mol, A A = 65.5 J/mol, and E A = 7990 J/mol. All of them were taken from [36].
The effectiveness factor in Equation (14) was calculated as in Equation (15) based on the Thiele modulus ( Φ m ). The latter can be reasonably estimated by assuming diffusion predominantly in the radial direction only and using Equation (16).
η m = tanh Φ m Φ m
Φ m = L c m k r D l , e f f
For the calculation of the Thiele modulus, the effective diffusion was estimated by using the Knudsen diffusion coefficient and the parallel pore model, as in Equation (17). M CO is the molar mass of CO, the washcoat porosity ( ε w ) is 0.5, and is taken from [37]. According to the parallel pore model, tortuosity is the reciprocal of porosity; hence, the washcoat tortuosity factor ( τ w ) was 2. The pore diameter ( d p ) was 10 nm [37].
D l , e f f = ε w τ w 48.5 d p T M CO
Thiele modulus, as written in Equation (16), considers a first-order powerlaw-type reaction rate, which is not the case of the rate in Equation (14). To overcome this issue, the pseudo-first-order rate approximation was used [38]. In a brief manner, k r lumps all of the terms in the reaction rate, but the concentration of the species of interest. That is, k r = G CO / [ CO ] .
Finally, the characteristic length ( L c m ) was estimated by taking into account that the washcoat tends to fill the corners of the channels, giving to the channels a sort of octo-square cross-section shape. In that case, the washcoat is approximately distributed in four triangular cross-section layers at the corners of the channels (see Figure 2). The average thickness of the triangles can be obtained by basic geometry. The values of L c m for both 400/6.5 and 900/2.5 monoliths with 12% in volume of washcoat are presented in Table 1.

2.5. Heat Transfer Model
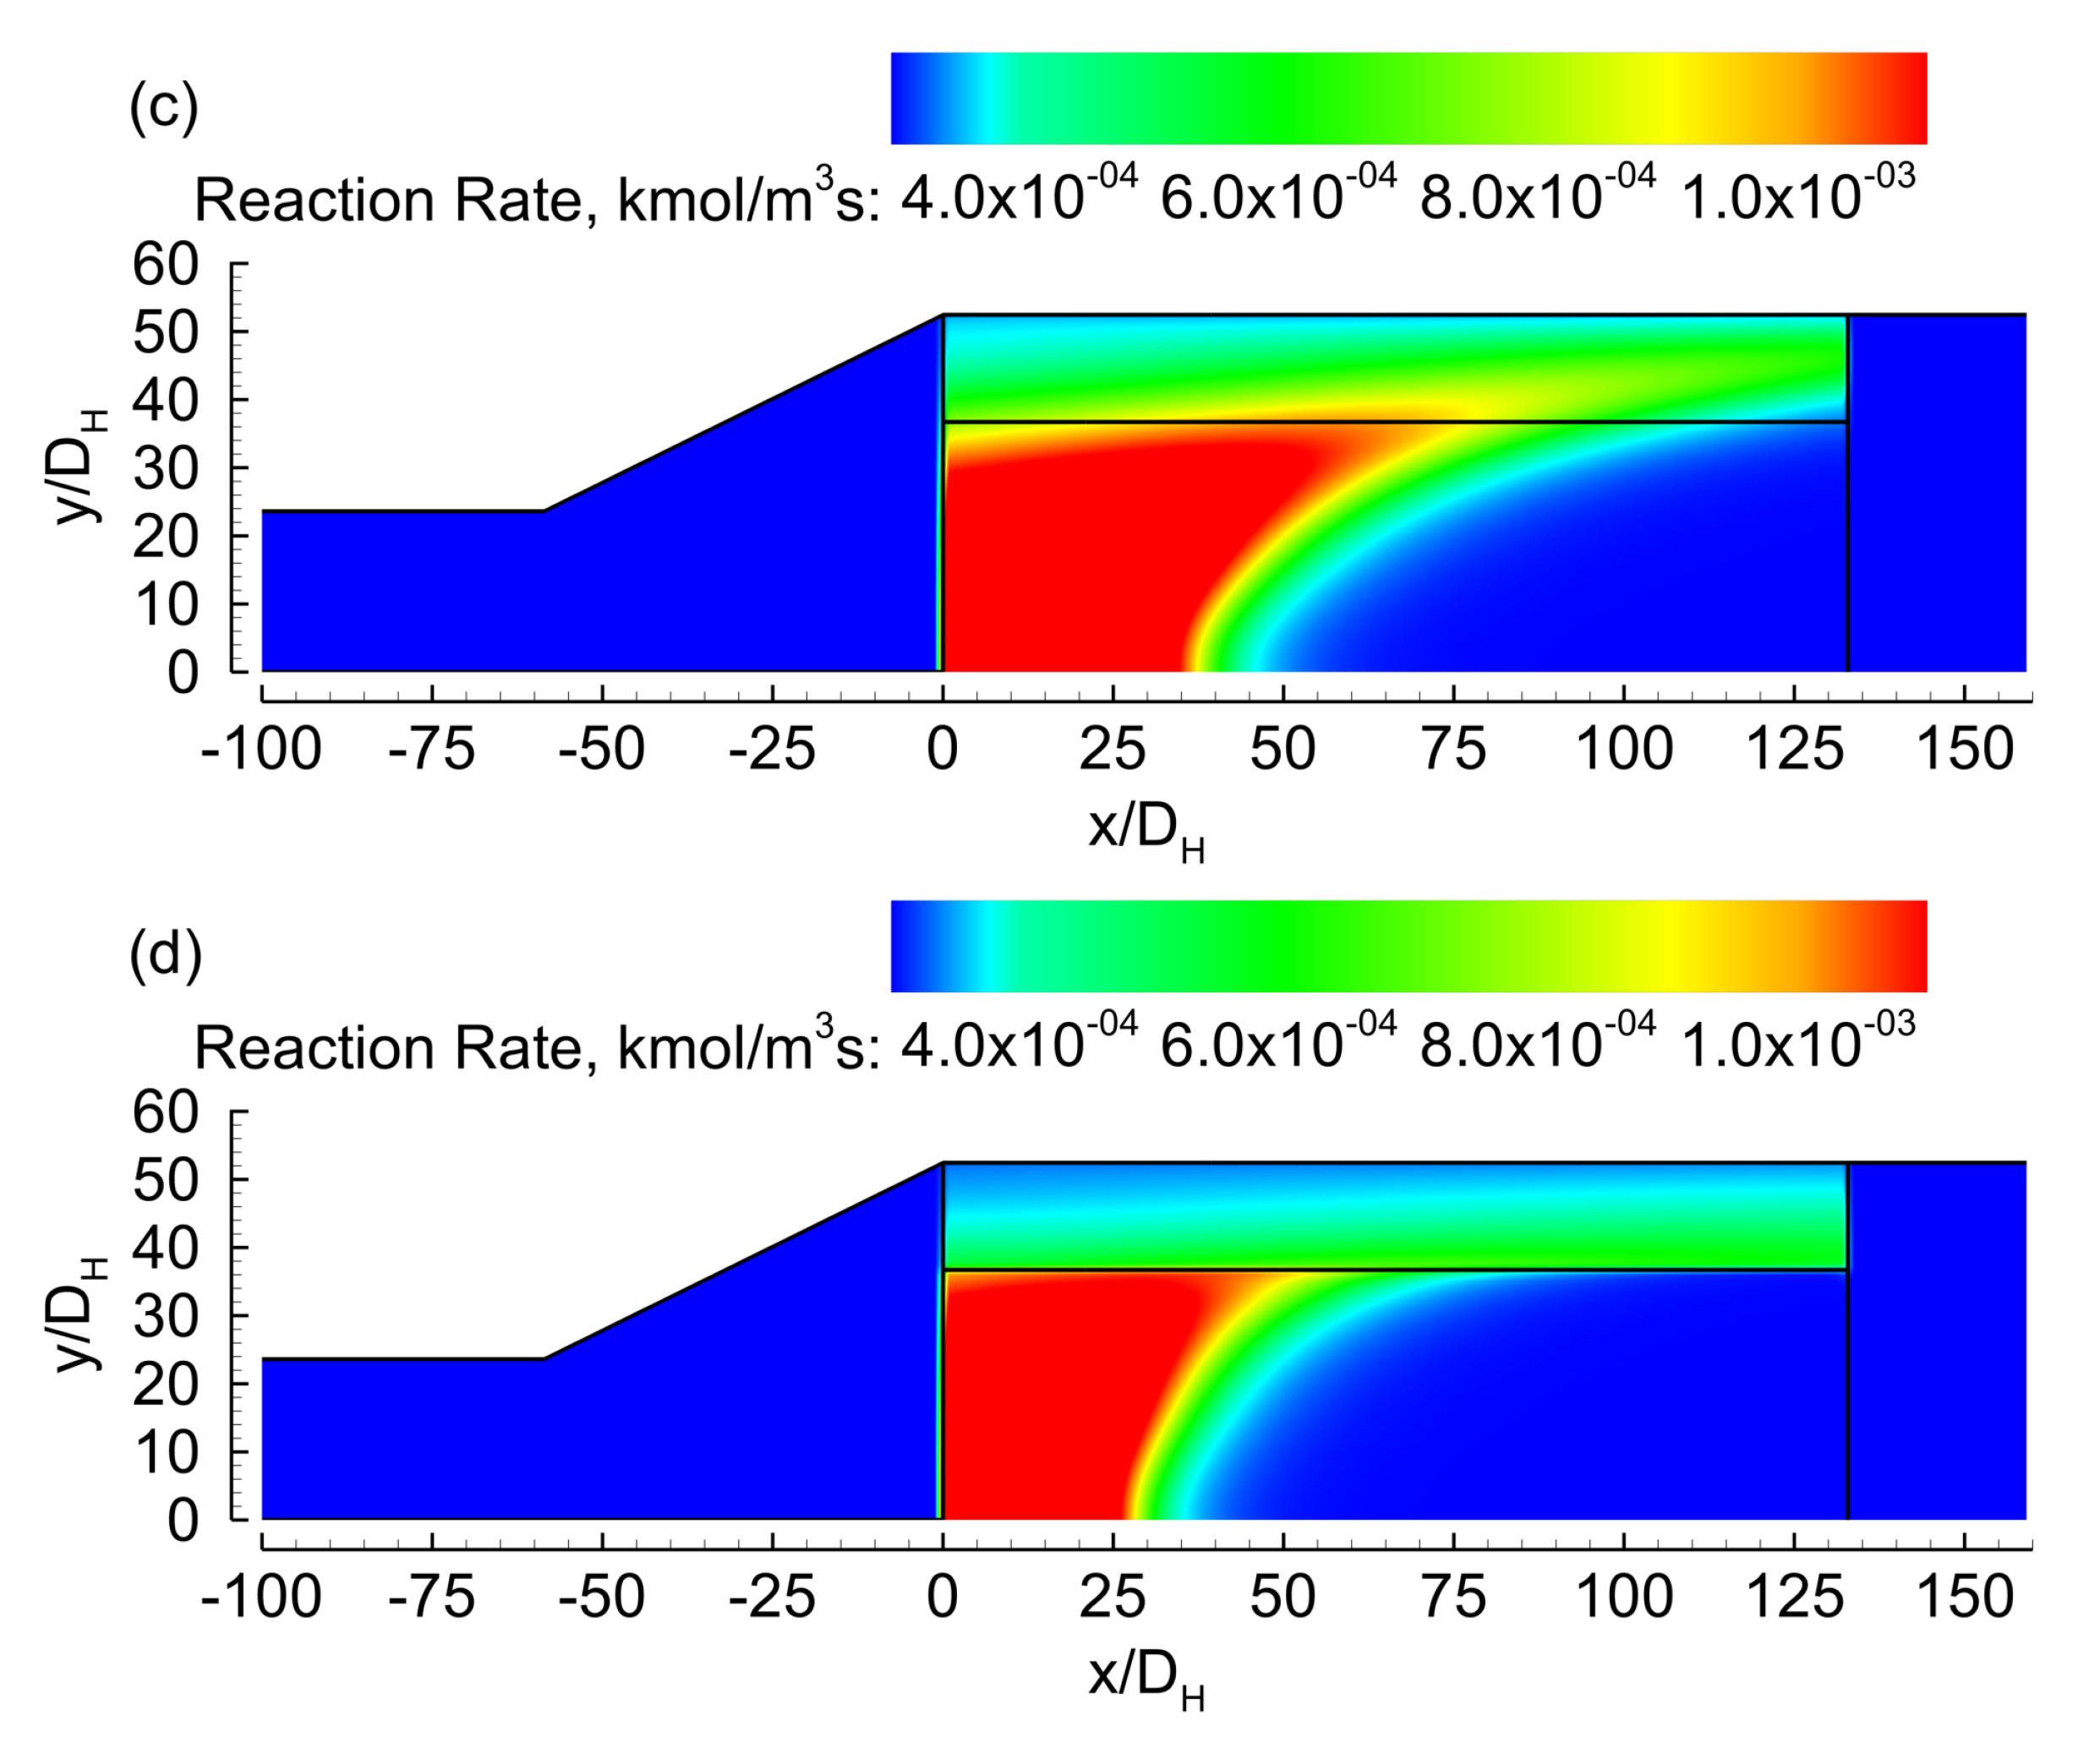
The steady-state thermal energy transport equation is as follows:
( ρ u i C P T ) x i = x j C P Pr t μ t + k i T x i + Q R
The term Q R in the energy equation represents the thermal energy generated from the chemical reaction. Thermal equilibrium was assumed between the solid and the fluid phases in the monolith region. That is, the temperature between the flow inside of the channels and the solid is approximately the same. Such a condition is reasonable in steady state for the system studied [39]. For nonthermal equilibrium models with temperature-dependent fluid properties and upstream turbulence, interested readers are referred to Refs. [40,41]. The overall thermal conductivity in the substrate was anisotropic, being the axial and the radial ones in Equations (19) and (20), respectively.
k a x i a l = k c p ( 1 ϕ ) + k x x ϕ
k r a d i a l = k c p ( 1 ϕ ) + k r r ϕ
where k c p is the thermal conductivity of the solid substrate, ϕ is the frontal open area of the corresponding monolith, and k x x and k r r are estimated according to Hayes et al. [42]. The operating fluid was considered an ideal gas mixture of CO, O 2 , and N 2 at 1 bar, with temperature-dependent physical properties. Specifically, density was computed as an ideal gas, viscosity and thermal conductivity came from the kinetic theory of gases, and the heat capacity from a 5th-order polynomial, everything as implemented in ANSYS Fluent v2020R2 [25].
The boundary condition for the top was set as no-slip wall for momentum and convective losses for energy. An external temperature of 293 K was used. The convective heat transfer coefficient was 15 W/m 2 -K in the inlet pipe and diffuser, while a lower one of 1.6 W/m 2 -K was used in the boundary corresponding to the reactive zone. This lower value was to account for the extra insulation typically observed in catalytic converters. The flow entering the inlet pipe had a composition of CO of 2000 PPM, 10% in mass of O 2 , and the rest was N 2 . The inlet temperature was 500 K and the GSHV was 20,000 1/h. For turbulence, an inlet turbulence viscosity ratio of 5 and a turbulence intensity of 15% were considered.
The domain was discretized in a block-structured mesh containing only quadrilateral control volumes, as shown in Figure 1. A smooth refinement was used close to the wall to ensure a wall y + below one. This was corroborated after running the simulations. Two meshes were considered to investigate the grid independence of the solution. The first was 112,112 control volumes and the second had 448,448. The finest mesh resulted from dividing in four each element of the coarse mesh. The transport equations were discretized using a second-order upwinding scheme. The stop condition was set as reaching a value for the scaled residuals of 1 × 10⁻⁴ or lower, together with having a stable value for pressure drop, conversion, and maximum velocity magnitude. The pressure drop from both meshes differed by less than 0.1% and the CO conversion by less than 0.2%; hence, the study continued with the 112,112 control volumes mesh.

3. Results

This section summarizes the results obtained. The four combinations listed in Section 2.1 were investigated. First, we analyze in detail the cases where the core and ring had the same volume. Then, we report a brief parametric study where the size of the core increased progressively.

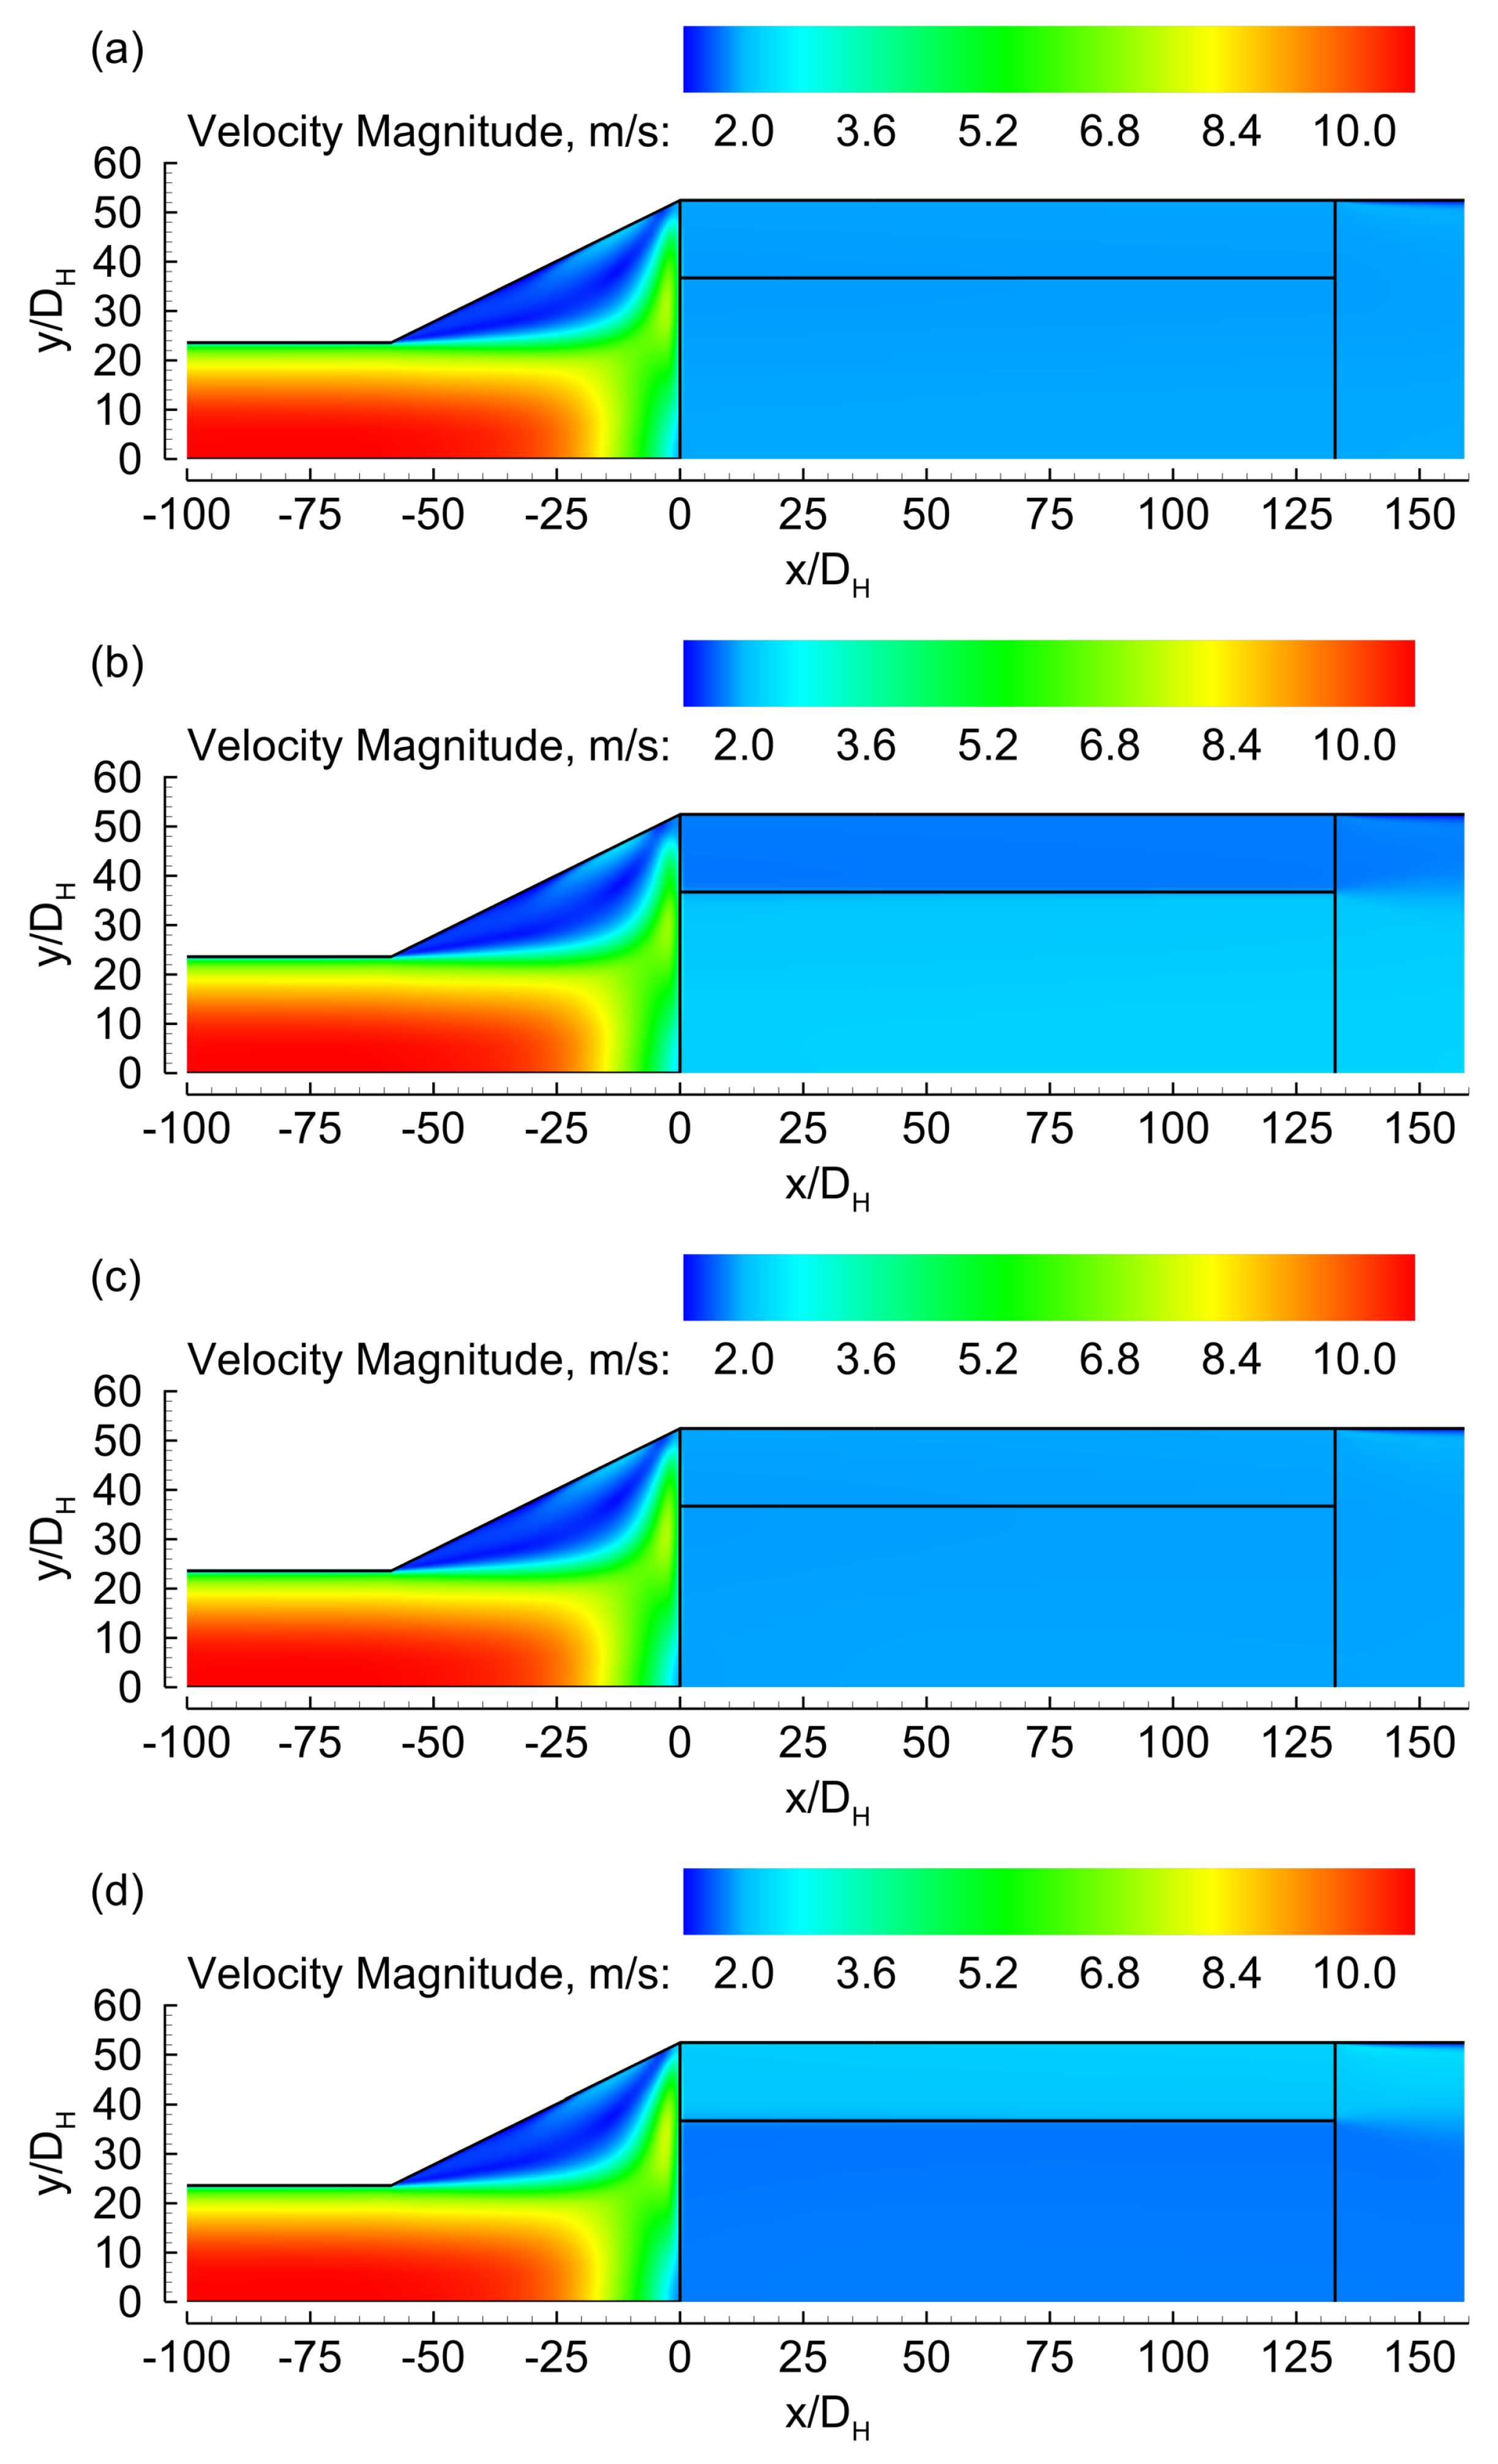
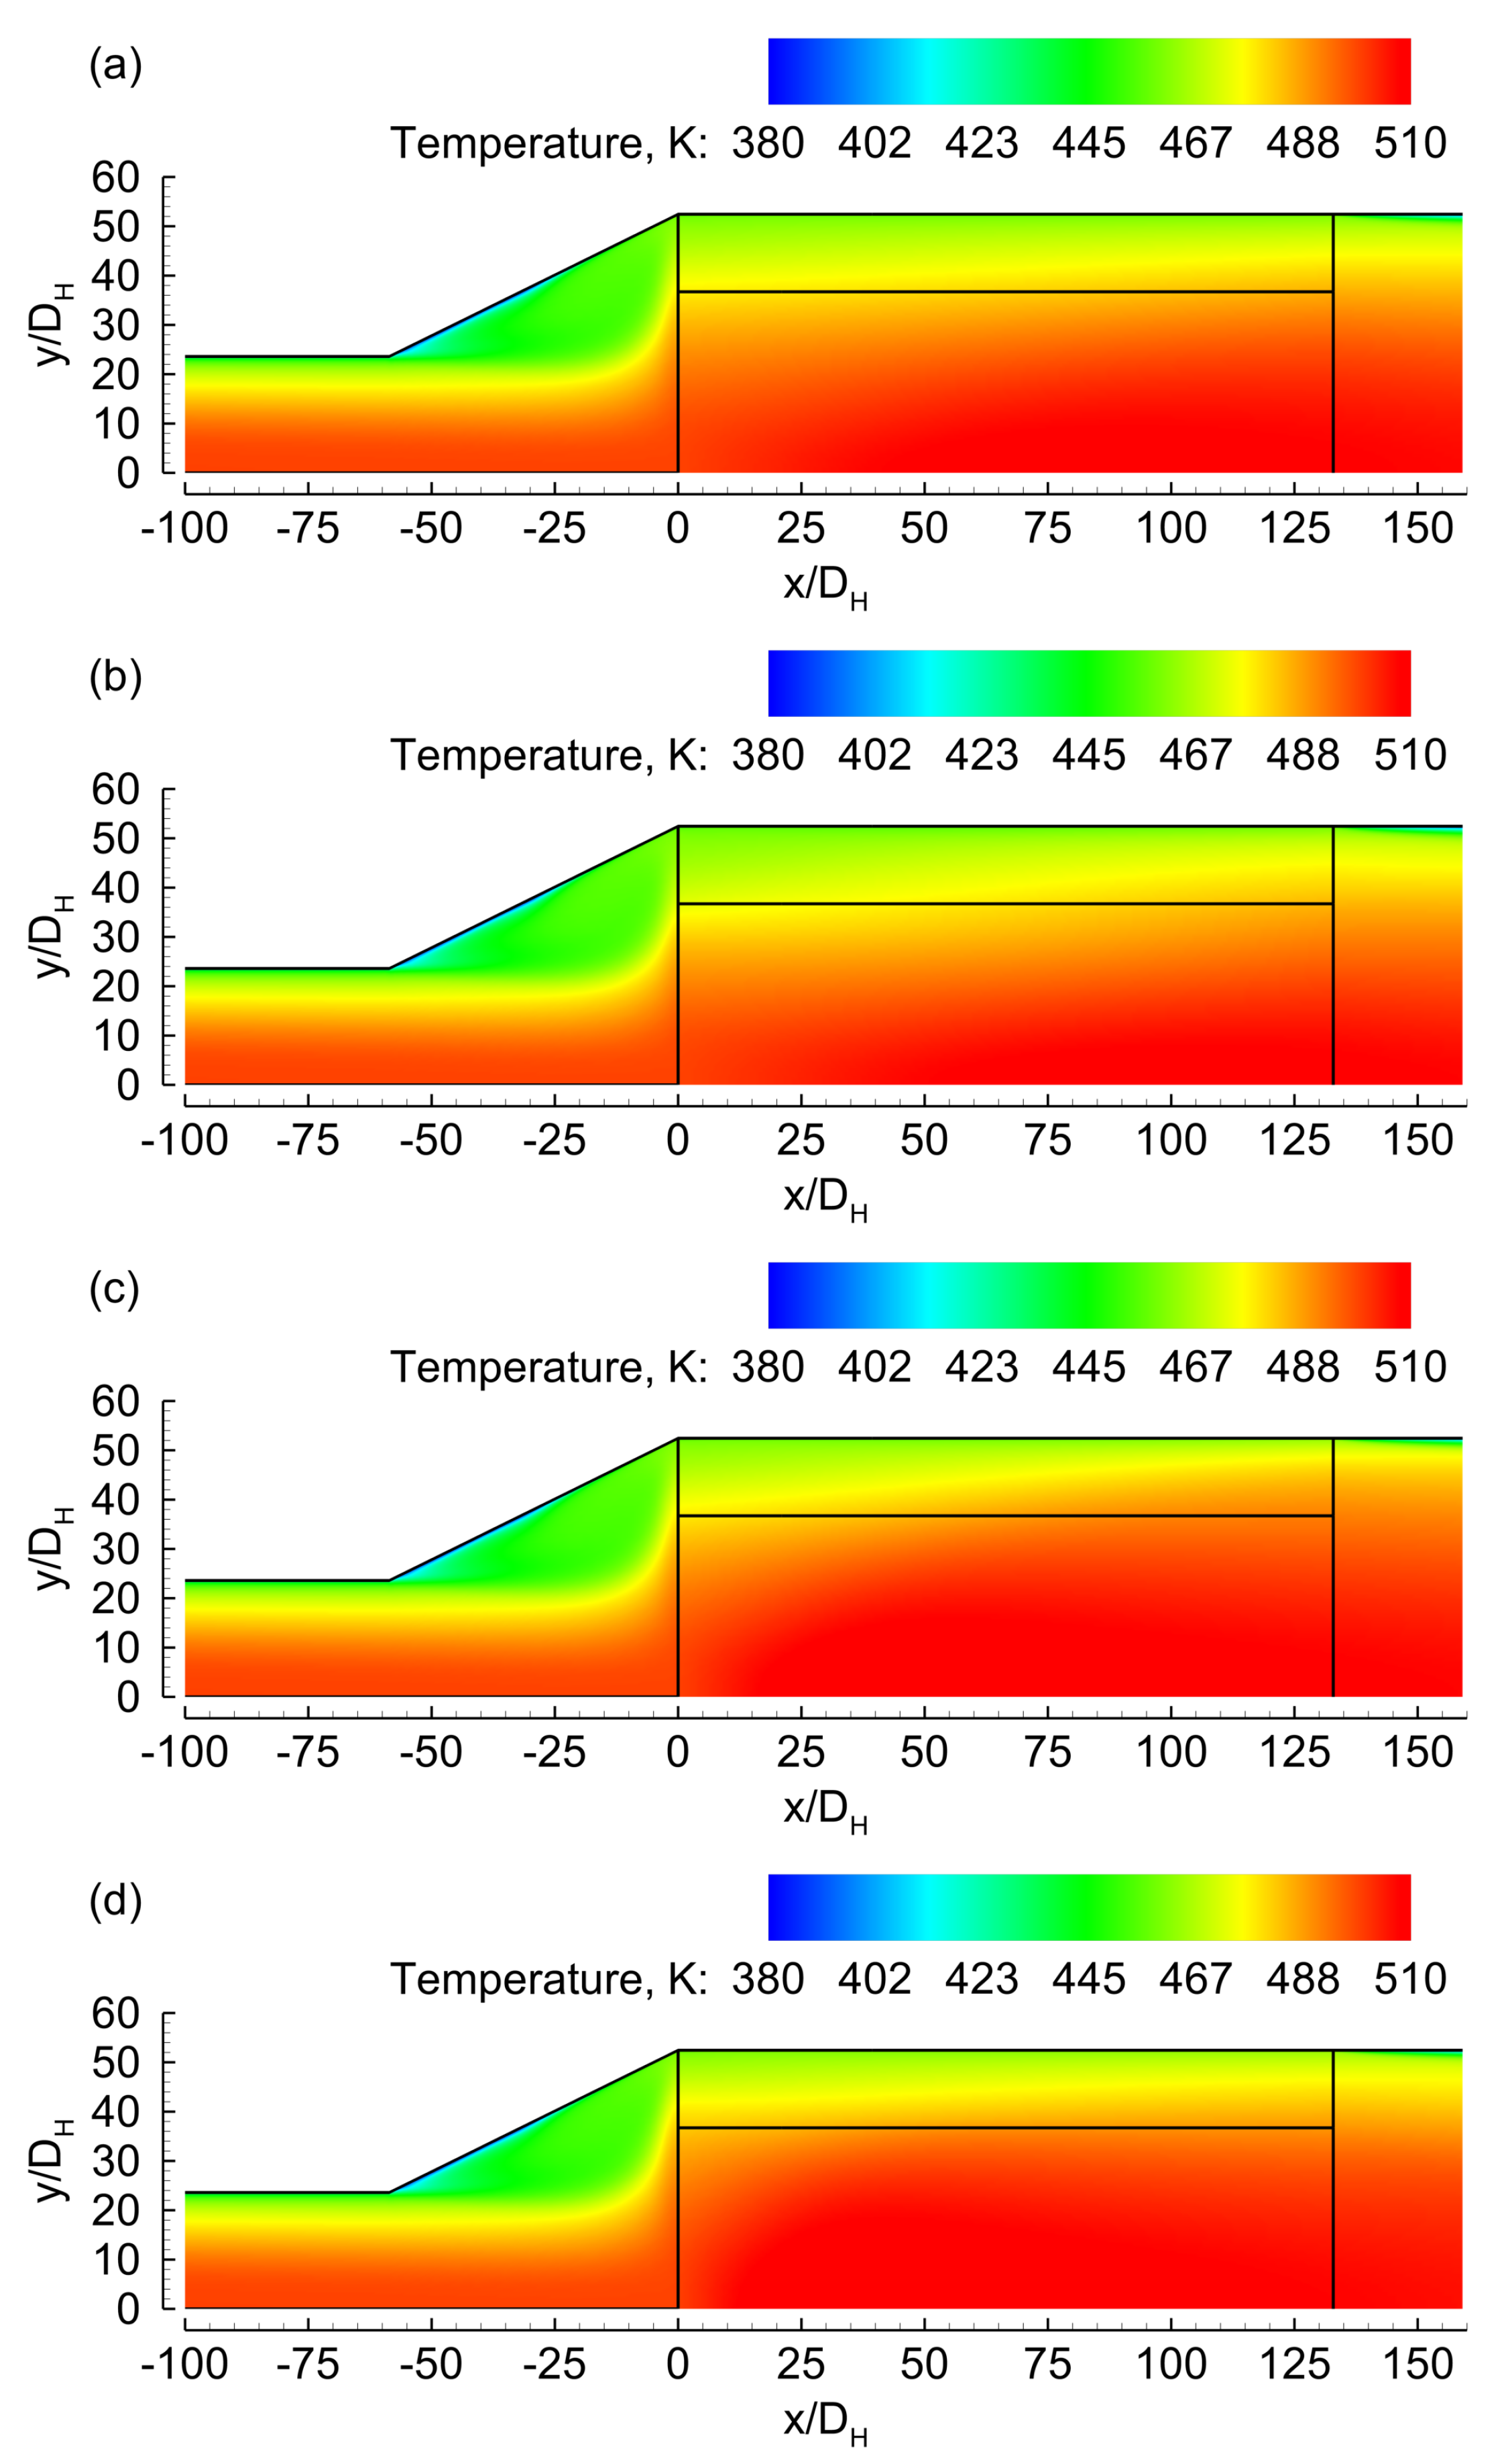
3.1. Evenly Distributed Dual Cell Density

Figure 3 shows the velocity over the domain for four cases. In two of the cases, (a) and (c), the ring and core had the same cell density. In those cases, the flow distribution was fairly homogeneous and similar between them, as can be seen in the velocity profile at the exit face of the substrate in Figure 3. On the other hand, for cases (b) and (d), where the core and ring had different cell densities, the flow distribution was largely affected by the combination of cell densities. The role of the diffuser is to spread the flow more uniformly across the face of the monolith; however, usually, the majority of the flow remains concentrated in the central section. Therefore, one might expect that, regardless of the cell densities used, the bulk of the flow might pass through the central zone. However, we observed a different behavior; indeed, the flow pattern in the diffuser has only a minor effect on the flow distribution when dual-zone monoliths are used. The main factor that determines the flow distribution in this case is the difference in the viscous resistance of the two monolith regions (core and ring). This can be observed in Figure 3. Comparing the permeability of the ring and core monoliths is indirect because the flow model considers the hydraulic entrance length. However, a quick inspection can be performed by analyzing their asymptotic friction factors in the fully developed region—that is, by comparing the factor ϕ m D H m 2 of both monoliths. According to the data in Table 1, the apparent permeability of the 900/2.5 monolith is only 40% lower than that of the 400/6.5 one. However, such a difference is sufficient to impact significantly the flow distribution.
It should be pointed out that there have been several efforts on improving the flow distribution inside a catalytic converter by adding diffuser elements, changing the inlet cone, and similar solutions [15,43,44,45], but using an optimized combination of cell densities, washcoat loading, and so on, has not been explored extensively yet.
The temperature distribution was also analyzed. According to the results in Figure 4, the temperature fields of the four cases are similar. Since heat is transferred to the exterior through the carcass, the ring monolith is expected to have a lower temperature than in the core. Let us call the “hot region” the zone with temperatures above 500 K. Slight differences can be seen when the core monolith is a 900/2.5 one, where the hot region covers almost the whole core. At the same time, the cases with a 400/6.5 monolith in the core had a lower average temperature. The change in temperature between the core and ring zones may have an impact on the flow distribution given the change in density; however, according to Figure 3 and Figure 5, the computed flow has a strong preference for the zone with the lowest cell count, regardless of the temperature. Despite the cell density of the ring monolith, the two cases with the 900/2.5 monolith in the core show higher temperatures than those with a core of 400/6.5. The thermal conductivity of the 400/6.5 substrate is approximately 30% higher than that of the 900/2.5 substrate; hence, a more homogeneous temperature would be expected in that region. It is also important to mention that both substrates differ in their void fraction but have the same 12% by volume of washcoat. Consequently, the washcoat represents a higher percentage of the solid volume in the 900/2.5 monolith than in the 400/6.5. This difference in washcoat fraction changes not only the thermal conductivity, but also the thermal mass of the reactork; therefore, it may have an impact on the light-off curve. Due to the many variables involved in the process, analyzing the light-off is beyond the scope of this work, but will be addressed in a further paper.
In agreement with the contour plots in Figure 4, the temperature profile at the outlet of the catalytic region of the four cases was also very similar (see Figure 6). Opposite to the flow distribution, there were no breaks or strong changes in tendency in the computed temperature profile, despite the transition of the cell count between the ring and core.
Figure 7 shows carbon monoxide conversion. For comparison purposes, local values of CO conversion were calculated. It should be clarified that the values in Figure 7 and Figure 8 were computed as ( W CO i W CO ) / W CO i , where W CO i and W CO are the inlet and local CO mass fraction of carbon monoxide respectively. In none of the cases analyzed was full depletion of CO reached; however, there are significant differences that are worth mentioning. First, full depletion of the CO was reached in the two substrates with a 900/2.5 monolith in the core. On the other hand, independent from the position—core or ring—the parts of the substrate with 400/6.5 monolith did not reach 100% conversion. A 900/2.5 monolith has a higher geometric surface area than a 400/6.5 monolith; however, the same volume percentage of washcoat was given to both monoliths, and hence, the same amount of catalyst; so, the latter was discarded as a possible explanation of the differences. Regarding the temperature, CO in the feed is fairly diluted; so, the heat released from the chemical reaction did not drive significant changes in the temperature field. The results may differ in other scenarios where the thermal effects of the chemical reactions are significant [46,47]. What should be taken into account is that the surface velocity is higher in the 400/6.5 substrate than in the 900/4.5—that is, a lower space time. According to the data in Table 1, the increase in space velocity when entering the substrate is 1.16 times higher in the 400/6.5 monolith than in the 900/2.5 one. Although this change is small, together with the inlet velocity (see Figure 3 and Figure 5), it led to a channel apparent velocity in the 400/6.5 monolith almost twice higher than that in the 900/6.5 monolith. Such a combination of factors is quite consistent with the results in Figure 7.
Figure 9 shows the reaction rate for the four combinations of ring and core monoliths where both had the same volume. The profiles are consistent with the results in Figure 7. In the core region, the reaction rate starts high, then it progressively decreases until full depletion of CO. It can bee seen from Equation (14) that the denominator in the rate expression is close to one, and also that, given the inlet composition, Y O is almost constant. Hence, the main factors driving the reaction rate are temperature and Y CO . According to Figure 4, the former is comparable in the four cases; so, the latter dominated the reaction rate. Among all of the other parameters in the rate expression, η m requires further attention. According to the data in Table 1, the characteristic washcoat length in the 400/6.5 monolith is almost 49% longer than the one in the 900/2.5 configuration. That impacts in the Thiele modulus; however, according to the local values observed in the results, it did not lead to significant differences in the effectiveness factor.

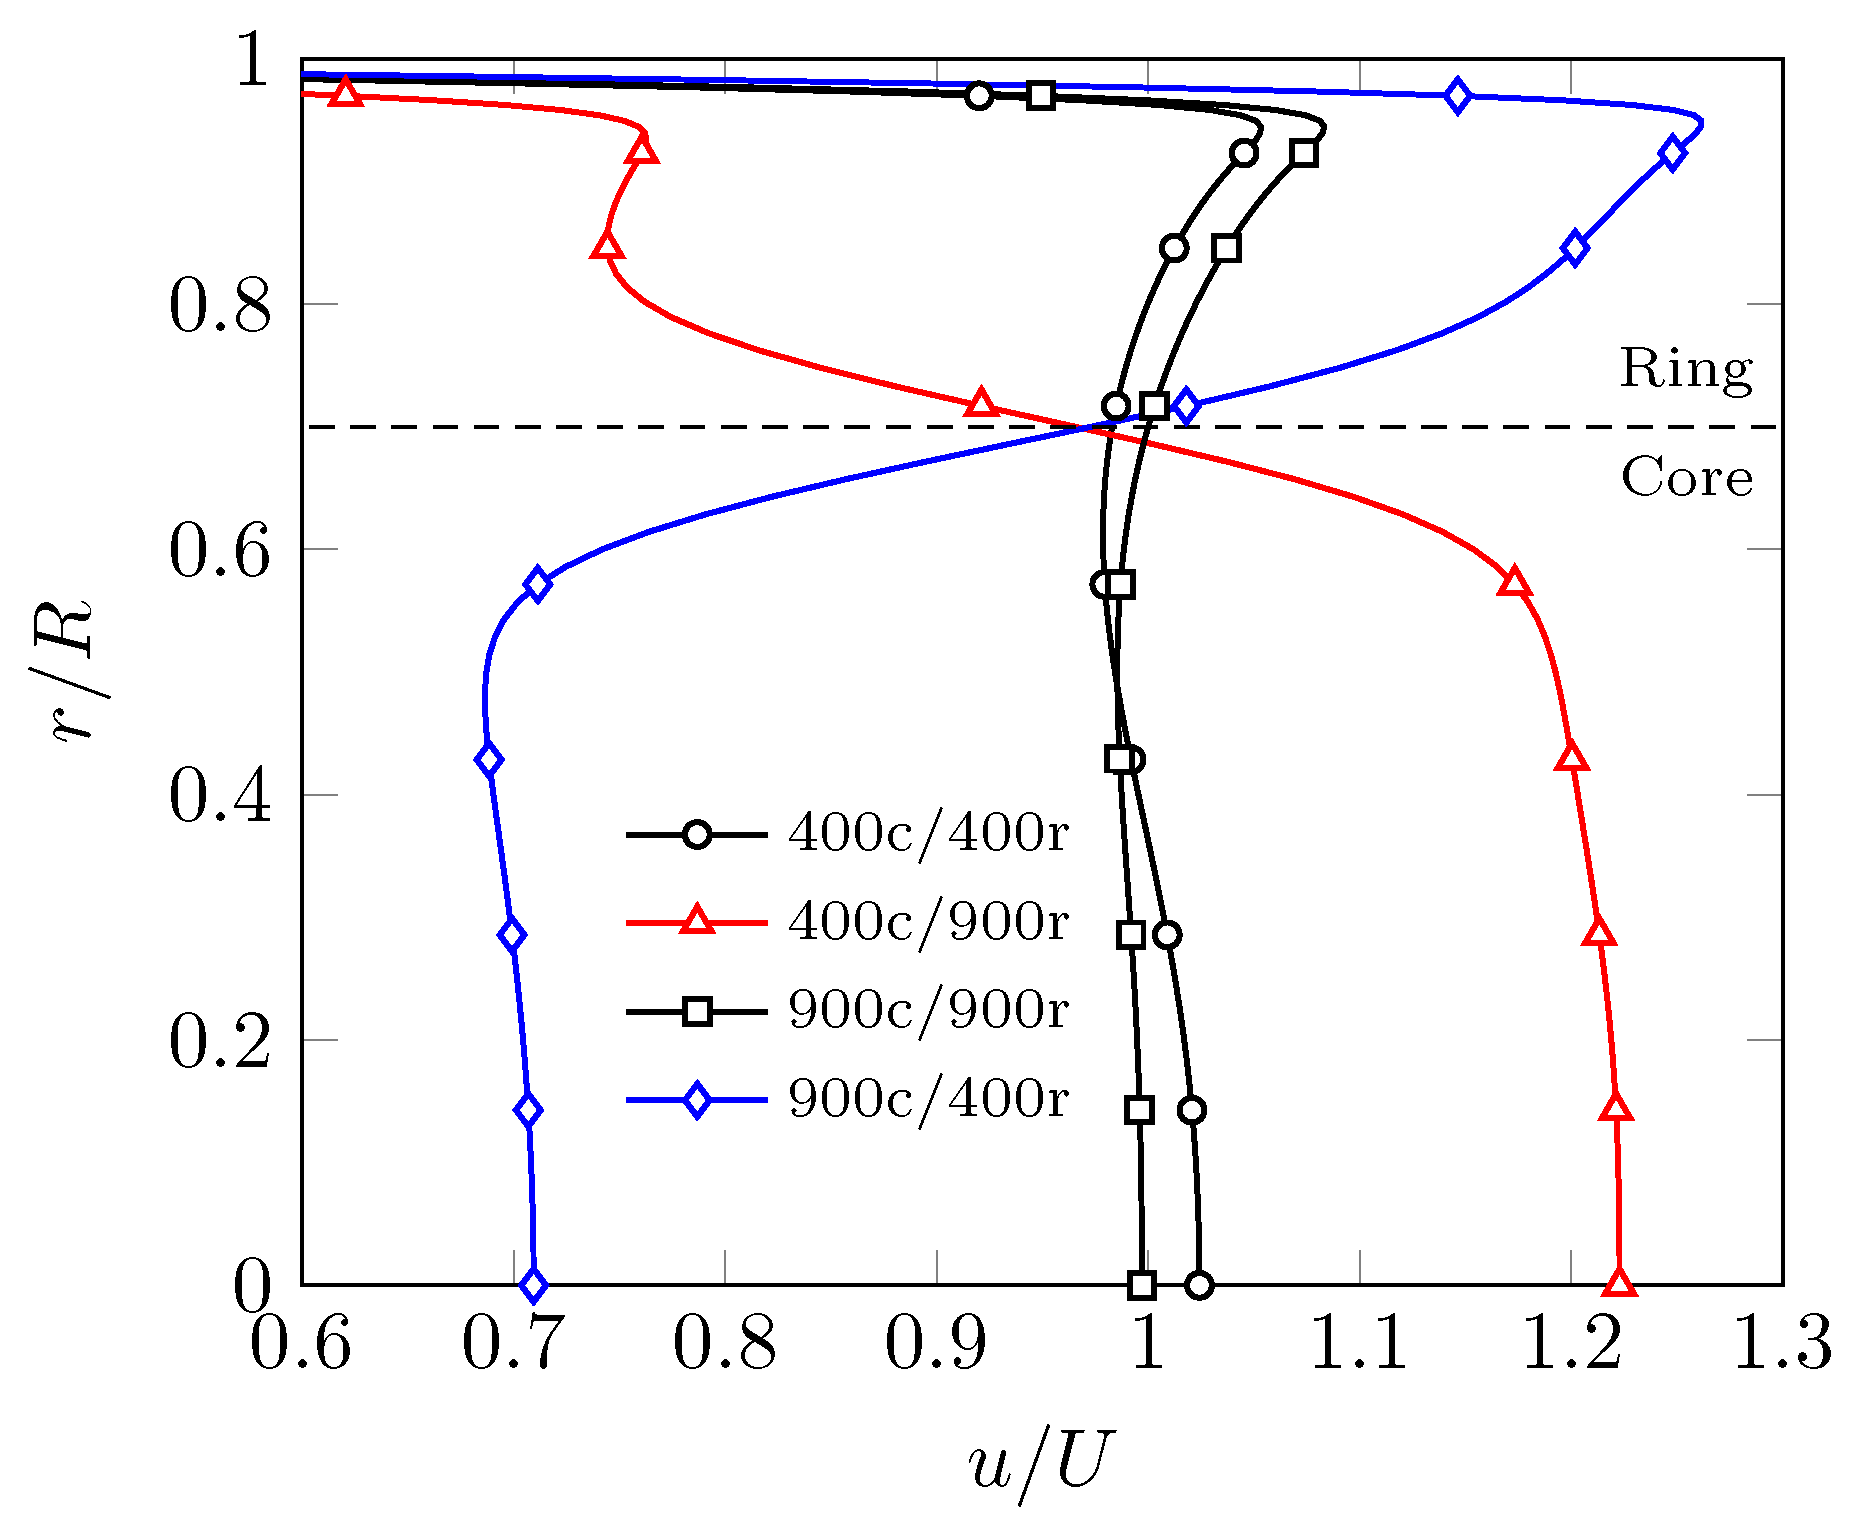
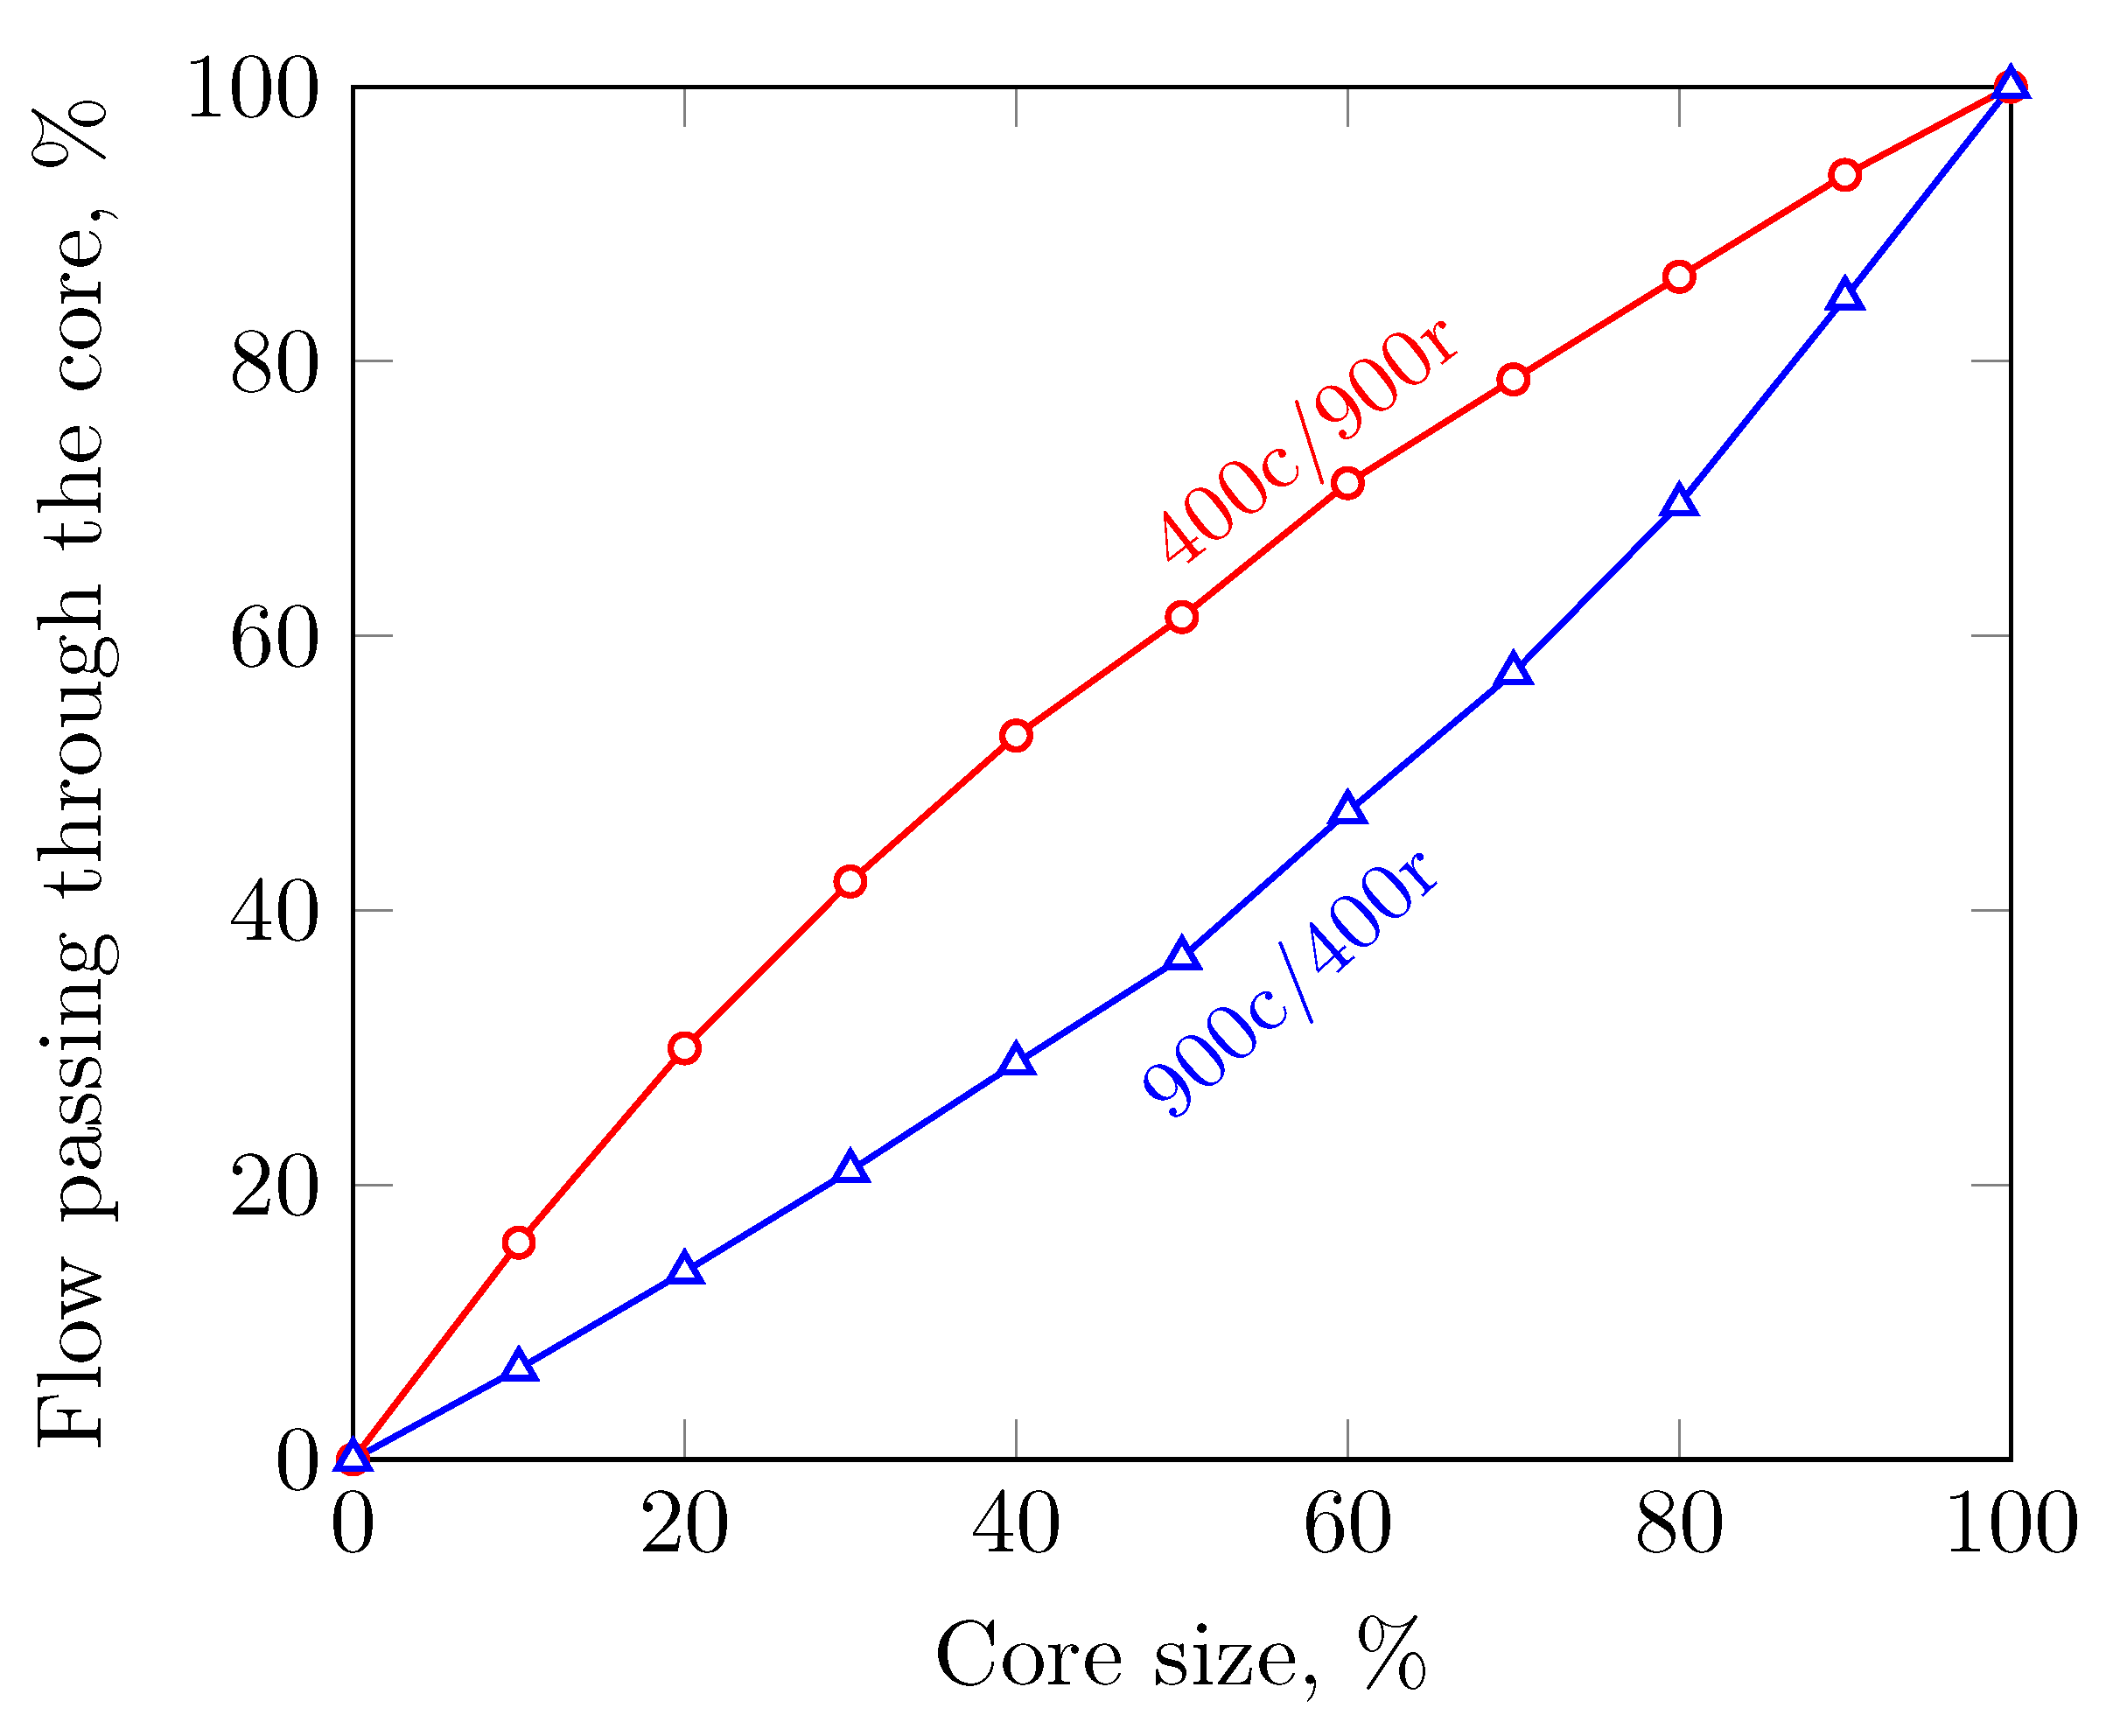
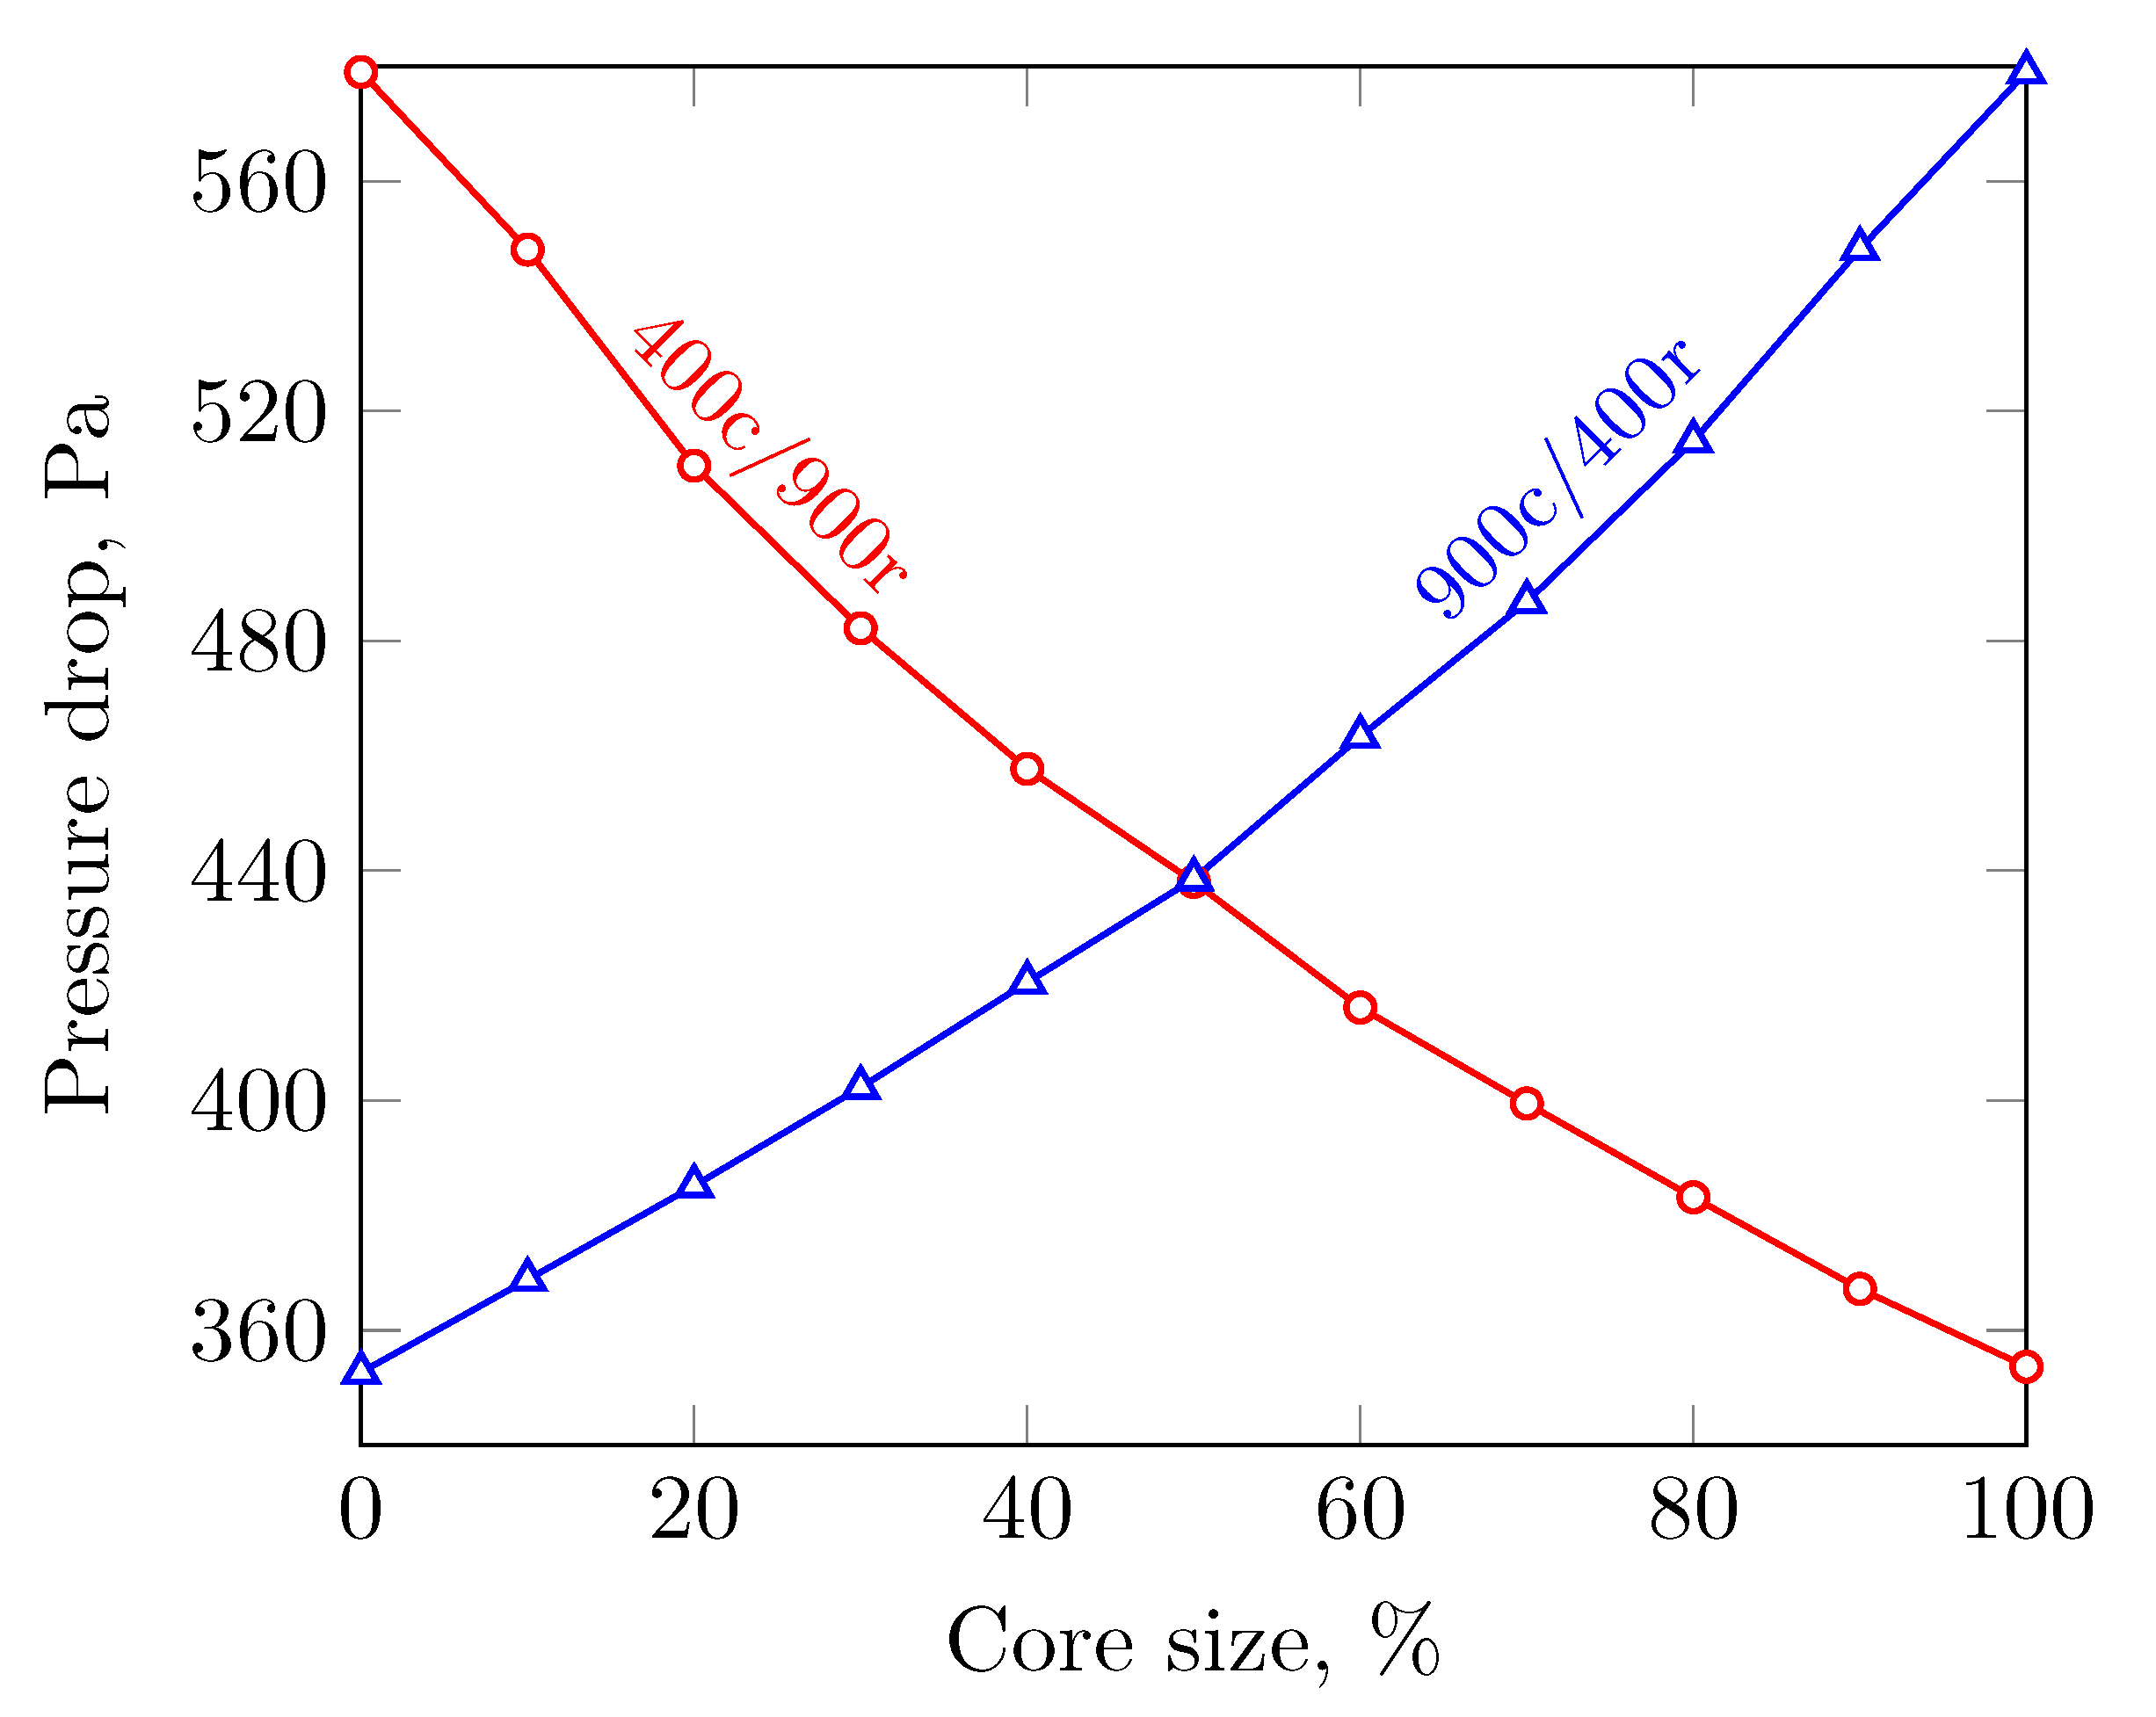
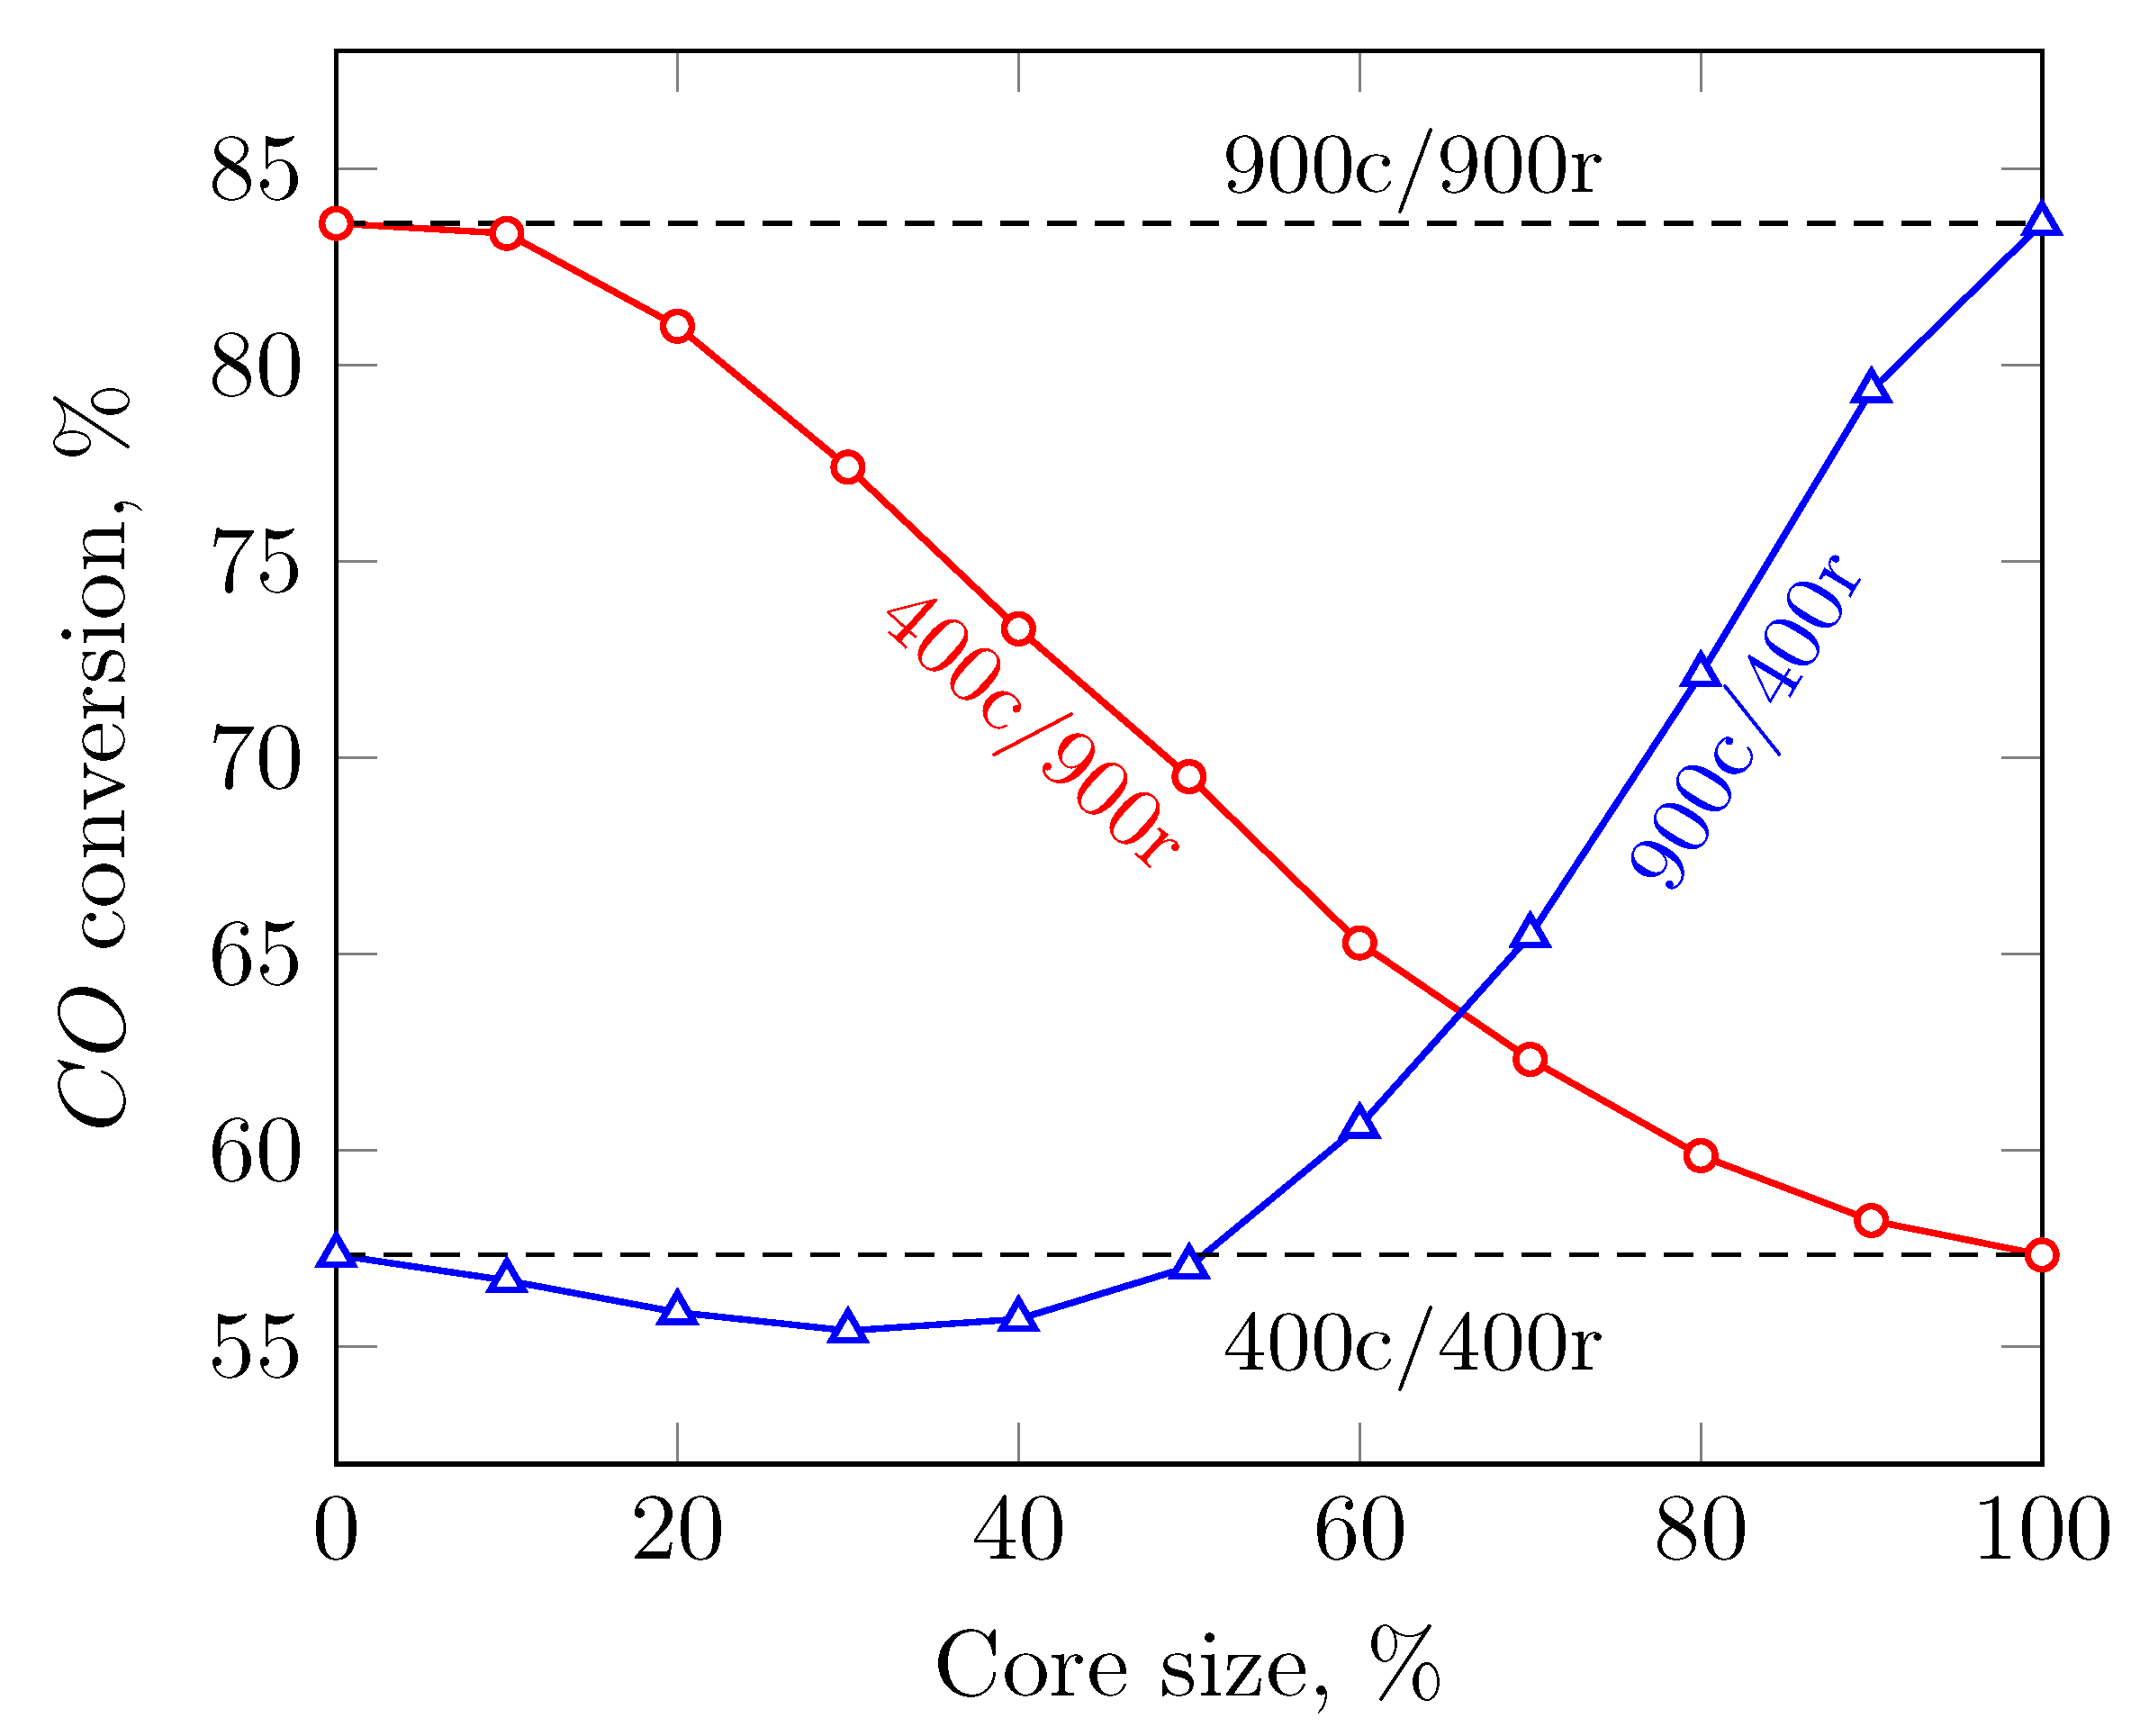
3.2. Sensitivity to the Cell Density Distribution

In this section, the results are extended to the cases where the percentages of the transverse area given to the core and ring monolith were not even. Instead, the relative size of the core increased progressively in steps of 10% from 0% to 100%. Figure 10 shows the fraction of the flow passing through the core monolith in the case where a 900/2.5 core was inserted in a 400/6.5 monolith, and vice versa. It can be seen that the relationship is superlinear when the core had a 400/6.5 monolith, and sublinear when the ring corresponded to a 400/6.5 monolith. It should be noticed that the curves are not reciprocal between them. Looking at two cases where 50% of the flow area corresponded to the core, when the 400/6.5 monolith was placed at the core, approximately 60% of the flow passed through it. On the other hand, for the opposite case, where the 400/6.5 was placed at the ring and covering the same 50% of the transverse area, only 36% of the flow passed through that section. Such a value is lower than the 40% expected if the curves were the exact reciprocal. This asymmetry may come from the fact that the flow approached the substrate mainly through the center of the converter; however, there was still a marked preference of the flow for passing through the monolith that imposes the lowest viscous resistance despite its location.
Regarding backpressure, Figure 11 shows its sensitivity to the size of the core. The relationship between the variables is slightly nonlinear. It is somehow striking that the two cases with evenly distributed flow areas led to an almost identical pressure drop, regardless of the placement of the monolith with the highest and lowest cell density, core or ring. This result was not reproduced when analyzing the sensitivity of CO conversion, where both trend lines 400/6.5 and 900/2.5 in the core behave differently, as shown in Figure 12. When a 900/2.5 core was inserted in a 400/6.5 monolith, the conversion curve showed an approximate U-shape. There is a minimum of CO conversion when the core monolith had approximately 1/3 the volume of the catalytic zone. Such a combination led to a conversion even lower than that when the whole catalytic zone was made of a 400/6.5 monolith. Consistent with Figure 10, a relatively small core with a higher viscous resistance deviates to the ring an amount of flow that is higher than the proportional one, decreasing even more the space-time of the peripheral channels and damaging the overall conversion. At a core size of 50%, the conversion reached the same value obtained when using a flat 400/6.5 monolith. From that point, conversion increased practically linearly with the core size. In the opposite case, where a core of 400/6.5 was embedded in a 900/2.5 monolith, conversion decreased noticeably with each increase of the size of the core. That is also explained by the preference of the flow for the zone with the lowest backpressure, despite its size. This agrees with the results in Figure 10 for the 400c/900r combination, which show a sublinear relationship between the size of the core and the proportion of the flow passing through it.

4. Conclusions

The flow pattern in dual-cell-density monoliths was successfully analyzed. The main conclusion from the paper is that a monolith with a mixture of two cell densities can, in fact, lead to a better (or worse) result than that from using either of the two cell densities individually. It is reasonable to expect that the results from using a combination of two cell densities would be obtained from the interpolation of the results from both cell densities individually. However, this paper has demonstrated with a theoretical model that a combination of cell densities in a single monolith can lead to a conversion efficiency lower than that obtained when using any of the two cell densities alone. Let as refer to that as unbounded efficiency. The aforementioned result can be considered a negative one since what is desired is a higher conversion efficiency; nevertheless, it shows that unbounded efficiencies are possible when combining cell densities. Positive results are also observed. We remark specifically on the case when the core and ring have the same volume; the two combinations 900c/400r and 400c/900r lead to the same pressure drop, but in the latter combination, the CO depletion is 50% higher. This improved trade-off between backpressure and conversion efficiency shows the potential for monolith shape optimization by using heterogeneous cell densities.
The most notorious and direct effect of using a heterogeneous cell density was a largely uneven flow distribution. The flow strongly prefers passing through the section with the lowest backpressure, regardless of its placement, core or ring, or periphery of the substrate. In this paper, the two cell densities used differed by approximately 40% in their apparent permeability, which is sufficient to impact significantly the flow distribution. It is recommended to explore other combinations, with a more similar apparent permeability, by varying the channel size, wall thickness, or amount of washcoat.
There were only minor effects on the temperature distribution, despite the differences in the effective thermal conductivity and rate of conversion between the core and ring. However, the cases analyzed considered the steady-state regime and with reactants fairly diluted in the feed. Significant effects may appear in transient operation or if the reactants are sufficiently concentrated to produce a significant release of heat from the chemical reactions. Those situations should be investigated.
Conversion efficiency is also affected by the cell density distribution of the substrate. This effect is highly correlated to the flow distribution. Among the cases analyzed, it is found that a relatively small core inserted in a monolith with a lower viscous resistance increases the pressure drop and decreases conversion efficiency simultaneously; hence, such a combination is highly discouraged. On the other hand, if the core has the lowest viscous resistance, then pressure drop and conversion show a positive correlation.

Author Contributions

All the authors contributed equally to the paper. All authors have read and agreed to the published version of the manuscript.

Funding

This research was funded by ANID grant number FONDECYT N 11200608.

Acknowledgments

The author Ivan Cornejo is grateful for the financial support provided by ANID through the FONDECYT project N 11200608.

Conflicts of Interest

The authors declare no conflict of interest.

Nomenclature

C P Specific heat capacity, J/kg-K
D H Channel hydraulic diameter, m
d p Characteristic pore diameter, m
GzGraetz number
k c p Thermal conductivity of porous cordierite, W/mol-K
k i Thermal conductivity vector, W/mol-K
k r Pseudo-first-order reaction rate constant, 1/s
L c Washcoat characteristic length, m
L w Monolith wall thickness, m
pPressure, Pa
PrPrandlt number
RIdeal gas constant, J/mol-K
ReReynolds number
ScSchimdt number
S V External surface to volume ratio of the substrate, 1/m
TTemperature, K
uVelocity Magnitude, m/s
u i Velocity vector, m/s
u c Channel velocity, m/s
α i Apparent permeability vector, m 2
ε w Washcoat porosity
η Effectiveness factor
kTurbulence kinetic energy, m 2 /s 2
ω Turbulence specific dissipation rate, 1/s
ϕ Substrate void fraction
Φ Thiele modulus
ρ Density, kg/m 3
τ w Washcoat tortuosity
μ Molecular viscosity, Pa-s
μ t Turbulence viscosity, Pa-s

References

  1. Gundlapally, S.R.; Balakotaiah, V. Analysis of the effect of substrate material on the steady-state and transient performance of monolith reactors. Chem. Eng. Sci. 2013, 92, 198–210. [Google Scholar] [CrossRef]
  2. Arab, S.; Commenge, J.M.; Portha, J.F.; Falk, L. Methanol synthesis from CO2 and H2 in multi-tubular fixed-bed reactor and multi-tubular reactor filled with monoliths. Chem. Eng. Res. Des. 2014, 92, 2598–2608. [Google Scholar] [CrossRef]
  3. Negri, M.; Wilhelm, M.; Hendrich, C.; Wingborg, N.; Gediminas, L.; Adelöw, L.; Maleix, C.; Chabernaud, P.; Brahmi, R.; Beauchet, R.; et al. New technologies for ammonium dinitramide based monopropellant thrusters–The project RHEFORM. Acta Astronaut. 2018, 143, 105–117. [Google Scholar] [CrossRef]
  4. De Lathouder, K.; Smeltink, M.; Straathof, A.; Paasman, M.; Van de Sandt, E.; Kapteijn, F.; Moulijn, J. Hydrogel coated monoliths for enzymatic hydrolysis of penicillin G. J. Ind. Microbiol. Biotechnol. 2008, 35, 815–824. [Google Scholar] [CrossRef] [Green Version]
  5. Kreutzer, M.T.; Kapteijn, F.; Moulijn, J.A. Shouldn’t catalysts shape up?: Structured reactors in general and gas–liquid monolith reactors in particular. Catal. Today 2006, 111, 111–118. [Google Scholar] [CrossRef]
  6. Cornejo, I.; Hayes, R.E. A Review of the Critical Aspects in the Multi-Scale Modelling of Structured Catalytic Reactors. Catalysts 2021, 11, 89. [Google Scholar] [CrossRef]
  7. Quintanilla, A.; Casas, J.; Miranzo, P.; Osendi, M.I.; Belmonte, M. 3D-Printed Fe-doped silicon carbide monolithic catalysts for wet peroxide oxidation processes. Appl. Catal. B Environ. 2018, 235, 246–255. [Google Scholar] [CrossRef]
  8. Hayes, R.E.; Kolaczkowski, S.T. Mass and heat transfer effects in catalytic monolith reactors. Chem. Eng. Sci. 1994, 49, 3587–3599. [Google Scholar] [CrossRef]
  9. Shi-Jin, S.; Jian-Xin, W.; Ren-Jun, Z.; Jun-Rui, C. Study on Flow Characteristics of Automotive Catalytic Converters with Various Configurations; SAE Technical Paper; Report Number 2000-01-0208; SAE: Warrendale, PA, USA, 2000. [Google Scholar]
  10. Tsinoglou, D.N.; Koltsakis, G.C.; Missirlis, D.K.; Yakinthos, K.J. Transient modelling of flow distribution in automotive catalytic converters. Appl. Math. Model. 2004, 28, 775–794. [Google Scholar] [CrossRef]
  11. Martin, A.; Will, N.; Bordet, A.; Cornet, P.; Gondoin, C.; Mouton, X. Effect of flow distribution on emissions performance of catalytic converters. SAE Trans. 1998, 107, 384–390. [Google Scholar]
  12. Windmann, J.; Braun, J.; Zacke, P.; Tischer, S.; Deutschmann, O.; Warnatz, J. Impact of the inlet flow distribution on the light-off behavior of a 3-way catalytic converter. SAE Trans. 2003, 112, 713–723. [Google Scholar]
  13. Zygourakis, K. Transient operation of monolith catalytic converters: A two-dimensional reactor model and the effects of radially nonuniform flow distributions. Chem. Eng. Sci. 1989, 44, 2075–2086. [Google Scholar] [CrossRef]
  14. Campbell, B.; Finch, A.; Tancell, P.; Hitchings, A.; Marsh, M.; Lloyd-Thomas, D.; Gregory, D. Effect of Catalyst Inlet Cone Flow Mal-Distribution on Emissions Performance of a Close-Coupled Catalytic Converter; SAE Technical Paper; Report Number 2004-01-1489; SAE: Warrendale, PA, USA, 2004. [Google Scholar]
  15. Guojiang, W.; Song, T. CFD simulation of the effect of upstream flow distribution on the light-off performance of a catalytic converter. Energy Convers. Manag. 2005, 46, 2010–2031. [Google Scholar] [CrossRef]
  16. Heibel, A.; Spaid, M.A. A New Converter Concept Providing Improved Flow Distribution and Space Utilization; SAE Technical Paper; Report Number 1999-01-0768; SAE: Warrendale, PA, USA, 1999. [Google Scholar]
  17. Wollin, J.; Benjamin, S.F. A Study of the Flow Performance of Ceramic Contoured Substrates for Automotive Exhaust Catalyst Systems; SAE Technical Paper; Report Number 1999-01-3626; SAE: Warrendale, PA, USA, 1999. [Google Scholar]
  18. Hughes, K.W.; Schmitz, K.M.; Radke, D.A.; Zerafa, K.L.; Light, B. Impact of ultra thinwall catalyst substrates for TIER2 emission standards. SAE Trans. 2003, 112, 282–296. [Google Scholar]
  19. Gong, J.; Cai, L.; Peng, W.; Liu, J.; Liu, Y.; Cai, H.; Jiaqiang, E. Analysis to the Impact of Monolith Geometric Parameters on Emission Conversion Performance Based on an Improved Three-Way Catalytic Converter Simulation Model; SAE Technical Paper; Report Number 2006-32-0089; SAE: Warrendale, PA, USA, 2006. [Google Scholar]
  20. Fadic, A.; Nien, T.W.; Mmbaga, J.; Hayes, R.E.; Votsmeier, M. A case study in multi-scale model reduction: The effect of cell density on catalytic converter performance. Can. J. Chem. Eng. 2014, 92, 1607–1617. [Google Scholar] [CrossRef]
  21. Kim, J.Y.; Son, S. Improving Flow Efficiency of a Catalytic Converter Using the Concept of Radially Variable Cell Density-PART I; SAE Technical Paper; Report Number 1999-01-0769; SAE: Warrendale, PA, USA, 1999. [Google Scholar]
  22. Hayes, R.E.; Fadic, A.; Mmbaga, J.; Najafi, A. CFD modelling of the automotive catalytic converter. Catal. Today 2012, 188, 94–105. [Google Scholar] [CrossRef]
  23. Clarkson, R.J. A Theoretical and Experimental Study of Automotive Catalytic Converters. Ph.D. Thesis, Coventry University, Coventry, UK, 1997. [Google Scholar]
  24. Menter, F. Improved Two-Equation K-ω Turbulence Models for Aerodynamic Flows; NASA Technical Memorandum; ID 19930013620; NASA: Washington, DC, USA, 1992. [Google Scholar]
  25. ANSYS Fluent User’s Guide Release 2020R2; ANSYS Inc.: Canonsburg, PA, USA, 2020.
  26. Cornejo, I.; Nikrityuk, P.; Hayes, R.E. Pressure correction for automotive catalytic converters: A multi-zone permeability approach. Chem. Eng. Res. Des. 2019, 147, 232–243. [Google Scholar] [CrossRef]
  27. Mesquida, I.M.V.; Cornejo, I.; Nikrityuk, P.; Greiner, R.; Votsmeier, M.; Hayes, R.E. Towards a fully predictive multi-scale pressure drop model for a wall-flow filter. Chem. Eng. Res. Des. 2020, 164, 261–280. [Google Scholar] [CrossRef]
  28. Cornejo, I.; Nikrityuk, P.; Hayes, R.E. The influence of channel geometry on the pressure drop in automotive catalytic converters: Model development and validation. Chem. Eng. Sci. 2020, 212, 115317. [Google Scholar] [CrossRef]
  29. Benjamin, S.F.; Haimad, N.; Roberts, C.A.; Wollin, J. Modelling the flow distribution through automotive catalytic converters. Proc. Inst. Mech. Eng. Part J. Mech. Eng. Sci. 2001, 215, 379–383. [Google Scholar] [CrossRef]
  30. Cornejo, I.; Nikrityuk, P.; Hayes, R.E. Turbulence decay inside the channels of an automotive catalytic converter monolith. Emiss. Control Sci. Technol. 2017, 3, 302–309. [Google Scholar] [CrossRef]
  31. Cornejo, I.; Hayes, R.E.; Nikrityuk, P. A new approach for the modeling of turbulent flows in automotive catalytic converters. Chem. Eng. Res. Des. 2018, 140, 308–319. [Google Scholar] [CrossRef]
  32. Kalitzin, G.; Medic, G.; Iaccarino, G.; Durbin, P. Near-wall behavior of RANS turbulence models and implications for wall functions. J. Comput. Phys. 2005, 204, 265–291. [Google Scholar] [CrossRef]
  33. Cornejo, I.; Nikrityuk, P.; Lange, C.; Hayes, R.E. Influence of upstream turbulence on the pressure drop inside a monolith. Chem. Eng. Process.-Process. Intensif. 2020, 147, 107735. [Google Scholar] [CrossRef]
  34. Cornejo, I.; Nikrityuk, P.; Hayes, R.E. Turbulence generation after a monolith in automotive catalytic converters. Chem. Eng. Sci. 2018, 187, 107–116. [Google Scholar] [CrossRef]
  35. Cornejo, I.; Nikrityuk, P.; Hayes, R.E. Effect of substrate geometry and flow condition on the turbulence generation after a monolith. Can. J. Chem. Eng. 2020, 98, 947–956. [Google Scholar] [CrossRef]
  36. Voltz, S.E.; Morgan, C.R.; Liederman, D.; Jacob, S.M. Kinetic study of carbon monoxide and propylene oxidation on platinum catalysts. Ind. Eng. Chem. Prod. Res. Dev. 1973, 12, 294–301. [Google Scholar] [CrossRef]
  37. Hayes, R.; Kolaczkowskib, S.; Li, P.; Awdry, S. Evaluating the effective diffusivity of methane in the washcoat of a honeycomb monolith. Appl. Catal. Environ. 2000, 25, 93–104. [Google Scholar] [CrossRef]
  38. Lommerts, B.; Graaf, G.; Beenackers, A. Mathematical modeling of internal mass transport limitations in methanol synthesis. Chem. Eng. Sci. 2000, 55, 5589–5598. [Google Scholar] [CrossRef]
  39. Cornejo, I.; Nikrityuk, P.; Hayes, R.E. Heat and mass transfer inside of a monolith honeycomb: From channel to full size reactor scale. Catal. Today 2020, in press. [Google Scholar] [CrossRef]
  40. Cornejo, I.; Nikrityuk, P.; Hayes, R.E. Improved Nu number correlations for gas flow in monolith reactors using temperature-dependent fluid properties. Int. J. Therm. Sci. 2020, 155, 106419. [Google Scholar] [CrossRef]
  41. Cornejo, I.; Cornejo, G.; Nikrityuk, P.; Hayes, R.E. Entry length convective heat transfer in a monolith: The effect of upstream turbulence. Int. J. Therm. Sci. 2019, 138, 235–246. [Google Scholar] [CrossRef]
  42. Hayes, R.E.; Rojas, A.; Mmbaga, J. The effective thermal conductivity of monolith honeycomb structures. Catal. Today 2009, 147, S113–S119. [Google Scholar] [CrossRef]
  43. Weltens, H.; Bressler, H.; Terres, F.; Neumaier, H.; Rammoser, D. Optimisation of Catalytic Converter Gas Flow Distribution by CFD Prediction; SAE Technical Paper; Report Number 930780; SAE: Warrendale, PA, USA, 1993. [Google Scholar]
  44. Salasc, S.; Barrieu, E.; Leroy, V. Impact of Manifold Design on Flow Distribution of a Close-Coupled Catalytic Converter; SAE Technical Paper; 2005-01-1626; SAE: Warrendale, PA, USA, 2005. [Google Scholar]
  45. Dammalapati, S.; Aghalayam, P.; Kaisare, N. Modeling the Effects of the Inlet Manifold Design on the Performance of a Diesel Oxidation Catalytic Converter. Ind. Eng. Chem. Res. 2021, 60, 3860–3870. [Google Scholar]
  46. Portha, J.F.; Parkhomenko, K.; Kobl, K.; Roger, A.C.; Arab, S.; Commenge, J.M.; Falk, L. Kinetics of methanol synthesis from carbon dioxide hydrogenation over copper–zinc oxide catalysts. Ind. Eng. Chem. Res. 2017, 56, 13133–13145. [Google Scholar] [CrossRef]
  47. Salamon, E.; Cornejo, I.; Mmbaga, J.P.; Kołodziej, A.; Lojewska, J.; Hayes, R.E. Investigations of a three channel autogenous reactor for lean methane combustion. Chem. Eng. Process.-Process. Intensif. 2020, 153, 107956. [Google Scholar] [CrossRef]
Figure 1. Schematic of the computational domain.
Catalysts 11 01075 g001
Figure 2. Washcoated channel cross-section showing the circular (light-gray) and octo-square (solid black line) approximations for the washcoat deposition.
Catalysts 11 01075 g002
Figure 3. Flow distribution. (a) 400c/400r, (b) 400c/900r, (c) 900c/900r, and (d) 900c/400r.
Catalysts 11 01075 g003
Figure 4. Temperature distribution. (a) 400c/400r, (b) 400c/900r, (c) 900c/900r, and (d) 900c/400r.
Catalysts 11 01075 g004
Figure 5. Velocity profile at the outlet of the catalytic zone. U is the area-weighted average velocity.
Catalysts 11 01075 g005
Figure 6. Temperature profile at the outlet of the catalytic zone.
Catalysts 11 01075 g006
Figure 7. CO conversion. (a) 400c/400r, (b) 400c/900r, (c) 900c/900r, and (d) 900c/400r.
Catalysts 11 01075 g007
Figure 8. CO conversion profile at the outlet of the catalytic zone.
Catalysts 11 01075 g008
Figure 9. Reaction rate. (a) 400c/400r, (b) 400c/900r, (c) 900c/900r, and (d) 900c/400r.
Catalysts 11 01075 g009aCatalysts 11 01075 g009b
Figure 10. Percentage of the flow passing through the core as a function of the core size.
Catalysts 11 01075 g010
Figure 11. Pressure drop as a function of the core size.
Catalysts 11 01075 g011
Figure 12. Overall CO conversion as a function of the core size.
Catalysts 11 01075 g012
Table 1. Substrate geometrical features.
400/6.5900/2.5
S V m , m w 1 1793328607
ϕ m 0.6370.736
f w m , m w 3 /m f 3 0.5130.481
L c m , μ m5537
D H m , mm1.1440.819
Publisher’s Note: MDPI stays neutral with regard to jurisdictional claims in published maps and institutional affiliations.

