Article

Spectral, Entropy and Bifurcation Analysis of the Dynamics of a Catalyst Chemical Reverse-Flow Tubular Reactor

1
Faculty of Chemical Engineering and Technology, Krakow University of Technology, ul. Warszawska 24, 30-155 Krakow, Poland
2
Department of Mathematics Applications and Methods for Artificial Intelligence, Faculty of Applied Mathematics, Silesian University of Technology, Kaszubska 23, 44-100 Gliwice, Poland
*
Author to whom correspondence should be addressed.
Catalysts 2022, 12(1), 37; https://doi.org/10.3390/catal12010037
Submission received: 30 November 2021 / Revised: 24 December 2021 / Accepted: 28 December 2021 / Published: 30 December 2021

Abstract

:
Oscillations, including chaotic ones, can spontaneously appear in chemical reactors or lean premixed combustors. Such behavior of the system is undesirable and should be identified at the stage of its modeling. This article analyzes the behavior of reverse-flow tubular chemical reactor with longitudinal dispersion in terms of chaotic oscillations. The purpose of using reverse flow is to increase the conversion degree. For the analysis of the reactor, among others, spectral analysis, entropy, and bifurcation analysis were used. The obtained results show the chaotic behavior of the reactor in a wide range of changes in the parameter’s values.

1. Introduction

The dynamics of chemical reactors were widely discussed in [1,2,3,4,5,6,7,8,9,10,11,12,13,14,15,16,17], where it was proved that in the steady state the concentration and temperature of the flux may oscillate in a manner that is more or less complex. The oscillations may have a multiperiodic, quasiperiodic or chaotic nature, depending on the values of reactor parameters and the concentration and temperature of the reacting flux at the initial state.
The dynamic behaviour of periodically forced chemical reactors (e.g., with cyclically permuting feed and discharge positions or changing the feed flow direction) was studied in [1,4,5,7,8,9,12,13,14,15,16,17,18]. These works concern various types of reactors and their configurations. In [1] catalytic flow reversal reactor (CFRR) with transient two-dimensional heterogeneous model with a numerical method allowing the fast formulation of new reactor configurations during the design phase was presented. This work shows that the behavior of this system can be predicted accurately for a wide range of reactor conditions like its small diameter. In turn, Ref. [4] shows the influence of flow reversal on thermally coupled cascades of tank reactors. The conclusions from these studies concern not only the complicated dynamics of the system, but also the connections with and without flow reversal. The work [5] concerns the dynamics of forced fluidized bed catalytic reactors. The authors examined, inter alia, the effect of the forcing amplitude on the behavior of the system. In turn, work [7] shows the construction of maps of parameter regions with qualitatively different bifurcation diagrams for reverse-flow reactors. The method is presented in two examples: single, exothermic first-order reaction and two independent, exothermic first-order reactions. The work [8] deals with similar topics. In article [9], fixed bed catalytic reactors were analyzed. The results show the complex dynamics of this type of system. In [12], authors analyzed a tubular catalytic reactor. The authors of this work show the behavior of the analyzed system using, inter alia, Poincare maps. In turn, Ref. [13] analyzed the periodically forced network of three catalytic reactors. As in the previous work, Poincarè maps were also used for this purpose. The results show the complex behavior of the reactor system, ranging from periodic to chaotic behavior. Poincare maps analysis was also used in [14] to define a new method to analyze the dynamics of chemical reactors with reverse flow. Developing the proposed approach, the authors analyzed, inter alia, a network of n-reactors with periodically switched feed and discharge positions. The papers [15,16] present new methods to analyze the dynamics of a fixed-bed reactor with periodic flow reversal. The authors proposed, inter alia, switching from the initial-value problem into a steady-state boundary-value, and then the standard bifurcation analysis techniques were applied. In turn, in the article [17] cascade of two nonadiabatic continuously stirred tank reactors (CSTR) connected with streamflow was analyzed. As in [4], apart from showing the complex dynamics of the reactor system, also connections with and without flow reversal in relation to the reactor dynamics were also presented.
This paper is focused on the analysis of the dynamics of a system consisting of a catalyst (psudohomogeneous), non-adiabatic tubular chemical reactor with longitudinal dispersion. An interesting work on the axial dispersion tubular reactor can be found in [19]. The reactor is fed with a flux of raw materials with cyclically reversing the flow directions. The calculations results indicated that different types of temperature and concentration oscillations may occur in the analyzed system, including chaotic oscillations. The analysis was based on bifurcation diagrams, amplitude spectrum, and information entropy.
The research carried out in this paper is of a general nature. The presented methods and conclusions can and should be applied at the stage of designing the reactor system. It is particularly important that oscillations (including chaotic oscillations), which are usually unfavorable in terms of processes, and may occur spontaneously in the tested system [20,21,22]. Therefore, the operating parameters of the system should be selected in such a way as to eliminate these oscillations in practice. We learn about the degree of danger that can be caused by all kinds of oscillations, not only chaotic ones, from the spectral analysis based on the frequencies and amplitudes of individual harmonics. In turn, the entropy analysis allows the identification of the physical system under study. This is necessary at the system modeling stage. Bifurcation analysis, on the other hand, gives information about the nature and values of the system state variables, in this case about the conversion degree and temperature. The results obtained in this study should be used in the design of this type of reactor system.

2. The Reactor Model

The analysis concerns a pseudohomogeneous, tubular, non-adiabatic chemical reactor with longitudinal dispersion. The balance equations of the apparatus are as follows:
mass balance:
α ξ , τ τ + α ξ , τ ξ = 1 P e M 2 α ξ , τ ξ 2 + Φ 1 ,
heat balance:
L e Θ ξ , τ τ + Θ ξ , τ ξ = 1 P e H 2 Θ ξ , τ ξ 2 + Φ 2 ,
where the dimensionless position in the reactor is in the range:
0 ξ 1 .
α ξ , τ is the degree of conversion along the position ξ at any time τ , Θ ξ , τ is the dimensionless temperature along the position ξ at any time τ . The variables α and Θ are related to the concentration and temperature in the raw material stream (see Nomenclature).
Assuming that the n-order A B type reaction takes place in the reactor, the kinetic and heat exchange functions are as follows:
Φ 1 = D a ( 1 α ) m exp γ β Θ 1 + β Θ ,
Φ 2 = Φ 1 α , Θ + δ ( Θ H Θ ) .
The boundary conditions prescribed by the balance equations are of the Danckwerts type:
α ( 0 , τ ) = 1 P e M d α 0 , τ d ξ ,
d α 1 , τ d ξ = 0 ,
Θ ( 0 , τ ) = 1 P e H d Θ 0 , τ d ξ ,
d Θ 1 , τ d ξ = 0 .
In the above model, cyclic transfer of the raw material stream (reverse flow) was used. The product is collected at the reactor outlet according to the following relations:
α o u t = I O α ( 0 , τ ) + ( 1 I O ) α ( 1 , τ ) ,
Θ o u t = I O Θ ( 0 , τ ) + ( 1 I O ) Θ ( 1 , τ ) ,
where the I O index specifies the current flow direction of the reacting stream and has a value of 0 or 1. This direction changes cyclically at times τ = k τ r , where k = 1 , 2 , 3 , and τ r is the switching time.
The following parameter values were adopted for the numerical calculations carried out in this paper: γ = 15 , β = 2 , m = 1.5 , δ = 3 , Θ H = 0 , P e M = 50 , P e H = 50 , L e = 1 .

3. Bifurcation Analysis

The shift flow of the raw material stream at regular intervals τ r causes that the tested system can be treated as a discrete system. This means that in order to evaluate the system’s behavior, it is sufficient to observe the α o u t or Θ o u t variables at the moments of the transfer. The analysis carried out as part of this study was performed with the use of tools for discrete systems. Depending on the values of the parameters, the above variables behave in a stationary or oscillatory manner. These oscillations can be periodic or non-periodic, including chaotic. Figure 1 presents a bifurcation diagram of the state variable α o u t depending on the switching time τ r .
It is formed as follows. For a given value of τ r , a discrete time series is generated. Then all values of the α o u t variable read from the time series are plotted on the diagram. If, in the time series, this variable has the same value, then in the diagram, we see one point (e.g., for τ r = 4 , τ r = 13.5 in Figure 1). This is called a stationary point. If a variable has N different values in the time series, then we see N points in the diagram. These are N-period oscillations. If N = , then we are dealing with chaos or quasiperiodic oscillations. The other bifurcation diagrams are created in the same way with the change of the bifurcation parameter, which is D a in Figure 2.
In the steady state, the time series is characterized by the same value of the variable and we see a single point in the diagram. In the case of periodic oscillations, the diagram shows the number of points corresponding to the periodicity of a given discrete waveform (a given periodic orbit). In the case of chaotic oscillations, an infinite number of points should appear in the diagram. Figure 2 presents a bifurcation diagram of the variable out depending on the number of D a .

4. Spectral Analysis

As part of this study, the amplitude spectrum of the degree of conversion α o u t was analyzed according to the relationship:
X [ k ] = 1 N n = 0 N 1 α o u t ( n ) exp 2 π i k n N ,
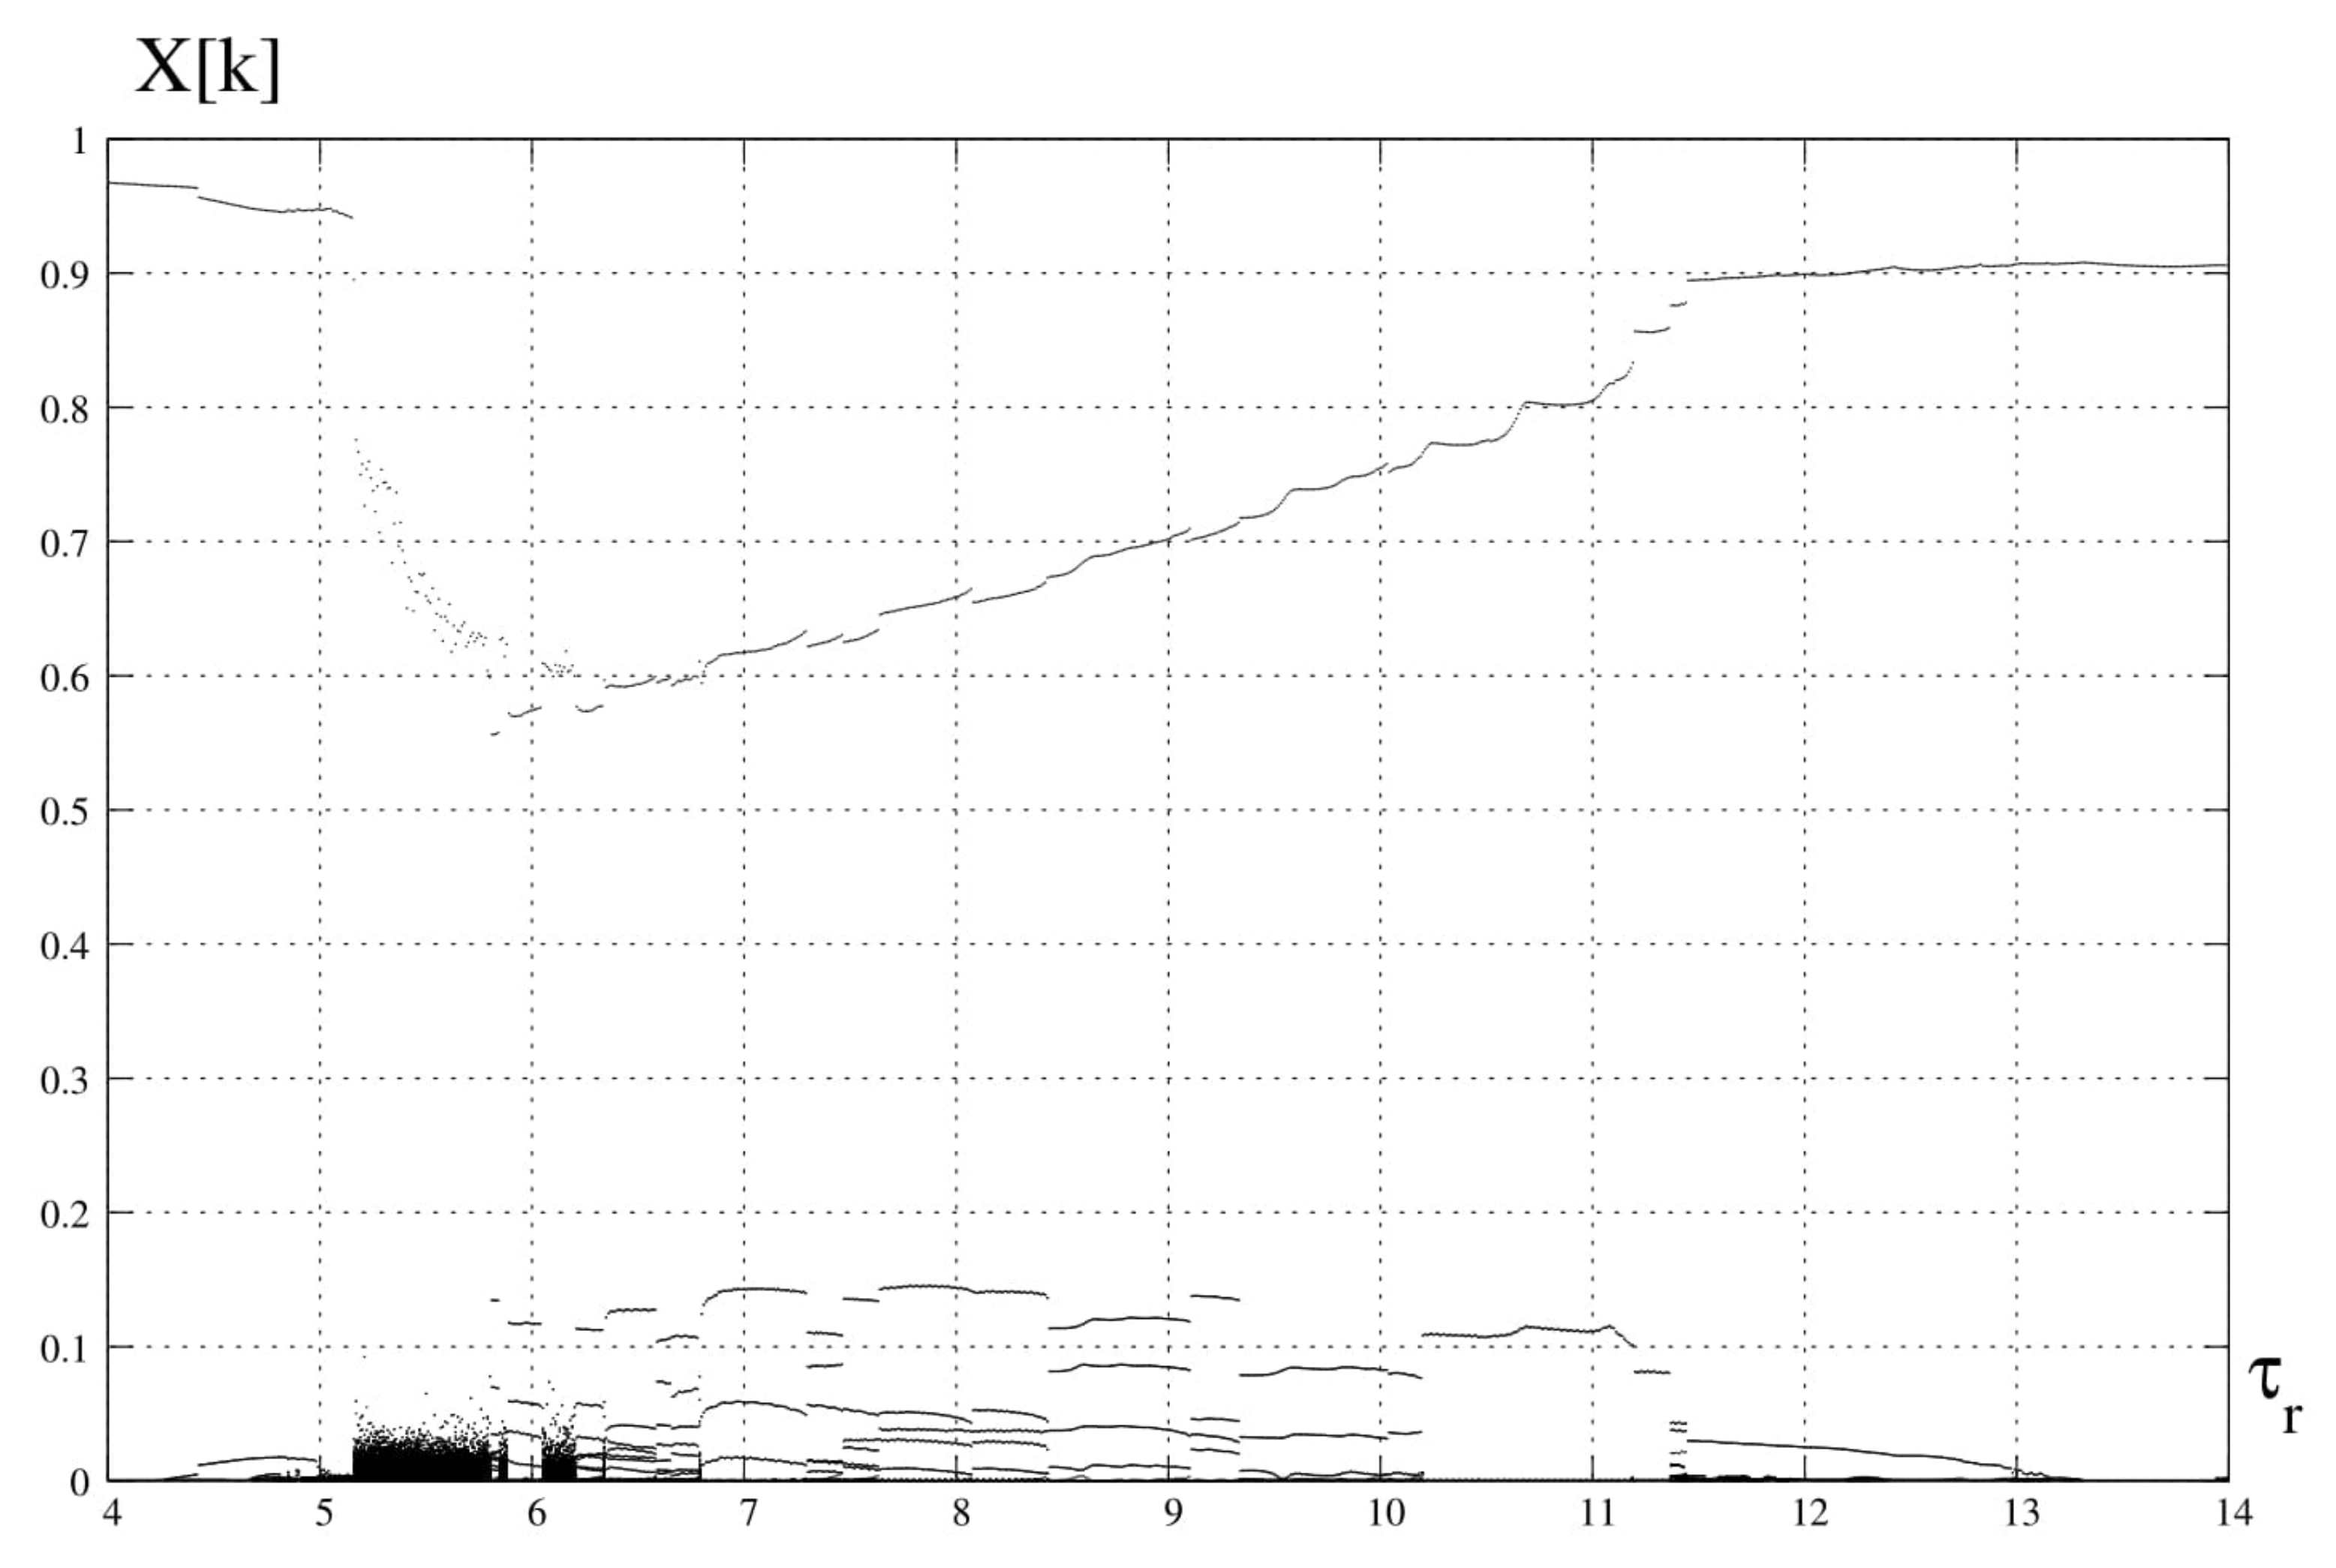
where α o u t ( n ) is the degree of conversion in the product stream in the nth step of the transfer, X [ k ] is the kth harmonic, and N is the number of samples. Similarly to the bifurcation analysis, also here a diagram was determined, in which harmonics as a function of switching time τ r were marked (Figure 3) [23]. The principle of creating this diagram is the same as creating a bifurcation diagram, except that it does not use the time series but the sequence of harmonics generated by the Formula (12).
From this diagram, it can be concluded that chaotic solutions occur for 4.8 < τ r < 6.2 . We draw a similar conclusion from the analysis of the diagram in Figure 1, where the same chaotic interval is visible. It is obvious. If these ranges do not coincide, it would mean that the calculations are incorrect.
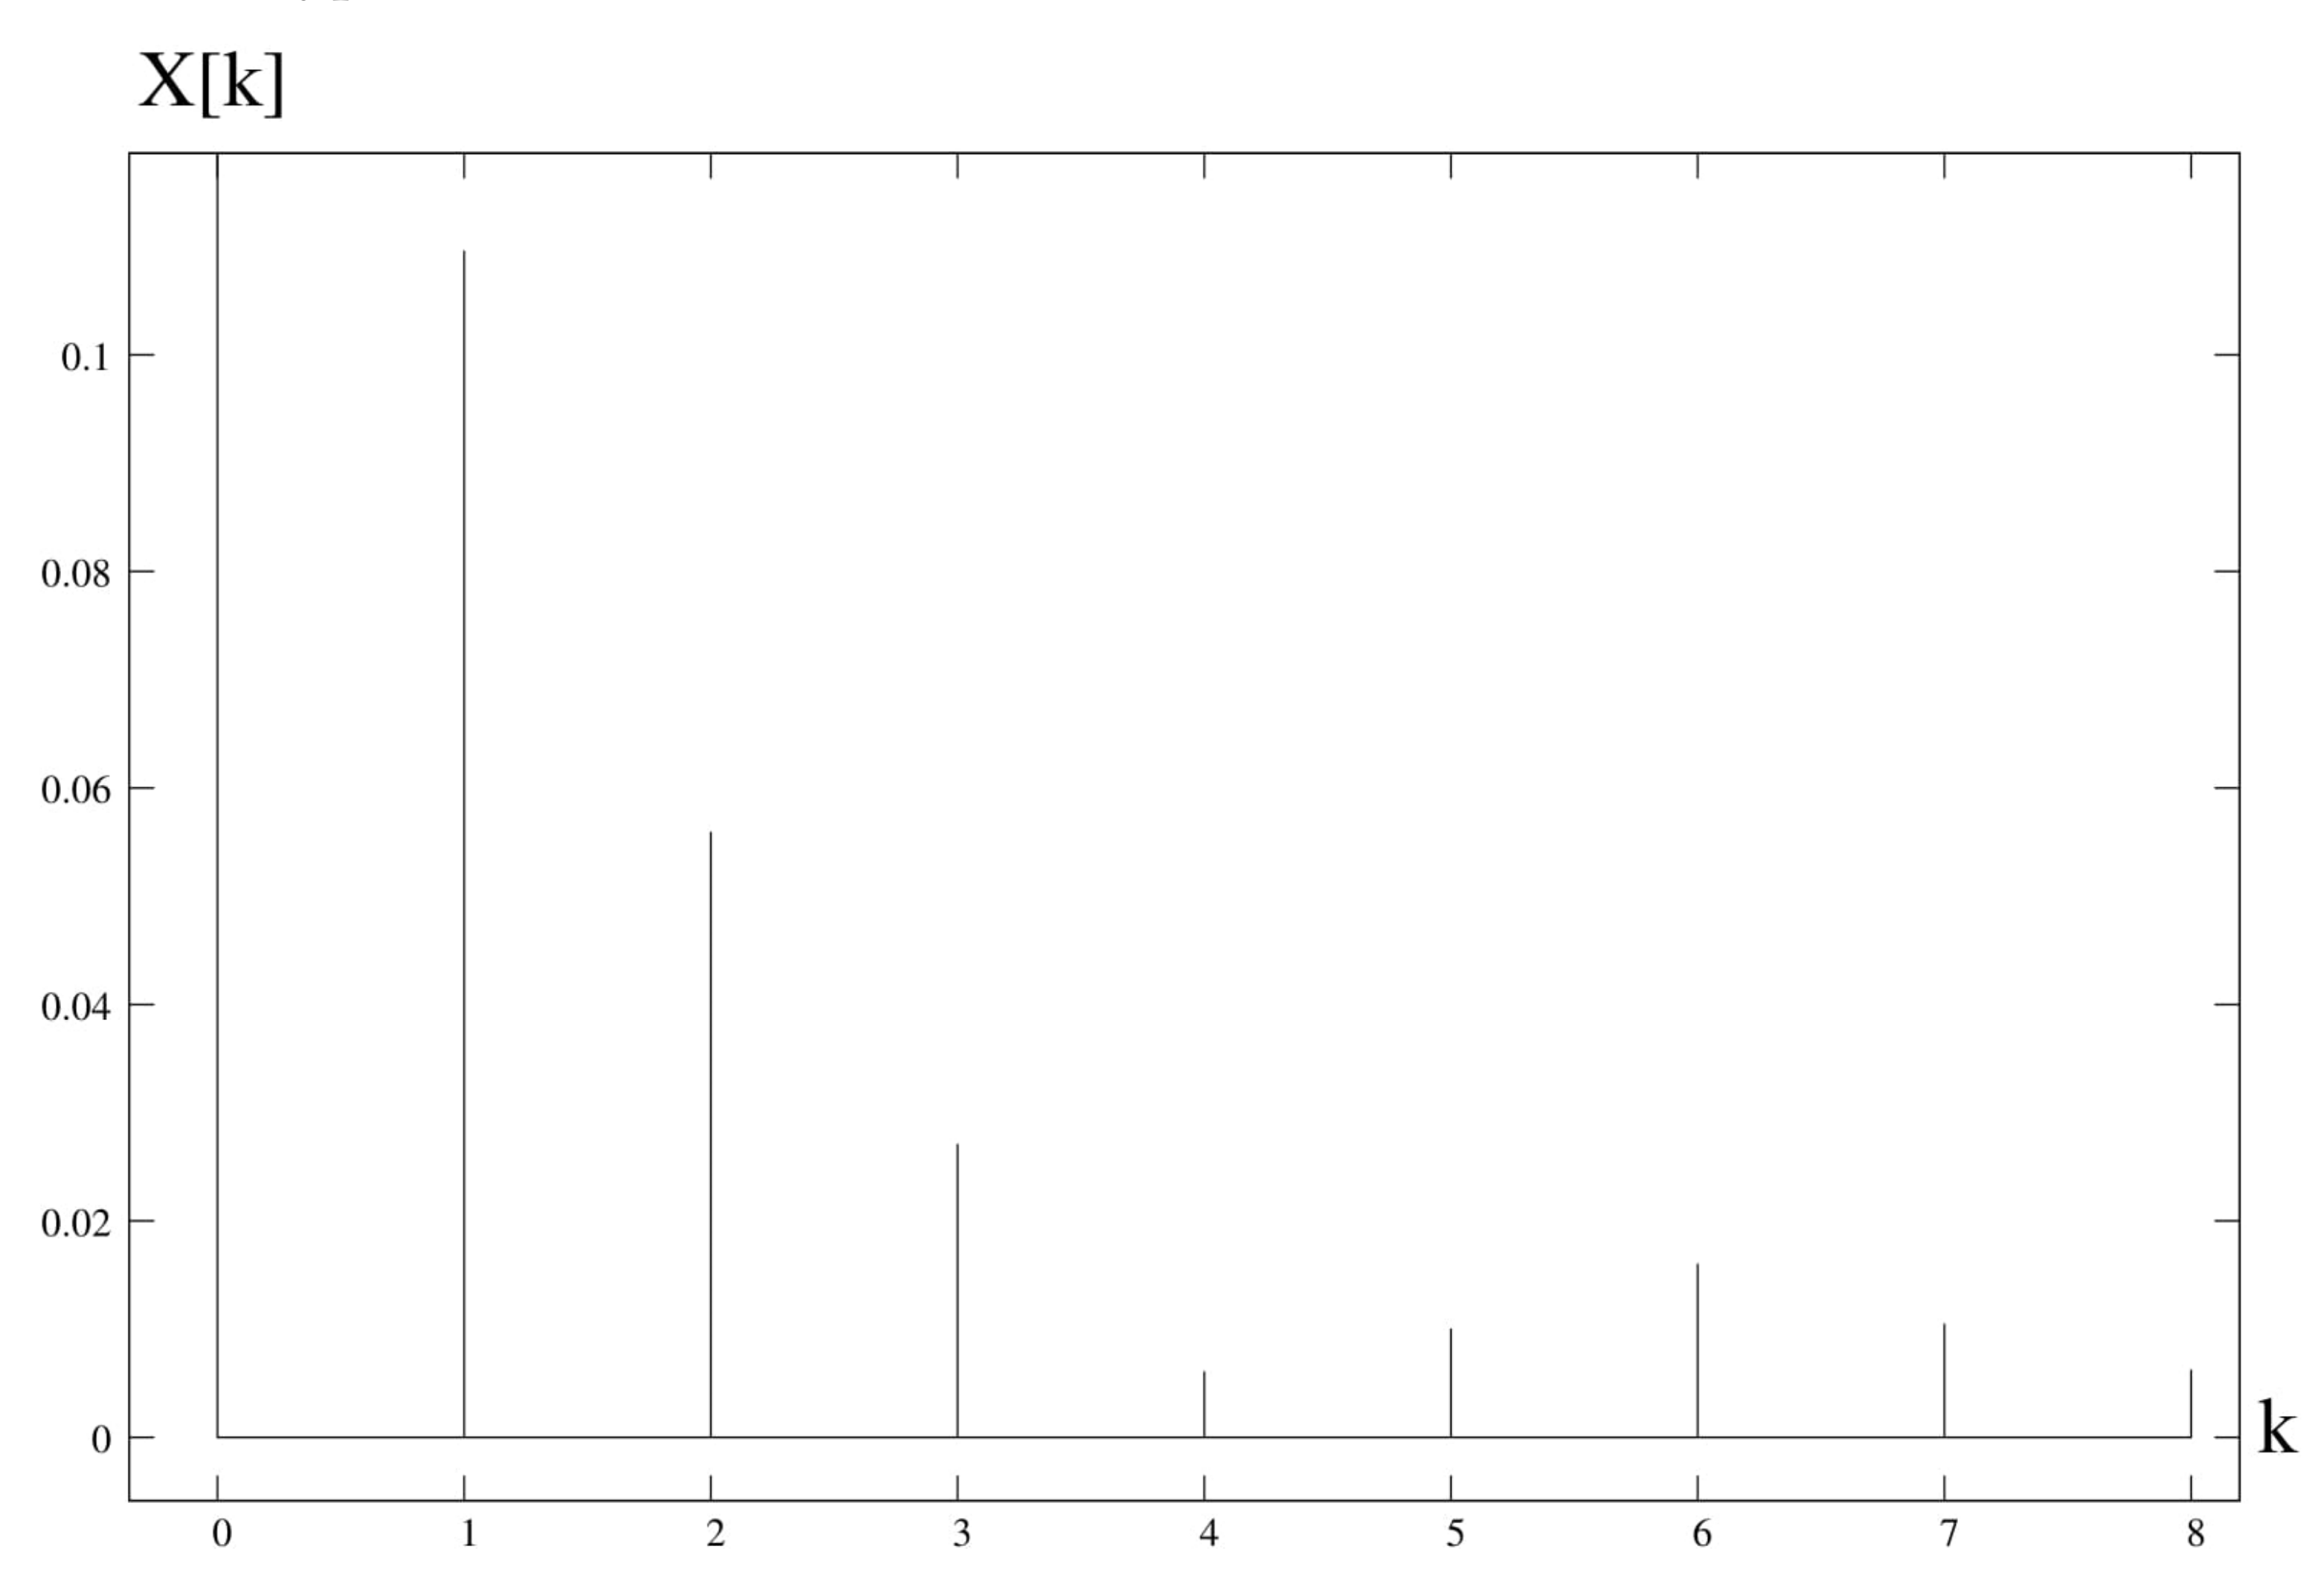
Figure 4 shows the harmonic distribution for τ r = 5.5 . This distribution applies to a chaotic orbit. Theoretically, there should be infinitely many harmonics in this case.
Figure 5 shows the harmonic distribution for τ r = 6.5 . This distribution is for a stable periodic orbit.
(In Figure 4 and Figure 5, high values of zero harmonics have been limited due to the legibility of the graphs).
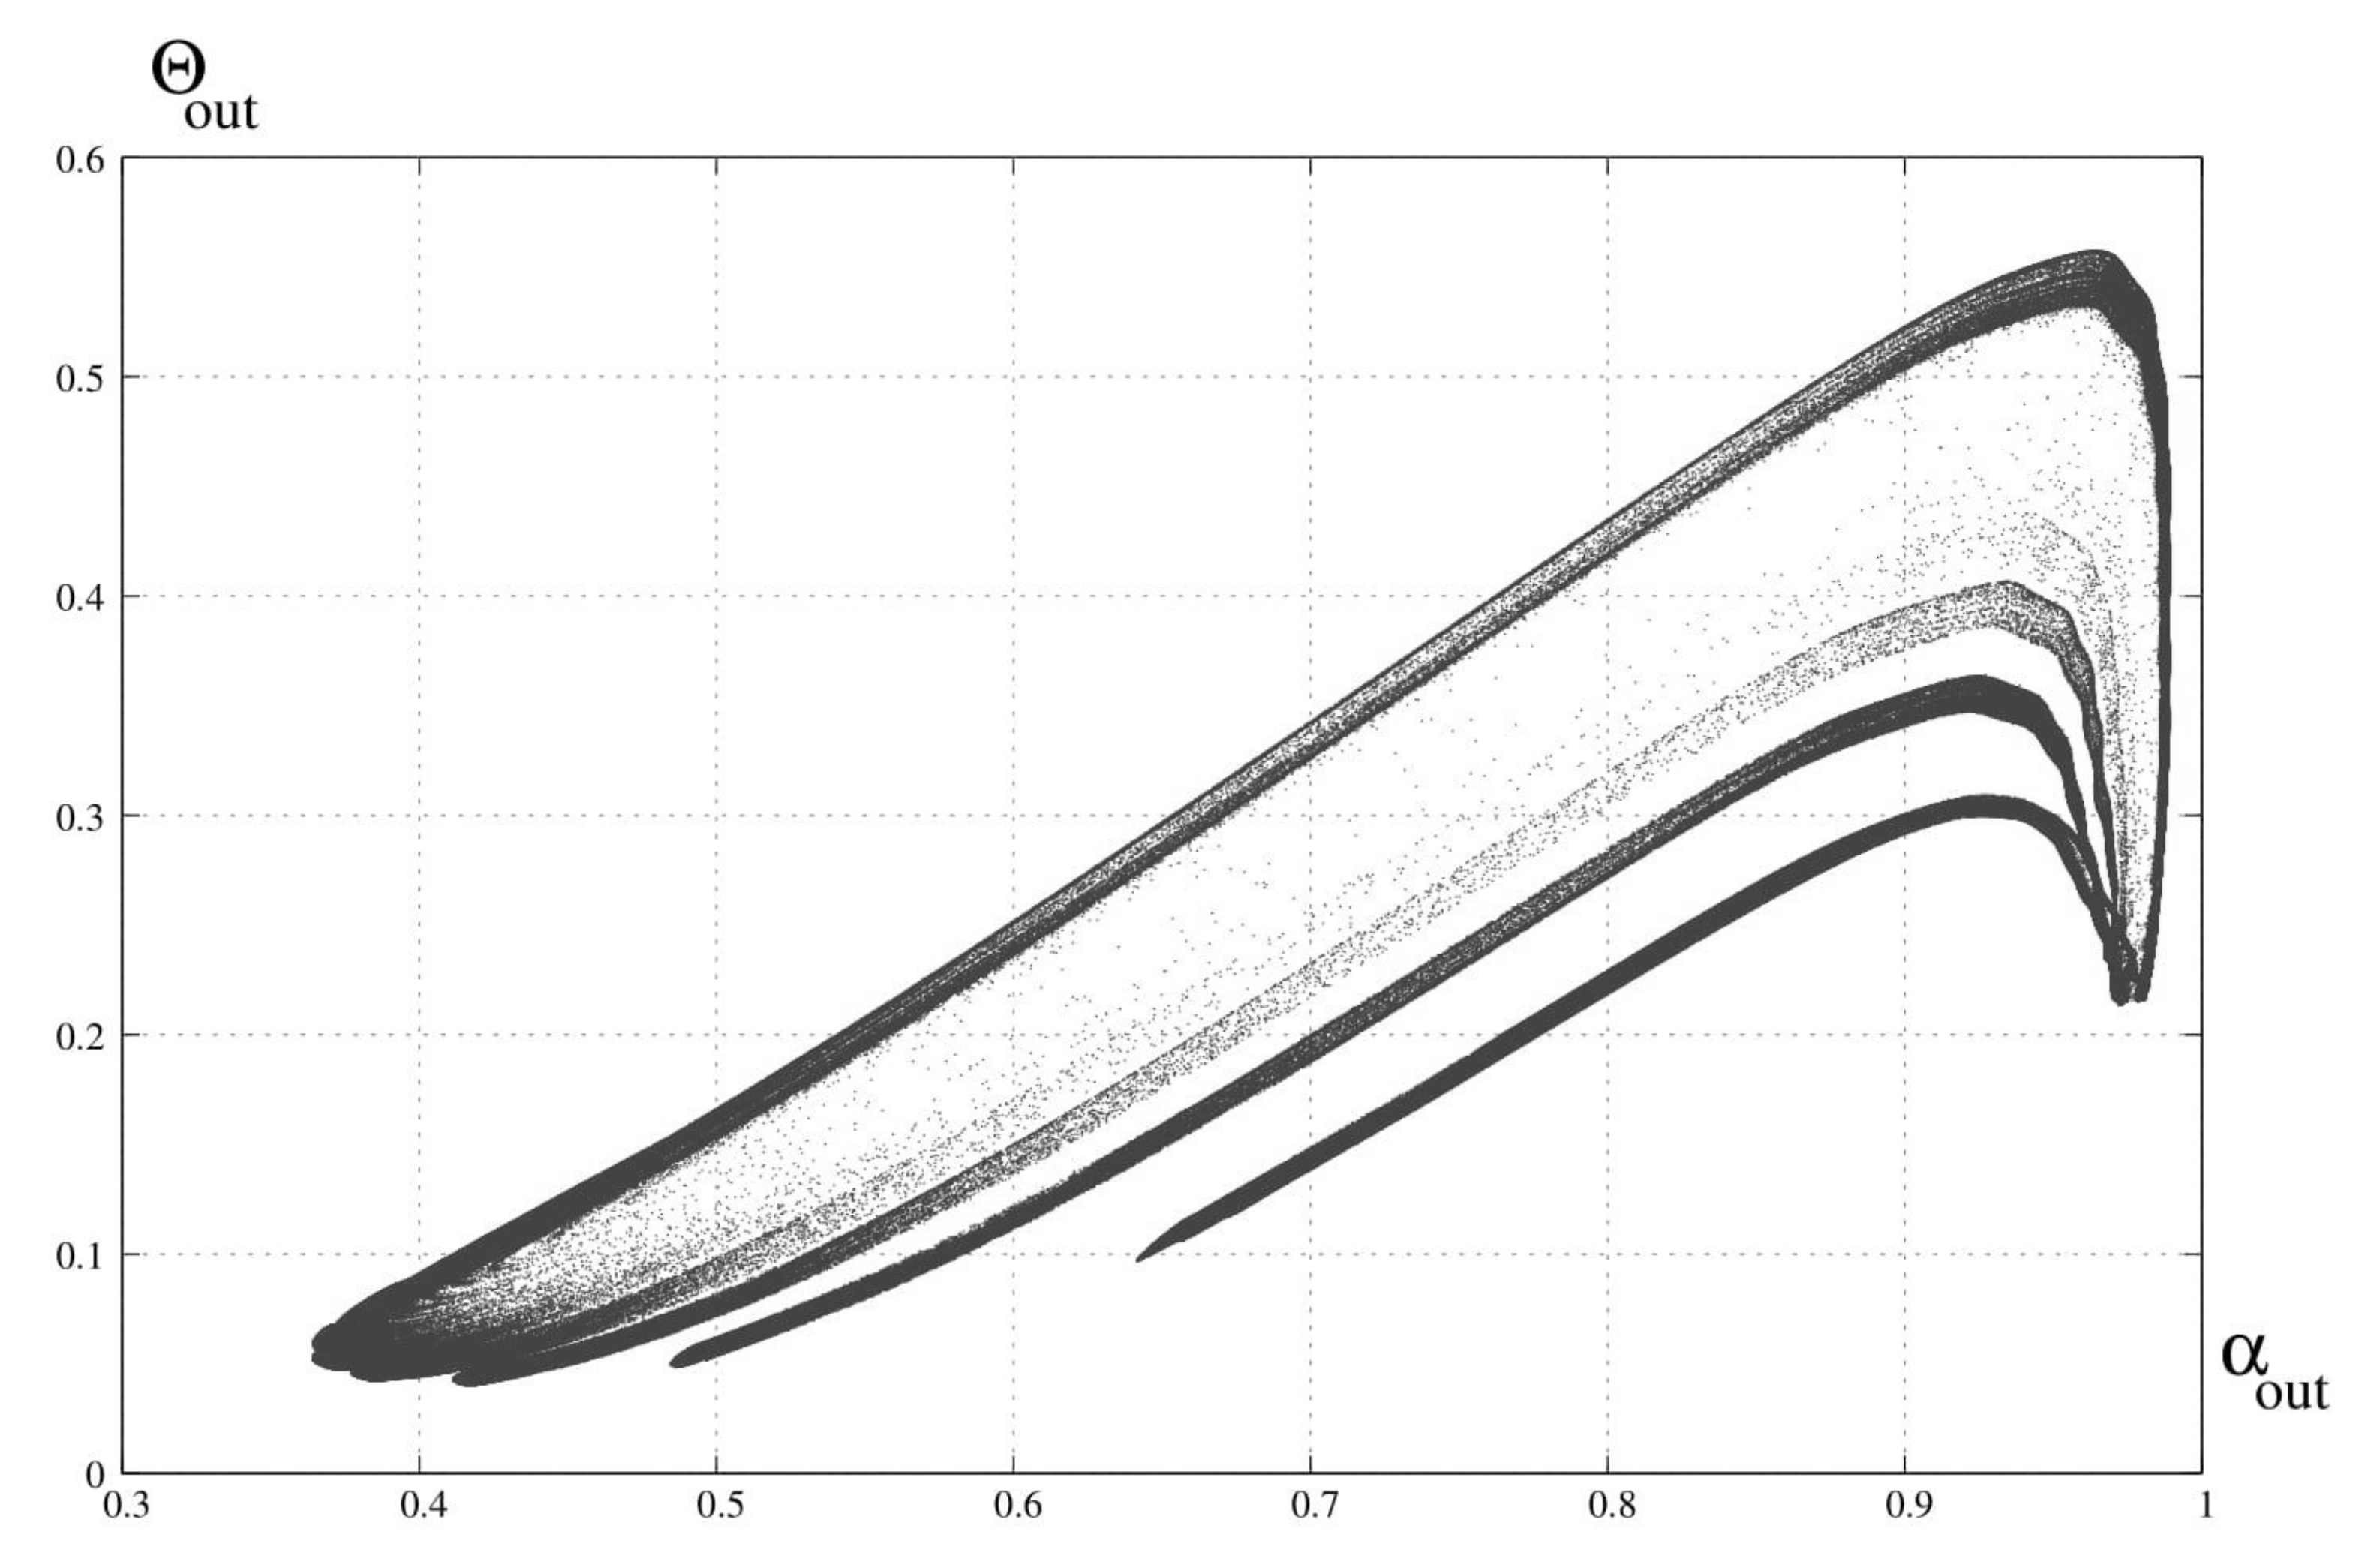
Additionally, Figure 6 shows the cross-section of the Poincare chaotic attractor for τ r = 5.5 . Due to the discrete nature of the system, this cross-section is of the Henon attractor type.
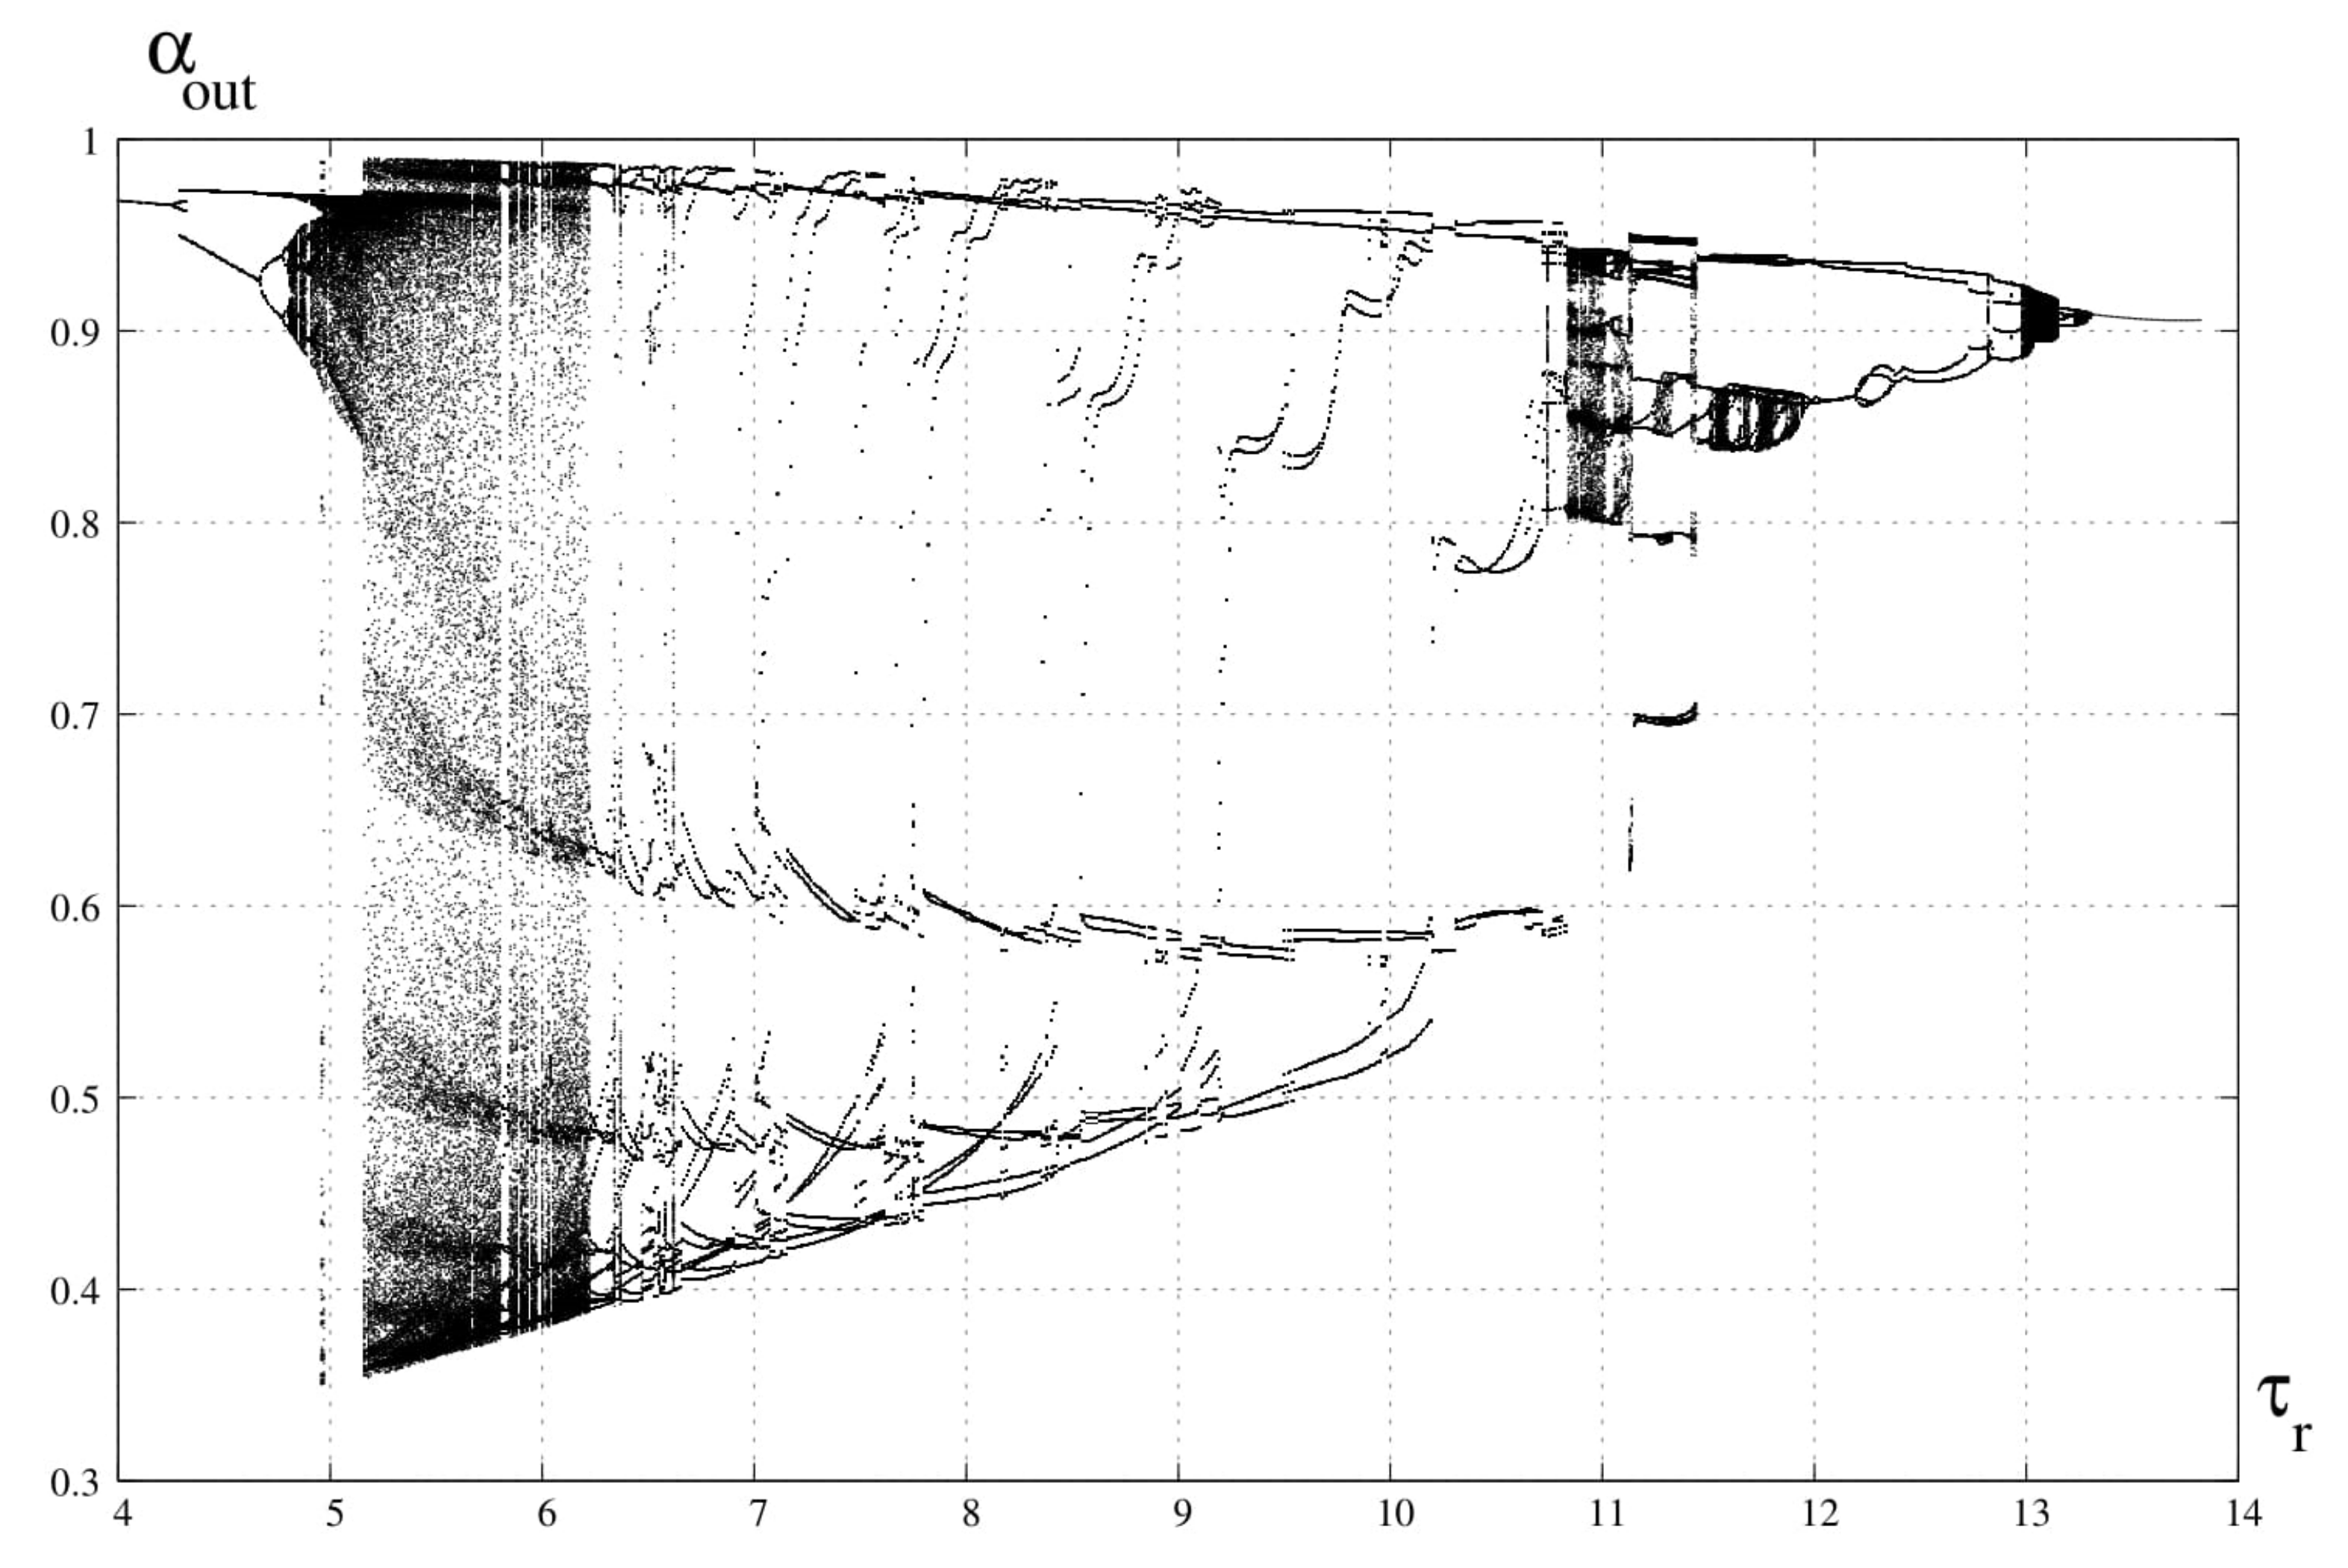
Numerical calculations showed that the tested system is characterized by the so-called multiple states of dynamic. Each of these states depends on the initial conditions in the reactor. Figure 7 shows another bifurcation diagram, which was created for different initial conditions than the diagram from Figure 1.
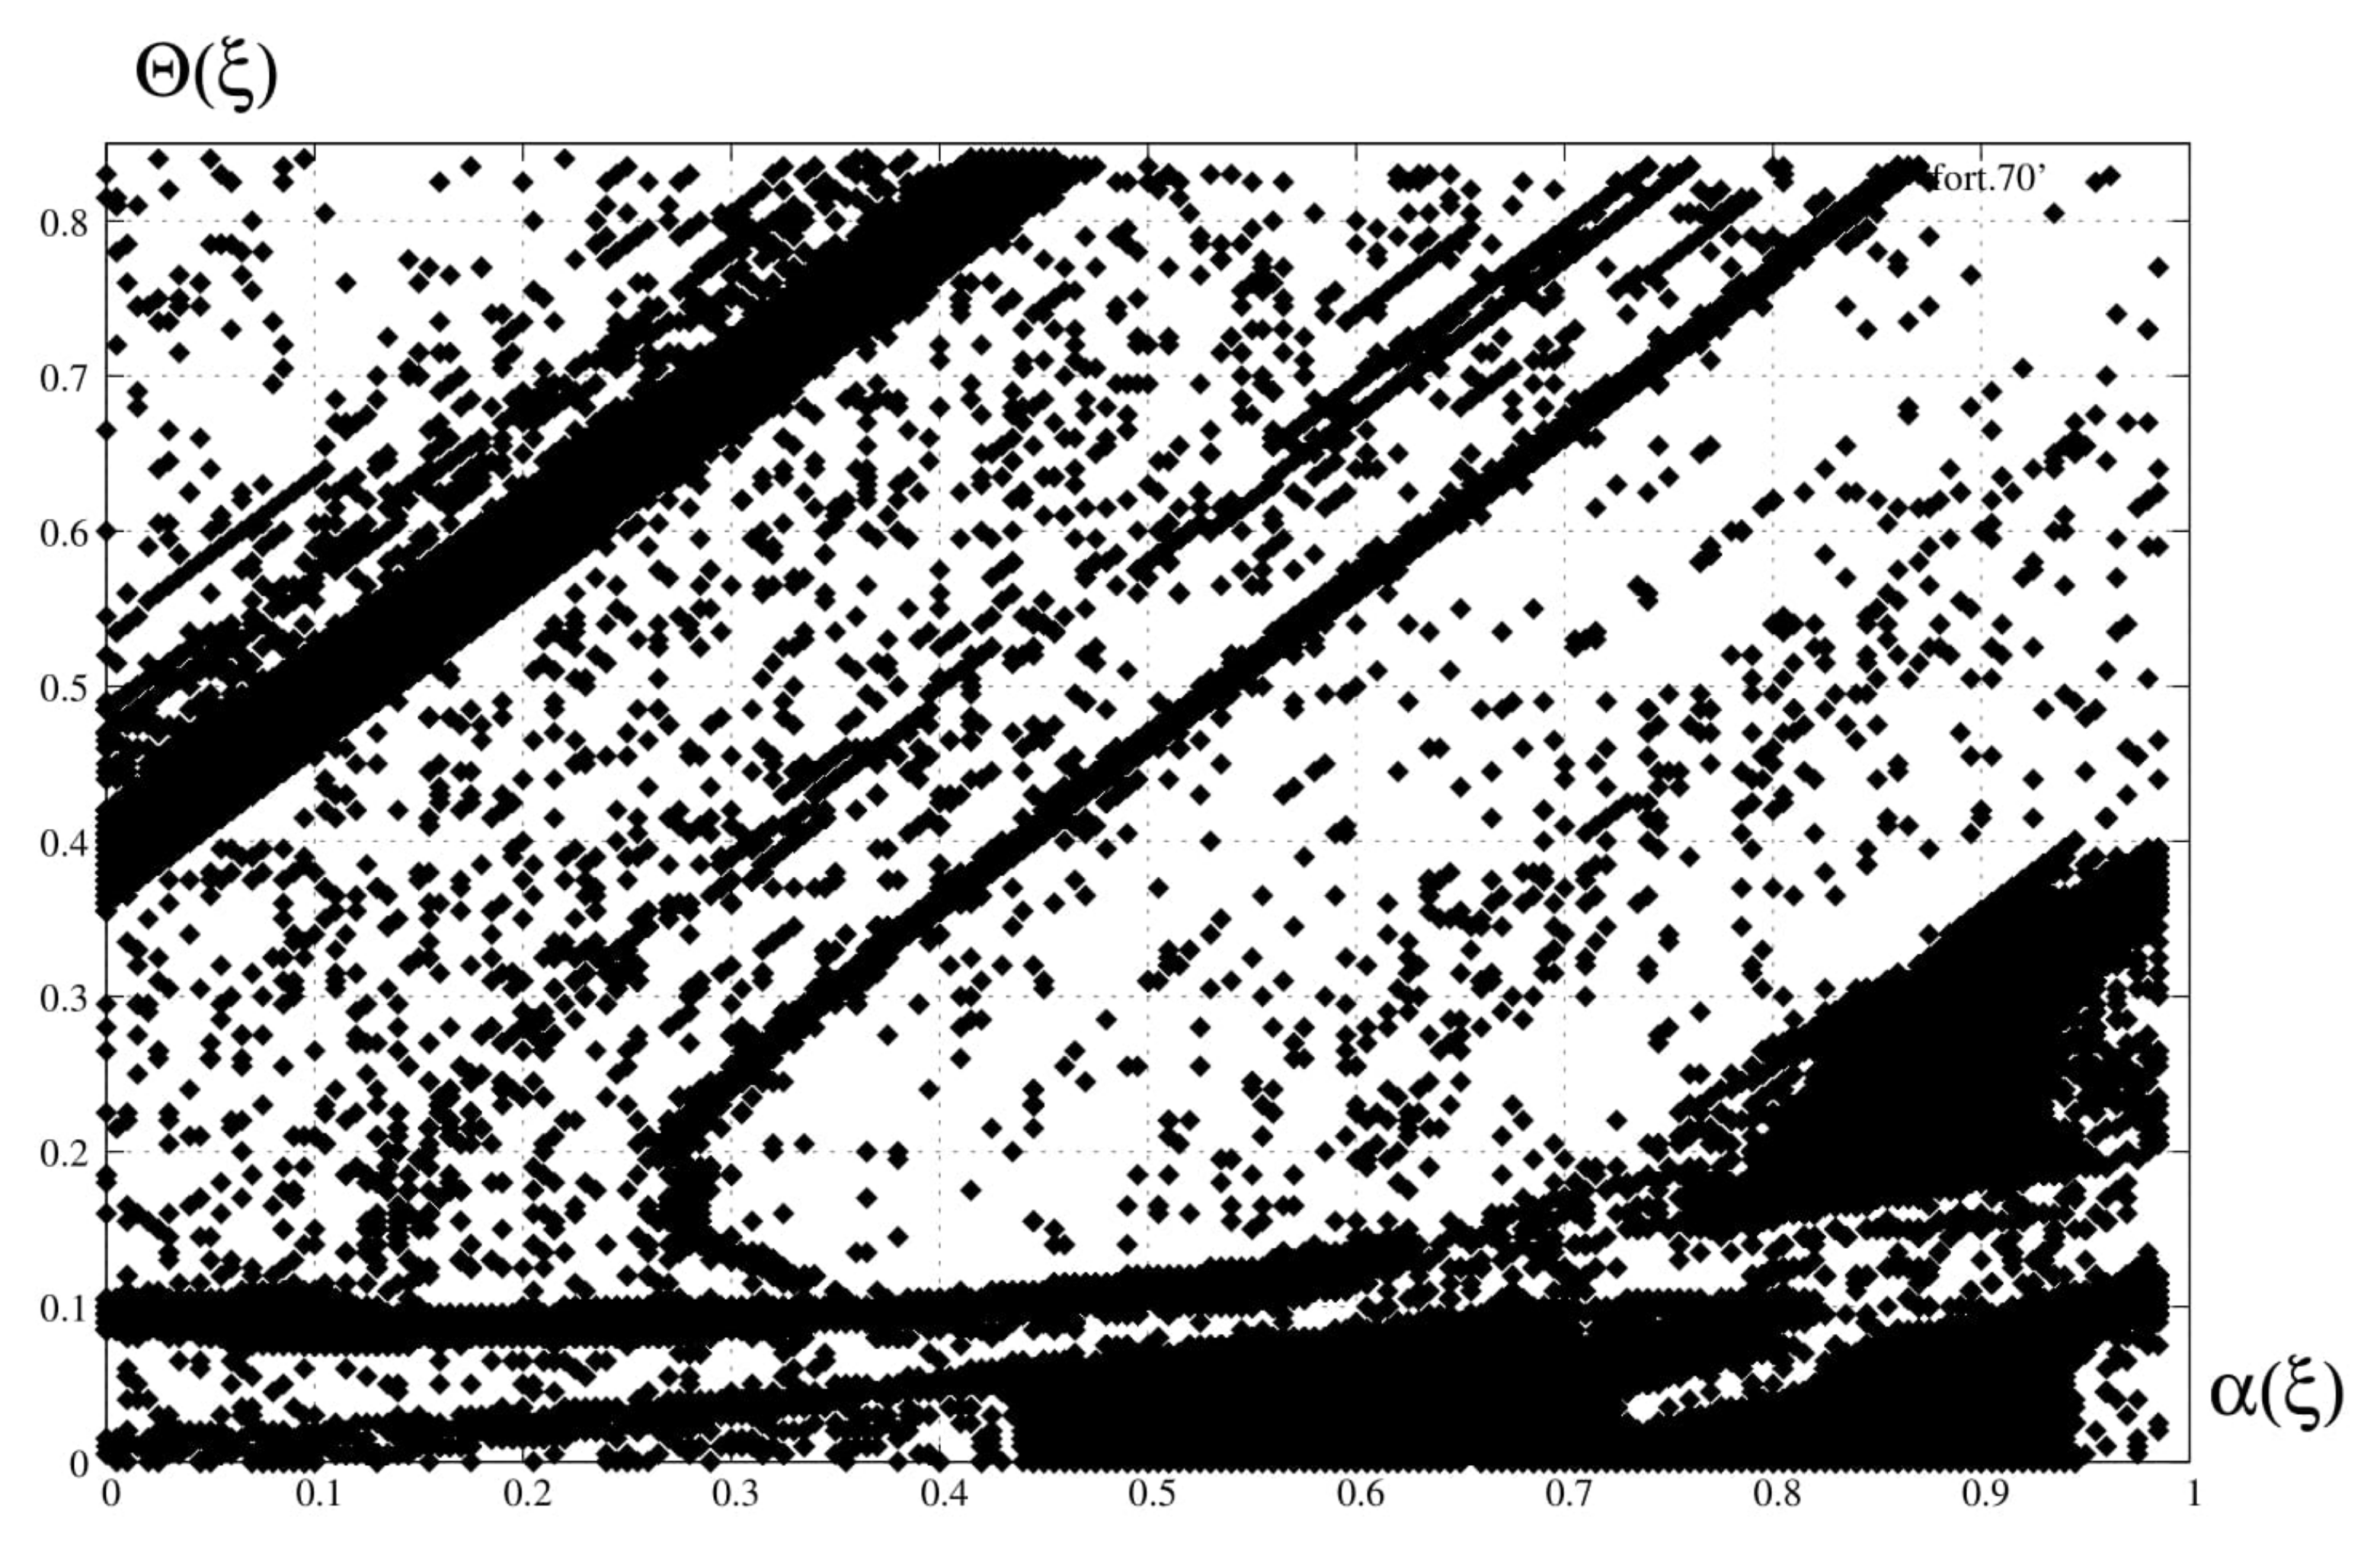
Comparing the two diagrams, it can be seen that in the latter case, chaos also occurs for τ r = 6.5 and τ r = 11 . In the first case, for τ r = 6.5 and τ r = 11 , the system generated periodic orbits. It should be remembered that the values of all system parameters in both cases are the same. In the first case (Figure 1), the diagram was obtained assuming the following initial values: α ( ξ , 0 ) = 0.9 , Θ ( ξ , 0 ) = 0.2 . In the second case (Figure 7), α ( ξ , 0 ) = 0.2 , Θ ( ξ , 0 ) = 0.1 was assumed. How sensitive the tested system is to the initial values of the variables is shown in Figure 8. It shows a map of the initial conditions determining the periodic solutions of the reactor (dots). Empty spaces determine chaotic solutions. By initial condition is meant here the state of the reactor at time zero along the entire tube length.

5. Entropy Analysis

The last method of testing the discussed reactor is the entropy analysis [24]. It allows defining the range of parameters for which the system generates the most information about itself. This can be useful in the reactor modeling stage. The concept of entropy is used here to define the amount of information contained in the system [25]. The amount of entropy in a probability distribution is known as the information content of this distribution. Information is defined in terms of the likelihood of certain events occurring in the past; the greater the earlier uncertainty of such an event, the greater the amount of information obtained when such an event occurs, which suggests that the measure would range from zero to infinity [25]. Shannon [26] was the first to derive a general formula for measuring entropy in any set of probabilities. It is written as:
E = i = 1 N p i log 2 p i .
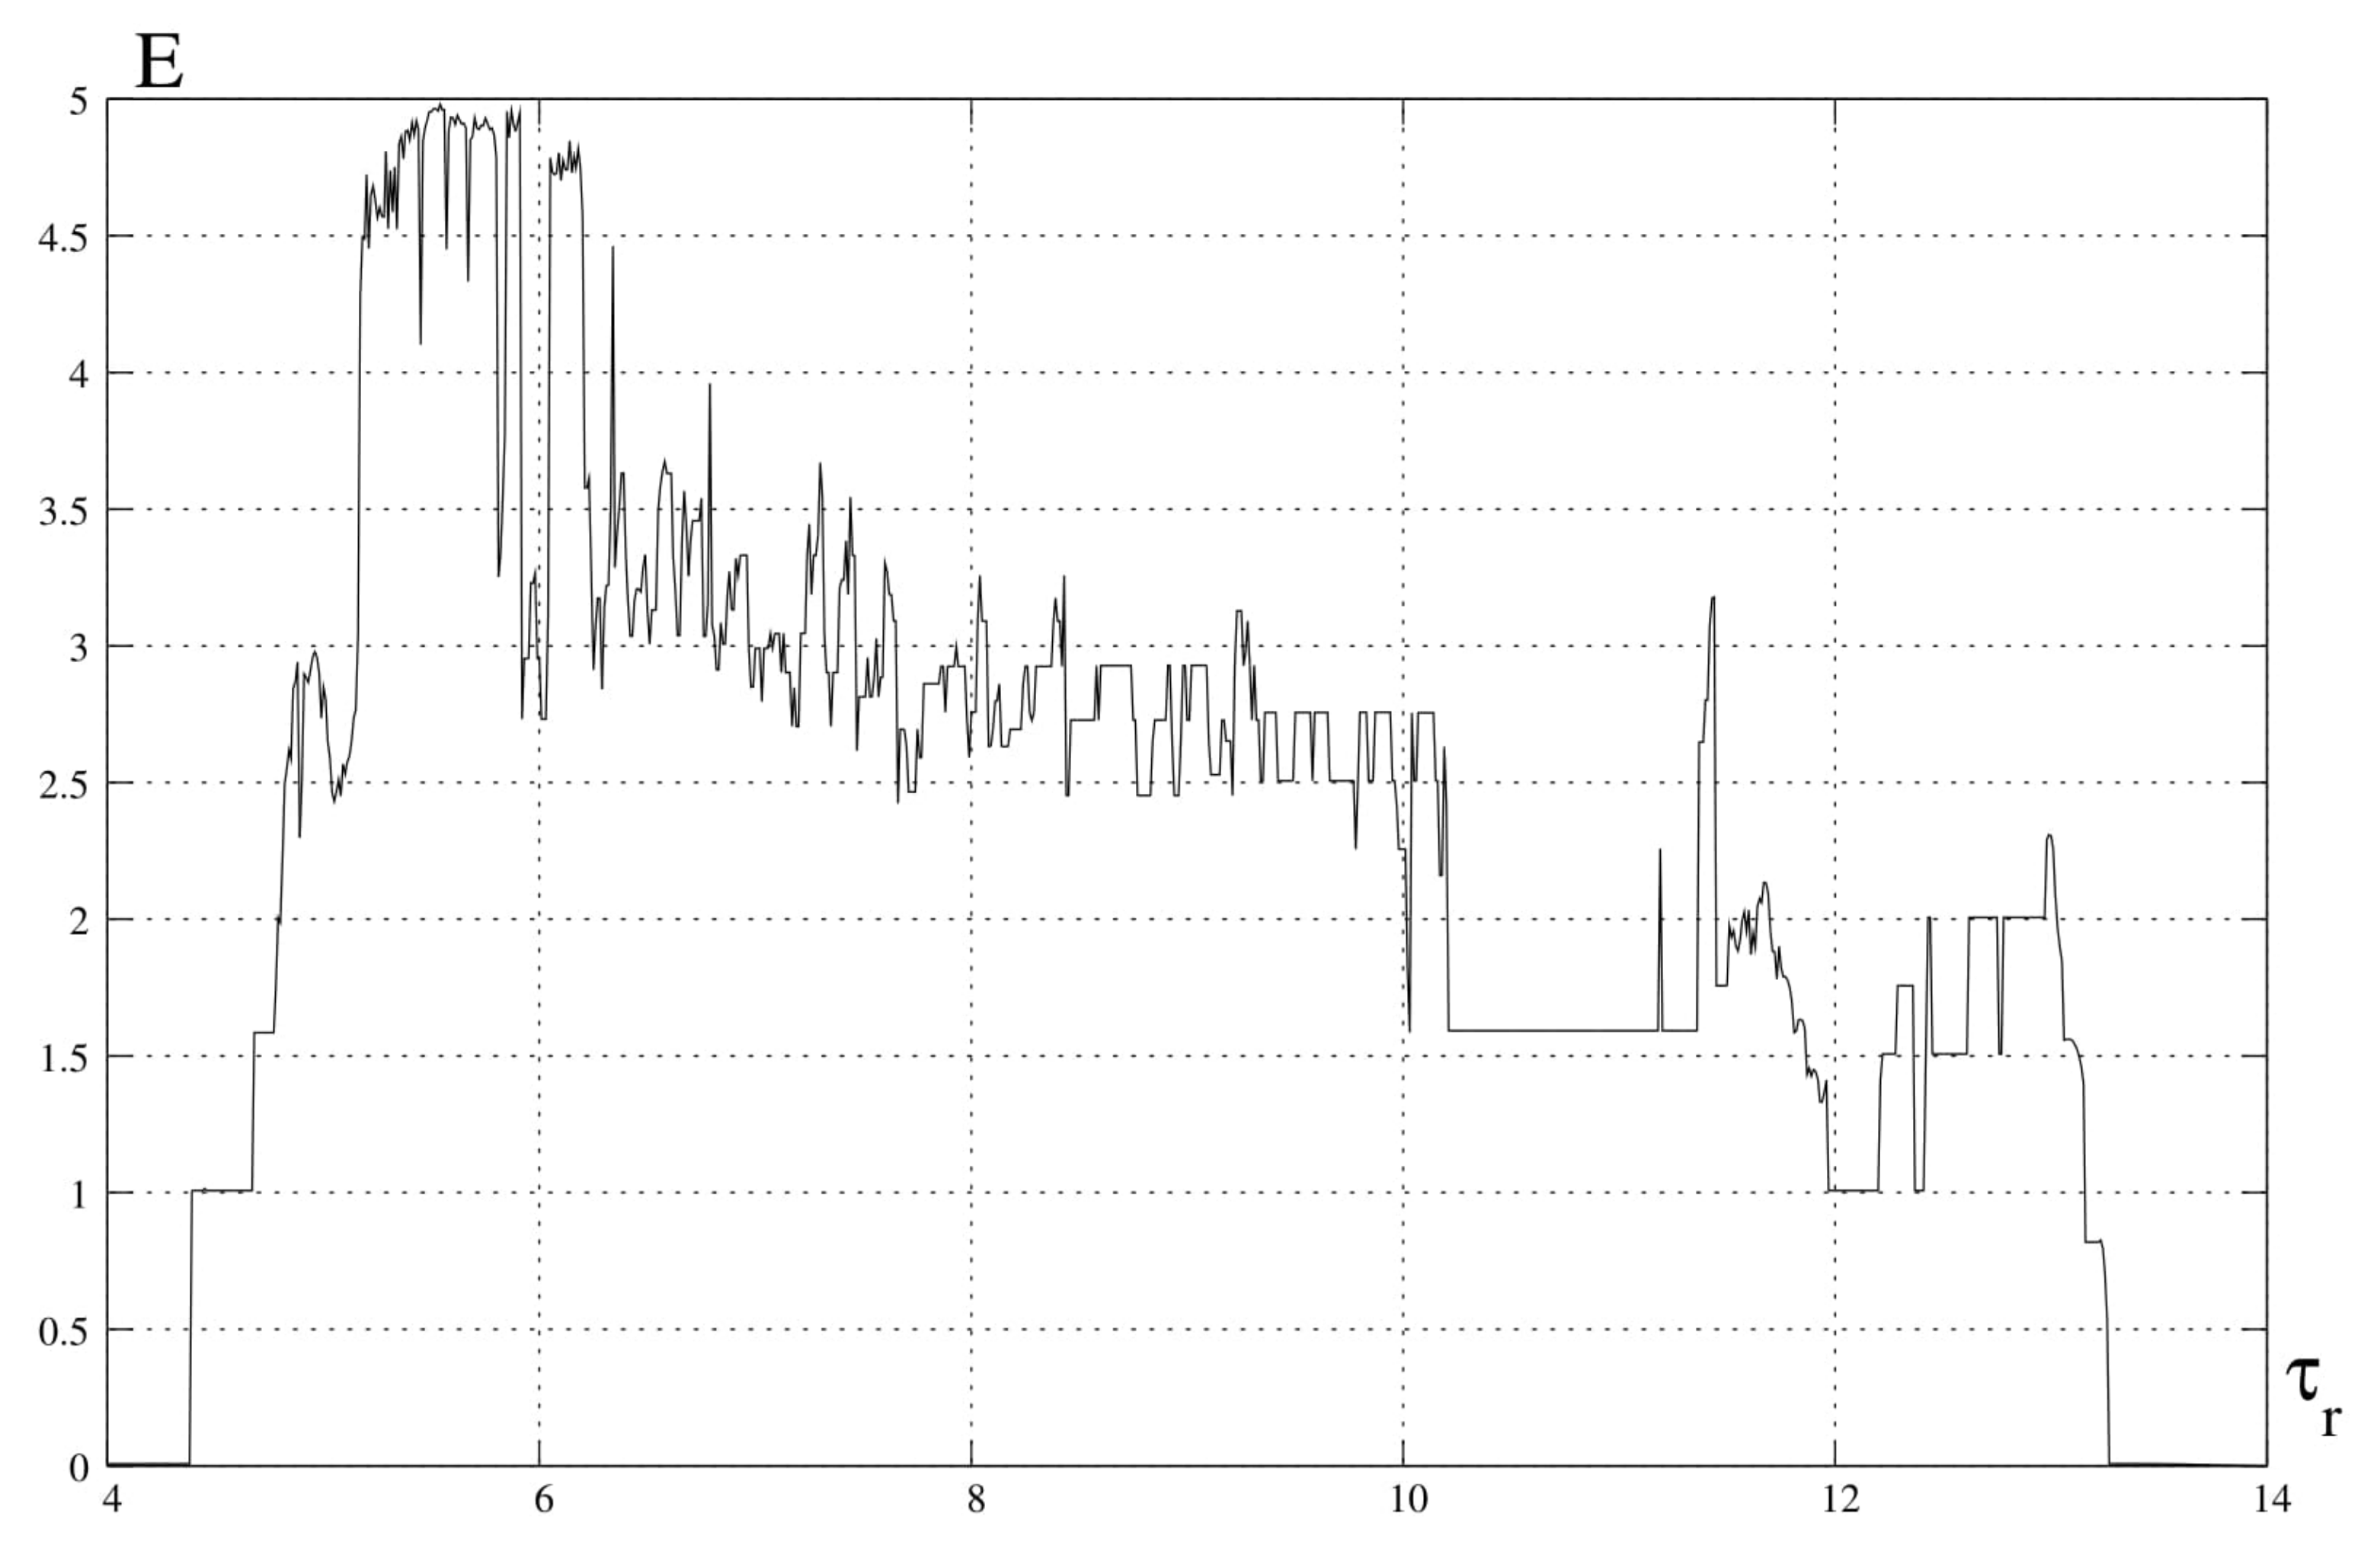
This formula indicates the amount of information about a given system generated by this system. This is called information entropy, where N is the number of samples, and p i is the probability of the i-th number in the set of samples. For stationary case E = 0 , for 1-period orbit E = 1 , for 2-period orbit E = 2 , for 3-period orbit E = 1.585 , etc. General:
E = log 2 M ,
where M is the periodicity of a given orbit. It follows that in the case of a chaotic orbit, E = . In practice, these values may be slightly different due to the accuracy of numerical calculations. It is obvious that with low computational accuracy, more than one number may fall into a given sub-interval. In such a situation, for example, when two numbers are very close to each other, they can be treated as the same value. In this case, E = 0 instead of E = 1 . In the calculations performed in this study, the variability range of α o u t was divided into 100 sub-intervals.
Figure 9 shows a diagram of information entropy as a function of switching time τ r .
The diagram above shows that the system gives the most information in the chaotic range, i.e., in the range 5.4 < τ r < 5.9 .

6. Discussion

The presented work concerns the analysis of the dynamics of a catalyst (pseudohomogenous) tubular chemical reactor with longitudinal dispersion, in which cyclic transfer of the raw material stream was used. These types of models have been studied in the scientific literature, but neither spectral nor entropy analysis was used there, which was done in this paper. The spectral analysis gives an overview of the participation of individual harmonics in the periodic and chaotic oscillations of the reactor. This information should be useful in the design of the reactor system. They allow for the elimination of chaotic oscillations in an industrial installation. In turn, the entropy analysis provides information about the model of the tested system, which may be useful at the stage of modeling this type of apparatus.
The results of the above-mentioned analyzes are presented in phase diagrams, spectral diagrams, and in the information entropy diagram. An exemplary Poincare cross-section is also shown, proving the existence of chaotic oscillations in the reactor. Since the reverse system was treated as a discrete system, the above-mentioned cross-section has the character of a Henon attractor. This discretization consists in sampling the values of the reactor variables at the moments of metastasis. In the course of numerical analyzes, it turned out that the tested system has the so-called multiple dynamic states. They are characterized by the fact that for the given values of the model parameters, the system can generate various types of oscillations (periodic or non-periodic), depending on the initial conditions of the apparatus. To illustrate this phenomenon, a map of the initial conditions of the reactor was made, on which points determining periodic oscillations were marked. The remaining fields are for chaotic oscillations.
On the basis of the obtained results, three ways of reaching chaos can be noticed. One of them is period doubling, which can be seen on the left side of Figure 1. Then, around τ r = 5.25 , there is a second way of reaching chaos, namely high amplitude chaos generation, which indicates a crisis. In turn, Figure 2 shows that for D a = 0.15 there is a third type of reaching chaos, namely through the decay of the torus into the chaotic attractor, i.e., the transition from quasiperiodic solutions to chaotic solutions. This work is purely theoretical. It does not concern the design of a specific apparatus with a specific chemical reaction. It is general in nature, and the adopted parameter values are only examples. As for practical applications with the use of our research, they should take place at the design stage of the reactor system. We have shown: 1. the possibility of certain dynamic phenomena occurring in the presented reactor system, 2: methods of studying dynamic phenomena, including chaotic oscillations.
The use, at the design stage, of the amplitude spectrum method allows, inter alia, to determine the harmonics of the system, i.e., their number, position and amplitude values of these harmonics. This allows, for example, to assess whether the given harmonics pose a process hazard. Such threats may include, for example, harmonics of high frequencies and large amplitudes. The study of the spectrum may also allow, for example, to filter out a given harmonic with a large amplitude, which may be useful, especially when one wants to achieve a high average degree of conversion. The study of the entropy of the system allows, in turn, to assess for which values of the system parameters (e.g., for which values of the switching time), this entropy is the highest. Then the system generates the most information about itself, which is included, for example, in the set of measurement results. This maximum information allows for the identification of the model of the tested object on the basis of the above-mentioned results. The analysis of bifurcation diagrams, in turn, allows the evaluation of the values of the system state variables. All this is necessary to design the system in such a way that it works stably and gives the desired process results. From this point of view, this work has unquestionably practical aspects. The “engineering” details were disclosed in Notation. As for the kinetics of the chemical reaction presented in the paper, it should be emphasized that it does not concern a specific process; it is a general exothermic reaction type A B of any order. If necessary, each time, a specific reaction can be substituted for this kinetics, and the model can be re-examined.

7. Summary

Chemical engineers, both industrial engineers and designers of reactors, must know about the existence of chaotic behavior and its properties. This behavior is difficult to find and justify analytically. Thus the chaotic regime can be found only computationally. Nevertheless, the modeling of chaotic regimes has a heuristic meaning, and chemical engineers must know about them and their possible implications.
This work shows that, first of all, complicated dynamic phenomena, including chaotic ones, may occur in the system under study. Secondly, the tendency of these phenomena is clearly shown in the relevant diagrams. For example, the diagram in Figure 1 clearly shows that chaos occurs within the limits of 4.8 < τ r < 6.2 . For other values of this parameter, there are complicated periodic oscillations, and for τ r = 13 , there are pseudo periodic oscillations. So, the conclusion is that chaos does not exist for large and small switching times! They are somewhere in the middle. This is a very practical point. The diagram in Figure 2 shows that only periodic or pseudo-periodic oscillations occur for 0.14 < D a < 0.1675 . Chaotic oscillations are in the range of 0.075 < D a < 0.13 . For D a < 0.075 and for D a > 0.1675 , there is no oscillation at all. So this is another very specific conclusion to be expected when changing the value of D a . The same is true of the spectral and entropy diagrams as mentioned above. In turn, Figure 8 shows for which initial values of state variables the system generates chaotic oscillations and for which it does not. This means that the tested system has multiple solutions. That is, for the given values of the model parameters, the state of the reactor may be different, depending only on the initial values. Since chaotic oscillations are, as a rule, unfavorable in terms of processes, the research proposed in this article allows for the selection of the system parameters to avoid these oscillations in practice On the contrary, if the designer aims to identify the model, he should select the parameters of the system so that it generates chaotic oscillations with high entropy.
The next stage of our research will be the analysis of the heterogeneous reactor model.

Author Contributions

Conceptualization, M.B. and N.K.; methodology, M.B. and N.K.; formal analysis, M.B. and N.K.; writing—original draft preparation, M.B. and M.L.; writing—review and editing, M.B and M.L. All authors have read and agreed to the published version of the manuscript.

Funding

This research received no external funding.

Data Availability Statement

Not applicable.

Conflicts of Interest

The authors declare no conflict of interest.

Abbreviations

Symbols
c p heat capacity, kJ/(kg K)
C A concentration of component A, kmol/m 3
D a Damköhler number = V r ( r 0 ) F ˙ C 0
Eactivation energy, kJ/kmol
F ˙ volumetric flow rate, m 3 /s
( Δ H ) heat of reaction, kJ/kmol
kreaction rate constant, (m 3 /kmol) m 1 /s
Llength, m
L e Lewis number, 1 + ρ s c p s ρ c p
morder of reaction
P e Peclet number
( r ) rate of reaction, ( = k C m ) , kmol/(m 3 s)
Rgas constant, kJ/(kmol K)
ttime, s
Ttemperature, K
Vvolume, m 3
zposition, m
Greek letters
α degree of conversion = C A 0 C A C A 0
β dimensionless number related to adiabatic temperature increase = ( Δ H ) C A 0 T 0 ρ c p
γ dimensionless number related to activation energy = E R T 0
δ dimensionless heat exchange coefficient = A q k q ρ c p F ˙
Θ dimensionless temperature = T T 0 T 0
ξ dimensionless position, = z L
ρ density, = kg m 3
τ dimensionless time, = F ˙ V R t
Subscripts
0refers to feed
Hrefers to heat
Mrefers to mass
o u t output of system
rrefers to reverse flow; switching times
Rrefers to reactor
srefers to solid phase

References

  1. Aubé, F.; Sapoundjiev, H. Mathematical model and numerical simulations of catalytic flow reversal reactors for industrial applications. Comput. Chem. Eng. 2000, 24, 2623–2632. [Google Scholar] [CrossRef]
  2. Berezowski, M. Fractal solutions of recirculation tubular chemical reactors. Chaos Solitons Fractals 2003, 16, 1–12. [Google Scholar] [CrossRef] [Green Version]
  3. Berezowski, M. Spatio-temporal chaos in tubular chemical reactors with the recycle of mass. Chaos Solitons Fractals 2000, 11, 1197–1204. [Google Scholar] [CrossRef]
  4. Berezowski, M.; Kulik, B. Periodicity of chaotic solutions of the model of thermally coupled cascades of chemical tank reactors with flow reversal. Chaos Solitons Fractals 2009, 40, 331–336. [Google Scholar] [CrossRef] [Green Version]
  5. Elnashaie, S.; Abashar, M. On the chaotic behaviour of forced fluidized bed catalytic reactors. Chaos Solitons Fractals 1995, 5, 797–831. [Google Scholar] [CrossRef]
  6. Femat, R.; Méndez-Acosta, H.; Steyer, J.; González-Alvarez, V. Temperature oscillations in a biological reactor with recycle. Chaos Solitons Fractals 2004, 19, 875–889. [Google Scholar] [CrossRef]
  7. Khinast, J.; Luss, D. Mapping regions with different bifurcation diagrams of a reverse-flow reactor. AIChE J. 1997, 43, 2034–2047. [Google Scholar] [CrossRef]
  8. Khinast, J.; Gurumoothy, A.; Luss, D. Complex Dynamic Features of a Cooled Reverse-Flow Reactor. AIChE J. 1998, 44, 1128–1140. [Google Scholar] [CrossRef]
  9. Matros, Y.S.; Bunimovich, G.A. Reverse-Flow Operation in Fixed Bed Catalytic Reactors. Catal. Rev. 1996, 38, 1–68. [Google Scholar] [CrossRef]
  10. Merta, H. Characteristic time series and operation region of the system of two tank reactors (CSTR) with variable division of recirculation stream. Chaos Solitons Fractals 2006, 27, 279–285. [Google Scholar] [CrossRef]
  11. Merta, H.; Pelka, R. Chaotic dynamics of a cascade of plug flow tubular reactors (PFTRs) with division of recirculating stream. Chaos Solitons Fractals 2005, 23, 1211–1219. [Google Scholar] [CrossRef]
  12. Řeháček, J.; Kubíček, M.; Marek, M. Periodic, quasiperiodic and chaotic spatiotemporal patterns in a tubular catalytic reactor with periodic flow reversal. Comput. Chem. Eng. 1998, 22, 283–297. [Google Scholar] [CrossRef]
  13. Russo, L.; Altimari, P.; Mancusi, E.; Maffettone, P.L.; Crescitelli, S. Complex dynamics and spatio-temporal patterns in a network of three distributed chemical reactors with periodical feed switching. Chaos Solitons Fractals 2006, 28, 682–706. [Google Scholar] [CrossRef]
  14. Russo, L.; Mancusi, E.; Maffettone, P.L.; Crescitelli, S. Symmetry properties and bifurcation analysis of a class of periodically forced chemical reactors. Chem. Eng. Sci. 2002, 57, 5065–5082. [Google Scholar] [CrossRef]
  15. Salinger, A.G.; Eigenberger, G. The direct calculation of periodic states of the reverse flow reactior—I. Methodology and propane combustion results. Chem. Eng. Sci. 1996, 51, 4903–4913. [Google Scholar] [CrossRef]
  16. Salinger, A.G.; Eigenberger, G. The direct calculation of periodic states of the reverse flow reactor—II. Multiplicity and instability. Chem. Eng. Sci. 1996, 51, 4915–4922. [Google Scholar] [CrossRef]
  17. Żukowski, W.; Berezowski, M. Generation of chaotic oscillations in a system with flow reversal. Chem. Eng. Sci. 2000, 55, 339–343. [Google Scholar] [CrossRef]
  18. Wibowo, R.B.E.; Suzuki, T.; Takahashi, R. A Mathematical Study on the System of Partial Differential Equations Describing Reverse-Flow Reactor. Math. Model. Anal. 2016, 21, 550–568. [Google Scholar] [CrossRef] [Green Version]
  19. Ray, W.; Marek, M.; Elnashaie, S. The effect of heat and mass dispersion on tubular reactor performance. Chem. Eng. Sci. 1972, 27, 1527–1536. [Google Scholar] [CrossRef]
  20. Di Sarli, V.; Marra, F.S.; Di Benedetto, A. Spontaneous Oscillations in Lean Premixed Combustors: CFD Simulation. Combust. Sci. Technol. 2007, 179, 2335–2359. [Google Scholar] [CrossRef]
  21. Di Sarli, V.; Di Benedetto, A.; Marra, F.S. Influence of system parameters on the dynamic behaviour of an LPM combustor: Bifurcation analysis through CFD simulations. Combust. Theory Model. 2008, 12, 1109–1124. [Google Scholar] [CrossRef]
  22. Garcia-Agreda, A.; Di Sarli, V.; Di Benedetto, A. Bifurcation analysis of the effect of hydrogen addition on the dynamic behavior of lean premixed pre-vaporized ethanol combustion. Int. J. Hydrogen Energy 2012, 37, 6922–6932. [Google Scholar] [CrossRef]
  23. Berezowski, M. Crisis phenomenon in a chemical reactor with recycle. Chem. Eng. Sci. 2013, 101, 451–453. [Google Scholar] [CrossRef]
  24. Bizon, K.; Continillo, G.; Berezowski, M.; Smuła-Ostaszewska, J. Optimal model reduction by empirical spectral methods via sampling of chaotic orbits. Phys. D Nonlinear Phenom. 2012, 241, 1441–1449. [Google Scholar] [CrossRef]
  25. Batty, M. Spatial Entropy. Geogr. Anal. 1974, 6, 1–31. [Google Scholar] [CrossRef]
  26. Shannon, C.E. A Mathematical Theory of Communication. Bell Syst. Tech. J. 1948, 27, 379–423. [Google Scholar] [CrossRef] [Green Version]
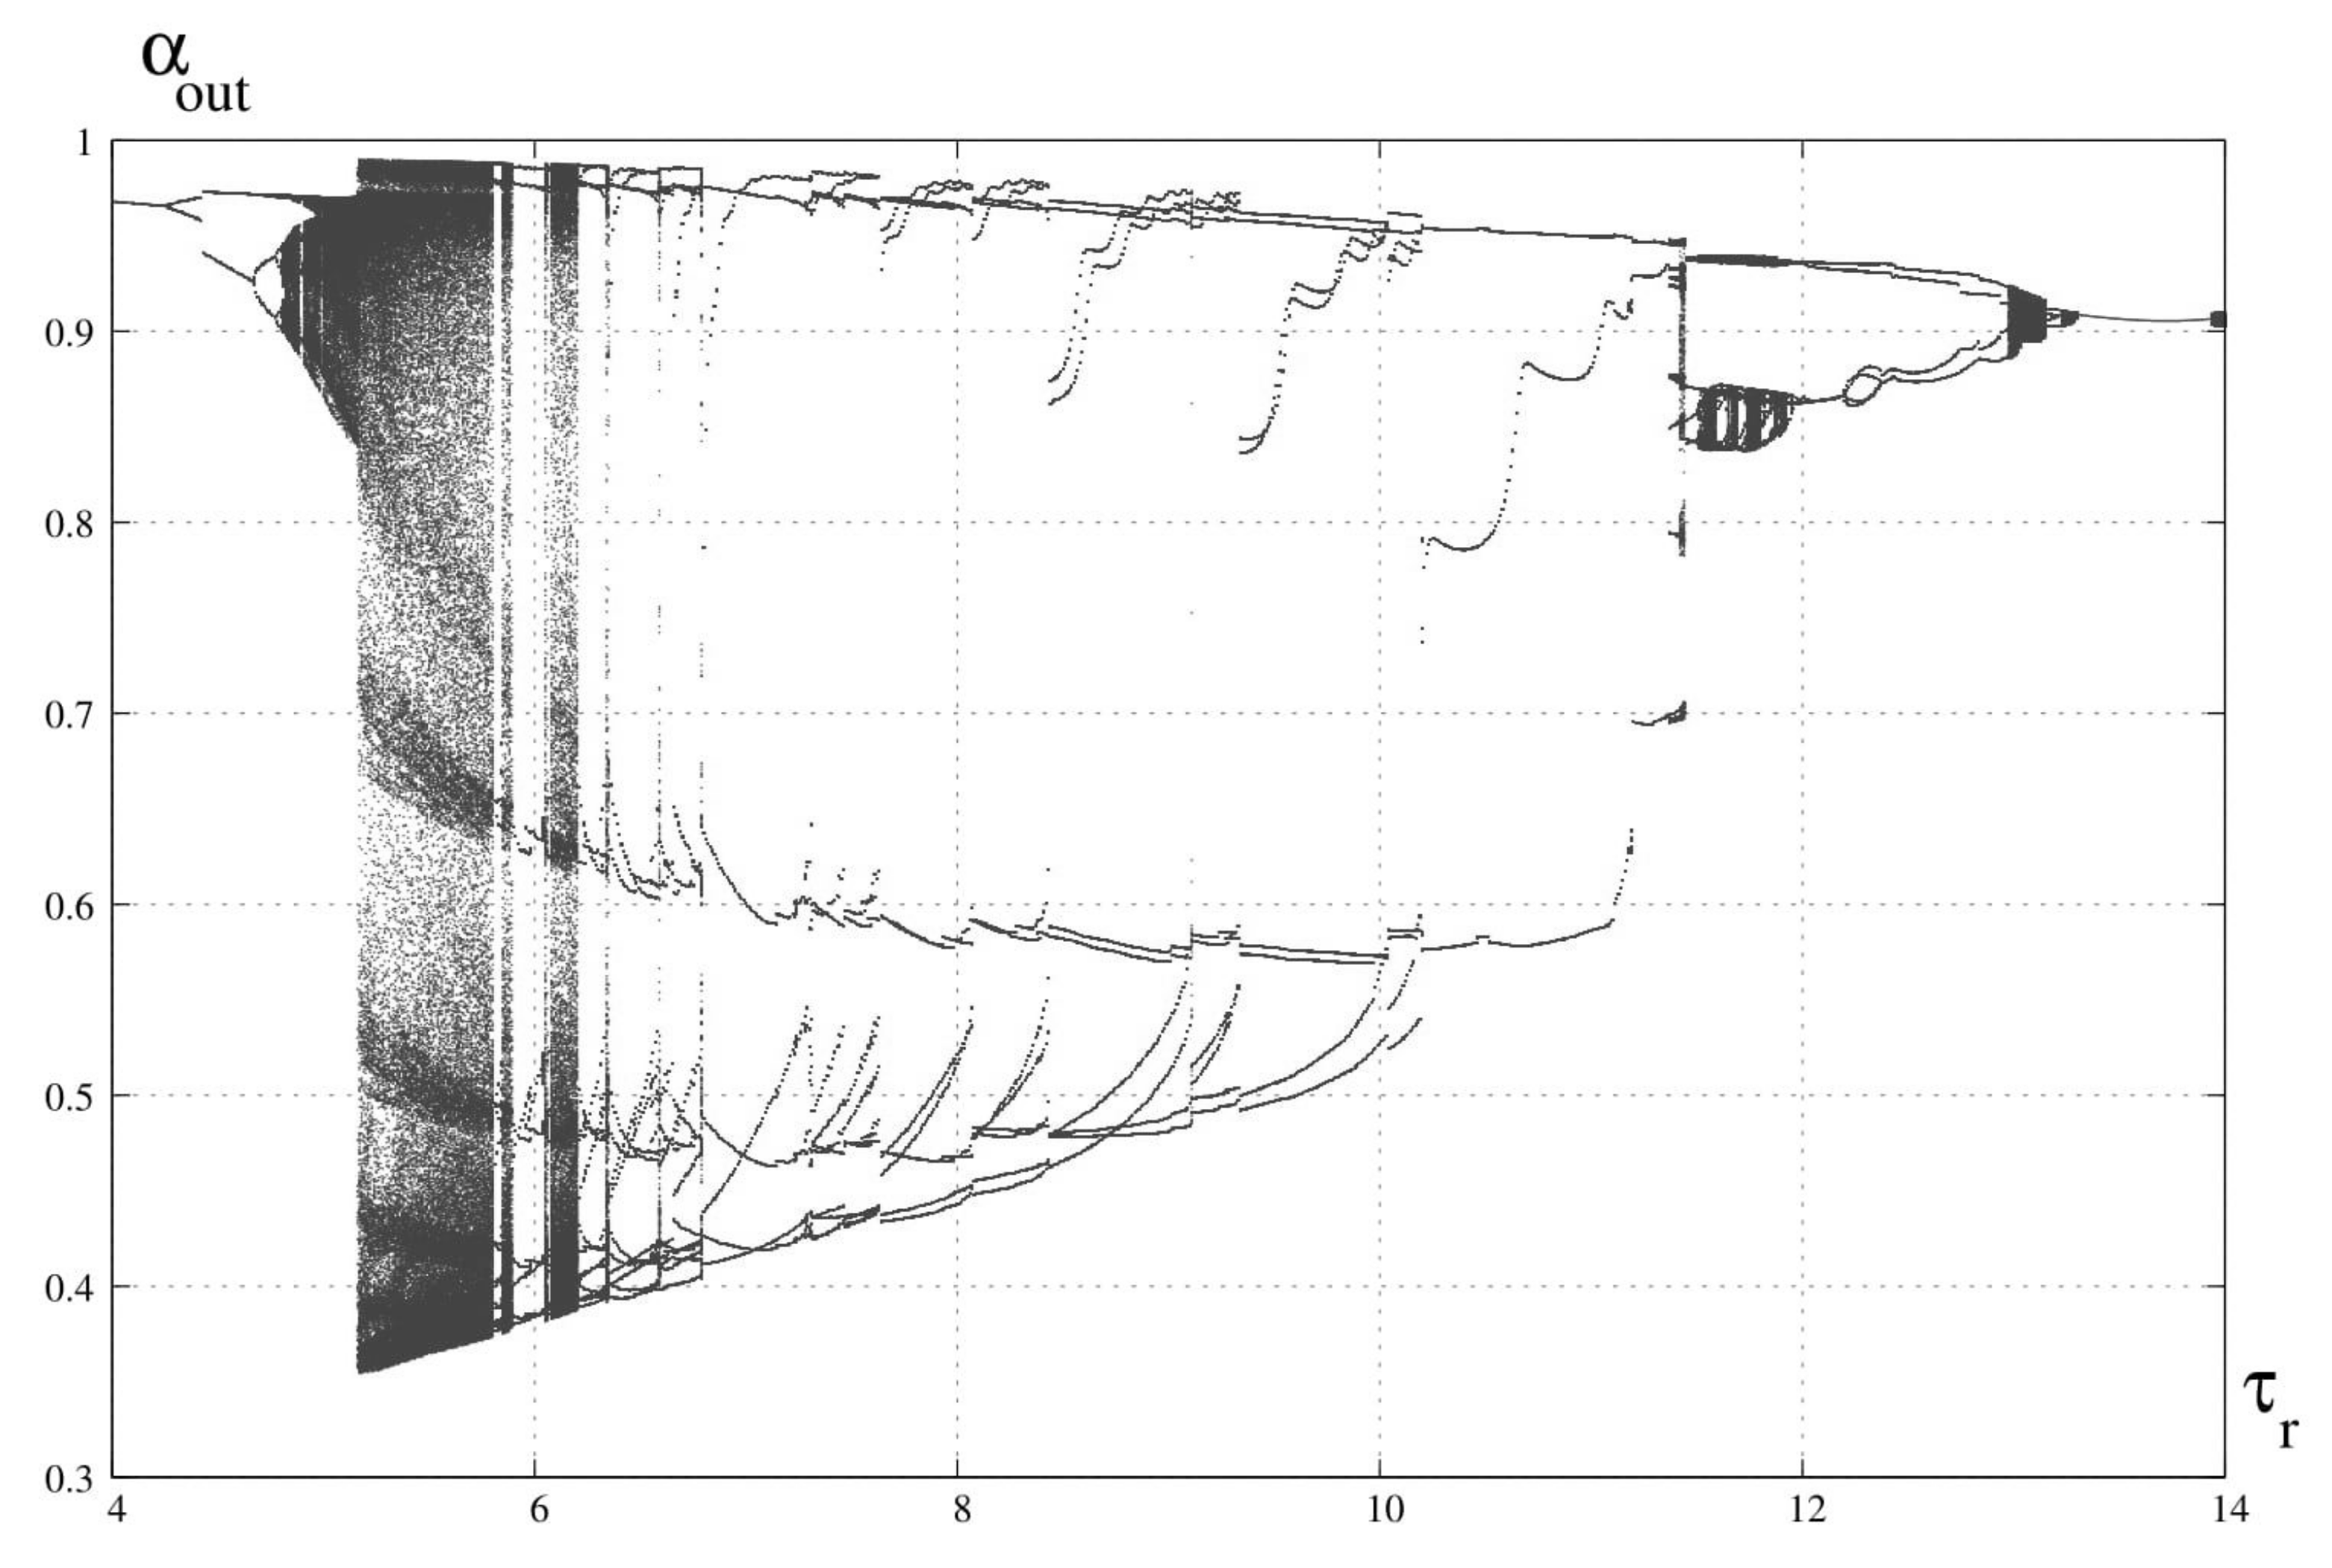
Figure 1. Bifurcation diagram for D a = 0.13 .
Catalysts 12 00037 g001
Figure 2. Bifurcation diagram for τ r = 5.5 .
Catalysts 12 00037 g002
Figure 3. Diagram of the harmonics of the amplitude spectrum for D a = 0.13 .
Catalysts 12 00037 g003
Figure 4. Harmonics of the amplitude spectrum for D a = 0.13 and τ r = 5.5 .
Catalysts 12 00037 g004
Figure 5. Harmonics of the amplitude spectrum for D a = 0.13 and τ r = 6.5 .
Catalysts 12 00037 g005
Figure 6. Poincare cross-section for D a = 0.13 and τ r = 5.5 .
Catalysts 12 00037 g006
Figure 7. Bifurcation diagram for D a = 0.13 .
Catalysts 12 00037 g007
Figure 8. Map of periodic and chaotic solutions.
Catalysts 12 00037 g008
Figure 9. Diagram of information entropy for D a = 0.13 .
Catalysts 12 00037 g009
Publisher’s Note: MDPI stays neutral with regard to jurisdictional claims in published maps and institutional affiliations.